2010 final results presentation - hld.com
TRANSCRIPT

2010 Final Results – 17 March 2011
2010 Final Results Presentation 17 March 2011
Henderson Metropolitan, Shanghai
Located right at the start of the Nanjing Road East pedestrian avenue near the Bund, the office-cum-retail building embodying the principles of growth and change in its sweeping arcs and flowing lines has become a new landmark in the Puxi area.
(Hong Kong stock code: 12)

2010 Final Results – 17 March 2011
Disclaimer
This presentation has been prepared by Henderson Land Development Company Limited (the “Company”) solely for information purposes and does not constitute an offer, recommendation or invitation to subscribe for or purchase any securities and nothing contained herein shall form the basis of any contract or commitment whatsoever.
The information contained in this presentation has been taken from sources deemed reliable by the Company. However, no representation or warranty (express or implied) is given as to the accuracy or completeness of the information contained herein and none of the Company and/or its affiliated companies and/or their respective employees and/or agents accepts any responsibility or liability as to, or in relation to, the accuracy or completeness of the information and opinions contained in this presentation or as to any information contained in this presentation remaining unchanged after the issue thereof.
This presentation contains forward-looking statements. Statements that are not historical facts, including statements about the Company’s beliefs and expectations are forward-looking statements. These statements are based on current plans, estimates and projections, and therefore you should not place undue reliance on them. Forward-looking statements speak only as of the date they are made, and the Company undertakes no obligation to update, modify or amend this presentation or to otherwise notify the recipient if any information, opinion, projection, forecast or estimate set forth herein, changes or subsequently becomes inaccurate. Forward-looking statements involve inherent risks, uncertainties and assumptions. The Company cautions you that if these risks or uncertainties ever materialise or the assumptions prove incorrect, or if a number of important factors occur or do not occur, the Company’s actual results may differ materially from those expressed or implied in any forward-looking statement.
You acknowledge and agree that the Company and/or its affiliated companies and/or their respective employees and/or agents has/have no responsibility or liability (express or implied) whatsoever and howsoever arising (including, without limitation for any claim, proceedings, action, suits, losses, expenses, damages or costs) which may be brought against or suffered by any person as a result of acting in reliance upon the whole or any part of the contents of this presentation and neither the Company, its affiliated companies nor their respective employees or agents accepts any liability for any error, omission or misstatement, negligent or otherwise, in this presentation and any liability in respect of the presentation or any inaccuracy therein or omission therefrom which might otherwise arise is hereby expressly disclaimed.
- 1 -
2010 Final Results – 17 March 2011
Poised for Growth
- 2 -

2010 Final Results – 17 March 2011
2010 Final Results Highlights
� Underlying profit attributable to Shareholders for 2010: HK$5,042 million 9% y-o-y
� Reported profit attributable to Shareholders for 2010: HK$15,820 million 11% y-o-y
� Earnings per share
• Based on underlying profit: HK$2.33 8% y-o-y
• Based on reported profit: HK$7.32 10% y-o-y
� Dividends per share: HK$1.00(HK$1.30 for the 18-month period ended 31 December 2009)
- 3 -
2010 Final Results – 17 March 2011
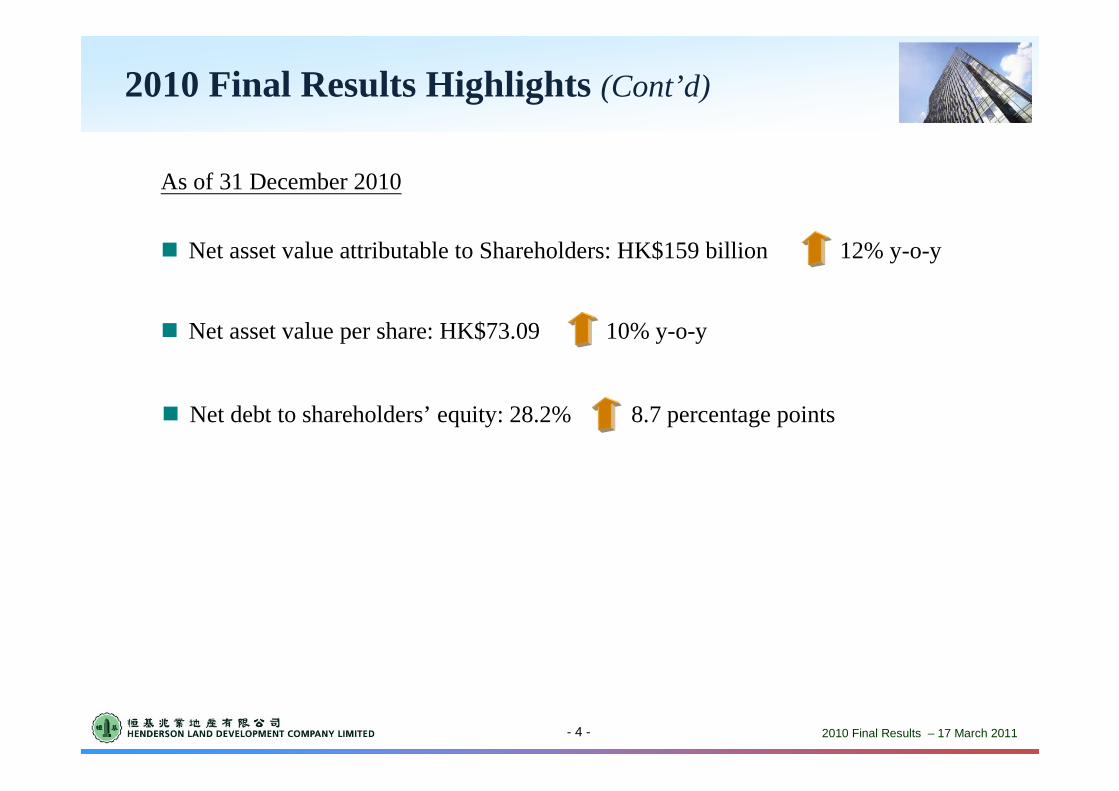
� Net debt to shareholders’ equity: 28.2% 8.7 percentage points
2010 Final Results Highlights (Cont’d)
� Net asset value per share: HK$73.09 10% y-o-y
� Net asset value attributable to Shareholders: HK$159 billion 12% y-o-y
As of 31 December 2010
- 4 -

2010 Final Results – 17 March 2011
2010 Final Results Highlights (Cont’d)
� Revenue and profit contribution from property sales*
HK$ Million For the year
ended 31 December 2010
For the 12-month period ended
31 December 2009Change
Revenue � Before taking into account the effect of cancelled transactions
� After taking into account the effect of cancelled transactions
5,7263,560
6,366
5,405
10%34%
Pre-tax profit contribution � Before taking into account the effect of cancelled transactions
� After taking into account the effect of cancelled transactions
1,573 539
2,386
2,056
34%74%
� Net rental income*: HK$3,382 million 10% y-o-y
*All the figures represent the Group’s attributable share of contributions from its subsidiaries, associates and JCEs in Hong Kong and mainland China.
- 5 -
• Attributable property sales in mainland China for 2010*: HK$303 million
• Attributable amount of properties pre-sold in mainland China for 2010*: HK$994 million
Property GFA
(sq. ft.)Saleable Area
(sq. ft.)Purchase Price
(HK$)Approximate ASP in GFA
(HK$ per sq. ft.)
Headland Road, House No. 11 13,033 11,685 660,000,000 50,641
Headland Road, House No. 12A 10,093 8,694 478,000,000 47,360
39 Conduit Road, Unit B on Level 61 5,636 4,318 338,160,000 60,000
• Key transactions of property sales in Hong Kong

2010 Final Results – 17 March 2011
Mainland China
Property development
business
Strategic investments
Property investment
business
Hong Kong
� Property development business – consistent track record of development profit with large reserve of agricultural land in Hong Kong and sizeable development land bank in mainland China;
� Property investment business – stable rental income from investment property portfolio; and
� Strategic investments – steady revenue stream in form of share of profits from the three listed associates, in particular The Hong Kong and China Gas Company Limited
Diversified Business Mix: Three Pillars
- 6 -

2010 Final Results – 17 March 2011
Renewed Vigour in Property Development
� Sizeable expansion of land-bank
� Low-risk approach to land-banking
� Quality products with emphasis on sustainability
� A much shorter time to market
� Policy to sustain the foregoing efforts on a long-term basis
- 7 -

2010 Final Results – 17 March 2011
Sizeable Expansion of Land-bank
0 1,000 2,000 3,000 4,000 5,000 6,000
below 80%
80% or above
100%(321,434 sq. ft.)
(1,454,105 sq. ft.)
(5,472,970 sq. ft.)
Expected Attributable GFA for Future Redevelopment (‘000 sq. ft.)
Ownership Acquired
6 projects
17 projects
Progress of Old Building Acquisitions in Urban Areas
45 projects
� Urban Areas in Hong Kong
• 23 old building projects with 80% ownership or above
• Acquisition of another 45 projects in progress
• Total of 68 projects providing total attributable GFA of ~7.3 million sq. ft. for redevelopment on completion of acquisition
• Additionally 9 existing projects under planning for redevelopment with attributable GFA of ~1.84 million sq. ft.
- 8 -

2010 Final Results – 17 March 2011
Sizeable Expansion of Land-bank (Cont’d)
� Suburban Areas in Hong Kong
• Total GFA of 2.6 million sq. ft. from conversion of two farmland sites at Wu Kai Sha and Tai Tong Road currently under construction
(million sq. ft.) Land AreaPreliminary est.
attributable GFA
North East New Territories New Development Areas 5.1 9.0
Hung Shui Kiu New Development Area 4.0 8.0
Total: 9.1 17.0
• Agricultural land reserve increased to 40.6 million sq. ft. in site area, the largest holding in Hong Kong
• Included in such agricultural land reserve are sites in “North East New Territories New Development Areas” and “Hung Shui Kiu New Development Area” as designated by the Government
- 9 -
• Terms (except land premium) for conversion of the wetland restoration and residential project in Wo Shang Wai with attributable GFA of 895,000 sq. ft. have been agreed

2010 Final Results – 17 March 2011
Sizeable Expansion of Land-bank (Cont’d)
� Ample Land Resources in Mainland China
• Land-bank with total attributable GFA of 150.4 million sq. ft.
• Residential projects mainly in second-tier and third-tier cities with strong end-user demand
• More than 10 projects ready for sale/ pre-sale in 2011
- 10 -
City Project name and location HLD’s interest
Changsha Phase 1B, Arch of Triumph (恒基‧凱旋門), Xingsha Town 99%
Chongqing Phase 1 & 2A, Grand Waterfront (翔龍江畔城), Nan An District
Phase 1 & 2, Villa Green (恒基‧翠庭) in Erlang Phoenix Area, Gaoxin District
100%
100%
Nanjing Phase 1, Emerald Valley (玲瓏翠谷), Xianling New District
Treasure Garden (金滿庭), Qixia District
100%
90.1%
Shenyang Phase 1B & 2A, Puhe New District Development (金河灣) 100%
Suzhou Phase 1, Riverside Park (水漾花城), Xiangcheng District 100%
Xuzhou Phase 1, Xuzhou Lakeview Development (恒基‧雍景新城), Dalong Lake Area 100%
Xian Phase 1B, 2A & 3A, La Botanica (御錦城)
Phase 1B, Palatial Crest (恒基‧碧翠錦華) on Jin Hua North Road
50%
100%
Yixing Island Palace (譽瓏島), on an island of Yixing
Grand Lakeview (譽瓏湖濱), Dongjiu District
100%
100%

2010 Final Results – 17 March 2011
Low-risk Approach to Land-banking
� Urban Areas: average land cost less than HK$4,000 per sq. ft.
• Est. acquisition costs for 23 old building projects with 80% ownership or above: ~HK$7 billion or HK$3,923 per sq. ft. of GFA
� Suburban Areas: ~HK$2,300 – HK$3,500 per sq. ft.
• Total land cost* of Wu Kai Sha project: HK$3,509 per sq. ft. of GFA
• Total land cost* of Tai Tong Road project: HK$2,291 per sq. ft. of GFA
* “Total land cost” refers to the sum of cost of farmland and land premium
In Hong Kong
Acquisition cost of old buildings and premium for farmland conversion compare favourably with transacted prices of land sites at public auctions, generating a higher profit margin
- 11 -

2010 Final Results – 17 March 2011
A Much Shorter Time to Market
� Urban redevelopment projects offer flexibility in sale/ pre-sale schedule
• A redevelopment project with no conversion into other purposes is not subject to the Consent Scheme (Note 1)
• Completion of a redevelopment is expected to occur, on average, in the second year after the year of pre-sale
� Sizeable pre-sale schedule in Hong Kong for the coming years
- 12 -
0.890.89−−−Wo Shang Wai project (Note 4)
1.67−1.230.44−Wu Kai Sha project (Note 2)
1.02−−1.02−Tai Tong Road project (Note 3)
1.841.84−−−Existing urban redevelopment projects
8.892.842.272.021.76Total
1.780.111.040.560.07Newly acquired 23 old building projects
1.69−−−1.69Stock & projects pending sales
Total 2014 or onwards201320122011Attributable GFA (million sq. ft.)
1. As administered by the Government relating to pre-sale of uncompleted first-hand residential units.
2. Wu Kai Sha project will be completed in phases and phase 1 is scheduled for completion in 4Q 2012.
3. Upon successful land-use conversion of Tai Tong Road project’s adjacent land-lot, the total attributable GFA of the entire project will be enlarged from 0.93 million sq. ft. to 1.02 million sq. ft. with scheduled completion by the end of 2012.
4. Terms (except land premium) for conversion of the wetland restoration and residential project in Wo Shang Wai have been agreed.
Notes:

2010 Final Results – 17 March 2011
Quality Products with Emphasis on Sustainability
� A number of projects, such as Grand Promenade, 39 Conduit Road, One ifc and Two ifc, have obtained top honours under HK-BEAM
� World Financial Centre in Beijing became the first project in Beijing to achieve the highest possible rating of “Platinum” under globally-recognized LEED
� A number of quality buildings such as Manulife Financial Centre are in the process of applying for certifications under HK-BEAM
� Henderson Metropolitan in Shanghai is built to the highest construction and environmental standards under LEED and HK-BEAM
In Hong Kong
In Mainland China
Energy-efficient and sustainable features recommended by LEED and HK-BEAM Plus have been integrated into the design of the Group’s new developments
- 13 -
“HK-BEAM” refers to Hong Kong Building Environmental Assessment Method
“LEED” refers to Leadership in Energy and Environmental Design
Notes:
� Named “CCTV Annual Famous Brand in China 2010” by a panel of leading media

2010 Final Results – 17 March 2011
Policy to Sustain the Foregoing Efforts on a Long-term Basis
� Intensify efforts in expanding land-bank and expediting sales programme
� Well-established land-banking approach in Hong Kong has built a solid foundation for development on a sustainable basis
• Acquisition of 45 urban projects in progress with est. total attributable GFA of ~5.5 million sq. ft.
• Actively pursue farmland conversion in tandem with the Government’s development plans
� Replenish land-bank in line with development plan to strive for steady production and stable sales on an ongoing basis
- 14 -

2010 Final Results – 17 March 2011
Rising Rental Income from Investment Properties
� Strong leasing demand in Hong Kong
• Average occupancy rate of major investment properties in Hong Kong end of 2010: 94.5% (2009: 87.8%)
• Occupancy rates of portfolio in Kowloon East showed remarkable improvements
� Manulife Financial Centre reached 94% on 1 March 2011 from 66% a year ago
� AIA Financial Centre (formerly International Trade Centre) increased to 94% end of 2010 from 74% end of 2009
• Profit contribution from property leasing of IFC Complex for 2010 increased by HK$120 million over 2009
� Increased rental income from mainland China driven by
• Rising contribution from World Financial Centre in Beijing with latest leasing rate of 78%
• Newly-completed Centro and Henderson Metropolitan in Shanghai with very encouraging pre-leasing response
- 15 -

2010 Final Results – 17 March 2011
Rising Rental Income from Investment Properties (Cont’d)
Leasing BusinessGross Rental
Income*Y-o-Y
ChangeNet Rental Income* Y-o-Y
Change
For the six months ended 30 June 2010
Hong Kong HK$2,132 million +7% HK$1,528 million +8%
Mainland China HK$ 202 million +25% HK$ 92 million +50%
Overall HK$2,335 million +8% HK$1,620 million +10%
For the year ended 31 December 2010
Hong Kong HK$4,398 million +8% HK$3,147 million +9%
Mainland China HK$ 477 million +38% HK$ 235 million +27%
Overall HK$4,875 million +10% HK$3,382 million +10%
*All the above figures represent the Group’s attributable share of pre-tax contributions from its subsidiaries, associates and JCEs in Hong Kong and mainland China.
� Completed investment property portfolio• Hong Kong: ~9.4 million sq. ft.
• Mainland China: ~6.5 million sq. ft.
- 16 -

2010 Final Results – 17 March 2011
Hong Kong & China Gas (“HKCG”)
� Sole supplier of piped gas in Hong Kong with 1,724,316 customers
� Largest city-gas enterprise in mainland China with 11.88 million gas customers
• Largest controlling shareholder of Towngas China Company Limited (stock code: 1083), with a 66.49% interest
• Inclusive of Towngas China’s projects, HKCG had 120 projects spread across mainland China encompassing natural gas, water supply and wastewater treatment, natural gas filling stations and emerging environmentally-friendly energy sectors at the end of 2010
� Total Issued Shares*: ~7,182 million shares � Market Capitalization*: ~HK$131.6 billion � Net Asset Value*:~HK$41,209 million� 39.88% owned by Henderson Land – largest controlling shareholder
HKCG At A Glance
*As of 31 December 2010
� Profit after taxation attributable to shareholders for 2010: HK$5,585 million, up 6% y-o-y mainly due to growth in profit of mainland businesses
- 17 -
� Total profit and dividends declared for 2010 attributable to HLD amounted to HK$2.2 billion and HK$1.0 billion respectively
• Towngas China’s profit after taxation attributable to its shareholders for 2010 amounted to HK$436 million, up 64% y-o-y

2010 Final Results – 17 March 2011
Prospects
� Residential property market buoyed by low interest rate, inflation expectation, improving job market and rising household income in next few years
� Performance of rental portfolio to benefit from continued growth in local economy
Hong Kong
- 18 -

2010 Final Results – 17 March 2011
Prospects (Cont’d)
� Home prices to stay firm fuelled by buoyant economy, increase in household income, inflation expectation, negative interest rate and limited availability of investment vehicles
� Sales volume in second-tier and third-tier cities backed by increasing urbanization and strong demand from local end-users
Mainland China
� Rental income to increase with rising contributions from World Financial Centre in Beijing, and newly-completed Centro and Henderson Metropolitan in Shanghai
- 19 -

2010 Final Results – 17 March 2011
Prospects (Cont’d)
- 20 -
1. Continued expansion of rental portfolio in both Hong Kong and mainland China with an improved property mix:
� Recurrent rental income is set to grow further
2. Urban redevelopment projects and other projects under development: � Total attributable GFA of ~7.3 million sq. ft. upon successful acquisition of all 68 old building projects
� Another 9 existing projects under planning for redevelopment with attributable GFA of ~1.84 million sq. ft.
3. Largest holding of agricultural land reserve in Hong Kong and its expedited land-use conversion
The Group’s sizeable & valuable asset portfolio
4. Large development land-bank in mainland China:
� Most of the development projects were acquired in previous years at relatively low cost
5. Low cost approach to land banking:
� Acquisition cost of old buildings and premium for agricultural land-use conversion compare favourably with the transacted prices of land sites offered at public auctions
6. Steady income stream contributed by the three listed associates, namely HKCG, Hong Kong Ferry (Holdings) Company Limited, and Miramar Hotel and Investment Company, Limited
The Company’s stake in HKCG singly accounted for approximately 45% of the Company’s market capitalization on 31 December 2010 based on closing share prices on that date. The other assets also serve as a solid base for the delivery of strong earnings growth in the years to come and include:

2010 Final Results – 17 March 2011
Thank You!

2010 Final Results – 17 March 2011
Annexes
3.2: Completion Schedule
3.1: Development Land-bank
2.2: Rental Portfolio
Annex 3: Operations in Mainland China
3.3: Rental Portfolio
2.1: Sale/ Pre-sale Schedule 2.1.1: Stocks and projects pending sale/ pre-sale for 20112.1.2: Sale/ pre-sale schedule for 20122.1.3: Sale/ pre-sale schedule for 20132.1.4-5: Sale/ pre-sale schedule for 2014 or onwards
Annex 2: Operations in Hong Kong
Annex 1: Group Structure

2010 Final Results – 17 March 2011
Annex 1: Group Structure
Sale & distribution of LP gas & natural gas
in mainland China
Property investment, hotel operation & travel business
Production & distribution of gas in HK & mainland China
InfrastructureProperty
development & investment
Henderson Land DevelopmentCompany Limited (“HLD”)
Hong Kong Ferry(Holdings) Company
Limited
31.36% 67.94% 39.88% 44.21%
HendersonInvestment Limited
The Hong Kong and China Gas Company Limited
Miramar Hotel and Investment
Company, Limited
Towngas China Company Limited
66.49%
Company & subsidiaryAssociates
Dr. Lee Shau Keeand/or his family trust
54.72%*
All shareholding interests in listed subsidiaries and associatesshown above reflected the position as of 31 December 2010.
* The shareholding of Dr. Lee Shau Kee and/or his family trust in HLD was 53.88% as of 31 December 2009.
(HK stock code: 50) (HK stock code: 97) (HK stock code: 3) (HK stock code: 71)
(HK stock code: 1083)
(HK stock code: 12)
- Annex 1 -
2010 Final Results – 17 March 2011
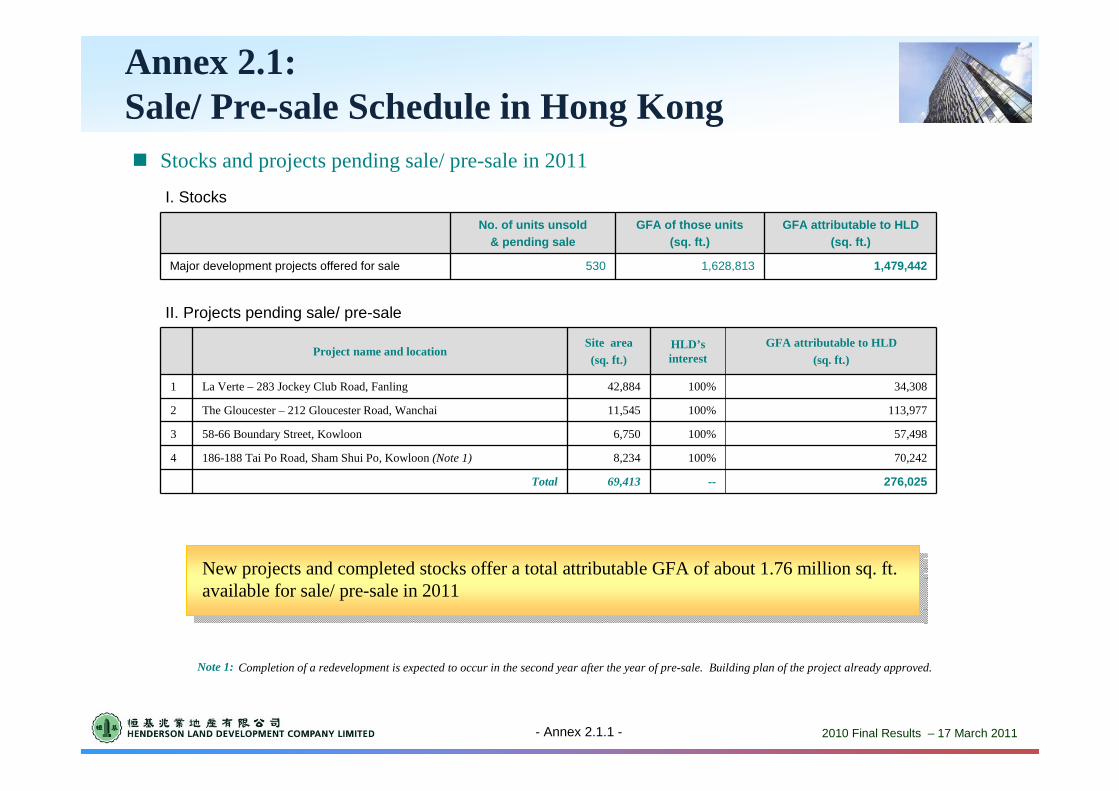
Annex 2.1: Sale/ Pre-sale Schedule in Hong Kong
- Annex 2.1.1 -
� Stocks and projects pending sale/ pre-sale in 2011
No. of units unsold & pending sale
GFA of those units (sq. ft.)
GFA attributable to HLD (sq. ft.)
Major development projects offered for sale 530 1,628,813 1,479,442
276,025
70,242
57,498
113,977
34,308
GFA attributable to HLD (sq. ft.)
Project name and locationSite area(sq. ft.)
HLD’s interest
1 La Verte – 283 Jockey Club Road, Fanling 42,884 100%
2 The Gloucester – 212 Gloucester Road, Wanchai 11,545 100%
3 58-66 Boundary Street, Kowloon 6,750 100%
4 186-188 Tai Po Road, Sham Shui Po, Kowloon(Note 1) 8,234 100%
Total 69,413 --
I. Stocks
II. Projects pending sale/ pre-sale
New projects and completed stocks offer a total attributable GFA of about 1.76 million sq. ft. available for sale/ pre-sale in 2011
Completion of a redevelopment is expected to occur in the second year after the year of pre-sale. Building plan of the project already approved. Note 1:

2010 Final Results – 17 March 2011
Annex 2.1: Sale/ Pre-sale Schedule in Hong Kong
- Annex 2.1.2 -
� Sale/ pre-sale schedule for 2012
166,600100%19,600Hoi On Building, 11-33 Li Tak Street, Tai Kok Tsui, Kowloon (Note 2)5
105,300100%11,700162-168 Pau Chung Street and 50-64 Ma Tau Kok Road, To Kwa Wan, Kowloon6
62,475100%7,500186-198 Fuk Wing Street, Sham Shui Po, Kowloon7
Sizeable Farmland Projects
558,337--63,421Sub-total
37,800100%3,150Chu Yau Lan Industrial Building, 63 Wing Hong Street, Cheung Sha Wan, Kowloon (Note 3)
8
440,00056.75%1,042,396Wu Kai Sha, Shatin (Phase 1) (Note 4)9
1,028,35779.03%371,778Tai Tong Road, Yuen Long10
2,026,734
1,468,357
52,919
32,238
39,942
61,103
Expected attributable GFA in future development (sq. ft.)
Old Building Projects (Note 1)
Address Site area(sq. ft.)
HLD’s interest
1 30-38 Po Tuck Street and 36 Clarence Terrace, Hong Kong (Note 2) 7,310 100%
2 23-33 Shing On Street, Sai Wan Ho, Hong Kong (Note 2) 4,699 100%
3 75-81 Sa Po Road, Kowloon City, Kowloon 3,582 100%
4Keung Fu Building45-49 Boundary Street and 189-195 Sai Yeung Choi Street,
North Kowloon(Note 2)5,880 100%
Sub-total 1,414,174 --
Total 1,477,595 --
1. Completion of a redevelopment is expected to occur in the second year after the year of pre-sale.
2. Building plan already approved.
3. With the exception of project number 8 which is intended to be redeveloped into office or industrial/ office building, the rest are designated for commercial and residential uses.
4. The total site area of Wu Kai Sha project is 1,042,396 sq. ft.
Notes:

2010 Final Results – 17 March 2011
Annex 2.1: Sale/ Pre-sale Schedule in Hong Kong
- Annex 2.1.3 -
� Sale/ pre-sale schedule for 2013
58,590100%6,51011-19 Wing Lung Street, Cheung Sha Wan, Kowloon11
38,922100%4,579342-348 Un Chau Street, Cheung Sha Wan, Kowloon10
58,800100%7,350565-577 Fuk Wah Street, Cheung Sha Wan, Kowloon9
77,626100%8,6251-19 Nam Cheong Street and 198 Tung Chau Street, Sham Shui Po, Kowloon(Note 2)8
41,693100%4,905196-202 Ma Tau Wai Road, To Kwa Wan, Kowloon12
28,050100%3,30089-95 Shek Pai Wan Road, Aberdeen, Hong Kong5
207,279100%23,031Matauwei Apartments, 57-69 Ma Tau Wai Road, 2-20 Bailey Street and 18A-30 Sung Chi Street To Kwa Wan, Kowloon(Note 2)
6
55,032100%4,586Hillwood Apartments, 38-40A Hillwood Road, Jordan, Kowloon (Note 3)7
Sizeable Farmland Project
1,042,370--115,202Sub-total
30,855100%3,63079-83 Fuk Lo Tsun Road, Kowloon City, Kowloon13
1,230,00056.75%1,042,396Wu Kai Sha, Shatin (other phases (except Phase 1)) (Note 4)14
2,272,370
50,771
61,280
268,482
64,990
Expected attributable GFA in future development (sq. ft.)
Old Building Projects (Note 1)
Address Site area
(sq. ft.)HLD’s interest
1 2-12 Observatory Road, Tsim Sha Tsui, Kowloon (Note 3) 5,415 100%
2 Western Court, 450-456G Queen’s Road West, Hong Kong (Note 2) 29,875 100%
3 1-7A Gordon Road, Tin Hau, Hong Kong (Note 2) 7,423 100%
4 62-72 Main Street, Ap Lei Chau, Hong Kong 5,973 100%
Total 1,157,598 --
1. Completion of a redevelopment is expected to occur in the second year after the year of pre-sale. 2. Building plan already approved.
3. With the exception of above project numbers 1 & 7 which are intended to be redeveloped into office or industrial/ office building, the rest are designated for commercial and residential uses. 4. The total site area of Wu Kai Sha project is 1,042,396 sq. ft.
Notes:
2010 Final Results – 17 March 2011
Annex 2.1: Sale/ Pre-sale Schedule in Hong Kong
- Annex 2.1.4 -
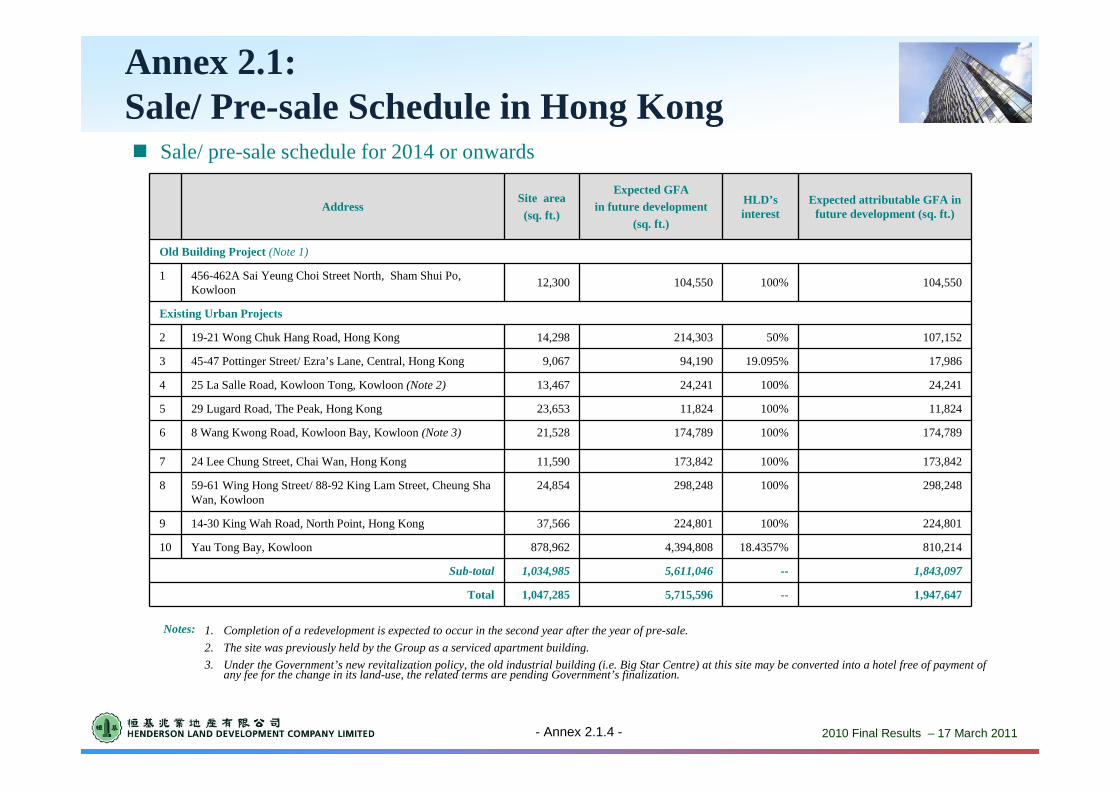
� Sale/ pre-sale schedule for 2014 or onwards
1,843,097--5,611,0461,034,985Sub-total
104,550100%104,55012,300456-462A Sai Yeung Choi Street North, Sham Shui Po, Kowloon
1
Old Building Project (Note 1)
Existing Urban Projects
Address Site area(sq. ft.)
Expected GFA in future development
(sq. ft.)
HLD’s interest
Expected attributable GFA in future development (sq. ft.)
2 19-21 Wong Chuk Hang Road, Hong Kong 14,298 214,303 50% 107,152
3 45-47 Pottinger Street/ Ezra’s Lane, Central, Hong Kong 9,067 94,190 19.095% 17,986
4 25 La Salle Road, Kowloon Tong, Kowloon (Note 2) 13,467 24,241 100% 24,241
5 29 Lugard Road, The Peak, Hong Kong 23,653 11,824 100% 11,824
6 8 Wang Kwong Road, Kowloon Bay, Kowloon (Note 3) 21,528 174,789 100% 174,789
7 24 Lee Chung Street, Chai Wan, Hong Kong 11,590 173,842 100% 173,842
8 59-61 Wing Hong Street/ 88-92 King Lam Street, Cheung Sha Wan, Kowloon
24,854 298,248 100% 298,248
9 14-30 King Wah Road, North Point, Hong Kong 37,566 224,801 100% 224,801
10 Yau Tong Bay, Kowloon 878,962 4,394,808 18.4357% 810,214
Total 1,047,285 5,715,596 -- 1,947,647
1. Completion of a redevelopment is expected to occur in the second year after the year of pre-sale.
2. The site was previously held by the Group as a serviced apartment building.
3. Under the Government’s new revitalization policy, the old industrial building (i.e. Big Star Centre) at this site may be converted into a hotel free of payment of any fee for the change in its land-use, the related terms are pending Government’s finalization.
Notes:

2010 Final Results – 17 March 2011
Annex 2.1: Sale/ Pre-sale Schedule in Hong Kong
- Annex 2.1.5 -
448,97950,141• Sham Shui Po
988,852114,939• Tai Kok Tsui
1,095,750121,750• Hung Hom
Kowloon2.
643,01379,430• Homantin
District / AreaLand area
(sq. ft.)Expected attributable GFA in
future development (sq. ft.)
1. Hong Kong
• Central & Western 121,324 952,957
• Island East 80,003 747,447
• Causeway Bay 32,387 314,436
• Aberdeen 23,017 208,780
• Wanchai 8,084 72,756
Sub-total: 264,815 2,296,376
Sub-total: 366,260 3,176,594
Total: 631,075 5,472,970
� With estimated total attributable GFA of ~5.5 million sq. ft. for redevelopment
� Acquisition of another 45 old building projects in urban areas in progress

2010 Final Results – 17 March 2011- 21 -
Property Investment Business as of 31 December 2010
� Leasing rates of certain core investment properties
Almost fully let
ifc Mall, Central Shatin Plaza, ShatinSunshine City Plaza, Ma On ShanMetro City Phase II, Tseung Kwan O Citimall, Yuen Long Fanling Centre (Phase I & II), Fanling
Investment property Leasing rate
Retail City Landmark II, Tsuen WanMetro City Phase III, Tseung Kwan O Fully let
Office One & Two IFC, CentralING Tower, Sheung Wan
Residential Eva Court, Mid-levels 95% or above
Annex 2.2: Rental Portfolio in Hong Kong
Rental portfolio in Hong Kong
Industrial/ Office10%
Residential &Apartment 6%
Office 36%
Retail 48%
(with a total attributable GFA of about 9.4 million sq. ft.)
New Territories42%Hong Kong 25%
Kowloon 33%
� The overall leasing rate for the Group’s core rental properties stayed high at 94.5% (Including the portfolio of premium office and industrial premises in Kowloon East)
- Annex 2.2 -

2010 Final Results – 17 March 2011- 24 -
No. of Projects
Attributable GFA*(mn sq. ft.)
1 Shanghai 2 1.1
2 Guangzhou 4 14.2
3 Anshan, Liaoning 2 18.0
4 Changsha, Hunan 2 15.2
5 Chengdu, Sichuan 1 4.0
6 Chongqing 2 6.6
7 Dalian, Liaoning 2 10.3
8 Nanjing, Jiangsu 2 2.4
9 Shenyang, Liaoning 2 17.4
10 Suzhou, Jiangsu 2 17.0
11 Tieling, Liaoning 2 8.7
12 Xian, Shaanxi 2 20.5
13 Xuzhou, Jiangsu 1 5.3
14 Yixing, Jiangsu 2 9.7
TOTAL at 31 Dec 2010 28 150.4
TOTAL at 31 Dec 2009 28 146.2
Prime cities:15.3 mn sq. ft.
2nd-tier cities:135.1 mn sq. ft.
A “ Two-pronged” strategy
Land bank as of 31 December 2010
Sichuan
Shaanxi
Chongqing
Hunan
Guangdong
Jiangsu
Shanghai
Liaoning
1
2
3
4
7
8
9
5 6
13
11
12
14 10
Annex 3.1: Development Land-bank in Mainland China
*Excluding basement areas and car parking spaces
- Annex 3.1 -
2010 Final Results – 17 March 2011
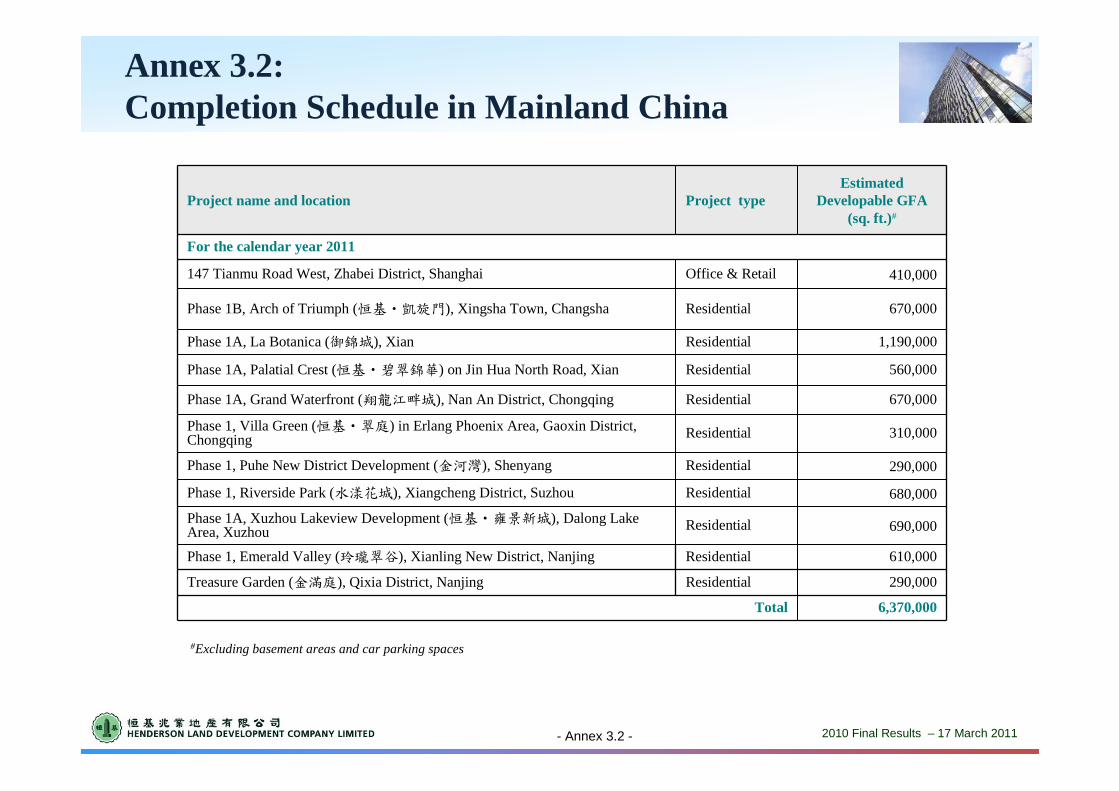
Residential
6,370,000Total
290,000Treasure Garden (金滿庭), Qixia District, Nanjing
Project name and location Project typeEstimated
Developable GFA (sq. ft.)#
For the calendar year 2011
147 Tianmu Road West, Zhabei District, Shanghai Office & Retail 410,000
Phase 1B, Arch of Triumph (恒基‧凱旋門), Xingsha Town, Changsha Residential 670,000
Phase 1A, La Botanica (御錦城), Xian Residential 1,190,000
Phase 1A, Palatial Crest (恒基‧碧翠錦華) on Jin Hua North Road, Xian Residential 560,000
Phase 1A, Grand Waterfront (翔龍江畔城), Nan An District, Chongqing Residential 670,000
Phase 1, Villa Green (恒基‧翠庭) in Erlang Phoenix Area, Gaoxin District, Chongqing Residential 310,000
Phase 1, Puhe New District Development (金河灣), Shenyang Residential 290,000
Phase 1, Riverside Park (水漾花城), Xiangcheng District, Suzhou Residential 680,000
Phase 1A, Xuzhou Lakeview Development (恒基‧雍景新城), Dalong Lake Area, Xuzhou Residential 690,000
Phase 1, Emerald Valley (玲瓏翠谷), Xianling New District, Nanjing Residential 610,000
#Excluding basement areas and car parking spaces
Annex 3.2: Completion Schedule in Mainland China
- Annex 3.2 -

2010 Final Results – 17 March 2011
Annex 3.3: Rental Portfolio in Mainland China
*As of 31 December 2010
Project Name Beijing Henderson Centre
World Financial Centre
Grand Gateway Office Tower II
Skycity Centro Henderson Metropolitan
Hengbao Plaza
Location Beijing Beijing Shanghai Shanghai Shanghai Shanghai Guangzhou
HLD’s interest
100% 100% 100% 100% 100% 100% 100%
Usage Retail Office & Retail Office Retail Office & Retail Office & Retail Retail
Completion Year
1997 2009 2005 1998 2010 2010 2001
GFA^ 1,130,000 sq. ft. 2,170,000 sq. ft. 690,000 sq. ft. 380,000 sq. ft. 510,000 sq. ft. 980,000 sq. ft. 930,000 sq. ft.
• Office -- 1,990,000 sq. ft. 690,000 sq. ft. -- 370,000 sq. ft. 420,000 sq. ft. --
• Retail 890,000 sq. ft. 140,000 sq. ft -- 290,000 sq. ft. 70,000 sq. ft. 320,000 sq. ft. 700,000 sq. ft.
• Basement Retail Area
-- 40,000 sq. ft. -- -- -- 80,000 sq. ft. --
• Car parking 240,000 sq. ft. -- -- 90,000 sq. ft. 70,000 sq. ft. 160,000 sq. ft. 230,000 sq. ft.
Committed
Leasing Rate> 80%* 78%# 97%* 96%*
Very encouraging pre-leasing response
90%*
^Including car parking spaces and basement retail area
Investment property portfolio in mainland China as of 31 December 2010
#As of 28 February 2011
- Annex 3.3 -

2010 Final Results – 17 March 2011
Investor Contact:
Mr. Patrick KwokExecutive DirectorDirect line: (852) 2908 8373Email: [email protected]
Hong Kong Head Office Address: 71-76/F, Two International Finance Centre8 Finance Street, CentralHong KongTelephone: (852) 2908 8888Fax: (852) 2908 8838Website: www.hld.com
Miss Stella LuiInvestor Relations ManagerDirect line: (852) 2908 8392 Email: [email protected]