2010 annual strategic investment plan
TRANSCRIPT

Commonwealth of PennsylvaniaState Employees’ Retirement System
2010 Annual Strategic Investment Plan
inside keystone @ 40%
Prepared by the SERS Investment Office in consultation with:
Rocaton Investment Advisors, Inc. - Cambridge Associates - The Townsend Group

SERS 2010 Annual Investment Plan i
Table of Contents Section I: Introduction
Description and Purpose of Investment Plan .................................................................................................1 Section II: Total Fund Projections
SERS Strategic Asset Allocation Policy ............................................................................................................4 Ten–Year Expectational Inputs by Asset Class...............................................................................................6 Risk/Reward of the Total Portfolio ..................................................................................................................8 Total Fund Asset Allocation Trend: 2010 Through 2014 .............................................................................9 Return Distributions over One, Five and Ten Years ...................................................................................11 Projection of Contributions, Income, and Benefits......................................................................................13
Section III: Plan Summaries
Stocks ...................................................................................................................................................................14 Global Stocks...............................................................................................................................................14 U.S. Stocks ...................................................................................................................................................15 Non–U.S. Stocks.........................................................................................................................................16
Alternative Investments.....................................................................................................................................18
Real Estate ...........................................................................................................................................................22
Fixed Income ......................................................................................................................................................25 Inflation Protection............................................................................................................................................28
Absolute Return..................................................................................................................................................30
Cash ......................................................................................................................................................................31 Corporate Governance ......................................................................................................................................32
Section IV: Appendix
Detailed Summaries of Asset Class Projections ......................................................................................... A-1

Section 1Introduction
Section 1
Introduction

SERS 2010 Annual Investment Plan 1
Description and Purpose of Investment Plan
Plan Purpose The 2010 Annual Strategic Investment Plan provides the strategic direction of the SERS’ investment program. The Plan was developed jointly by SERS’ investment staff and SERS’ investment consultants after careful analysis of major quantitative and qualitative factors, including the unique needs, preferences, objectives, and constraints of SERS, and expected long–term market conditions. Since these factors vary over time, SERS’ investment staff and consultants update this Plan annually in order to make appropriate adjustments to the investment program. Investment Background Significant themes within the Investment Plan include a focus on the importance of asset allocation and an ongoing commitment to diversification within the investment portfolio in order to manage the Fund’s volatility. Studies have shown that asset allocation alone accounts for up to 95% of variance in quarterly returns for a typical large pension fund. This Investment Plan seeks to achieve the actuarial long–term assumed rate of return of 8.0%, within acceptable levels of risk. The expected returns continue to derive from a wide variety of underlying asset classes. Public equities continue to have an important role in the Fund’s target allocation. Within the public equity allocations, SERS has diversified investment strategies globally, incorporating traditional long–only portfolios in large cap, mid cap, and small cap, both domestically and internationally. The core fixed income allocation was de–emphasized over the past seven years due to the protracted period of low interest rates and the potential negative impact from an increase in interest rates. The 2010 Plan proposes a target allocation of 32.5% to fixed income, an increase of 17.5 percentage points over the current target. It is anticipated that due to increasing benefit payments and the need to
fund private equity and real estate capital calls, the benefit reserve concept will be reintroduced. The benefit reserve is meant to provide ample liquidity to meet cash flow needs for an extended period in order to avoid selling other assets at distressed prices. The fixed income structure has been highly diversified as well. The core component, which represents the main component of the benefit reserve, contains Treasuries and Treasury Inflation Protected Securities (TIPS). It is a portfolio benchmarked to the Barclays Aggregate Index with specialty managers to invest in mortgages, asset–backed securities and corporate bonds. There is also a specialty component which includes high yield and commercial mortgage–backed securities. Lastly, there is an allocation to emerging market debt invested in dollar denominated and local currency debt. Outside of traditional stocks and bonds, the Fund has for some time been diversified across asset classes such as real estate, private equity, venture capital, inflation protection and absolute return (funds–of–hedge funds). In each asset class, investments were broadened to include foreign investment, recognizing the globalization of financial markets. Comments on the State of the Markets Following the global credit crisis and near collapse of the financial markets in 2008 and early 2009, the Fund, like other large pension funds, faces many challenges. Although the recession that commenced in December 2007 is showing signs of abating, its ill affects continue to linger. Unemployment is likely to continue to rise and remain elevated for the foreseeable future. As a result, much like U.S. corporations and financial institutions, U.S. consumers will have to repair their balance sheets. This will, in all likelihood, lead to lower consumption, creating a heightened concern that U.S. consumers will not bail out the economy. A consequence of lower consumer participation in the economic recovery is that global growth may remain

SERS 2010 Annual Investment Plan 2
subdued for several years. Meanwhile recent government intervention to stave off a financial collapse by bailing out financial institutions will have far reaching consequences. There is considerable interest in Washington in increasing regulation, and taxes are likely to increase to cover the debt issued to institute the bailout programs. This dramatic increase in debt is expected to result in inflation that will have to be combated with a more active role in monetary and fiscal policy. What does this mean for the financial markets? As in the past two years, uncertainty abounds; thus the trend of elevated market volatility is expected to continue. The general expectation is that performance of the financial markets over the next few years, and possibly longer, may be muted. Currently banks are lending very cautiously, which could negatively impact current investments in real estate and alternative investments that typically rely on leverage. Many loans in these asset classes will be maturing and have to be refinanced; how this will impact investments in these asset classes remains to be seen. In 2008 and early 2009 virtually all asset class valuations declined in lockstep and the liquidity in most asset classes vanished. This phenomenon, where asset classes tend to move in tandem, has also played out in the rebound during 2009. Stocks and non–Treasury fixed income securities have increased sharply in value in a relatively short time. However, over the long–term different industries and economies are expected to grow at different rates, supporting the argument for diversification. Under this Plan diversification would continue to be the hallmark of SERS’ investment strategy. Comments on the State of SERS The global market correction in 2008 and 2009 had a significant impact on the Fund, with assets declining from $35 billion to $24 billion. In addition to the decline in assets, allocations to asset classes drifted significantly away from pre–established targets. Publicly traded domestic and international stocks and
bonds fell well below policy targets, while privately–traded private equity, venture capital and real estate, along with the funds–of–hedge funds, are now significantly over–weight relative to long–term targets. Due to the illiquid nature of these investments, and absent a significant injection of cash, it is estimated it will take years to bring the Fund back to policy targets. Development and Transition to a New Asset Allocation Policy Over the past 15 years many new investment strategies and structures have been incorporated into the Fund to enhance diversification and improve the Fund’s risk–adjusted performance. Most of the changes required a number of years to fully execute. The 2010 Plan, as with past Investment Plans, includes a target asset allocation policy intended to be phased in over five–years. This timetable is due not only to the addition of new asset classes, such as international fixed income, but also to the time it will take to reduce exposures to the largely illiquid absolute return, alternative investments and real estate investments. It should be noted that it is likely that the Plan may not reach its targets at the end of the period due to the illiquid nature of some exposures. There are significant changes proposed to the asset allocation policy in the 2010 Annual Plan. The most dramatic shift is the 17.5 percentage point increase to fixed income. The vast majority of this increase is earmarked for the core segment, primarily to reinstitute the benefit reserve. In this case, core fixed income includes a diversified portfolio of strategies that will incorporate all of the sectors found in the Barclays Aggregate Index; namely Treasuries, Corporates, Mortgages and Asset Backed securities. Allocations to TIPS and international fixed income will be added as well. In order to accommodate the shift in fixed income exposure, the target stock exposure will decline 11.5 percentage points, and alternative exposures such as Absolute Return, Inflation Protection, Private Equity and Real Estate will decrease by 6 percentage points. Therefore, unlike the 2008 Plan which

SERS 2010 Annual Investment Plan 3
did not need a progression to reach strategic targets, the 2010 Plan is reverting to the prior practice of transitioning into the new Policy Target. In addition to the glide path to achieve the long–term Target Policy, the Plan proposes consideration to securitize cash balances. In prior years the rebalancing account was used to assist in adjusting asset allocation closer to long–term targets to compensate for market swings from the different asset classes. In view of the significant difference between the current asset allocation and the proposed Policy Target, it is unlikely that rebalancing of public market asset classes will occur. Going forward securitizing cash balances can be used to improve public markets exposures in moving toward the new Policy Target while providing readily available cash to meet cash flow obligations. Stock and bond allocations will be adjusted toward strategic targets through the use of highly liquid derivatives, such as futures. The large cash pool will act as collateral for the derivatives used to securitize the cash. Any use of derivatives for rebalancing will only be equal to the amount of the underlying available cash. As in past Annual Plans, many of the asset classes contain initiatives to research potentially interesting strategies and investments. The initiatives contained in the 2010 Plan are, for the most part, potential refinements to existing strategies. For
instance, there are initiatives to: i) research adding a dedicated small cap emerging markets stock exposure; ii) research stocks in “frontier;” or pre–emerging markets; iii) possibly further diversify fixed income by expanding into international fixed income markets; and iv) consider substituting a segment of core fixed income with long–dated Treasury bonds. Plan Enactment The Plan is based upon the percentage weightings for each asset class, and the percentage weightings for each portfolio or management style within each asset class. The creation of an efficient portfolio is a function of the percentage weightings contained in this document. Specific dollar amounts referenced in the Plan are for illustration only; percentage asset allocation targets define the Plan’s foundation. Approval of this Plan by the Board authorizes the SERS investment staff and SERS investment consultants to begin researching initiatives contained within the Plan and report findings and recommendations to the Board for consideration. The Board has the full power to invest SERS’ assets, and may revise or amend this Plan at any time. The investment staff and the investment consultants will monitor SERS’ needs and market conditions, and will propose any modifications to this Plan to the Board for consideration.

Section 2Total Fund Projections
Section 2
Total Fund Projections

SERS 2010 Annual Investment Plan 4
SERS’ Strategic Asset Allocation Policy
Asset allocation is the most important decision driving the long–term returns of a fund. A significant and often–cited study on this topic demonstrates that asset allocation alone accounts for 95% of the variance in quarterly returns for a typical large pension fund (Brinson, Hood, and Beebower, “Determinants of Portfolio Performance,” Financial Analysts Journal, July/August 1986). The "Proposed Strategic Target" column in Table I contains SERS' proposed strategic asset allocation objectives as a percentage of the Total Fund. An increase to fixed income is proposed: stocks, alternative investments, real estate and
inflation protection are slated to shrink, thus improving the liquidity profile of the Fund. The target allocation to Fixed Income is more than double that of the 2009 Plan. This large increase is warranted due to the increasing benefit payments that places greater liquidity demands on the Fund. To accomplish the increase in fixed income, it is proposed that public stocks decrease from 47.0% of plan assets to 35.5%, while alternative and real estate investments decrease marginally, 2.0 and 1.0 percentage points, respectively. Also, there is a decrease in Inflation Protection from 7% to 4% in the proposed target. These changes are expected to reduce the risk profile of the Fund.
Table I
SERS’ Asset Allocation Policy
2009 Strategic Target
Proposed Strategic Target
47.0% Stocks 35.5%
14.0% Alternative Investments 12.0%
8.0% Real Estate 7.0%
15.0% Fixed Income 32.5%
7.0% Inflation Protection 4.0%
9.0% Absolute Return 9.0%
0.0% Cash 0.0%
100.0% 100.0%

SERS 2010 Annual Investment Plan 5
Table II provides greater detail about the diversification of the seven asset classes. The significant changes to stocks are the decreases to domestic and international stocks, while emerging market stocks almost doubles. The significant changes to fixed income are the
increase in core fixed income to more than twice its current target, and new allocations to international fixed income and TIPS. This diversification is expected to reduce the overall risk to the portfolio and move the Fund to a more liquid posture over time.
Table II SERS’ Asset Allocation Policy
2009
Strategic Target
Proposed Strategic Target
47.0% Stocks 35.5%
5.0% Global Stocks 5.0%
21.0% Domestic Stocks 11.5%
17.0% International Stocks 11.5%
4.0% Emerging Market Stocks 7.5%
14.0% Alternative Investments 12.0%
10.5% Private Equity 9.5%
3.5% Venture Capital 2.5%
8.0% Real Estate 7.0%
15.0% Fixed Income 32.5%
6.0% Core Domestic Fixed Income 15.5%
5.0% High Yield Fixed Income 4.0%
0.0% International Fixed Income 5.0%
0.0% TIPS 4.0%
4.0% Emerging Markets Debt 4.0%
7.0% Inflation Protection 4.0%
9.0% Absolute Return 9.0%
0.0% Cash 0.0%

SERS 2010 Annual Investment Plan 6
Ten–Year Expectational Inputs by Asset Class
The three key expectational inputs required to identify an efficient investment portfolio are: 1) expected returns, 2) expected volatility, and 3) correlation. A set of ten–year expectational inputs has been utilized that were derived by SERS’ general consultant, Rocaton Investment Advisors. The inputs have been based on the long–term history of each asset class, the building blocks of each asset class, the current shape of the U.S. Treasury yield curve and the impact on all asset classes assuming that the yield curve will move to a normal shape and level. They also incorporate future expectations, taking into account actual and expected changes in asset class behavior due to changes in markets. 1) The "Expected Return," the left column in
Table III, represents the expected annualized long–run rate of return for each asset category. These returns are a reflection of the current market conditions
coupled with longer–term expected returns. Specifically, the impact of current interest rates on other asset classes have been incorporated in these expected returns.
For the expected nominal returns in this table, an underlying inflation assumption of 2.5% was employed on an annualized basis, which remains lower than the actuarial inflation assumption of 3%.
2) The "Expected Volatility" column in
Table III refers to the standard deviation of returns, which is an indicator of the likely dispersion of returns in any given year, often referred to as “risk.” Due to changing market conditions, the long–run expected returns for each asset class will not be consistent for every year covered by the Plan.
Table III
Note: To estimate global stocks for modeling purposes, equal amounts of domestic and international stock capital market assumptions are used.
Ten–Year Expected Returns and Standard Deviations
Expected Return
Expected Volatility
Domestic Stocks 8.0% 18.5%
International Stocks 8.0% 18.7%
Emerging Markets Stocks 9.0% 26.8%
Alternative Investments 11.2% 24.8%
Real Estate 6.7% 13.8%
Core U.S. Fixed Income 4.4% 5.0%
Emerging Market Debt 6.4% 10.4%
High Yield Fixed Income 6.8% 11.6%
International Fixed Income 4.6% 8.1%
TIPS 4.8% 8.2%
Commodities 4.4% 13.3%
Absolute Return 6.7% 7.5%

SERS 2010 Annual Investment Plan 7
3) The third key expectational input involves long–run correlation assumptions, shown in Table IV, which quantify the relationships between asset class return patterns. These correlations run between +1 and –1. The higher the positive correlation number the greater the likelihood that the two asset classes will move in the same direction and magnitude
of return and therefore have a limited benefit to diversification. Conversely, the greater the negative correlation number, the greater the likelihood that the two asset class returns will move in opposite directions and the greater the likelihood of achieving diversification. Numbers centering around zero indicate no common pattern of returns.
Table IV
C o r r e l a t i o n M a t r i x Dom
Stock Int’l
Stock EM
Stocks Alt Inv
Real Estate
U.S. Core FI
High Yield
EM Debt
Int’l FI TIPS
Comm
ARS
Domestic Stocks 1.00
International Stocks 0.9 1.00
Emerging Mkts Stocks 0.7 0.9 1.00
Alternative Investments 0.5 0.5 0.4 1.00
Real Estate 0.6 0.6 0.4 0.8 1.00
Core U.S. FI –0.2 –0.3 –0.3 –0.5 –0.2 1.00
High Yield FI 0.7 0.7 0.7 0.1 0.2 0.1 1.00
Emerging Market Debt 0.4 0.6 0.6 0.0 –0.1 0.1 0.5 1.00
International FI 0.0 –0.2 –0.2 –0.5 –0.2 0.5 0.3 –0.1 1.00
TIPS 0.0 0.1 0.2 0.2 0.3 –0.4 0.1 0.1 –0.1 1.00
Commodities 0.3 0.5 0.6 0.4 0.3 –0.4 0.3 0.5 –0.2 0.6 1.00
Absolute Return 0.6 0.6 0.7 0.3 0.3 –0.1 0.6 0.6 0.0 0.3 0.6 1.00

SERS 2010 Annual Investment Plan 8
Risk/Reward of the Total Portfolio The “efficient frontier” contains portfolios with the highest expected return for a specified level of risk, or the lowest level of risk for a specified expected return. The measure of risk is the standard deviation of expected annual returns. The efficient frontier curve in Chart I was derived based on the Re–sampled Efficient Frontier technique developed by Dr. Richard Michaud. The results are based on the average of over 500 samples of possible asset mixes that are expected to deliver the highest level of return for any given level of risk. In addition, the 2009 and 2010 Plan risk/return expectations are plotted. Given the increase in assets dedicated to fixed income, the 2010 allocation has slightly less return but at noticeably lower risk as compared to the 2009 asset allocation.
There were four group constraints imposed on the model to develop the 2010 Plan asset allocation. These were: 1. The allocation to high yield and emerging
market debt is less than or equal to 10% of the total Fund;
2. U.S. stocks must equal non–U.S. stocks plus emerging markets stocks;
3. The allocation to emerging markets stocks is equal to 20% of non–U.S. stocks; and
4. The sum of private equity, real estate and absolute return is less than or equal to 30% of the total Fund.
These constraints are used to ensure proper allocation and risk posture to market benchmarks, or to control liquidity requirements. As a result the 2010 Plan is somewhat below the efficient frontier.
Chart I Risk/Reward
5.0%
6.0%
7.0%
8.0%
9.0%
10.0%
4.0% 5.0% 6.0% 7.0% 8.0% 9.0% 10.0% 11.0% 12.0% 13.0% 14.0%
Risk
2010 Plan2009 Plan
Exp
ecte
d M
ean
Ret
urn

Total Fund Asset Allocation Trend: 2010 through 2014 SERS will seek to implement the Investment Plan over a period of five years. This transition trend considers assumptions from multiple sources, specifically: the Actuary’s estimates of employee
contributions and benefit payments; an assumed employer contribution rate of
8% of payroll. This rate serves as a proxy of the historic normal cost calculated by the Actuary;
Rocaton’s capital market assumptions projecting the estimated growth of stocks, fixed income, inflation protection and the absolute return asset classes;
alternative investment and real estate capital calls, distributions and market value projections provided by Cambridge Associates and the Townsend Group;
forecasted cash receipts from the absolute return managers.
There are no secondary sales of private equity or real estate investments included in the analysis. Based on the analysis, it is expected that the Fund's asset allocation strategy will evolve
over a time period longer than the usual five–year timeframe. The Plan calls for achieving the long–term percentage allocation targets for each asset class by the end of 2014, but given the extreme overweight to illiquid asset classes, market movements, actual employer contributions and net capital calls, the five–year targets could vary considerably from the forecasted asset allocation trend. Based on the 2010 Plan allocation, the proposed transition to the long–term asset allocation targets is reflected in Table V and Chart II. SERS’ unaudited asset allocation as of September 30, 2009 is markedly different from the proposed 2010 strategic target for the Fund. This is largely due to the major shifts to take place in absolute return, fixed income and alternative investments. As a whole, fixed income is presently 21 percentage points below the strategic target with absolute return and alternatives being almost 15 percentage points and 10 percentage points over–weight, respectively.
Table V
SERS’ Asset Allocation Trend
Unaudited
9/30/09
2010 2011 2012 2013 2014
Proposed
Target
24.8% Stocks 30.0% 30.0% 32.5% 35.5% 35.5% 35.5%
22.4% Alternative Investments 25.0% 24.5% 22.5% 19.5% 15.5% 12.0%
9.1% Real Estate 9.0% 9.5% 9.5% 9.0% 8.5% 7.0%
11.7% Fixed Income 15.0% 16.5% 17.5% 19.0% 25.0% 32.5%
6.2% Inflation Protection 4.0% 4.0% 4.0% 4.0% 4.0% 4.0%
23.7% Absolute Return 17.0% 15.5% 14.0% 13.0% 11.5% 9.0%
2.1% Cash 0.0% 0.0% 0.0% 0.0% 0.0% 0.0%
SERS 2010 Annual Investment Plan 9

SERS 2010 Annual Investment Plan 10
Chart II 2010 Target Asset Allocation
Chart III
Variance of September 30, 2009 (Unaudited) Allocation From 2010 Target Asset Allocation
2.1%
14.7%
2.2%
0.2%
-0.4%
-5.0%
-0.8%
-14.6%
2.1%
10.4%
-5.5%
-2.8%
-0.7%
-1.7%
-20.0% -15.0% -10.0% -5.0% 0.0% 5.0% 10.0% 15.0% 20.0%
Cash
Absolute Return
Inflation Protection
Emerging Market Debt
High Yield Fixed Income
Non-US Fixed Income
TIPS
Core Fixed Income
Real Estate
Alternative Investments
Emerging Market Stocks
International Stocks
Domestic Stocks
Global Stocks
Domestic Stocks11.5%
International Stocks11.5%
Cash0.0%
Absolute Return9.0%
High Yield Fixed Income
4.0%
Core Fixed Income15.5%
TIPS4.0%
Non–U.S. Fixed Income
5.0%
Emerging Markets Stocks
7.5%
Real Estate7.0%
Emerging Market Debt4.0%
Global Stocks5.0%
Alternative Investments
12.0%
Inflation Protection4.0%

SERS 2010 Annual Investment Plan 11
Return Distributions over One, Five and Ten Years While an expected long–term return of 8.0% is the most likely scenario based on the asset allocation policy for the Fund, SERS’ asset allocation policy could result in a wide range of potential total returns for the Fund. We
analyzed the range of possible total returns for the Fund by generating a distribution of these returns over one–year, five–year and ten–year horizons, as illustrated in Chart IV.
Chart IV
One Year
-13.3 -2.7 8.0 18.6 29.2
Five Years
-1.6 3.2 8.0 12.7 17.5
Ten Years
1.2 4.6 8.0 11.3 14.7
The dispersion of returns narrows significantly as the length of time covered by the analysis increases; extreme returns in any given year
will tend to offset each other over a longer timeframe.

SERS 2010 Annual Investment Plan 12
As a long–term investor, SERS focuses more on the return dispersion of the ten–year period rather than the one–year period. For example, SERS’ total return in 2007 was positive 17.2%, while the Fund’s total return for 2008 was negative 28.7% demonstrating the volatility associated with shorter time intervals. The "tightness" of the range for the ten–year period should provide a level of comfort that the probability of SERS realizing a ten–year return of less than 1.2% is low, and
a return of less than zero is likely to be very remote. However, a decade of mid–single digit nominal returns would result in sharply rising employer contributions, as was experienced in the 1970’s. Rising employer contributions are likely to occur over the next few years based on investment experience, final amortization of Act 40 gains, and prior service costs which are amortized and factored into the contribution rate formula.

SERS 2010 Annual Investment Plan 13
Projection of Contributions, Income, and Benefits
Chart V
SERS Cash Flow
($12,000)
($10,000)
($8,000)
($6,000)
($4,000)
($2,000)
$0
$2,000
$4,000
$6,000
$8,000
'03 '04 '05 '06 '07 '08 '09 '10 '11 '12 '13 '14
$Mill
ions
Benefits Employee Employer Investment Return Projected Investment Return
Based on the December 2008 actuarial valuation performed by the Hay Group, Chart V projects the steady increase in benefit obligations along with contributions and investment returns. As a mature pension plan, SERS benefit payments will continue to exceed employer and employee contributions into the Fund over the period covered by the 2010 Plan and into the foreseeable future. As in the past, SERS continues to be in a "negative cash flow" position as a growing
proportion of the Fund’s investment return is required to make up the difference between benefit payments and total contributions. This situation of paying out more in benefits than is taken in through employer and employee contributions is normal for a mature pension plan. The ability to pay an increasing amount of benefits through investment earnings is the desired result of a successful investment program.

Section 3Plan Summaries
Section 3
Plan S
umm
aries

Stock Asset Class Plan Summary Role of Stock Asset Class within the SERS Fund Historically, the objective of meeting SERS’ long–term liabilities has been accomplished through a significant exposure to the stock market. This significant exposure to stocks was rewarded as stocks historically generated a premium over fixed income. Although the stock premium may fluctuate over time, and the stock return can be volatile, ownership of the corporations that propel the world’s economies should continue to be a profitable
investment over the long term. The 2010 Plan recommends a 35.5% allocation to stocks. A key principal of the Fund’s investment strategy is diversification within reasonable risk parameters. Diversification within the stock asset class reduces risk and stabilizes returns. The stock asset class is managed on a total return basis and focuses on exposure to the return streams from the following stock universes:
Global stocks U.S. and non–U.S. developed markets, large/mid cap
U.S. stocks U.S. developed markets, large/mid/small cap
Non–U.S. developed market stocks Non–U.S. developed markets, large/mid/small cap
Emerging markets stocks Emerging markets, large/mid cap
Global Stocks Long–Term Strategy Allocate 5% of the Fund to global stocks. The benchmark for the global stock strategy is the MSCI World Index. Based on this index, the allocation breaks down to 2.4% to U.S. large/mid cap stocks and 2.6% to non–U.S. developed markets large/mid cap stocks. The global stock strategy seeks to capitalize on the flexibility to respond to stock opportunities as they emerge in countries and industries around the world. Skilled investors are more likely to find winners when drawing from the 8,445 companies located worldwide, rather than from a geographic subset of the stock universe. There is also a very compelling case for broad global portfolio diversification to mitigate exposure during bad times in individual markets or industries. Thus active global stock strategies increase the potential for excess return and help to diversify stock returns.
2010–2011 Global Stock Initiative Review the global stock structure. In October 2006, SERS changed the mandate of two stock portfolios from Europe to global. One of these global stock portfolios is well–diversified with a low tracking error to the MSCI World Index. The other global stock portfolio uses a growth approach with higher geographic and sector concentrations, resulting in a higher tracking error to the MSCI World Index. SERS plans to:
Research the structure of the global stock
portfolios and consider whether adding a new portfolio advisor offers the potential for more consistent excess returns for SERS’ global stock composite.
Research increasing the global allocation to 6% of the Fund.
Develop a target weight for each global stock portfolio. The portfolio target weights will be determined by style and confidence in the investment product.
SERS 2010 Annual Investment Plan 14

SERS 2010 Annual Investment Plan 15
U.S. Stocks Long–Term Strategy Allocate 11.5% of the Fund to U.S. stocks. The benchmark for the U.S. stocks is the Russell 3000 Index. The Russell 3000 Index contains approximately 3,000 U.S. companies, representing 98% of the investable U.S. stock market.
The 11.5% of the Fund allocation to U.S. stocks breaks down to an allocation of 9.2% to large cap (benchmarked to the S&P 500 Index), and 2.3% to mid/small cap (benchmarked to the Russell 2500 Index). These allocations are designed to approximate the capitalization structure and risk profile of the Russell 3000 Index. Within U.S. stocks, maintain the following structure:
Allocate 9.2% of the Fund to U.S. large cap stocks. The benchmark for the U.S. large cap stocks is the S&P 500 Index. The large cap segment of the U.S. stock market is considered to be efficient, and therefore challenging for active advisors to add value. The U.S. large cap stock market is characterized by abundant and readily available information, good liquidity, and a large number of analysts covering these securities. SERS uses an S&P 500 index and an enhanced index strategy for this efficient segment of the market.
During 2009, the bulk of SERS’ U.S. large cap exposure was in an S&P 500 index fund and S&P 500 Index swaps. As the swaps matured, the cash collateral was reinvested in a non–lending S&P 500 index fund and a non–lending Russell 3000 index fund to maintain U.S. stock exposure. The last of the S&P 500 swaps will mature on December 31, 2009.
The enhanced S&P 500 index strategy uses a structured investment process to control capitalization and sector exposures similar to the S&P 500 Index while focusing on a large number of stocks that are expected to produce
excess return. The objective of the S&P 500 enhanced index strategy is to maintain close performance tracking to the S&P 500 Index, while adding incremental value from stock–specific bets in the form of under–weighting or over–weighting relative to the S&P 500 Index, and from holding stocks outside the S&P 500 Index.
Allocate 2.3% of the Fund to U.S. mid/small cap stocks. The benchmark for the U.S. mid/small cap stocks is the Russell 2500 Index. The mid/small cap allocation utilizes active fundamental strategies. The SERS Fund has historically used active strategies for mid/small cap stocks in the U.S. as this segment of the stock market has been viewed as being less efficient than large cap. This inefficiency stems from the theory that there is limited analyst coverage and less information.
SERS uses a mix of strategies for the U.S. mid/small cap stock component. The strategies include a low tracking error quantitative strategy benchmarked to the Russell 2500 Index, an actively managed portfolio benchmarked to the Russell 2500 Midcap Index, and a quantitative portfolio benchmarked to the Russell Microcap Growth Index. Two advisors invest in companies based in Pennsylvania or with significant Pennsylvania operations. 2010–2011 U.S. Stocks Initiative Develop a target weight for each U.S. stock portfolio. The portfolio target weights will be determined by style and confidence in the investment product. Research the use of enhanced index products. SERS uses an S&P 500 Index and an enhanced S&P 500 index product for the efficient large cap segment of the U.S. stock market. There are “active” managers that have slight tilts or enhanced index products which may add incremental return over the

SERS 2010 Annual Investment Plan 16
S&P 500 Index. SERS plans to research if there are other strategies available, such as revenue–weighted or sales–weighted portfolios which may be viable enhancements to the S&P 500 Index investment.
Research the use of an emerging manager program. Empirical data has shows that young, emerging managers tend to perform very well. The reason for this performance can be traced to the smaller pool of assets they manage making them more nimble and effective at trading. In addition, these managers are driven to succeed and are focused on this objective. As a way of searching for skilled investment talent, staff and consultant will research the feasibility of adding an emerging manager program to the Fund.
Non–U.S. Stocks Long–Term Strategy Allocate 19% of the Fund to non–U.S. stocks. The 19% allocation to non–U.S. stocks includes an allocation of 9.4% to large/mid cap stocks in developed markets (benchmarked to the MSCI EAFE Index), 2.1% to small cap stocks in developed markets (benchmarked to the MSCI EAFE Small Cap Index), and 7.5% to stocks in emerging markets (benchmarked to the MSCI Emerging Markets Index). The benchmark for non–U.S. stocks is the MSCI All Country World Index ex USA Investable Market Index.
The 5,987 non–U.S. companies comprise 57.3% of the world stock market capitalization and provide a broad universe of investment opportunities. In a variety of industries, there are companies based outside the U.S. that are growing more rapidly, developing innovative products and setting aggressive standards. There will be periods when economic activity is growing faster in foreign countries, especially in developing countries, providing many non–U.S. companies with a tailwind for earnings. Non–U.S. stocks have the potential
for enhanced returns from active management in this less efficient asset class. Within international stocks, maintain the following structure:
Allocate 9.4% of the Fund to non–U.S. developed markets large/mid cap. The benchmark for large/mid cap stocks in non–U.S. developed markets strategies is the MSCI EAFE Index.
Large/mid cap active strategies seek stock opportunities as they emerge in countries and industries in non–U.S. markets. Advisors mainly select large and mid cap stocks from non–U.S. developed markets. Large/mid cap active strategies add alpha through active investment decisions, resulting in a portfolio’s over– or under–weighting of stocks, industries, and countries relative to the MSCI EAFE Index.
In 2009, SERS placed the cash from maturing EAFE stock swaps in a non–lending MSCI All Country World Index ex U.S. fund. This index includes exposure to non–U.S. large/mid cap and emerging markets stocks that are restricted from securities lending. Allocate 2.1% of the Fund to non–U.S. developed markets small cap. The benchmark for the non–U.S. developed markets small cap is the MSCI EAFE Small Cap Index. SERS uses two dedicated small cap advisors to invest in non–U.S. developed markets. Active investment in small cap stocks offers the opportunity to capture excess returns in this inefficient segment of the market.
Allocate 7.5% of the Fund to emerging markets strategies. The benchmark for the emerging markets strategies is the MSCI Emerging Markets Index. Emerging markets are generally regarded as less efficient than developed markets and historically have been more volatile than developed markets. Returns have been influenced by capital flows into and out of these markets; however, longer term, emerging markets can be attractive to those

SERS 2010 Annual Investment Plan 17
investors seeking to access the financial returns derived from rapidly expanding economies. Due to the high return volatility associated with emerging markets, SERS employs a structure diversified by investment advisor, style and type. The strategies include traditional passive and active global emerging markets mandates, as well as special situations in emerging markets where longer–term commitments are made to limited partnerships for private placements with public companies. 2010–2011 Non–U.S. Stock Initiative Develop a target weight for each non–U.S. stock portfolio. The portfolio target weights will be determined by style and confidence in the investment product. Research and evaluate a dedicated allocation to small cap stocks in emerging markets. By definition, the small cap segment of emerging markets stocks makes up the bottom 15% of the MSCI Emerging Markets Investable Market Indices by capitalization. This segment of the emerging markets stocks universe is under–researched, and therefore less efficiently priced. Emerging markets small cap stocks provide an opportunity set that is less correlated to emerging as well as developed markets large–cap stocks, and offers the potential for further risk diversification and additional sources of return.
Of SERS’ three traditional global emerging markets mandates, two are not precluded from investing in this segment, but do so only on an
opportunistic basis. A dedicated allocation to small cap stocks would ensure complete coverage of the entire emerging markets stocks universe at all times. Structurally, a dedicated allocation to emerging markets small cap stocks would be consistent with the Fund’s composite benchmark for this asset class; the MSCI All Country World Index ex USA Investable Market Index is an integrated broad index covering large–cap, mid–cap and small–cap companies in developed and emerging markets.
Research and evaluate investing in frontier markets. “Frontier markets” are defined as less developed, pre–emerging markets. These markets span Asia, the Middle East and sub–Saharan Africa, Eastern Europe and South America. They tend to be small and illiquid, even by emerging market standards, and are not yet large enough or wealthy enough to be included in any standard emerging market benchmark. Frontier markets represent a potential source of return due to robust economic growth and market inefficiencies. Their lack of integration with the rest of the world’s financial markets— frontier markets exhibit very low correlations among themselves and with developed and emerging markets—makes them a potentially viable source of diversification. The SERS Fund currently has minimal exposure to stocks in frontier markets via its emerging markets stock portfolios. The SERS Fund has some exposure to frontier markets via emerging market debt in the fixed income asset class.

SERS 2010 Annual Investment Plan 18
Alternative Investments Asset Class Plan Summary
Role of Alternative Investments within the SERS Fund Alternative investments are expected to provide long–term returns materially exceeding those of SERS’ public markets exposure, and offer diversification benefits. Alternative investments consist of two major clusters of investments at opposite ends of the non–marketable investments continuum: private equity and venture capital, both of which take the form of limited partnership interests: A. Private equity primarily refers to
investments in the equity and subordinated debt of established companies, accomplished by means of domestic and international leveraged buyouts, distressed debt investing, and acquisition of secondary partnership interests. For asset allocation purposes, SERS separately tracks distressed debt and international investing.
B. Venture capital describes the financing of young, non–public growth companies that lack ready access to commercial debt and equity infusion. These investments are made in: i) seed stage companies in their conceptual phase, ii) early stage companies after a product has been developed and marketed but before material revenues are realized, and iii) late stage companies with demonstrable revenue and near– to medium–term opportunities for strategic sale or initial public offering of stock. Performance and allocations to investments in Pennsylvania and those with a significant Pennsylvania connection are also tracked separately.
The performance of SERS’ alternative investments is measured against Cambridge Associates benchmarks, which are based on return data from the majority of private equity and venture capital funds raised since 1981. Access to certain top tier funds is constrained by very high demand. Thus, a custom
benchmark that excludes funds to which SERS has no access is utilized to better reflect SERS’ investment universe.
Long–Term Strategies for Alternative Investments Sustain and manage alternative investments to the established allocation target. Alternative investments can and have produced relatively high risk–adjusted returns over long periods of time. The 2010 Plan includes a 12% target allocation for the foreseeable future, a reduction from the 14% target of recent years. As of August 31, 2009, exposure was 21.7%. The target allocation is considered a desirable point within a range, rather than a discrete numerical target. Many factors beyond the Board’s control, e.g., availability of investment opportunities and cash flow timing, make it impossible to maintain a discrete numerical target. It is understood allocation levels will fluctuate around the target, within a 400 bps ± range. Staff will endeavor to hold the exposure in close proximity to the new target, mindful of the continuing need for liquidity to respond to increasing benefit obligations.
The strategy also acknowledges that a convergence of significant events, such as high capital call volume, limited distributions, low relative performance of SERS’ other asset classes, and other factors, may result in unintended overexposure or underexposure outside the 400 bps ± range for a protracted period of time. Recent experience offers a prime example: the financial crisis of 2008–2009 and subsequent recession triggered a major downturn in the public markets and later affected almost all financial markets, public and private. These exogenous factors significantly contributed to the current over–allocation position of the Alternative Investments portfolio. The pace and size of commitment recommendations has been and

SERS 2010 Annual Investment Plan 19
will continue to be moderated to respond to such circumstances. No commitments have been recommended or made since October, 2008. Nevertheless, a material reduction of alternative investments exposure will not be immediate. Indeed, it may take five or more years to reduce exposure to the 12% target allocation.
Ensure proper diversification of investment strategies, and explore new strategies. Within the recommended 12% allocation, SERS seeks to build and maintain a diversified portfolio. The long–term goal is to achieve 45% exposure to private equity, 20% to venture capital, 25% to international, and 10% to distressed investing. Table VI depicts the portfolio’s current allocation. Achieving 25% international exposure will occur as unfunded commitments are invested in Asia (e.g., China and India), Europe, and Latin America. Invest in superior return opportunities with existing fund sponsors, and cease less productive relationships. General partner selection has the most profound influence over investment returns for the long–term. Stable management teams with a consistent record of top quartile returns tend to repeat their superior performance. SERS should strive to invest only with teams likely to produce top quartile performance. The Discretionary Reserve Fund and the Discretionary Reserve for Secondary Investments were established to facilitate SERS’ participation in superior return opportunities often denied to public pension plan investors. These discretionary reserves distinguish SERS from its public fund peers, and should remain a part of the Investment Office marketing and negotiation arsenal. Agility, rigorous due diligence and aggressive marketing by SERS’ staff are still critical in achieving access to superior return opportunities in private equity and venture capital.
Although SERS has committed approximately $3 billion of capital yet undrawn, modest commitments to the most attractive opportunities available to SERS will help offset expected declines in distributions in the next decade. Proposed commitments to be made in 2010 will not have a material adverse
impact on allocation and cash flow, e.g., the recommended $250 million in new commitments should result in approximately $50 million of additional funded capital next year. Maintaining exposure to the very best opportunities created by SERS’ core portfolio managers is of paramount importance despite existing over–exposure to alternative investments and availability of undrawn committed capital. To employ an agricultural analogy, a farmer must plant high quality seeds to reap a good harvest. Likewise, both
Table VI
Diversification Analysis As % of NAV
(as of March 31, 2009)
Sub–Asset Classes* Private Equity 44% Venture Capital 24% International** 16% Distressed 9%
Industry Healthcare/Biotech 21% Consumer/Retail & Services
20%
Information Technology 14% Software 9% Financial Services 8% Media/Communications 7% Manufacturing 6% Energy 6% Electronics 3% Other 6%
*In addition, Pennsylvania Related investments accounted for
6% and Other 2% of the AI portfolio. **This represents funds expressly organized to invest outside
the U.S.; however, actual exposure to underlying international company investments is approximately 29%.

SERS 2010 Annual Investment Plan 20
staff and Cambridge believe SERS should resume committing capital on a highly selective basis, albeit substantially moderated, to renew productive, valuable fund sponsor relationships, maintain diversification, and support a net cash generative alternative investment portfolio. The alternative investment environment is not static: teams spin–out, succession occurs, and new fund sponsors and strategies emerge. SERS has periodically refreshed its stable of alternative investment managers. As a result, the quality
of the portfolio remains high. However, more than two decades of adding new relationships and re–committing to existing productive relationships without culling less productive funds, has increased the number of funds in the SERS portfolio, as shown in Table VII. Administrative and management responsibilities have also been compounded by the growing number of funds, prompting the Board two years ago to endorse outsourcing some non–core portfolio management.
Table VII
Number of Partnerships General Partner Relationships
1985 5 5 1990 20 18 1995 43 37 2000 154 81 2001 179 91 2002 189 98 2003 194 99 2004 215 109 2005 260 121 2006 294 130 2007 322 135 2008 348 138
6/30/09 348 138

SERS 2010 Annual Investment Plan 21
2010–2011 Alternative Investments Initiatives Identify fund sponsors in the alternative investments portfolio expected to optimize returns and diversification. About 50 fund sponsors from among more than 130 existing relationships will comprise the core for future private equity and venture capital investing, and enable staff to prioritize resources and focus oversight and due diligence activities. Key considerations in constructing the core portfolio include: (i) track record and expected future performance, (ii) suitability of investment strategy, (iii) execution and realization of investment strategy, and (iv) team composition and stability. Commit modestly to a select group of core SERS managers raising capital in 2010. Many sponsors of the funds comprising SERS’ future core portfolio are or will be raising new pools of investment capital over the next 12–24 months. Having refrained from making commitments for almost a year, it is important to cautiously begin making new commitments so SERS may enjoy an uninterrupted stream of distributions in outlying years. A $250 million budget will enable 10–12 commitments of modest but meaningful size over the course of 2010. These will be paced to comport with cash flow expectations, accommodations to macroeconomic conditions, and material adverse changes in the overall SERS portfolio and pension framework. It is estimated that 24
of the fund sponsors now considered core managers will be raising new pools of capital next year. By definition, these will be attractive new opportunities. Yet, the very cautious $250 million commitment budget being recommended will only accommodate commitments to some of these opportunities. Potential commitments, therefore, represents not only excellent opportunities, but those that provide the best strategic fit and risk profile. Cull limited partnership interests from the alternative investments portfolio for eventual sale or other disposition. Existing alternative investments that are not elements of the core portfolio should be divested when conditions are favorable. Current discounts, some as great as 50% to 75% of net asset value, are unacceptably large. Until pricing is attractive or liquidity constraints compel disposition regardless of price, fiduciary duty requires active oversight of non–core assets. Staff and outsourced resources will be employed to assure an appropriate level of oversight and staging for eventual sale or other disposition. Exploit existing third party contractual relationships to efficiently manage non–core investments. Staff will seek to amend current contracts with Cambridge Associates LLC and DLJ MB Advisors, Inc. (a/k/a, Credit Suisse Customized Funds Investment Group) to provide more support for management of existing non–core alternative investments.

SERS 2010 Annual Investment Plan 22
Real Estate Asset Class Plan Summary Role of Real Estate Real Estate is used by the Fund to: a) Provide a competitive total return which is
expected to fall between those of stocks and bonds;
b) Reduce total portfolio risk by diversifying the portfolio; and
c) Provide a hedge against the effects of inflation.
The asset class is composed of: 1) Equity interests in commercial real estate; 2) Mortgage instruments that may derive
some portion of their value from the performance of the underlying real estate;
3) Shares of publicly traded real estate investment trusts (REITs);
4) Equity interests in commercial timberland; and
5) Instruments that derive their value from the behavior of real estate assets such as limited partnership or joint venture interests.
Long–Term Strategy for Real Estate Maintain a tactical approach to investing that keeps SERS at the forefront of new trends as institutional real estate investment markets continue to evolve. SERS has been an enhanced or opportunistic investor in real estate, a strategy that has served the Fund well during periods of market recovery and expansion. SERS committed capital through the latest market peak, so it is now well positioned with approximately $300 million unfunded investment commitments to high quality managers. These unfunded commitments ensure that SERS has a material amount of capital available for investment as real estate markets correct. Moreover, SERS initiated new overseas investment strategies which place the real estate program in a good position as domestic markets reprice.
In 2008–2009, public equities and other asset classes declined in value at a rate faster than
real estate. Therefore, SERS’ real estate is funded at a level above its 7% target allocation. A focus in 2010 will be to rebalance the real estate program by not reinvesting all capital returned from sales and perhaps by redeeming or selling more liquid real estate positions. New investment initiatives will be limited to select opportunities to enhance overall program diversification.
After a material repricing, real estate markets are expected to bottom in 2010. Real estate markets peaked in 2007–2008 primarily due to capital market forces. Excess liquidity and inexpensive and freely available debt stimulated markets and drove values higher. Highly leveraged buyers dominated the market. In late 2008 and 2009, real estate markets experienced the most severe correction in history. Magnified by leveraged capital structures, values declined by more than 35% from peak pricing. Credit market turmoil resulted in a liquidity gap, as mortgage financing for real estate became unavailable. Buying and selling of real estate virtually stopped, resulting in very low transaction volume. The lack of transactions made it difficult for real estate appraisers to assess current market values. SERS’ real estate was not immune; consistent with the market, values declined by approximately 35%. In the aftermath of valuation declines and liquidity being drained from the markets, the severity of the global recession will take a toll on real estate operating fundamentals. Occupancy rates in all major property types are falling. Landlords are suffering with defaulting tenants and must offer rent concessions to sign new leases. Income from commercial real estate is projected to decline materially over the next 12 to 24 month period. As a lagging indicator, real estate operating conditions will not likely improve until 6 to 12 months after the economy begins to recover and job growth resumes.

SERS 2010 Annual Investment Plan 23
Domestically, a liquidity gap will create opportunities for SERS. Distress in the market will occur, but it has not yet materialized. Large volumes of commercial real estate loans were completed in the early part of this decade. When those loans mature, owners will find themselves unable to refinance at comparable loan amounts and interest rates. In addition, troubled lenders may not be able to fund previously made unfunded loan commitments. Finally, some investors in real estate used bridge loans that are short term with variable interest rates; permanent financing is currently unavailable for these borrowers.
Enhance diversification of the asset class. The real estate portfolio is currently invested in three distinct sectors: 1. Private Market Real Estate (separate accounts, core open–end commingled funds, and opportunity funds); 2. Public Real Estate Securities (shares of REITs); and 3. Timber (direct and fund investments in timberland). This approach provides the ability to tactically rebalance the program.
Private Market Real Estate Separate accounts – SERS has implemented an enhanced return strategy in its separate accounts that enable the managers to add value and increase returns. Separate accounts are the preferred structure because they provide SERS with better control, liquidity, alignment of interests, and lower cost. Core open–end funds – this strategy enables SERS to maintain a diversified base of core assets in relatively liquid funds. Opportunity funds – this strategy allows SERS to access high return investments that cannot be effectively made by the separate accounts. This strategy is diversified by manager, strategy, and vintage year.
Public Real Estate Securities Real Estate Investment Trusts (REITs) – this strategy was initiated to capitalize on the growth of this sector (most recently in
overseas markets), to provide a high dividend yield and liquidity.
Timber Timber – the timber strategy may be accessed through direct investments and fund investments and provides the portfolio with stable returns and diversification. Timber differs from commercial real estate in that it is renewable, deriving its investment return from the biological growth of the trees and the ultimate sale of the timber. The current program allocation is in compliance with recommended allocation ranges: Range Allocation Private Market Real Estate 55 – 80% (76%) Public Real Estate Securities 10 – 20% (14%) Timber 3 – 10% (10%) 2010 – 2011 Real Estate Initiatives Despite a major correction in the real estate markets, SERS’ real estate portfolio remains in an over–funded position at 9% of the total portfolio; this over–funding is amplified by the reduction in the target allocation to real estate from 8% to 7%. During the year, efforts will be made to reduce the size of the portfolio. As market conditions improve, SERS plans to selectively sell underperforming separate account assets if the conditions warrant disposition of those assets, or redeem from open–end commingled fund positions. This will serve three purposes:
1. Generate liquidity for the Fund, 2. Reduce the size of the real estate portfolio
and, 3. Reposition the separate account portfolios
to better capitalize on future market opportunities.

SERS 2010 Annual Investment Plan 24
SERS will begin to see more capital distributions from the portion of the real estate portfolio composed of fund investments as market conditions improve. This will help toward the goal of rebalancing the portfolio. New investment to the asset class will be limited to previously approved partnership and separate account commitments. Unfunded partnership commitments of approximately $300 million and separate account investments require funding for ongoing operations such as tenant improvements and maintenance requirements. Make efforts to increase the overall liquidity of the real estate portfolio to help meet SERS’ cash needs as they arise. Although the real estate portfolio is inherently illiquid, there are measures that can be implemented to enhance the overall liquidity of the portfolio. These measures include:
Reducing new limited partnership
investments for at least one year. These investments typically lock SERS into a ten– to twelve–year investment, thereby affording SERS no control over liquidation. In addition, this will serve to reduce overall portfolio fees as these investment structures are the most expensive real estate investment vehicles available to SERS.
SERS will continue to benefit from these
higher return potential investments through the $300 million of unfunded commitments to our existing portfolio of opportunity funds.
Within the direct separate account
portfolios, focusing only on purchasing new investments that do not require the participation of an outside partner if that investment requires SERS to enter into a long–term partnership agreement.
Limiting the use of any type of third–party debt that contains prepayment limitations and/or yield maintenance provisions that may restrict SERS’ ability to sell the investment.
Monitor SERS’ existing investment advisors for signs of financial or operational distress. The market downturn is causing significant financial and operational issues for separate account advisors and general partners throughout the industry. While SERS has been able to largely avoid this problem to date, other investors are dealing with issues ranging from replacing general partners or separate account advisors to making additional equity commitments to support existing investments.
With limited amount of capital available, continue to grow SERS’ private real estate exposure to overseas markets from current levels (near 5%). Globalization continues to open up new markets overseas to real estate investors. In addition, many overseas markets appear to have economies that weathered the recent capital markets crisis better and appear likely to return to growth more quickly than the United States. Finally, a growing body of research confirms the diversification benefit and return premium associated with investing in non–U.S. markets. The number of overseas opportunities available to investors like SERS has more than tripled in the last three years. In the past, SERS used commingled funds to access overseas markets, either through global allocators or through targeted investments in Asia and Latin America. In 2010, SERS will review other options available, including a growing number of commingled funds targeting specific regions, individual countries, or unique strategies within individual countries. Additionally, to maintain reasonable liquidity, other structures will be explored, including some open–end vehicles.

SERS 2010 Annual Investment Plan 25
Fixed Income Asset Class Plan Summary
Role of Fixed Income Asset Class within the SERS Fund The Fixed Income asset class is employed by the Fund to: 1) generate current income from interest
payments; 2) increase the value of the Fund through the
reinvestment of those interest payments; 3) serve as a hedge against inflation and/or
deflation; and 4) diversify the overall Fund. Long–Term Strategy for Fixed Income The long–term proposed strategic target of the Fixed Income asset class is 32.5% of the Fund, an increase from the 2009 Annual Plan long–term target of 15%. The allocation to fixed income reflects its multifaceted role within the overall Fund. Fixed income serves to meet short to intermediate–term cash flow requirements, to hedge inflation/deflation risk, to further diversify the Fund, and to seek higher total return through higher yielding strategies. There are currently three distinct segments to the SERS’ fixed income portfolio:
A. The Core Segment is currently composed
primarily of investment grade, relatively liquid, public domestic securities, including Treasury Inflation Protected Securities (TIPS);
B. The High Yield Segment is composed
primarily of less liquid, public and private securities that are credit sensitive and below investment–grade quality; and
C. The Emerging Market Debt Segment is composed primarily of less liquid public and private securities in the developing countries of the world.
The asset class is benchmarked against a blended index of the Barclays Aggregate Index, the Custom TIPS index, the Citigroup High Yield Market Index, and the J.P. Morgan Emerging Market Bond Index. The 2010 Plan recommends further diversification and expansion of the fixed income portfolio, with the core fixed income segment undergoing the most transformation. From the current target allocation of 6.0%, the core fixed income segment would expand to 15.5%. Core fixed income, considered the most conservative segment within the asset class, provides liquidity and diversification for the overall Fund. Traditionally, the segment has been benchmarked and managed to the Barclay’s Aggregate benchmark. This benchmark represents the investable universe of U.S. government, agencies, and corporations. The index is weighted based upon the outstanding debt of each issuer. The expected return and risk characteristics of a core fixed income program that meets SERS’ liquidity and return expectations are not closely aligned to the traditional benchmark. 2010–2011 Fixed Income Initiatives
An alternate approach for the core fixed income segment is to focus on liquidity and stability of expected returns. Therefore, the investable universe could consider Treasuries, customized portfolios, structured product, opportunistic strategies, and non–benchmark centric securities. Beyond Core Fixed Income, the 2010 Plan proposes adding one segment, a non–U.S. fixed income position of 5% to the overall fixed income portfolio. The plan also proposes a dedicated TIPS allocation of 4% that would no longer reside in the core fixed income segment of the portfolio.

SERS 2010 Annual Investment Plan 26
Improve diversification in the core fixed income portfolio. The Core Segment, with the current target allocation of 6% of the total Fund, consists primarily of domestic strategies that invest in relatively liquid, investment–grade, U.S. dollar denominated fixed income securities. These securities are interest rate sensitive and provide some protection against inflation and/or deflation as well as additional diversification for the Fund.
There are three components in the Core Segment. The first component is SERS’ Custom TIPS segment, which helps provide protection against inflation. The second component is primarily managed against the Barclays Aggregate Bond Index in order to capitalize on characteristics such as longer investment horizons, longer durations, higher volatilities, and more credit exposure opportunities. The third component consists of investment–grade corporate securities. The purpose of an allocation to a passive index portfolio in the fixed income structure is to provide market exposure with negligible tracking error relative to the benchmark, at a reduced management cost. Active fixed income management attempts to capture inherent inefficiencies within the market. Over longer time horizons active advisors accomplish this through sector rotation, duration management, credit spread analysis, and issue selection in order to produce excess returns over their benchmarks. The 2010 Plan recommends that the core segment be increased to 15.5% of the total Fund. As a means of providing greater diversification, research will be undertaken to evaluate the potential investment in long duration U.S. Treasuries. In addition, the TIPS that currently reside within the core segment would be considered a separate segment of the fixed income portfolio.
Create a dedicated 4% allocation to Treasury Inflation–Protected Securities (TIPS). The TIPS that are residing within the core segment will now be considered a distinct segment of the portfolio. The primary advantage of TIPS is that their return offers protection against both expected and unexpected inflation, as the securities’ coupon payments are directly tied to the rate of inflation. Therefore, TIPS maintain the purchasing power of the investor. The coupon payments of TIPS have two components: a real coupon rate that is established at the issuance of the bond, and an accrual equal to the rate of inflation which accretes to the principal balance of the security. TIPS are also useful for hedging liabilities which are affected by inflation and for hedging a cash flow stream against the need to liquidate equities and conventional bonds at depressed prices in order to meet pension obligations during periods of unexpected inflation. Establish a non–U.S. fixed income position of 5% of the Fund. The core fixed income portfolio contains only U.S. securities. Developed countries outside of the U.S. offer additional sources of return and diversification as their economies and fiscal and monetary policies differ from the U.S. Non–U.S. fixed income securities could allow SERS to take advantage of these factors. Reduce the exposure to high yield strategies from 5% to 4% of the total Fund as other strategies offer greater investment opportunities. The High Yield component focuses on debt instruments offering higher return premiums and different risk characteristics than traditional core fixed income securities. Returns are less dependent upon interest rate exposure and more dependent upon company or industry specific events, competition and the economy. These debt instruments either carry low credit ratings or are unrated. High yield debt issuers are forced to pay higher interest rates in order to attract investor capital. High yield bonds can out–perform other fixed income securities in a rising interest rate environment as they have a large

SERS 2010 Annual Investment Plan 27
current income component. If the issuing company’s fundamentals improve, or the economy strengthens, these securities tend to out–perform the core fixed income issues. This segment of the portfolio is benchmarked against the Citigroup High Yield Market Index.
Maintain target exposure to emerging market debt strategies at 4% of the Fund. The Emerging Market Debt component focuses on debt instruments offering higher return premiums and/or different risk characteristics than domestic fixed income securities. Due to the nature of emerging economies, these debt instruments carry higher yields, and therefore higher return potential, while providing diversification to the fixed income asset class and the Fund as a whole. The emerging market debt component has been constructed to offer further diversification. Investment in emerging market debt is accomplished through dollar denominated sovereign debt as well as local currency sovereign and corporate debt. The strategies that are utilized include active debt restructuring, and distressed debt investing.
Today, the outstanding amount of emerging market debt denominated in local currency exceeds that denominated in U.S. dollars, euros, and yen. In addition to locally denominated debt, local markets offer an increasingly wide array of securities, including fixed–rate, floating–rate and inflation–linked bonds and interest–rate swaps.
This segment is benchmarked against the J.P. Morgan Emerging Market Bond Index (EMBI) Research the use of an emerging manager program. Empirical data shows that young, emerging managers tend to perform very well. The reason for this performance can be traced to the smaller pool of assets they manage making them more nimble and effective at trading. In addition, these managers are driven to succeed and are focused on this objective. As a way of searching for skilled investment talent, staff and consultant will research the feasibility of adding an emerging manager program to the Fund.

Inflation Protection Strategy Plan Summary
Role of the Inflation Protection Strategy within the SERS Fund The primary purpose of the Inflation Protection strategy is twofold: 1) to provide a more reliable hedge against inflation; and 2) to provide additional diversification to the total Fund. Exposure to inflation protection assets is achieved primarily through investments in commodities and commodity–related equities, inflation–sensitive bonds, and global real estate equities. Commodities tend to have a different return pattern from broad stocks and bonds, thereby providing diversification and lowering risk to the overall Fund. Long–Term Strategy for Inflation Protection The long–term target allocation of the Inflation Protection strategy is 4% of the Fund consisting of active management. The Inflation Protection strategy is comprised of: an active component that is composed of a
multi–asset portfolio offering strong performance in rising inflation environments. This may include commodities, global equities, inflation–linked and other types of fixed income securities; and
a fund–of–funds product that invests in commodities and commodities–related equities.
The Inflation Protection strategy’s performance is measured against a customized benchmark which consists of the Goldman Sachs Commodity Index (GSCI) and the returns of a defined group of inflation–sensitive assets. Passive Commodity Portfolio All GSCI swap overlays in this portfolio were removed in the later part of 2008 to meet the Fund’s need for liquidity at that time. The
underlying cash for those commodity swap contracts continue to be invested in intermediate duration TIPS. There is no intent to enter into new GSCI swap contracts; the underlying collateral currently invested in TIPS is expected to be used to rebalance the Fund.
Diversified Inflation Protection Portfolio The Fund employs an actively managed diversified portfolio of inflation–sensitive investments to enhance the Inflation Protection strategy. These investments include actively managed commodities, commodity–related equities, global real estate equities and inflation–sensitive bonds. This portfolio currently represents 1.6% of the Fund. The diversified inflation protection portfolio over/under weights inflation sensitive investments within the portfolio. While this portfolio also utilizes commodities and TIPS, they are managed using a different approach. Unlike indexed commodities which replicate the GSCI, the manager starts with an equal weighted basket of commodities, and actively allocates individual exposures on specific commodities based on the managers’ outlook for the respective commodity. The TIPS portfolio is more actively managed based on the outlook for expected inflation, and the ability to over/under weight this exposure. The benchmark for this multi–asset portfolio is a blend of various MSCI equity indices, the MSCI World Real Estate Index, the S&P Goldman Sachs Commodity Index, and the Barclays Capital US TIPS 1–10 Year Index. Commodity Fund–of–Funds As part of the 2007 Investment Plan, staff researched an initiative to consider reallocating a portion of SERS’ Inflation Protection assets from passive to active management to add diversification, as well as to reduce the effect of negative roll–yields. The Board approved the reallocation in March 2007, and an actively–managed commodity
SERS 2010 Annual Investment Plan 28

SERS 2010 Annual Investment Plan 29
fund–of–funds was added to the Inflation Protection strategy in June 2007. Managed by a long–standing SERS advisor, this customized product is a multi–manager commodity portfolio representing 2% of the Fund, and currently employing five underlying commodities specialist managers. These managers take an active, long–biased approach to investing within the global commodity markets to provide inflation protection and diversification.
The benchmark for the fund–of–funds strategy is constructed using the performance of specific contracts within the various commodity sub–sectors. 2010–2011 Inflation Protection Initiative Based on the current structure and reduced allocation to the program in conjunction with Fund rebalancing, there are no new initiatives.

SERS 2010 Annual Investment Plan 30
Absolute Return Strategies Plan Summary Role of Absolute Return Strategies within the SERS Fund SERS has employed absolute return strategies in the portfolio for over a decade. SERS’ initial foray into absolute return strategies was a research initiative in the 1996 Annual Plan. The program was funded in 1999 through a relatively modest allocation in four market–neutral hedge funds. In 2002, with the goal of diversifying the sources of alpha, SERS adopted a highly diversified fund–of–hedge funds approach to this program, which is currently broadly invested in over 250 unique underlying managers, employing eight major strategies and over 21 different sub–strategies. Absolute return strategies were coupled with S&P 500 and MSCI EAFE swaps to attain exposure to the public markets. These two components were referred to as SERS portable alpha program, a strategy viewed as an alternative to traditional long–only active management in large cap stocks. The portable alpha strategy was eliminated in January, 2009. SERS absolute return strategies program currently comprises 24% of the overall Fund. However, in order to achieve SERS liquidity goals to rebalance the overall portfolio towards its long–term targets, this program is being systematically reduced towards a long–term target allocation of 9% of Fund assets.
Long–Term Strategy SERS’ recently modified objective with the absolute return strategies program is designed to achieve absolute returns that generally have either low or uncorrelated returns to many markets. SERS’ absolute return strategies are designed to seek out a broad range of global investment opportunities, strategies, and management styles to identify and exploit market opportunities. This approach helps to reduce risk and stabilize expected returns for the Fund. The program is a conservative, well–diversified, low–volatility investment strategy modeled to generate modest annual returns. Utilizing the fund–of–hedge funds approach allows SERS to achieve greater levels of manager oversight, with the fund–of–hedge funds managers providing enhanced due diligence, portfolio monitoring, and state–of–the–art risk management systems. 2010–2011 Absolute Return Strategy Initiatives Since this program is being resized to its long–term target of 9% of the Fund, there are currently no new initiatives in the structure of the program; however, because of the versatility built into the program SERS fund–of–hedge funds managers continue to allocate capital to new opportunities to ensure the absolute return program continues to add value in the future. In addition, SERS will continue to carefully monitor underlying manager and fund level liquidity to ensure that this program continues to meet overall fund redemption/cash flow objectives while achieving prescribed return objectives.

Cash Plan Summary
Role of Cash Asset Class within the SERS Fund Historically, the Cash asset class has been employed by the Fund to provide for SERS’ liquidity needs as well as accumulate funds for future permanent investment. The asset class emphasizes the use of higher credit quality debt instruments which are liquid and have short maturities and durations, or which have floating rates and have historically been invested in the Treasury’s Short–Term Investment Fund (STIF), and more recently in a fund managed by NISA. Long–Term Strategy for Cash Ensure adequate liquidity to meet transactional needs. On an asset allocation basis, cash has the lowest expected return of all asset classes. Therefore, since SERS is a long–term investor, other than cash required to meet immediate needs, the objective is to minimize exposure to this asset and maintain a long–term allocation to the Cash asset class of zero. Cash payments to meet the Fund’s benefit payments and other obligations are sourced through employee and employer contributions, limited partnership distributions, and raising cash from public market managers from time to time. Contributions are a predictable source of cash flow, but are inadequate to meet continuing benefit obligations. Distributions from limited partnerships are unpredictable and dependent on market conditions and terms of partnership agreements. Accordingly, raising cash from public market equity, fixed income, and fund–of–hedge funds managers is required to meet monthly cash flow requirements.
2010 – 2011 Cash Initiatives Securitize large cash balances in excess of immediate liquidity needs. The credit crisis, in conjunction with increasing benefits, less than normal cash contributions, and an over allocation to less liquid asset classes, accentuates the need for the Fund to use all means to induce the asset allocation in the direction of the target allocations while carefully managing the liquidity needs of the Fund. The economic crises resulted in suspending the Fund’s rebalancing initiatives in favor of raising liquidity. Over the next twelve months, staff and consultant will continually evaluate strategies that will: Seek to raise liquidity in a measured
fashion while controlling transaction costs and market impact,
Move the fund closer toward the long–term policy target,
Keep the Fund’s risk/reward profile as though excess cash were invested in physical investments,
Continue to Evaluate Participation in the Security Lending Program. In 2008, SERS temporarily restructured its participation in the Security Lending program. The restructuring was necessitated as an action to enhance the Fund’s liquidity profile and was due primarily to the seizing up of credit markets and the absence of fair values for the underlying investments in the collateral investment pool. In 2010 staff will continue to monitor the program using a measured approach to determine the utility of participating in the program and whether to: Continue to reduce exposure, Maintain current levels of participation, or As markets stabilize and visibility
improves, return to full participation.
SERS 2010 Annual Investment Plan 31

SERS 2010 Annual Investment Plan 32
Corporate Governance Summary
Role of Corporate Governance within the SERS Fund SERS has been a long–time advocate of good corporate governance practices which serves to protect and preserve the assets of the Fund. The U.S. Department of Labor has opined that pension fund fiduciaries have an obligation to engage in specific corporate governance activities such as proxy voting. Investor voting rights are considered to be assets of the Fund. SERS is a shareowner in each of the companies it holds in its stock portfolios. Attention to corporate governance promotes responsible business practices that serve as an integral component to a company’s long–term value creation. Long–Term Strategy for Corporate Governance SERS continues to be involved in efforts to improve the corporate governance practices of the companies owned within SERS’ portfolio to protect and grow the value of these assets. SERS’ ongoing corporate governance program includes the following: Institutional Shareholder Services (ISS) – Continue SERS’ partnership with ISS to vote SERS proxies and to review and implement current “best practices” outlined in SERS’ proxy voting guidelines, which are updated and approved by the SERS Board annually. SERS Board–approved domestic and international proxy voting guidelines and the Fund’s proxy votes are regularly updated and available to the public on SERS’ website.
Council of Institutional Investors (CII) – Maintain SERS’ active membership in CII, which represents 140 pension fund members whose collective assets exceed $3 trillion. CII is recognized as a significant national voice for institutional shareholder interests. By working together with CII, SERS seeks to promote corporate governance reforms at the statutory and regulatory level. 2010–2011 Corporate Governance Initiatives Maintain SERS’ proactive Corporate Governance involvement. SERS continues to proactively support shareholder resolutions at SERS’ portfolio companies to adopt majority–vote standards in their director election processes. Boards must be held accountable if there is to be positive corporate change. The more effective way to hold boards accountable is to have board directors elected by shareowners through a majority vote. SERS Board has adopted a majority voting policy. SERS will continue its advocacy role in promoting corporate governance reforms by communicating in writing and in person through informal and formal public meetings with legislative, regulatory, legal and related corporate governance oversight entities. These may include the U.S. Congress, Securities and Exchange Commission, Financial Accounting Standards Board, Public Company Accounting Oversight Board, American Bar Association, Delaware Bar Association, National Stock Exchanges, and Regional Stock Exchanges.

Section 4
Appendix
Section 4Appendix

CONFIDENTIAL 2010 Annual Plan Appendix A-1
Appendix
For informational purposes, the Appendix
contains projected asset values and cash flows
stated in dollar amounts for the total Fund,
separate asset classes, and management styles
within each asset class. The projections are
based upon the assumption that the long term
expected returns are achieved in each and
every year; in fact, this will not happen, and
these projected dollar amounts are important
for illustrative purposes only.
These absolute numbers give a sense of the
potential magnitude of growth and general
direction of the Fund. They are more
important in the aggregate than in the specific
and should not be considered as commitments
to asset classes. Plan initiatives and market
conditions will alter actual results from the
projections. The plan is based on percentage
weightings as described in the introduction to
this report, and not these projected dollar
amounts.

SERS Cash Flow Projections(millions of dollars)
Total Employer & Employee
SERS Investment
Benefits and
SERS Ending Fund
Year Employee Employer Contributions Return Expenses Market Value
1990 Actual 175 418 593 111 607 9,7641991 Actual 183 381 564 2,156 664 11,8201992 Actual 187 319 506 926 851 12,4121993 Actual 190 304 494 1,525 781 13,6501994 Actual 193 343 536 -149 812 13,2251995 Actual 202 385 587 3,260 894 16,1781996 Actual 210 374 584 2,703 943 18,5201997 Actual 213 324 537 3,173 1,037 21,1931998 Actual 222 311 533 3,333 1,080 23,9791999 Actual 224 270 494 4,771 1,248 27,9962000 Actual 232 168 400 608 1,198 27,8062001 Actual 240 77 317 -2,174 1,266 24,6832002 Actual 304 51 355 -2,631 1,450 20,9572003 Actual 308 68 376 4,940 1,656 24,6172004 Actual 302 106 408 3,614 1,880 26,7592005 Actual 306 147 453 3,797 1,966 29,0432006 Actual 317 196 513 4,487 1,943 32,1002007 Actual 334 242 576 5,227 2,361 35,5422008 Actual 337 233 570 -9,886 2,231 23,9952009 Estimated 337 224 561 1,911 2,367 24,1002010 347 284 631 2,067 2,507 24,2912011 358 436 794 2,098 2,659 24,5242012 370 1,139 1,509 2,109 2,812 25,3302013 382 1,894 2,276 2,077 2,965 26,7182014 395 2,026 2,421 2,014 3,121 28,032
This table uses actuarial projections combined with SERS investment assumptions to demonstratethe general direction of cash flows and Fund growth. Consistent application of actuarialmethodologies would generate different specific numbers but would substantiate the generaldirection depicted.
CONFIDENTIAL 2010 Annual Plan Appendix A-2
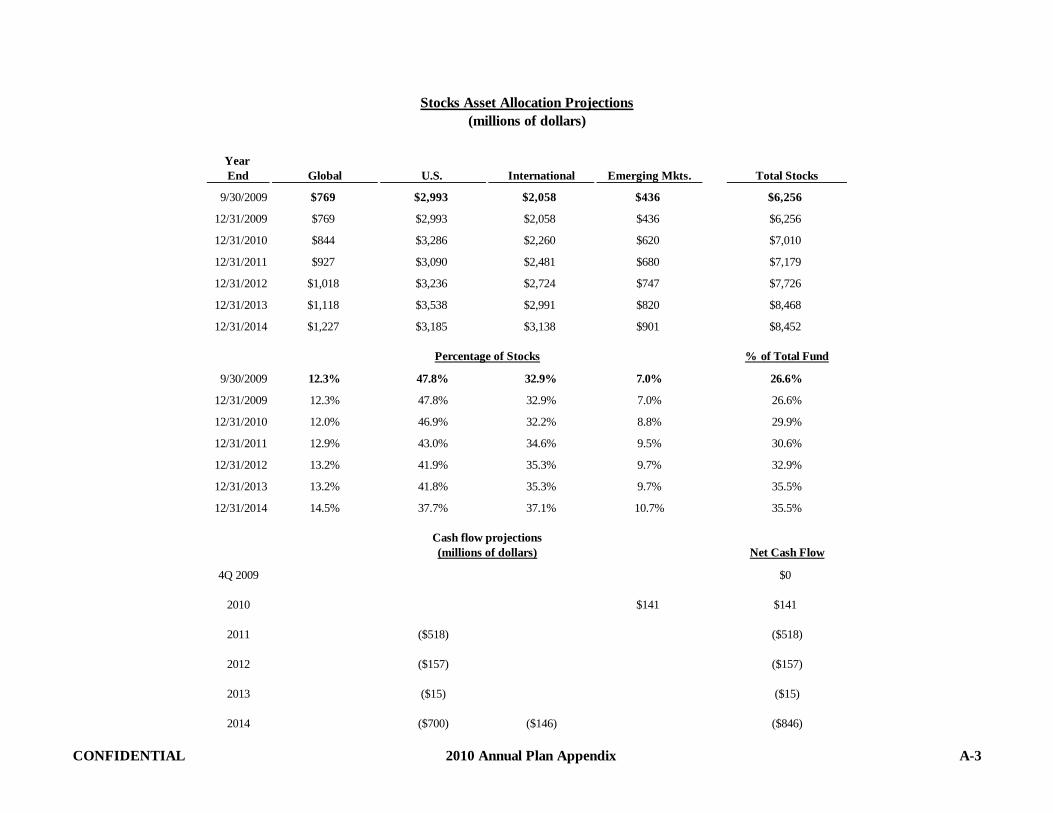
Stocks Asset Allocation Projections(millions of dollars)
Year End Global U.S. International Emerging Mkts. Total Stocks
9/30/2009 $769 $2,993 $2,058 $436 $6,256
12/31/2009 $769 $2,993 $2,058 $436 $6,256
12/31/2010 $844 $3,286 $2,260 $620 $7,010
12/31/2011 $927 $3,090 $2,481 $680 $7,179
12/31/2012 $1,018 $3,236 $2,724 $747 $7,726
12/31/2013 $1,118 $3,538 $2,991 $820 $8,468
12/31/2014 $1,227 $3,185 $3,138 $901 $8,452
% of Total Fund
9/30/2009 12.3% 47.8% 32.9% 7.0% 26.6%
12/31/2009 12.3% 47.8% 32.9% 7.0% 26.6%
12/31/2010 12.0% 46.9% 32.2% 8.8% 29.9%
12/31/2011 12.9% 43.0% 34.6% 9.5% 30.6%
12/31/2012 13.2% 41.9% 35.3% 9.7% 32.9%
12/31/2013 13.2% 41.8% 35.3% 9.7% 35.5%
12/31/2014 14.5% 37.7% 37.1% 10.7% 35.5%
Net Cash Flow
4Q 2009 $0
2010 $141 $141
2011 ($518) ($518)
2012 ($157) ($157)
2013 ($15) ($15)
2014 ($700) ($146) ($846)
(millions of dollars)
Percentage of Stocks
Cash flow projections
CONFIDENTIAL 2010 Annual Plan Appendix A-3

Alternative Investments Asset Allocation Projections(millions of dollars)
Year Total SERSEnd Alternative Investments
12/31/2010 $25012/31/2011 $30012/31/2012 $42512/31/2013 $42512/31/2014 $425
% of Total Fund
12/31/2010 25.2%12/31/2011 24.5%12/31/2012 22.5%12/31/2013 19.3%12/31/2014 15.5%
Net Cash Flow
2010 ($163)2011 $6552012 $1,1312013 $1,4322014 $1,557
CONFIDENTIAL 2010 Annual Plan Appendix A-4

Total TotalYear Pooled Separate Total SERSEnd Accounts Accounts Real Estate
2010 $670.8 $1,423.9 $2,094.72011 $686.0 $1,495.5 $2,181.52012 $716.5 $1,520.0 $2,236.52013 $682.8 $1,524.4 $2,207.22014 $545.6 $1,487.8 $2,033.4
% of Total Fund2010 32.0% 68.0% 100.0% 9.0%2011 31.4% 68.6% 100.0% 9.4%2012 32.0% 68.0% 100.0% 9.5%2013 30.9% 69.1% 100.0% 9.3%2014 26.8% 73.2% 100.0% 8.6%
NetCash Flow
2010 ($8) ($41) ($49)2011 ($35) ($33) ($68)2012 ($19) ($84) ($103)2013 ($82) ($105) ($187)2014 ($179) ($145) ($323)
Assumptions:Real Estate Income return = 2.0%Real Estate Appreciation return = 5.4%
Cash Flow Projections(millions of dollars)
Real Estate Asset Allocation Projections(millions of dollars)
Percentage of Real Estate
CONFIDENTIAL 2010 Annual Plan Appendix A-5

Fixed Income Allocation Projections(millions of dollars)
End ABS Core Other Core TIPS Non - US Fixed High Yield EMD Total Fixed Income
9/30/2009 $0 $971 $0 $0 $826 $1,012 $2,809
12/31/2009 $0 $981 $313 $0 $834 $1,022 $3,150
12/31/2010 $0 $1,040 $356 $0 $884 $1,083 $3,364
12/31/2011 $0 $1,102 $378 $59 $937 $1,126 $3,603
12/31/2012 $0 $1,168 $400 $109 $994 $1,204 $3,875
12/31/2013 $0 $1,238 $424 $210 $1,053 $1,224 $4,150
12/31/2014 $0 $1,312 $450 $1,342 $1,116 $1,298 $5,519
Percentage of Fixed Income % of Total Fund
9/30/2009 0.0% 34.6% 0.0% 0.0% 29.4% 36.0% 11.9%
12/31/2009 0.0% 31.1% 9.9% 0.0% 26.5% 32.4% 13.4%
12/31/2010 0.0% 30.9% 10.6% 0.0% 26.3% 32.2% 14.3%
12/31/2011 0.0% 30.6% 10.5% 1.6% 26.0% 31.3% 15.3%
12/31/2012 0.0% 30.1% 10.3% 2.8% 25.6% 31.1% 16.5%
12/31/2013 0.0% 29.8% 10.2% 5.1% 25.4% 29.5% 17.6%
12/31/2014 0.0% 23.8% 8.1% 24.3% 20.2% 23.5% 23.4%
Cash Flow Projections Net(millions of dollars) Cash Flow
4Q 2009 $310 $310
2010 $23 $23
2011 $56 $56
2012 $43 $43
2013 $90 $90
2014 $1,056 $1,056
CONFIDENTIAL 2010 Annual Plan Appendix A-6

Inflation Protection Strategy Allocation Projections(millions of dollars)
Year Total SERSEnd Inflation Protection
9/30/2009 $1,48512/31/2009 $1,54712/31/2010 $95412/31/2011 $94812/31/2012 $95512/31/2013 $95612/31/2014 $956
% of Total Fund9/30/2009 6.6%
12/31/2009 6.6%12/31/2010 4.1%12/31/2011 4.0%12/31/2012 4.1%12/31/2013 4.0%12/31/2014 4.1%
Net Cash Flow2009 $552010 ($643)2011 ($56)2012 ($43)2013 ($50)2014 ($50)
CONFIDENTIAL 2010 Annual Plan Appendix A-7
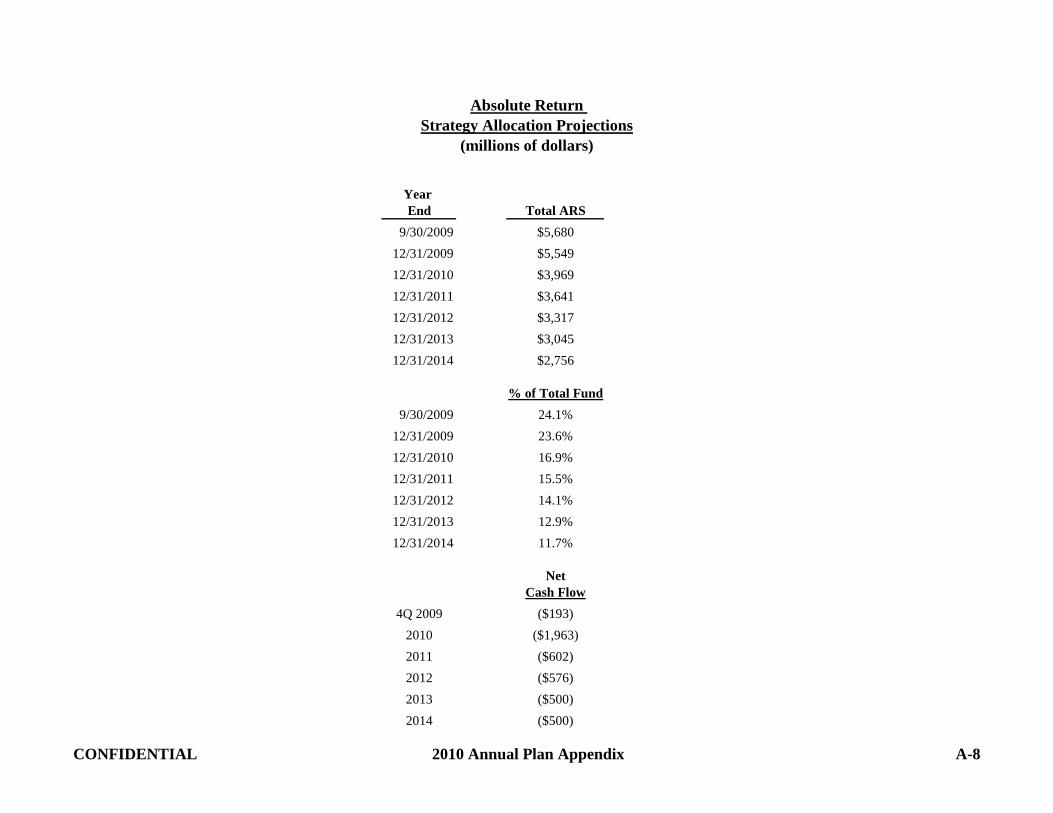
Absolute Return Strategy Allocation Projections
(millions of dollars)
Year End Total ARS
9/30/2009 $5,680
12/31/2009 $5,549
12/31/2010 $3,969
12/31/2011 $3,641
12/31/2012 $3,317
12/31/2013 $3,045
12/31/2014 $2,756
% of Total Fund
9/30/2009 24.1%
12/31/2009 23.6%
12/31/2010 16.9%
12/31/2011 15.5%
12/31/2012 14.1%
12/31/2013 12.9%
12/31/2014 11.7%
NetCash Flow
4Q 2009 ($193)
2010 ($1,963)
2011 ($602)
2012 ($576)
2013 ($500)
2014 ($500)
CONFIDENTIAL 2010 Annual Plan Appendix A-8