annual report 2016 - randall & quilter investment … strategic report corporate governance...
TRANSCRIPT

Randall & Quilter Investment Holdings Ltd.
Annual Report 2016
Randall & Q
uilter Investment H
oldings Ltd. Annual Report 2016

The specialist non-life insurance
acquirer, service provider and underwriting manager
Randall & Quilter Investment Holdings Ltd. has pursued a buy and build strategy to create a comprehensive
range of investment activities and services in the global non-life insurance market.
MissionTo continue to make value enhancing insurance acquisitions, to
build an underwriting management platform to attract best-in-class underwriting teams and to deliver high levels of service to our ‘live’
and ‘legacy’ insurance market clients.
Overview01 At a glance02 Chairman’s Statement
Strategic Report08 Our Business Model10 Group Strategy and Performance12 Divisional Reviews 12 Insurance Investments 14 Insurance Services 16 Underwriting Management18 Risk Management22 Principal Risks and Uncertainties
Corporate Governance28 Board of Directors30 Governance Report
Financial Statements34 Independent Auditors’ Report35 Consolidated Income
Statement 36 Consolidated Statement
of Comprehensive Income37 Consolidated Statement
of Changes in Equity38 Consolidated Statement
of Financial Position39 Consolidated Cash Flow
Statement 40 Notes to the Consolidated
Financial Statements87 Shareholder Information
Contents
01
Financial StatementsCorporate GovernanceStrategic Report
Randall & Quilter Investment Holdings Ltd.Annual Report 2016
At a Glance
Insurance InvestmentsWe have a proven track record in providing exit solutions to discontinued non-life insurance companies, captives and self-insurers. We also provide underwriting capital to our managed Lloyd’s Syndicates and acquire insurance and reinsurance debt positions.
Underwriting ManagementWe manage live and run-off syndicates and own MGAs, providing specialist distribution to third party syndicates and reinsurers. We also own Accredited, an A-rated US admitted carrier, which will predominantly underwrite on behalf of our live syndicate and other authorised reinsurers.
Insurance ManagementWe offer accounting and regulatory compliance services in many captive domiciles worldwide.
Insurance ServicesWe provide a specialist range of claims management, reinsurance collection and premium credit control services to both the live and legacy insurance and reinsurance markets.
For more information visit Page 12
For more information visit Page 16
For more information visit Page 14
For more information visit Page 14

02
Randall & Quilter Investment Holdings Ltd.Annual Report 2016
Chairman’s Statement
I am pleased to report that, as indicated in the recent placing announcement, the Group traded very well in the second half of 2016 with full year profits ahead of Board expectations and significantly higher than the prior year.
K E RandallChairman and Chief Executive Officer
I am pleased to report that, as indicated in the recent placing announcement, the Group traded very well in the second half of 2016 with full year profits ahead of Board expectations and significantly higher than the prior year.
In addition, the balance sheet was boosted by further foreign exchange related gains, partly offset by adverse movements in the IFRS calculation of the pension deficit. Completion of 15 legacy transactions during the year and further net reserve releases from the insurance companies in run-off were the primary drivers.
This profitable trading means that proposed distributions per share have been increased for the first time since 2012 to 8.6p for the full year, a demonstration of the Board’s confidence in the Group’s trading and prospects. The Board proposes a final payment of 5.2p per share due on or around 15 June, subject to customary approvals.
The simplification of the Group’s business model continues, with certain non-core operations identified for disposal. This will enable a renewed focus on our core business areas where we believe there is exciting growth potential, the likes of which we have not seen for some time. These areas include the acquisition/assumption of run-off portfolios and building recurring commission revenue from using our licensed carriers in the US and EU to write niche and profitable books of property and casualty business, largely ceded to highly rated reinsurers.
The Board has a positive outlook for the current year and was delighted with the support it received from the Group’s shareholders in the recent placing to help fund our growth. The pipeline of potential legacy transactions is outstanding with a diverse range of small to mid-sized opportunities. This is especially the case in North America, where we are reaping the rewards from the expansion of our product offering and stronger distribution.
The continued growth in virtual insurers such as MGAs, looking for carriers backed with reinsurance or alternative capital, is highly supportive of the commission-based business model being deployed in Accredited, our A- rated carrier in the US. A similar model is now being finalised in R&Q Insurance Malta, which has the added benefit of having secure EU-wide licenses in a post-Brexit world. The pipeline of programmes for both carriers is extremely strong with underwriting on a number of these expected to commence in the coming months, the financial benefits of which will be particularly notable during 2018 once a full year’s earning pattern is established.
Strategy and business modelThe overall mission and purpose of the Group is to offer investors profits and capital extractions from legacy non-life insurance acquisitions/reinsurances and grow service revenue and commission income from its licensed carriers in the US and EU/UK, writing niche and profitable business, largely on behalf of highly rated reinsurers.
Our main strategic objectives are to:
• acquire or reinsure run-off insurance companies/portfolios to produce attractive cash returns;
• generate repeatable and growing commission income from Accredited and R&Q Insurance Malta, fast developing as attractive conduits for niche books of MGA business to highly rated reinsurers; and
• provide specialist insurance services to the live, run-off and captive markets.

03
Financial StatementsCorporate GovernanceStrategic Report
Randall & Quilter Investment Holdings Ltd.Annual Report 2016
Operational highlights
– Excellent contribution from 15 completed legacy transactions, with especially strong growth in North America
– Continued good performance in the UK operations of the Insurance Services Division but widening losses in the US as a result of further investment in the Healthcare initiative
– Successful sale of the Synergy book to Plum Underwriting during early 2016, part of the Group’s renewed focus on its core business areas
– Issue of $20m Tier 2 Capital in December from R&Q Re (Bermuda) to fund further legacy growth in North America
Financial highlights
Profit on ordinary activities before income tax
£8.5m2015 £2.8m2016 £8.5m
Net reserve releases from run-off insurance companies
£7.9m2015 £8.3m2016 £7.9m
Return on tangible equity
13.5%2015 4.4%2016 13.5%
Investment return on the Group’s Investments*
2.7%2015 1.1%2016 2.7%
Book value share excluding goodwill
107.4p2015 98.5p2016 107.4p
Earnings per share
11.7p2015 4.2p2016 11.7p
Proposed Distributions per share
8.6p2015 8.4p2016 8.6p
With a final proposed distribution of 5.2p (2015 : 5.0p) payable on or around 8 June, 2017
* Excluding intercompany loans
04
Randall & Quilter Investment Holdings Ltd.Annual Report 2016
Chairman’s Statementcontinued
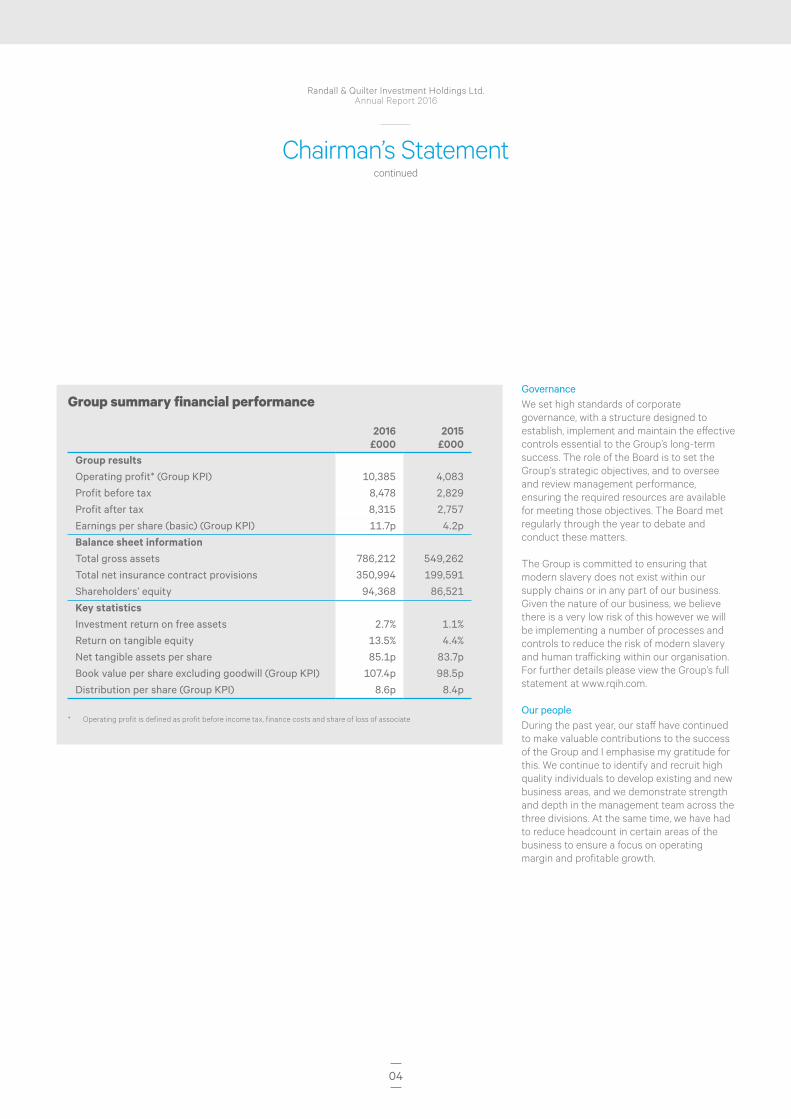
Group summary financial performance
2016£000
2015£000
Group resultsOperating profit* (Group KPI) 10,385 4,083
Profit before tax 8,478 2,829
Profit after tax 8,315 2,757
Earnings per share (basic) (Group KPI) 11.7p 4.2p
Balance sheet informationTotal gross assets 786,212 549,262
Total net insurance contract provisions 350,994 199,591
Shareholders’ equity 94,368 86,521
Key statisticsInvestment return on free assets 2.7% 1.1%
Return on tangible equity 13.5% 4.4%
Net tangible assets per share 85.1p 83.7p
Book value per share excluding goodwill (Group KPI) 107.4p 98.5p
Distribution per share (Group KPI) 8.6p 8.4p
* Operating profit is defined as profit before income tax, finance costs and share of loss of associate
GovernanceWe set high standards of corporate governance, with a structure designed to establish, implement and maintain the effective controls essential to the Group’s long-term success. The role of the Board is to set the Group’s strategic objectives, and to oversee and review management performance, ensuring the required resources are available for meeting those objectives. The Board met regularly through the year to debate and conduct these matters.
The Group is committed to ensuring that modern slavery does not exist within our supply chains or in any part of our business. Given the nature of our business, we believe there is a very low risk of this however we will be implementing a number of processes and controls to reduce the risk of modern slavery and human trafficking within our organisation. For further details please view the Group’s full statement at www.rqih.com.
Our peopleDuring the past year, our staff have continued to make valuable contributions to the success of the Group and I emphasise my gratitude for this. We continue to identify and recruit high quality individuals to develop existing and new business areas, and we demonstrate strength and depth in the management team across the three divisions. At the same time, we have had to reduce headcount in certain areas of the business to ensure a focus on operating margin and profitable growth.
05
Financial StatementsCorporate GovernanceStrategic Report
Randall & Quilter Investment Holdings Ltd.Annual Report 2016
Outlook2017 is expected to be a year characterised by further profit growth and strong strategic focus.
The Group is confident in further increasing the contribution from its legacy acquisition activity. The existing legacy portfolios continue to run-off satisfactorily and more certainty has been brought to R&Q Re (US) through active claims management and yield increases on the substantially higher invested balances following recent commutation activity.
Meanwhile, consistent with earlier comments, as part of the simplification of our business model, the Group continues to look to rebalance its live underwriting commitment and dispose of certain non-core businesses. This will help simplify the Group’s operations and reduce the substantial overhead expense.
The recent placing, raising c. £17.9m, allows the deployment of additional capital in legacy transactions, where returns continue to be attractive. Part of the proceeds will also be used to grow the balance sheets of Accredited and R&Q Insurance Malta where we have excellent prospects for generating fast-growing commissions from writing programme business primarily ceded to highly rated reinsurers.
Legacy broking and premium credit control services in the UK offer promising avenues of profitable growth in Insurance Services whilst turnkey prospects and cost reductions outside the managing agency should lead to improving results in Underwriting Management.
Investment yields still remain low but are beginning to rise, which bodes well for future returns.
We believe the Group is well positioned to benefit from some of the most promising growth areas in the non-life insurance market, namely legacy and the provision of licensed paper to write programme (MGA) business. We look forward to 2017 and beyond with significant confidence, having delivered a strong improvement in the financial performance of the Group during the past year.
Ken RandallChairman
Insurance Investments Insurance Services Underwriting Management
For more information visit Page 12
For more information visit Page 14
For more information visit Page 16
Strategic Report
Contents
08 Our Business Model
10 Group Strategy
and Performance
Divisional Reviews
12 Insurance Investments
14 Insurance Services
16 Underwriting Management
18
Risk Management
22 Principal Risks
and Uncertainties

08
Randall & Quilter Investment Holdings Ltd.Annual Report 2016
Fina
nce
Expertise
Services
Specialist
Acquisition
Reputation Funding
Multi-platform deliveryU
nderwriting
Reinvestment£
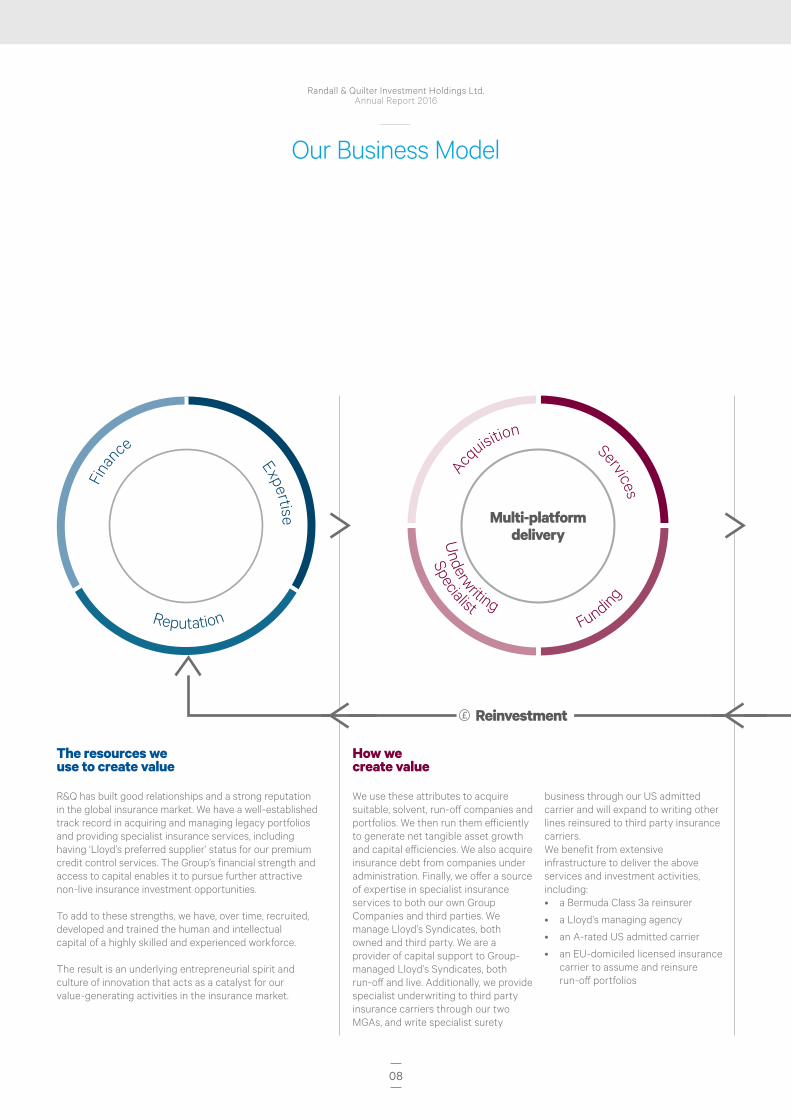
Our Business Model
The resources we use to create value
R&Q has built good relationships and a strong reputation in the global insurance market. We have a well-established track record in acquiring and managing legacy portfolios and providing specialist insurance services, including having ‘Lloyd’s preferred supplier’ status for our premium credit control services. The Group’s financial strength and access to capital enables it to pursue further attractive non-live insurance investment opportunities.
To add to these strengths, we have, over time, recruited, developed and trained the human and intellectual capital of a highly skilled and experienced workforce.
The result is an underlying entrepreneurial spirit and culture of innovation that acts as a catalyst for our value-generating activities in the insurance market.
How we create value
We use these attributes to acquire suitable, solvent, run-off companies and portfolios. We then run them efficiently to generate net tangible asset growth and capital efficiencies. We also acquire insurance debt from companies under administration. Finally, we offer a source of expertise in specialist insurance services to both our own Group Companies and third parties. We manage Lloyd’s Syndicates, both owned and third party. We are a provider of capital support to Group-managed Lloyd’s Syndicates, both run-off and live. Additionally, we provide specialist underwriting to third party insurance carriers through our two MGAs, and write specialist surety
business through our US admitted carrier and will expand to writing other lines reinsured to third party insurance carriers. We benefit from extensive infrastructure to deliver the above services and investment activities, including:• a Bermuda Class 3a reinsurer
• a Lloyd’s managing agency
• an A-rated US admitted carrier
• an EU-domiciled licensed insurance carrier to assume and reinsure run-off portfolios
09
Financial StatementsCorporate GovernanceStrategic Report
Randall & Quilter Investment Holdings Ltd.Annual Report 2016
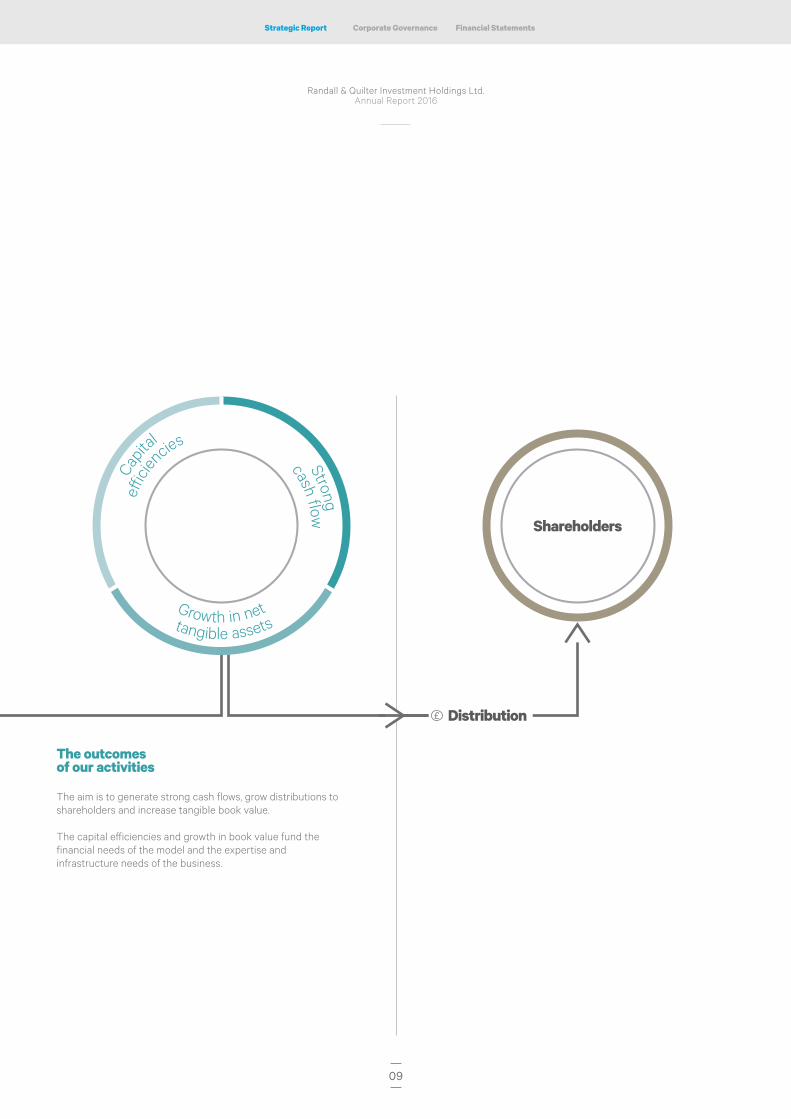
Growth in nettangible assets
cash flowStrong
Capit
al
eff ic
ien
cies
Shareholders
Distribution£
The outcomes of our activities
The aim is to generate strong cash flows, grow distributions to shareholders and increase tangible book value.
The capital efficiencies and growth in book value fund the financial needs of the model and the expertise and infrastructure needs of the business.

10
Randall & Quilter Investment Holdings Ltd.Annual Report 2016
To continue to make value enhancing insurance acquisitions, to build an underwriting management platform to attract best-in-class underwriting teams and to deliver high levels of service to our ‘live’ and ‘legacy’ insurance market clients.
Group Strategy and Performance
We made good progress in 2016, and set out our plans to continue towards achieving
our four strategic objectives.
Strategic objectives Progress in 2016 Strategic plan
To acquire legacy-related insurance assets which, through structural innovation, active management and deep expertise, will generate attractive returns with short to medium-term payback.
Fifteen transactions completed in the year – eleven acquisitions and four retrospective reinsurance. Contribution of £16.2m from goodwill on bargain purchase in addition to reinsurance premium.
Continue to use Malta as a transferee company for EEA portfolio transfers and as intra-Group consolidator. Expand retrospective reinsurance activity in US, especially in workers’ compensation, through Bermuda and US cell structures.
To provide a focused, high-quality and competitive service offering to the live and legacy markets, generating sustainable and attractive operating margins.
Continued operating margins in the UK broker services above 20% and good results in Bermuda Captive Manager which achieved c.20% operating margin.
Capitalise further on market-leading position in premium credit control/binder management and broker run-off. US focus on accounting services, workers’ compensation tool, legacy broking (RTU) and developing the healthcare initiative.
To develop Accredited, our A-rated US admitted carrier in the United States, with diversified sources of non-underwriting income.
Continued expansion of licences and writing loss portfolio transfers and novations for legacy business.
Develop Accredited into a specialist admitted carrier with nationwide licenses in a number of new insurance classes. Risks to be reinsured to Group entities and other authorised reinsurers. Model focused on fee generation through accessing a quality, well-controlled underwriting account.
To develop a valuable Lloyd’s-centric specialist insurance business, supported by a majority of third party capital, thereby generating strong fee income for the Group.
We broadly maintain our underwriting commitment for the 2017 year of account.
Increasing focus on syndicate management rather than deployment of underwriting capital. Development of strategic partnerships with entities looking for long-term access to Lloyd’s.
Our mission

11
Financial StatementsCorporate GovernanceStrategic Report
Randall & Quilter Investment Holdings Ltd.Annual Report 2016
Divisional review
For more information visit Page 12
For more information visit Page 14
For more information visit Page 16
Group KPIs
Operating profit (£000)
£10,3852015 4,0832016 10,385
Book value per share excluding goodwill
107.4p2015 98.5p2016 107.4p
Distributions per share
8.6p2015 8.4p2016 8.6p
Earnings per share (basic)
11.7p2015 4.2p2016 11.7p
Divisional KPIs
Insurance Investments total income (£000)
£51,2712015 25,3102016 51,271
Insurance Services total income (£000)
£29,5422015 39,0902016 29,542
Underwriting Management total income (£000)
£21,3672015 23,9772016 21,367
12
Randall & Quilter Investment Holdings Ltd.Annual Report 2016
Divisional ReviewInsurance Investments
Financial summary
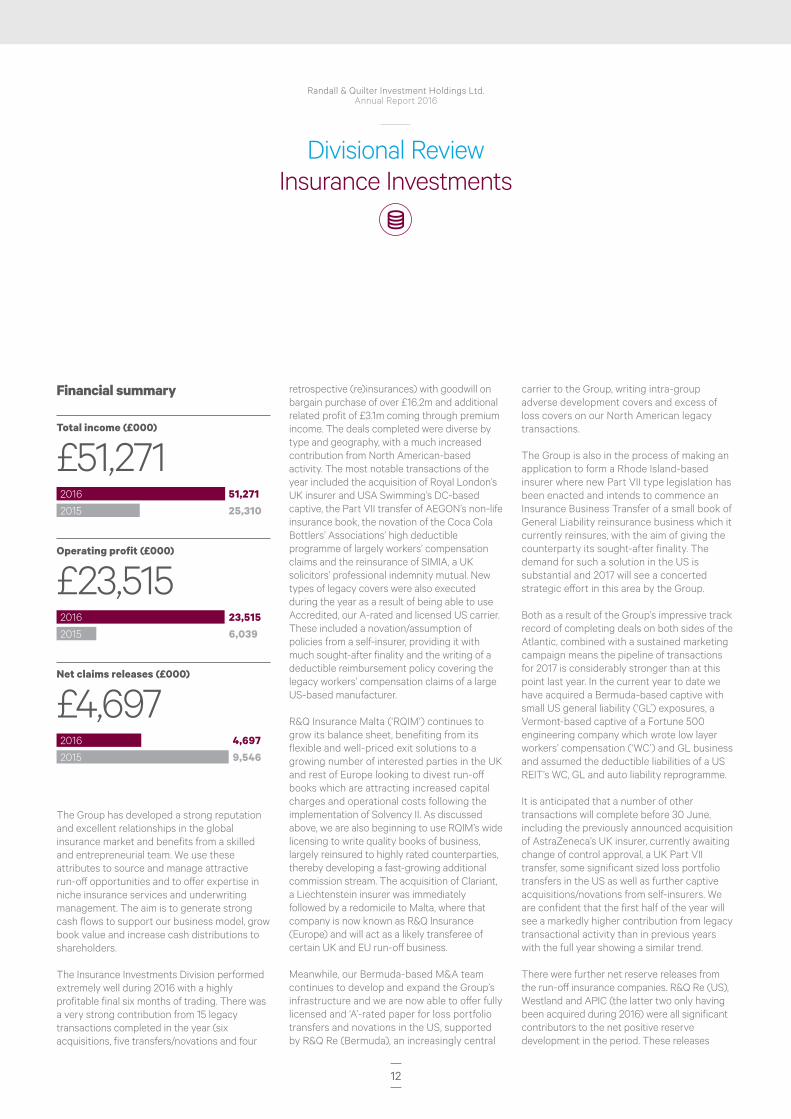
Total income (£000)
£51,2712015 25,3102016 51,271
Operating profit (£000)
£23,5152015 6,0392016 23,515
Net claims releases (£000)
£4,6972015 9,5462016 4,697
The Group has developed a strong reputation and excellent relationships in the global insurance market and benefits from a skilled and entrepreneurial team. We use these attributes to source and manage attractive run-off opportunities and to offer expertise in niche insurance services and underwriting management. The aim is to generate strong cash flows to support our business model, grow book value and increase cash distributions to shareholders.
The Insurance Investments Division performed extremely well during 2016 with a highly profitable final six months of trading. There was a very strong contribution from 15 legacy transactions completed in the year (six acquisitions, five transfers/novations and four
retrospective (re)insurances) with goodwill on bargain purchase of over £16.2m and additional related profit of £3.1m coming through premium income. The deals completed were diverse by type and geography, with a much increased contribution from North American-based activity. The most notable transactions of the year included the acquisition of Royal London’s UK insurer and USA Swimming’s DC-based captive, the Part VII transfer of AEGON’s non-life insurance book, the novation of the Coca Cola Bottlers’ Associations’ high deductible programme of largely workers’ compensation claims and the reinsurance of SIMIA, a UK solicitors’ professional indemnity mutual. New types of legacy covers were also executed during the year as a result of being able to use Accredited, our A-rated and licensed US carrier. These included a novation/assumption of policies from a self-insurer, providing it with much sought-after finality and the writing of a deductible reimbursement policy covering the legacy workers’ compensation claims of a large US-based manufacturer.
R&Q Insurance Malta (‘RQIM’) continues to grow its balance sheet, benefiting from its flexible and well-priced exit solutions to a growing number of interested parties in the UK and rest of Europe looking to divest run-off books which are attracting increased capital charges and operational costs following the implementation of Solvency II. As discussed above, we are also beginning to use RQIM’s wide licensing to write quality books of business, largely reinsured to highly rated counterparties, thereby developing a fast-growing additional commission stream. The acquisition of Clariant, a Liechtenstein insurer was immediately followed by a redomicile to Malta, where that company is now known as R&Q Insurance (Europe) and will act as a likely transferee of certain UK and EU run-off business.
Meanwhile, our Bermuda-based M&A team continues to develop and expand the Group’s infrastructure and we are now able to offer fully licensed and ‘A’-rated paper for loss portfolio transfers and novations in the US, supported by R&Q Re (Bermuda), an increasingly central
carrier to the Group, writing intra-group adverse development covers and excess of loss covers on our North American legacy transactions.
The Group is also in the process of making an application to form a Rhode Island-based insurer where new Part VII type legislation has been enacted and intends to commence an Insurance Business Transfer of a small book of General Liability reinsurance business which it currently reinsures, with the aim of giving the counterparty its sought-after finality. The demand for such a solution in the US is substantial and 2017 will see a concerted strategic effort in this area by the Group.
Both as a result of the Group’s impressive track record of completing deals on both sides of the Atlantic, combined with a sustained marketing campaign means the pipeline of transactions for 2017 is considerably stronger than at this point last year. In the current year to date we have acquired a Bermuda-based captive with small US general liability (‘GL’) exposures, a Vermont-based captive of a Fortune 500 engineering company which wrote low layer workers’ compensation (‘WC’) and GL business and assumed the deductible liabilities of a US REIT’s WC, GL and auto liability reprogramme.
It is anticipated that a number of other transactions will complete before 30 June, including the previously announced acquisition of AstraZeneca’s UK insurer, currently awaiting change of control approval, a UK Part VII transfer, some significant sized loss portfolio transfers in the US as well as further captive acquisitions/novations from self-insurers. We are confident that the first half of the year will see a markedly higher contribution from legacy transactional activity than in previous years with the full year showing a similar trend.
There were further net reserve releases from the run-off insurance companies. R&Q Re (US), Westland and APIC (the latter two only having been acquired during 2016) were all significant contributors to the net positive reserve development in the period. These releases
13
Financial StatementsCorporate GovernanceStrategic Report
Randall & Quilter Investment Holdings Ltd.Annual Report 2016
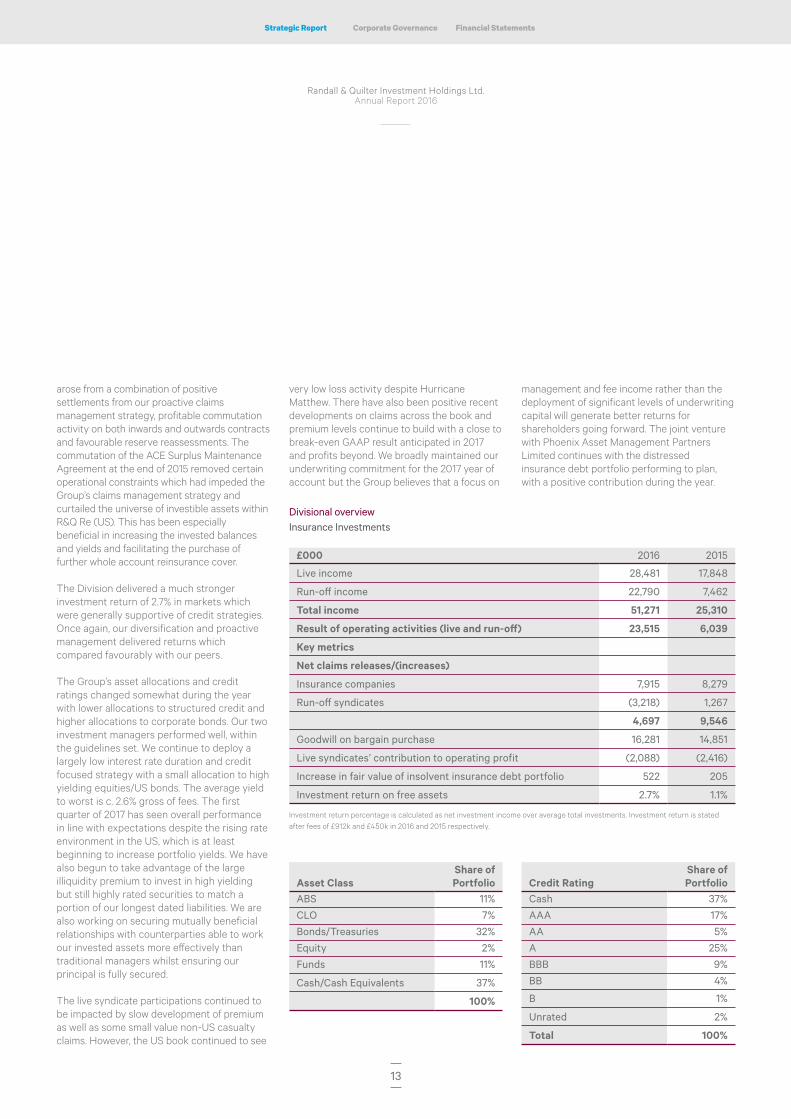
Divisional overviewInsurance Investments
£000 2016 2015
Live income 28,481 17,848
Run-off income 22,790 7,462
Total income 51,271 25,310
Result of operating activities (live and run-off) 23,515 6,039
Key metrics
Net claims releases/(increases)
Insurance companies 7,915 8,279
Run-off syndicates (3,218) 1,267
4,697 9,546
Goodwill on bargain purchase 16,281 14,851
Live syndicates’ contribution to operating profit (2,088) (2,416)
Increase in fair value of insolvent insurance debt portfolio 522 205
Investment return on free assets 2.7% 1.1%
Investment return percentage is calculated as net investment income over average total investments. Investment return is stated after fees of £912k and £450k in 2016 and 2015 respectively.
Asset ClassShare of Portfolio
ABS 11%
CLO 7%
Bonds/Treasuries 32%
Equity 2%
Funds 11%
Cash/Cash Equivalents 37%
100%
Credit RatingShare of Portfolio
Cash 37%
AAA 17%
AA 5%
A 25%
BBB 9%
BB 4%
B 1%
Unrated 2%
Total 100%
arose from a combination of positive settlements from our proactive claims management strategy, profitable commutation activity on both inwards and outwards contracts and favourable reserve reassessments. The commutation of the ACE Surplus Maintenance Agreement at the end of 2015 removed certain operational constraints which had impeded the Group’s claims management strategy and curtailed the universe of investible assets within R&Q Re (US). This has been especially beneficial in increasing the invested balances and yields and facilitating the purchase of further whole account reinsurance cover.
The Division delivered a much stronger investment return of 2.7% in markets which were generally supportive of credit strategies. Once again, our diversification and proactive management delivered returns which compared favourably with our peers.
The Group’s asset allocations and credit ratings changed somewhat during the year with lower allocations to structured credit and higher allocations to corporate bonds. Our two investment managers performed well, within the guidelines set. We continue to deploy a largely low interest rate duration and credit focused strategy with a small allocation to high yielding equities/US bonds. The average yield to worst is c. 2.6% gross of fees. The first quarter of 2017 has seen overall performance in line with expectations despite the rising rate environment in the US, which is at least beginning to increase portfolio yields. We have also begun to take advantage of the large illiquidity premium to invest in high yielding but still highly rated securities to match a portion of our longest dated liabilities. We are also working on securing mutually beneficial relationships with counterparties able to work our invested assets more effectively than traditional managers whilst ensuring our principal is fully secured.
The live syndicate participations continued to be impacted by slow development of premium as well as some small value non-US casualty claims. However, the US book continued to see
very low loss activity despite Hurricane Matthew. There have also been positive recent developments on claims across the book and premium levels continue to build with a close to break-even GAAP result anticipated in 2017 and profits beyond. We broadly maintained our underwriting commitment for the 2017 year of account but the Group believes that a focus on
management and fee income rather than the deployment of significant levels of underwriting capital will generate better returns for shareholders going forward. The joint venture with Phoenix Asset Management Partners Limited continues with the distressed insurance debt portfolio performing to plan, with a positive contribution during the year.
14
Randall & Quilter Investment Holdings Ltd.Annual Report 2016
Divisional ReviewInsurance Services
Financial summary
Total revenue (£000)
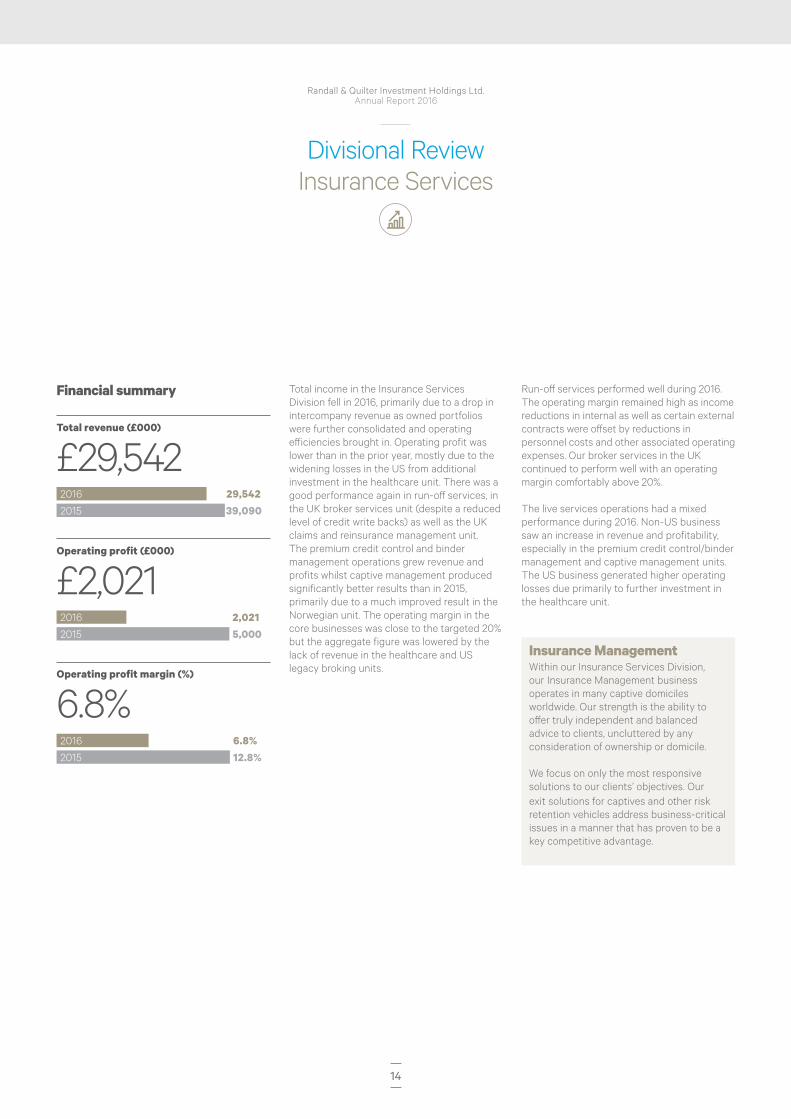
£29,5422015 39,0902016 29,542
Operating profit (£000)
£2,0212015 5,0002016 2,021
Operating profit margin (%)
6.8%2015 12.8%2016 6.8%
Total income in the Insurance Services Division fell in 2016, primarily due to a drop in intercompany revenue as owned portfolios were further consolidated and operating efficiencies brought in. Operating profit was lower than in the prior year, mostly due to the widening losses in the US from additional investment in the healthcare unit. There was a good performance again in run-off services, in the UK broker services unit (despite a reduced level of credit write backs) as well as the UK claims and reinsurance management unit. The premium credit control and binder management operations grew revenue and profits whilst captive management produced significantly better results than in 2015, primarily due to a much improved result in the Norwegian unit. The operating margin in the core businesses was close to the targeted 20% but the aggregate figure was lowered by the lack of revenue in the healthcare and US legacy broking units.
Run-off services performed well during 2016. The operating margin remained high as income reductions in internal as well as certain external contracts were offset by reductions in personnel costs and other associated operating expenses. Our broker services in the UK continued to perform well with an operating margin comfortably above 20%.
The live services operations had a mixed performance during 2016. Non-US business saw an increase in revenue and profitability, especially in the premium credit control/binder management and captive management units. The US business generated higher operating losses due primarily to further investment in the healthcare unit.
Insurance ManagementWithin our Insurance Services Division, our Insurance Management business operates in many captive domiciles worldwide. Our strength is the ability to offer truly independent and balanced advice to clients, uncluttered by any consideration of ownership or domicile.
We focus on only the most responsive solutions to our clients’ objectives. Our exit solutions for captives and other risk retention vehicles address business-critical issues in a manner that has proven to be a key competitive advantage.

15
Financial StatementsCorporate GovernanceStrategic Report
Randall & Quilter Investment Holdings Ltd.Annual Report 2016
Insurance Services
£000 2016 2015Total revenue 29,542 39,090
– Of which intercompany 9,537 16,179
– Of which third party 20,005 22,911
Operating profit* 2,021 5,000
Operating profit margin** 6.8% 12.8%
* Operating profit is defined as profit before income tax and finance costs** Operating profit margin is defined as operating profit divided by total revenue
Run-off services
£000 2016 2015Total income 13,406 21,209
Operating profit* 3,198 5,269
Operating profit margin** 23.9% 24.8%
* Operating profit is defined as profit before income tax and finance costs** Operating profit margin is defined as operating profit divided by total revenue
Live Services
£000 2016 2015Total income 16,136 17,881
– Of which non-US 10,620 9,755
– Of which US 5,516 8,126
Operating loss* (1,177) (269)
– Of which non-US 1,170 334
– Of which US (2,347) (603)
Operating margin** (7.3)% (1.5)%
* Operating loss is defined as loss before income tax and finance costs** Operating margin is defined as operating loss divided by total revenue
16
Randall & Quilter Investment Holdings Ltd.Annual Report 2016
Divisional ReviewUnderwriting Management
Financial summary
Total revenue (£000)
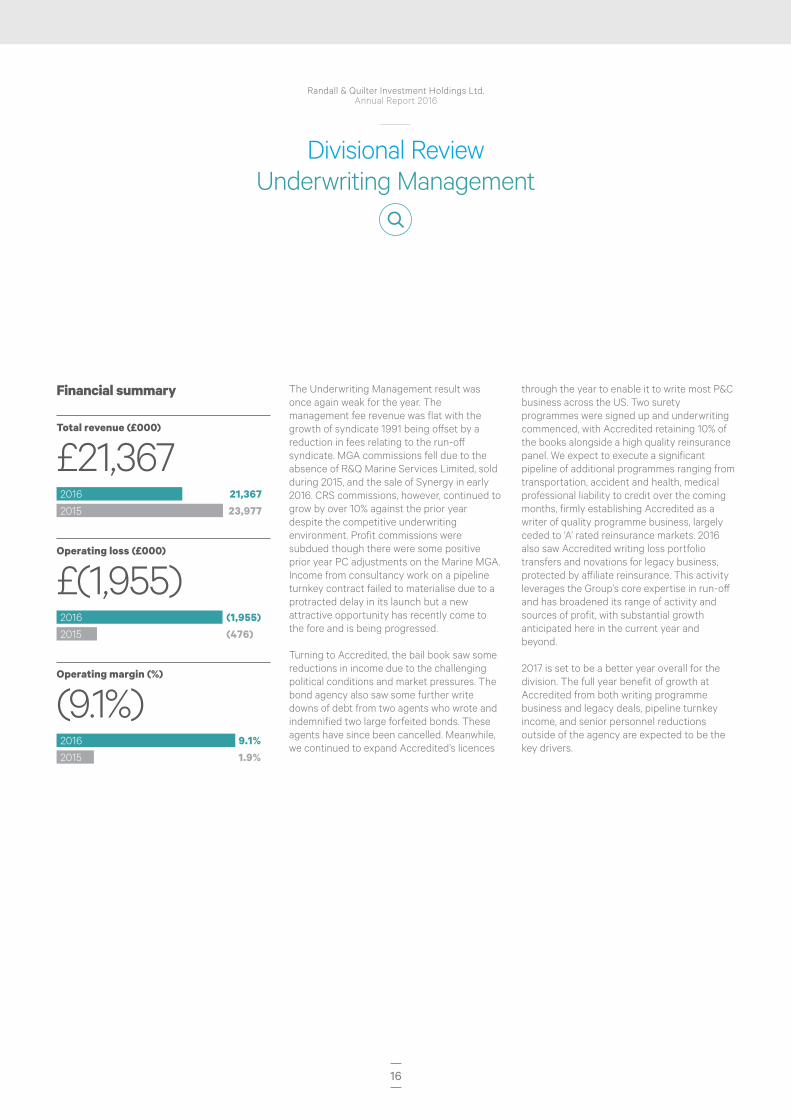
£21,3672015 23,9772016 21,367
Operating loss (£000)
£(1,955)2015 (476)2016 (1,955)
Operating margin (%)
(9.1%)2015 1.9%2016 9.1%
The Underwriting Management result was once again weak for the year. The management fee revenue was flat with the growth of syndicate 1991 being offset by a reduction in fees relating to the run-off syndicate. MGA commissions fell due to the absence of R&Q Marine Services Limited, sold during 2015, and the sale of Synergy in early 2016. CRS commissions, however, continued to grow by over 10% against the prior year despite the competitive underwriting environment. Profit commissions were subdued though there were some positive prior year PC adjustments on the Marine MGA. Income from consultancy work on a pipeline turnkey contract failed to materialise due to a protracted delay in its launch but a new attractive opportunity has recently come to the fore and is being progressed.
Turning to Accredited, the bail book saw some reductions in income due to the challenging political conditions and market pressures. The bond agency also saw some further write downs of debt from two agents who wrote and indemnified two large forfeited bonds. These agents have since been cancelled. Meanwhile, we continued to expand Accredited’s licences
through the year to enable it to write most P&C business across the US. Two surety programmes were signed up and underwriting commenced, with Accredited retaining 10% of the books alongside a high quality reinsurance panel. We expect to execute a significant pipeline of additional programmes ranging from transportation, accident and health, medical professional liability to credit over the coming months, firmly establishing Accredited as a writer of quality programme business, largely ceded to ‘A’ rated reinsurance markets. 2016 also saw Accredited writing loss portfolio transfers and novations for legacy business, protected by affiliate reinsurance. This activity leverages the Group’s core expertise in run-off and has broadened its range of activity and sources of profit, with substantial growth anticipated here in the current year and beyond.
2017 is set to be a better year overall for the division. The full year benefit of growth at Accredited from both writing programme business and legacy deals, pipeline turnkey income, and senior personnel reductions outside of the agency are expected to be the key drivers.
17
Financial StatementsCorporate GovernanceStrategic Report
Randall & Quilter Investment Holdings Ltd.Annual Report 2016
Underwriting Management
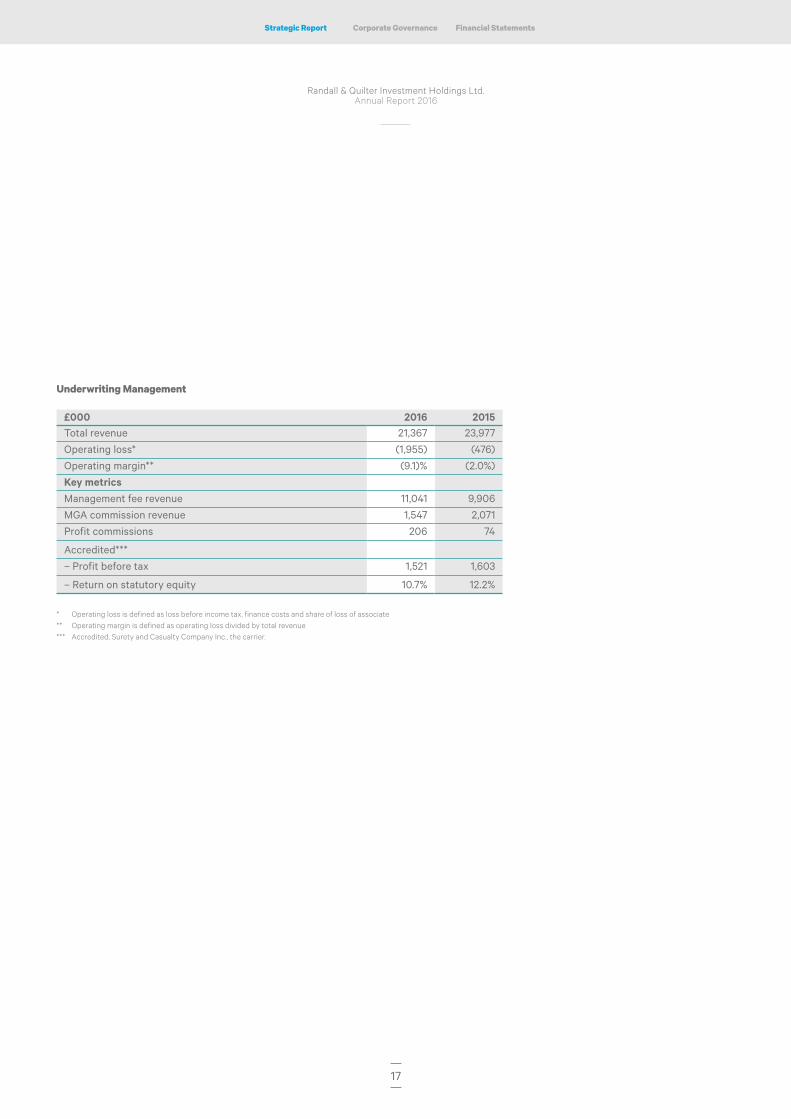
£000 2016 2015Total revenue 21,367 23,977
Operating loss* (1,955) (476)
Operating margin** (9.1)% (2.0%)
Key metricsManagement fee revenue 11,041 9,906
MGA commission revenue 1,547 2,071
Profit commissions 206 74
Accredited***
– Profit before tax 1,521 1,603
– Return on statutory equity 10.7% 12.2%
* Operating loss is defined as loss before income tax, finance costs and share of loss of associate** Operating margin is defined as operating loss divided by total revenue*** Accredited, Surety and Casualty Company Inc., the carrier.

18
Randall & Quilter Investment Holdings Ltd.Annual Report 2016
Risk Management
Board of Directors
First lineThe Business (Risk and Cultural Owners)
Second lineDirect Assurance (Compliance, Actuarial, Legal etc)
Third lineIndependent Assurance (Internal/External Audit, Independent Review etc)
R&Q is a diverse Group and continues to be exposed to a variety of risks and uncertainties. The challenge for the Group is to identify, assess, treat and monitor those risks and uncertainties it considers to be critical, and develop and maintain proportionate action to mitigate these risks to an acceptable level.
Overall Responsibility for Risk ManagementThe Board continues to have overall responsibility for ensuring that the Group and its operating divisions have an appropriate and proportional approach to Risk Management and Internal Control across the Group, and that this approach is properly aligned with the Group’s overall corporate strategy. The risks facing the Group continue to evolve and increase/decrease in potential impact and probability of crystallisation over time. Accordingly, the management of risk and uncertainty remains an iterative process. Risk Management is pervasive to all the Group’s activities and that this is reflected in the Risk Management governance framework outlined here.
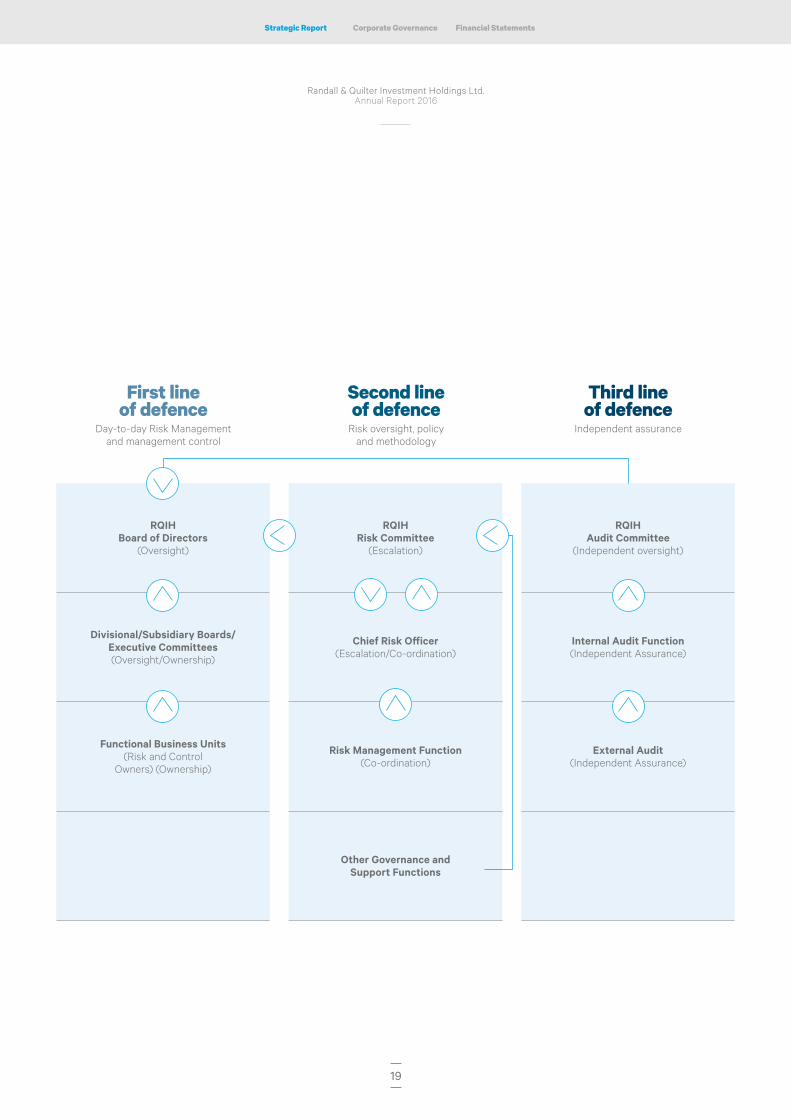
Three Lines of DefenceThe Group’s overall Governance Framework, which encompasses its Risk Management Framework, has regard to the principles of the ‘Three Lines of Defence’ model, comprising first line operational and functional management of risk, second line control and oversight, and third line internal and external audit function, as shown on the following page.
Risk Management
The Board continues to have overall responsibility for ensuring that the Group and its operating divisions have an appropriate and proportional approach to
Risk Management and Internal Control.
19
Financial StatementsCorporate GovernanceStrategic Report
Randall & Quilter Investment Holdings Ltd.Annual Report 2016
First line of defence
Day-to-day Risk Management and management control
Second line of defence
Risk oversight, policy and methodology
Third line of defence
Independent assurance
RQIH Board of Directors
(Oversight)
RQIH Risk Committee
(Escalation)
RQIH Audit Committee
(Independent oversight)
Divisional/Subsidiary Boards/Executive Committees (Oversight/Ownership)
Chief Risk Officer (Escalation/Co-ordination)
Internal Audit Function (Independent Assurance)
Functional Business Units (Risk and Control
Owners) (Ownership)
Risk Management Function (Co-ordination)
External Audit (Independent Assurance)
Other Governance and Support Functions
20
Randall & Quilter Investment Holdings Ltd.Annual Report 2016
Risk Managementcontinued
The key areas of focus of the Risk Committee during 2016 were to ensure that the Risk Management framework and oversight continues to be fit for purpose and embedded appropriately
within the operating divisions of the Group.
Risk Management
Review Report Control/Mitigate
Assessment Identification
21
Financial StatementsCorporate GovernanceStrategic Report
Randall & Quilter Investment Holdings Ltd.Annual Report 2016
Group Risk CommitteeThe Group Risk Committee is a formally constituted Committee of the Board. The Committee has responsibility for maintaining, on behalf of the Board, the effectiveness of the Group’s Risk Management Framework, systems of Internal Control, Risk Policies and Procedures and adherence to Risk Appetite. The Committee is chaired by an independent Non-Executive Director, Philip Barnes. The Committee meets at least quarterly and provides a report on its activity to the Board.
The key areas of focus of the Risk Committee and the Risk Management function during 2016 were to ensure that the Risk Management Framework and oversight continues to be fit for purpose and embedded appropriately within the various operating divisions of the Group. Specifically, the Risk Governance structure and reporting mechanisms within the divisions and legal entities have been subject to ongoing review and refinement commensurate with the needs of internal and external stakeholders. This approach balances proportionality with the requirements of local regulators, and underpinning the Group’s strategic priorities.
Risk Management ProcessThe Group’s Risk Management function, headed by the Chief Risk Officer, works closely with divisional and functional heads, and meets regularly with them to monitor existing identified risks and uncertainties, identify new and emerging risks and to ensure that there are appropriate processes and procedures in place to mitigate these risks. The process outlined opposite is adopted. Risk policies, processes and appetites at Group and divisional/subsidiary level are reviewed at least annually and on an ongoing basis to reflect changes in the underlying risk profiles of the respective businesses.
The Risk Committee is responsible for oversight of the established Risk Management process for identifying and assessing risks, from whatever source, internal or external, and ensuring it is consistently applied. Each identified risk is considered in the context of the Group’s strategic objectives and Risk Appetite, having regard to existing mitigating controls.
Internal Control SystemThe Group’s Internal Control System comprises the following key elements:• documented governance arrangements
continue to evolve along with the overall business strategy.
• strategic planning process, setting priorities for the forthcoming planning horizon, reviewed by the Board periodically to ensure the Group is focusing on its core strengths.
• detailed planning/budgeting process, subject to detailed and ongoing oversight and scrutiny delivering forecasts/targets for Board review and approval.
• management information systems, including corporate reporting on financial/operating performance.
• defined risk appetite framework governing management, control and oversight of key risks and issues.
• overall group capital adequacy planning conducted biannually.
• compliance arrangements throughout the Group.
• internal audit function providing third line assurance to the Board via the Audit Committee following a risk-based, approved annual Audit Plan, on the effectiveness of the Group’s internal controls in respect of key risks identified.
• Risk Management function, as described above.
The Board considers that the controls in place during 2016 were and continue to be relevant, proportional and appropriate for the needs of the Group, and in addition are sufficiently flexible to evolve with the changing needs of the business. A number of the Group’s subsidiaries are regulated and accordingly are subject to the relevant degree of local regulatory oversight. Members of the Board and senior management regularly meet with the Group’s various regulatory supervisors, conducting the relationship in an open and constructive manner.
22
Randall & Quilter Investment Holdings Ltd.Annual Report 2016
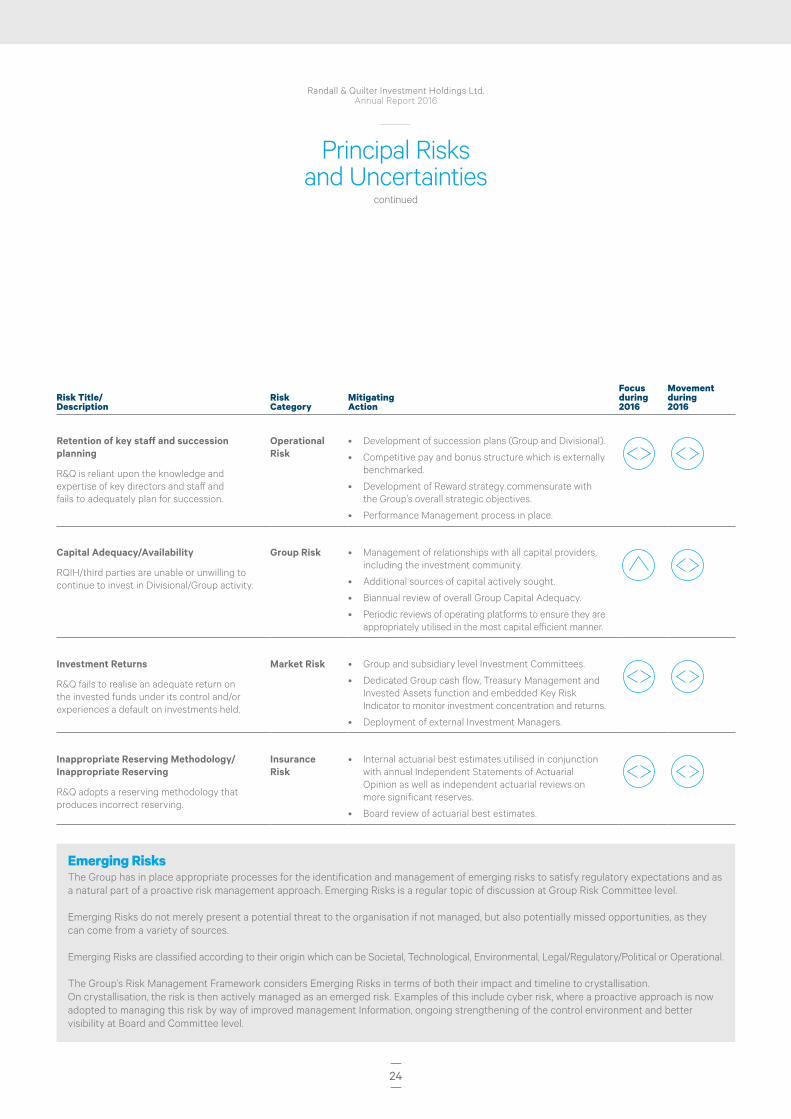
Principal Risks and Uncertainties
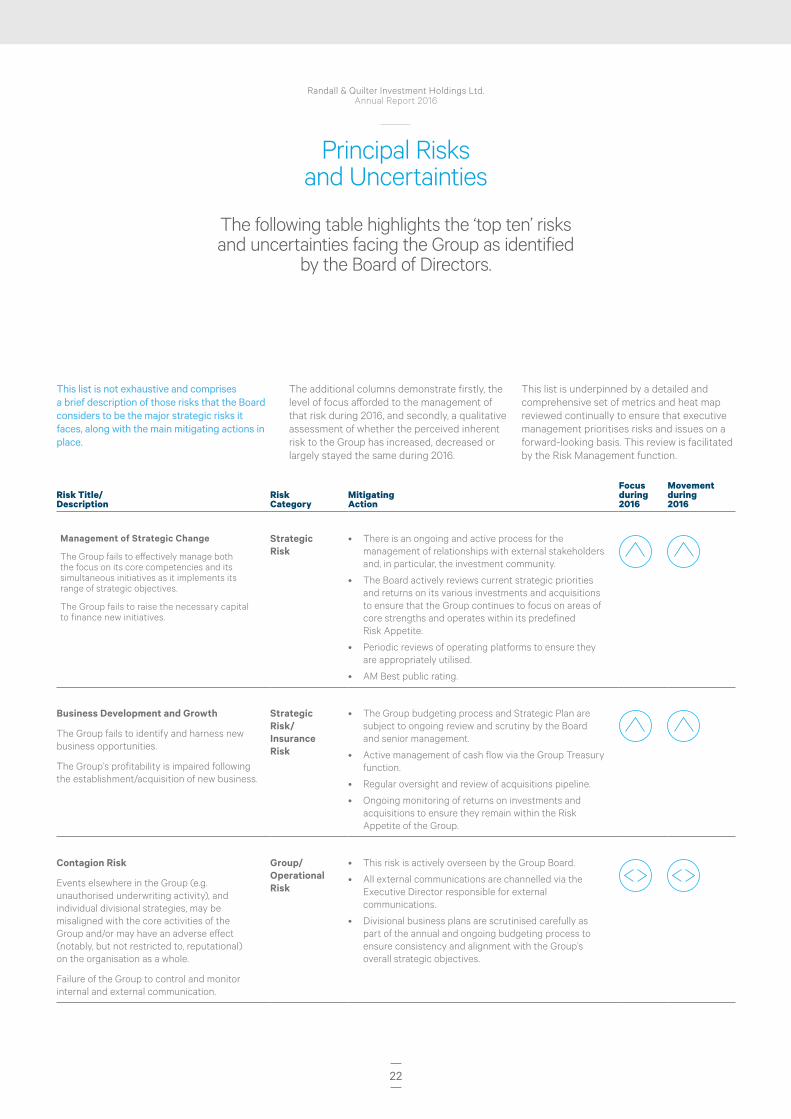
The following table highlights the ‘top ten’ risks and uncertainties facing the Group as identified
by the Board of Directors.
This list is not exhaustive and comprises a brief description of those risks that the Board considers to be the major strategic risks it faces, along with the main mitigating actions in place.
The additional columns demonstrate firstly, the level of focus afforded to the management of that risk during 2016, and secondly, a qualitative assessment of whether the perceived inherent risk to the Group has increased, decreased or largely stayed the same during 2016.
Risk Title/ Description
Risk Category
Mitigating Action
Focus during 2016
Movement during 2016
Management of Strategic Change
The Group fails to effectively manage both the focus on its core competencies and its simultaneous initiatives as it implements its range of strategic objectives.
The Group fails to raise the necessary capital to finance new initiatives.
Strategic Risk
• There is an ongoing and active process for the management of relationships with external stakeholders and, in particular, the investment community.
• The Board actively reviews current strategic priorities and returns on its various investments and acquisitions to ensure that the Group continues to focus on areas of core strengths and operates within its predefined Risk Appetite.
• Periodic reviews of operating platforms to ensure they are appropriately utilised.
• AM Best public rating.
Business Development and Growth
The Group fails to identify and harness new business opportunities.
The Group’s profitability is impaired following the establishment/acquisition of new business.
Strategic Risk/Insurance Risk
• The Group budgeting process and Strategic Plan are subject to ongoing review and scrutiny by the Board and senior management.
• Active management of cash flow via the Group Treasury function.
• Regular oversight and review of acquisitions pipeline.
• Ongoing monitoring of returns on investments and acquisitions to ensure they remain within the Risk Appetite of the Group.
Contagion Risk
Events elsewhere in the Group (e.g. unauthorised underwriting activity), and individual divisional strategies, may be misaligned with the core activities of the Group and/or may have an adverse effect (notably, but not restricted to, reputational) on the organisation as a whole.
Failure of the Group to control and monitor internal and external communication.
Group/Operational Risk
• This risk is actively overseen by the Group Board.
• All external communications are channelled via the Executive Director responsible for external communications.
• Divisional business plans are scrutinised carefully as part of the annual and ongoing budgeting process to ensure consistency and alignment with the Group’s overall strategic objectives.
This list is underpinned by a detailed and comprehensive set of metrics and heat map reviewed continually to ensure that executive management prioritises risks and issues on a forward-looking basis. This review is facilitated by the Risk Management function.
23
Financial StatementsCorporate GovernanceStrategic Report
Randall & Quilter Investment Holdings Ltd.Annual Report 2016
Risk Title/ Description
Risk Category
Mitigating Action
Focus during 2016
Movement during 2016
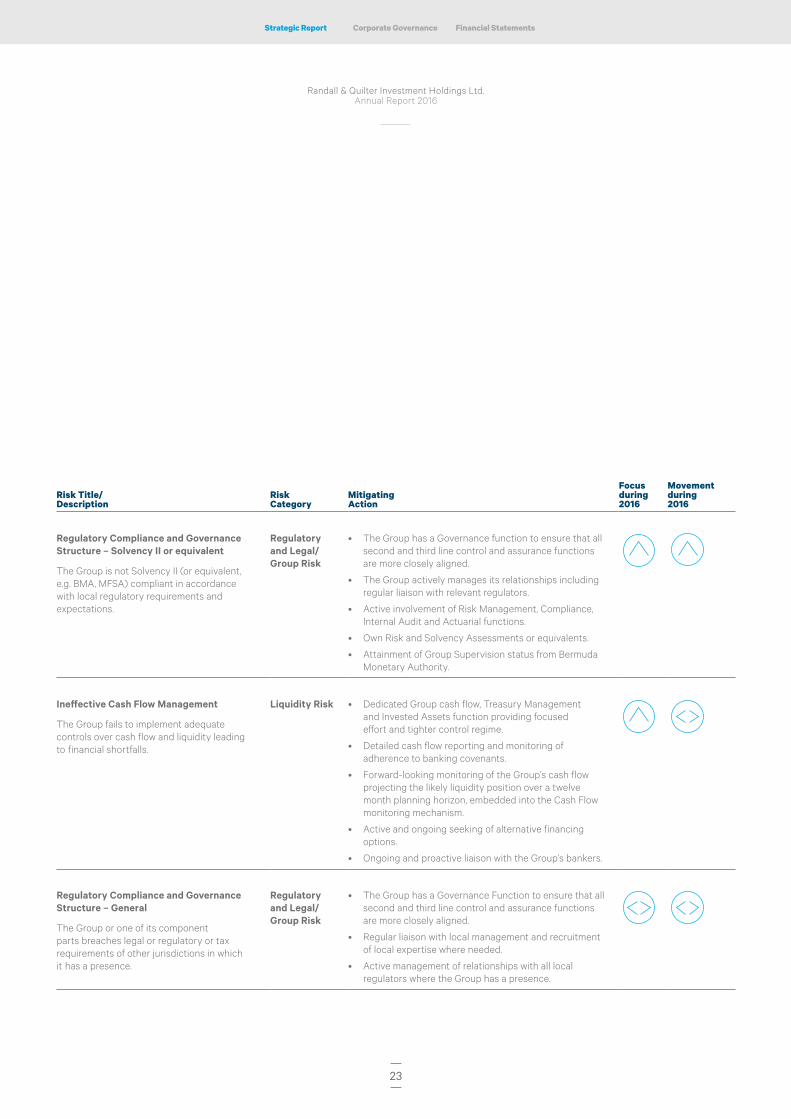
Regulatory Compliance and Governance Structure – Solvency II or equivalent
The Group is not Solvency II (or equivalent, e.g. BMA, MFSA) compliant in accordance with local regulatory requirements and expectations.
Regulatory and Legal/Group Risk
• The Group has a Governance function to ensure that all second and third line control and assurance functions are more closely aligned.
• The Group actively manages its relationships including regular liaison with relevant regulators.
• Active involvement of Risk Management, Compliance, Internal Audit and Actuarial functions.
• Own Risk and Solvency Assessments or equivalents.
• Attainment of Group Supervision status from Bermuda Monetary Authority.
Ineffective Cash Flow Management
The Group fails to implement adequate controls over cash flow and liquidity leading to financial shortfalls.
Liquidity Risk • Dedicated Group cash flow, Treasury Management and Invested Assets function providing focused effort and tighter control regime.
• Detailed cash flow reporting and monitoring of adherence to banking covenants.
• Forward-looking monitoring of the Group’s cash flow projecting the likely liquidity position over a twelve month planning horizon, embedded into the Cash Flow monitoring mechanism.
• Active and ongoing seeking of alternative financing options.
• Ongoing and proactive liaison with the Group’s bankers.
Regulatory Compliance and Governance Structure – General
The Group or one of its component parts breaches legal or regulatory or tax requirements of other jurisdictions in which it has a presence.
Regulatory and Legal/Group Risk
• The Group has a Governance Function to ensure that all second and third line control and assurance functions are more closely aligned.
• Regular liaison with local management and recruitment of local expertise where needed.
• Active management of relationships with all local regulators where the Group has a presence.
24
Randall & Quilter Investment Holdings Ltd.Annual Report 2016
Risk Title/ Description
Risk Category
Mitigating Action
Focus during 2016
Movement during 2016
Retention of key staff and succession planning
R&Q is reliant upon the knowledge and expertise of key directors and staff and fails to adequately plan for succession.
Operational Risk
• Development of succession plans (Group and Divisional).
• Competitive pay and bonus structure which is externally benchmarked.
• Development of Reward strategy commensurate with the Group’s overall strategic objectives.
• Performance Management process in place.
Capital Adequacy/Availability
RQIH/third parties are unable or unwilling to continue to invest in Divisional/Group activity.
Group Risk • Management of relationships with all capital providers, including the investment community.
• Additional sources of capital actively sought.
• Biannual review of overall Group Capital Adequacy.
• Periodic reviews of operating platforms to ensure they are appropriately utilised in the most capital efficient manner.
Investment Returns
R&Q fails to realise an adequate return on the invested funds under its control and/or experiences a default on investments held.
Market Risk • Group and subsidiary level Investment Committees.
• Dedicated Group cash flow, Treasury Management and Invested Assets function and embedded Key Risk Indicator to monitor investment concentration and returns.
• Deployment of external Investment Managers.
Inappropriate Reserving Methodology/Inappropriate Reserving
R&Q adopts a reserving methodology that produces incorrect reserving.
Insurance Risk
• Internal actuarial best estimates utilised in conjunction with annual Independent Statements of Actuarial Opinion as well as independent actuarial reviews on more significant reserves.
• Board review of actuarial best estimates.
Principal Risks and Uncertainties
continued
Emerging RisksThe Group has in place appropriate processes for the identification and management of emerging risks to satisfy regulatory expectations and as a natural part of a proactive risk management approach. Emerging Risks is a regular topic of discussion at Group Risk Committee level.
Emerging Risks do not merely present a potential threat to the organisation if not managed, but also potentially missed opportunities, as they can come from a variety of sources.
Emerging Risks are classified according to their origin which can be Societal, Technological, Environmental, Legal/Regulatory/Political or Operational.
The Group’s Risk Management Framework considers Emerging Risks in terms of both their impact and timeline to crystallisation. On crystallisation, the risk is then actively managed as an emerged risk. Examples of this include cyber risk, where a proactive approach is now adopted to managing this risk by way of improved management Information, ongoing strengthening of the control environment and better visibility at Board and Committee level.
25
Financial StatementsCorporate GovernanceStrategic Report
Randall & Quilter Investment Holdings Ltd.Annual Report 2016
Viability StatementIn accordance with provision C.2.2 of the UK Corporate Governance code, the Directors have assessed the Group’s viability over a three year period to December 2018. This is based on the medium to longer-term strategic objectives of the Group and has been made taking account of the current financial position of the Group, the strategic planning process and assessment of the Group’s principal risks and uncertainties as set out previously.
The Group’s strategic planning process includes the annual budgeting and reforecasting process, annual assessment of individual entity and overall Group Capital Adequacy and regular review by the Group’s Board of the Group’s strategic priorities.
The Group’s strategy provides the longer-term direction and is reviewed iteratively including relevant projections of medium to longer-term financial health and stability. Where appropriate, financial downside stress tests are applied as part of the Group’s ongoing monitoring of its liquidity requirements and at solo entity level to ensure that the capital held at Group level is sufficient to cover its identified risks.
This approach, along with the processes forming part of the Group’s Risk Management and overall Governance framework, ensures a robust assessment of its principal risks and mitigating actions.
The Directors have therefore concluded, based on the ongoing review of the Group’s strategy and its capability to meet its strategic objectives, that there is a reasonable expectation that the Group has adequate resources and will continue to operate and meet its liabilities as they fall due over the period of their assessment and for the foreseeable future.
Contents
28 Board of Directors
30 Governance Report
Corporate Governance


28
Randall & Quilter Investment Holdings Ltd.Annual Report 2016
Board of Directors
Director – Thomas Alexander Booth (42) Group Chief Financial Officer
Tom Booth joined the Randall & Quilter Group in October 2009 and was appointed to the Board of R&Q in January 2011, becoming Group CFO in June 2011. Tom moved to Bermuda with the Group’s redomicile in July 2013 and has helped grow the Bermuda head office, including building up a North American legacy focused M&A team. With nearly 16 years of experience in the insurance sector, Tom began his career as an investment banker, previously holding the position of Corporate Finance Director at Numis Securities Limited where he was responsible for an extensive LSE-listed client base. Prior to this he advised and raised significant capital for a range of underwriting and other insurance-related entities whilst at Aon Capital Advisory. Tom graduated from Trinity Hall, Cambridge University and holds a First Class MBA in Finance.
Director – Kenneth Edward Randall (68) Group Chairman and Chief Executive Officer
Ken Randall is a Certified Accountant and has worked in the insurance industry for more than 40 years. During the early 1980s, Ken was Head of Regulatory Services at Lloyd’s which was then a self-regulated institution. From 1985 until 1991 Ken served as Chief Executive of the Merrett Group, which managed a number of prominent syndicates at Lloyd’s and had other insurance interests. In 1991, he left Merrett to set up his own business and in 1992 he teamed up with Alan Quilter. Over the next eight years they developed the Group’s principal subsidiary, Eastgate, into the UK’s largest third party provider of insurance services with 1,300 employees and a turnover of over £80 million per annum. Following the sale of Eastgate to Capita plc in November 2000, Ken and Alan refocused the Randall & Quilter Group onto the acquisition of non-life legacy run-off portfolios. After the expiry of non-competition agreements, Randall & Quilter again developed an insurance servicing business in London and the USA, initially focusing on legacy portfolios. Ken led the Randall & Quilter Group admission to AIM in 2007 and remains a significant shareholder.
Director – Alan Kevin Quilter (66) Group Chief Operating Officer & Deputy Group Chief Executive Officer
Alan Quilter is a Chartered Accountant and has worked in the London insurance market since 1969. Between 1980 and 1987, he headed the Market Financial Services Group at Lloyd’s before becoming Managing Director of Cheval Investment Management, a specialist investment management company focused on insurance markets in the UK. In 1992, Alan joined Ken Randall to develop what became the Randall & Quilter Group becoming Chief Financial Officer, and in 2011, Group Chief Operating Officer. Alan has been Deputy Group Chief Executive Officer since the relocation of the listed company to Bermuda.

29
Financial StatementsCorporate GovernanceStrategic Report
Randall & Quilter Investment Holdings Ltd.Annual Report 2016
Michael Smith (71)Non-Executive Director
Michael Smith is a solicitor, having spent his professional career at City solicitors Titmuss Sainer & Webb (now international law firm, Dechert) of which he was senior partner from 1990 to 1998, retiring from legal practice in 2001.
He was a corporate lawyer, having specialised from the mid 1980’s in the London and international insurance markets, with a concentration on capital transactions of all types.
Philip Barnes (56)Non-Executive Director
Philip Barnes is a Chartered Accountant and has worked in the insurance industry for the past 31 years. Philip is currently the President of the representative office of the Jardine Matheson Group of Companies in Bermuda. A Fellow of the Institute of Chartered Accountants in England & Wales, Philip qualified with a national firm of accountants in the UK before continuing his career with Deloitte in Bermuda. He then joined Alexander & Alexander which was subsequently acquired by the global broker Aon. During his 25-year career with Aon Philip oversaw the growth and development of the Bermuda office into the leading manager of captives and reinsurance companies on the island. Philip has served on various industry and government advisory committees over the years. He currently holds a number of non-executive directorships of Bermuda insurance and reinsurance companies.
Alastair Campbell (72)Non-Executive Director
Alastair Campbell qualified as a Chartered Accountant in 1968. After qualifying, he worked with PKF Littlejohn LLP, becoming a partner in 1970. Between 1984 and 1998 he acted as the Senior Partner and Chairman of the firm.
During his 40 years as a partner he acted for a wide range of commercial entities, mainly in the service sector. Throughout his career he has been involved in the London Insurance Market and has extensive experience in the non-life insurance industry, acting for insurers, brokers and agents as auditor and adviser. Following his retirement in 2010, he has worked as a consultant and expert witness on accounting-related projects.
The Board of Directors met 11 times in 2016. The Board approved a number of resolutions in writing and meetings were held by Committees of the Board. Board attendance was 90%.

30
Randall & Quilter Investment Holdings Ltd.Annual Report 2016
Group Risk Committee
RQIH Board
Subsidiary Investment Committees
(where appropriate)
Subsidiary Audit
Committees(where appropriate)
Group Capital & Investment
Committee
Group Disclosure Committee
Group Remuneration & Nominations
Committee
Group Reinsurance
Asset Committee
Group Audit Committee
Tom Booth Chair of Capital & Investment Committee
Governance Report
We set high standards of corporate governance, with a structure designed to establish, implement
and maintain the effective controls essential to the Group’s long-term success.
Philip BarnesChair of Group Risk Committee
Committee Structure
Capital & Investment Committee (‘InvestCo’)The InvestCo consists of the Executive Directors and is chaired by the CFO. The Chief Actuary and Deputy Group CFO attend as appropriate.
ActivitiesIn 2016, the InvestCo considered 24 transactions and investment opportunities, as well as reviewing and making recommendations with regard to the Group’s investment policy. The InvestCo’s primary purpose is to oversee all aspects of the management of corporate, insurance and syndicate assets owned, managed and related arrangements entered into by or on behalf of companies within the Group.
Group Risk Committee (‘GRC’)The GRC is chaired by Philip Barnes and consists of the Head of Governance, CFO, Chief Risk Officer, Chief Actuary and the Head of Internal Audit. The CEO is an attendee. The GRC met four times during 2016 and attendance was 92% (two attendees missed one meeting each).
ActivitiesThe GRC’s activities are described in more detail on page 21 (Risk Management).

31
Financial StatementsCorporate GovernanceStrategic Report
Randall & Quilter Investment Holdings Ltd.Annual Report 2016
Michael SmithChair of Remuneration & Nominations Committee and Reinsurance Asset Committee
Alastair CampbellChair of Audit Committee
Group Disclosure CommitteeThe Disclosure Committee was established in October 2016.The Disclosure Committee comprises the CEO (or the COO as his alternate), the CFO and the Group Company Secretary. It will meet at least annually to review the operation, adequacy and effectiveness of the Group’s disclosure procedures and as necessary for the purpose of assisting the Board in fulfilling its responsibilities under the Market Abuse Regulation, AIM Rules and Disclosure Guidelines and Transparency Rules.
Remuneration & Nomination Committee (‘RemCo’)The RemCo consists of the Non-Executive Directors and is chaired by Michael Smith. The CEO is an attendee and other members of the Executive and senior management attend by request. The RemCo met six times during 2016 and attendance was 100%.
ActivitiesThe RemCo’s primary focus is on setting the Group’s Executive and senior management remuneration policy, in collaboration with the Board as a whole. The RemCo also considers share incentive plans, option grants and other performance-related initiatives as well as approving management’s general approach to employee annual bonuses and pay rises, specific awards for senior management and making recommendations as to succession planning.
Reinsurance Asset Committee (‘RAC’)The RAC is chaired by Michael Smith and consists of the Head of Claims & Reinsurance (UK), CFO, CEO-Insurance Investments Division, UK Client Services Director, Chief Actuary, Head of Group Credit Control, President and Senior Vice President of US Insurance Services Division and the US General Counsel. The RAC met four times in 2016 and attendance was 58%.
ActivitiesThe RAC monitors and reports on the Group’s owned insurance company reinsurance assets and recommends actions to protect such assets. The RAC also reviews bad and doubtful debt provisions proposed by the Group’s owned insurance companies, reports on reinsurance litigation/arbitration and commutation activity, and makes recommendations on acceptable levels of security for the purchase of insurance and reinsurance cover.
Audit CommitteeThe Audit Committee consists of the three Non-Executive Directors, and is chaired by Alastair Campbell. The Executive Directors are attendees and members of the Finance, Actuarial and Internal Audit functions are invited where appropriate. The Group’s auditors, PKF Littlejohn LLP, attend at least two meetings per year. The Audit Committee met four times in 2016 and attendance was 100%.
ActivitiesDuring 2016, the Audit Committee reviewed the Group’s full-year and half-year financial statements and associated disclosures and also considered, among other things, the appropriateness of the Group’s accounting policies. During the year the Committee reviewed the appointments of the Group Auditor and of those auditors of the significant overseas subsidiaries not audited by the Group Auditor. The Committee received reports from the Actuarial function concerning the claims reserves in the financial statements established by the Group’s insurance companies and syndicates. The Committee also approved the work plan for Internal Audit for 2017, received copies of internal audit reports issued by Internal Audit, and received regular reports from the Head of Internal Audit including progress against the three-year internal audit plan and progress made by management on the implementation of internal audit recommendations. The Committee reports its findings to the Board at each regularly scheduled Board meeting.
The Chair of the Audit Committee also chairs twice yearly meetings of the Chairs of the subsidiary Audit Committees to ensure a consistent approach to matters arising and to identify and address issues of common concern.
Contents
34 Independent Auditors’ Report
35 Consolidated Income Statement
36 Consolidated Statement of
Comprehensive Income
37 Consolidated Statement of
Changes in Equity
38 Consolidated Statement of
Financial Position
39 Consolidated Cash Flow Statement
40 Notes to the Consolidated
Financial Statements
87 Shareholder Information
Financial Statements

34
Randall & Quilter Investment Holdings Ltd.Annual Report 2016
Independent Auditors’ Report to the shareholders of Randall & Quilter Investment Holdings Ltd.
For the year ended 31 December 2016
We have audited the Consolidated Financial Statements of Randall & Quilter Investment Holdings Ltd. (‘the Company’) for the year ended 31 December 2016 which comprise the Consolidated Income Statement, Consolidated Statement of Comprehensive Income, Consolidated Statement of Financial Position, Consolidated Statement of Changes in Equity, Consolidated Cash Flow Statement, and the related notes. The financial reporting framework that has been applied in their preparation is International Financial Reporting Standards (‘IFRSs’) as adopted by the European Union.
This report is made solely to the Company’s shareholders, as a body. Our audit work has been undertaken so that we might state to the Company’s shareholders those matters we are required to state to them in an auditor’s report and for no other purpose. To the fullest extent permitted by law, we do not accept or assume responsibility to anyone other than the Company and the Company’s shareholders as a body, for our audit work, for this report, or for the opinions we have formed.
Directors’ ResponsibilitiesThe Directors are responsible for preparing the Annual Report and the Financial Statements in accordance with applicable law and regulations.
The Directors have elected to prepare the Company’s financial statements under International Financial Reporting Standards as adopted by the European Union.
International Accounting Standard 1 requires that financial statements present fairly for each financial year the Company’s financial position, financial performance and cash flows. This requires the faithful representation of the effects of transactions, other events and conditions in accordance with the definitions and recognition criteria for assets, liabilities, income and expenses set out in the International Accounting Standards Board’s ‘Framework for the Preparation and Presentation of Financial Statements’. The Directors are also responsible for:
• properly selecting and applying accounting policies;• presenting information, including accounting policies, in a manner
that provides relevant, reliable, comparable and understandable information;
• providing additional disclosures when compliance with the specific requirements in IFRSs is insufficient to enable users to understand the impact of particular transactions, other events and conditions on the entity’s financial position and financial performance; and
• making an assessment of the Company’s ability to continue as a going concern.
The Directors are responsible for keeping adequate accounting records that are sufficient to show and explain the Company’s transactions and disclose with reasonable accuracy at any time the financial position of the Company. They are also responsible for safeguarding assets of the Company and hence for taking reasonable steps for the prevention and detection of fraud and other irregularities.
The Directors are responsible for the maintenance and integrity of the corporate and financial information included on the Company’s website.
Auditor’s ResponsibilitiesOur responsibilty is to audit and express an opinion on the financial statements in accordance with applicable law and International Standards on Auditing (UK and Ireland). Those standards require us to comply with the Auditing Practices Board’s Ethical Standards for Auditors.
Scope of the audit of the financial statementsAn audit involves obtaining evidence about the amounts and disclosures in the financial statements sufficient to give reasonable assurance that the financial statements are free from material misstatement, whether caused by fraud or error. This includes an assessment of: whether the accounting policies are appropriate to the Company’s circumstances and have been consistently applied and adequately disclosed; the reasonableness of significant accounting estimates made by the Directors; and the overall presentation of the financial statements. In addition, we read all the financial and non-financial information in the Annual Report to identify material inconsistencies with the audited financial statements and to identify any information that is apparently materially incorrect based on, or materially inconsistent with, the knowledge acquired by us in the course of performing the audit. If we become aware of any apparent material misstatements or inconsistencies we consider the implications for our report.
Opinion on financial statementsIn our opinion:• the Consolidated Financial Statements give a true and fair view of the
state of the Company’s affairs as at 31 December 2016 and of the Company’s profit for the year then ended; and
• the Consolidated Financial Statements have been properly prepared in accordance with IFRSs as adopted by the European Union.
PKF Littlejohn LLPChartered Accountants and Registered Auditor1 Westferry Circus,Canary Wharf,London E14 4HD, United Kingdom
19 April 2017
35
Financial StatementsCorporate GovernanceStrategic Report
Randall & Quilter Investment Holdings Ltd.Annual Report 2016
2016 2015
Note £000 £000 £000 £000
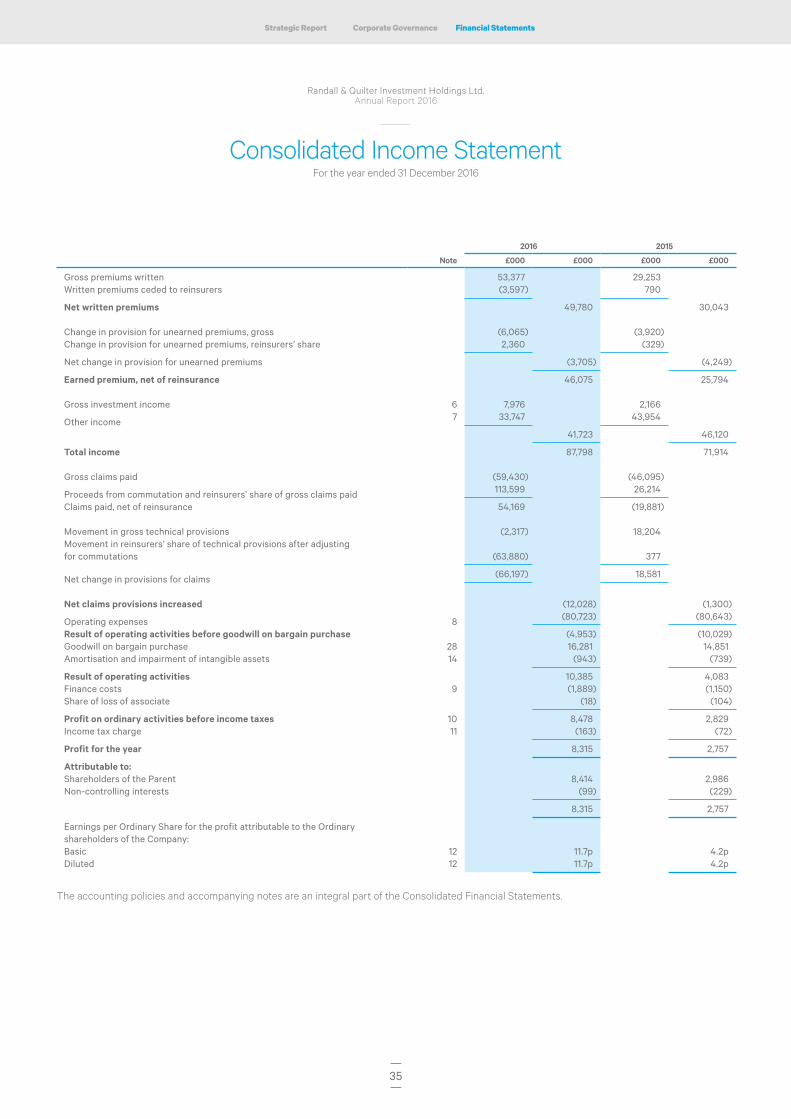
Gross premiums written 53,377 29,253 Written premiums ceded to reinsurers (3,597) 790
Net written premiums 49,780 30,043
Change in provision for unearned premiums, gross (6,065) (3,920)Change in provision for unearned premiums, reinsurers’ share 2,360 (329)
Net change in provision for unearned premiums (3,705) (4,249)
Earned premium, net of reinsurance 46,075 25,794
Gross investment income 6 7,976 2,166
Other income 7 33,747 43,954
41,723 46,120
Total income 87,798 71,914
Gross claims paid (59,430) (46,095)
Proceeds from commutation and reinsurers’ share of gross claims paid 113,599 26,214
Claims paid, net of reinsurance 54,169 (19,881)
Movement in gross technical provisions (2,317) 18,204 Movement in reinsurers’ share of technical provisions after adjusting for commutations (63,880) 377
Net change in provisions for claims (66,197) 18,581
Net claims provisions increased (12,028) (1,300)
Operating expenses 8 (80,723) (80,643)
Result of operating activities before goodwill on bargain purchase (4,953) (10,029)Goodwill on bargain purchase 28 16,281 14,851 Amortisation and impairment of intangible assets 14 (943) (739)
Result of operating activities 10,385 4,083 Finance costs 9 (1,889) (1,150)Share of loss of associate (18) (104)
Profit on ordinary activities before income taxes 10 8,478 2,829 Income tax charge 11 (163) (72)
Profit for the year 8,315 2,757
Attributable to:Shareholders of the Parent 8,414 2,986 Non-controlling interests (99) (229)
8,315 2,757
Earnings per Ordinary Share for the profit attributable to the Ordinary shareholders of the Company:Basic 12 11.7p 4.2p Diluted 12 11.7p 4.2p
The accounting policies and accompanying notes are an integral part of the Consolidated Financial Statements.
Consolidated Income Statement For the year ended 31 December 2016

36
Randall & Quilter Investment Holdings Ltd.Annual Report 2016
Consolidated Statement of Comprehensive Income For the year ended 31 December 2016
2016 £000
2015 £000
Other comprehensive income:Items that will not be reclassified to profit or loss:Pension scheme actuarial (losses)/gains (4,168) 3,209 Deferred tax on pension scheme actuarial losses/(gains) 709 (578)
(3,459) 2,631 Items that may be subsequently reclassified to profit or loss:Exchange gains on consolidation 8,742 480
Other comprehensive income 5,283 3,111
Profit for the year 8,315 2,757
Total comprehensive income for the year 13,598 5,868
Attributable to:Shareholders of the Parent 13,649 6,095 Non-controlling interests (51) (227)
Total comprehensive income for the year 13,598 5,868
The accounting policies and accompanying notes are an integral part of the Consolidated Financial Statements.
37
Financial StatementsCorporate GovernanceStrategic Report
Randall & Quilter Investment Holdings Ltd.Annual Report 2016
Attributable to equity holders of the Parent
Notes
Share capital
£000 Share option
costs £000
Share premium
£000
Retained earnings
£000 Total £000
Non-controlling
interests £000
Total £000
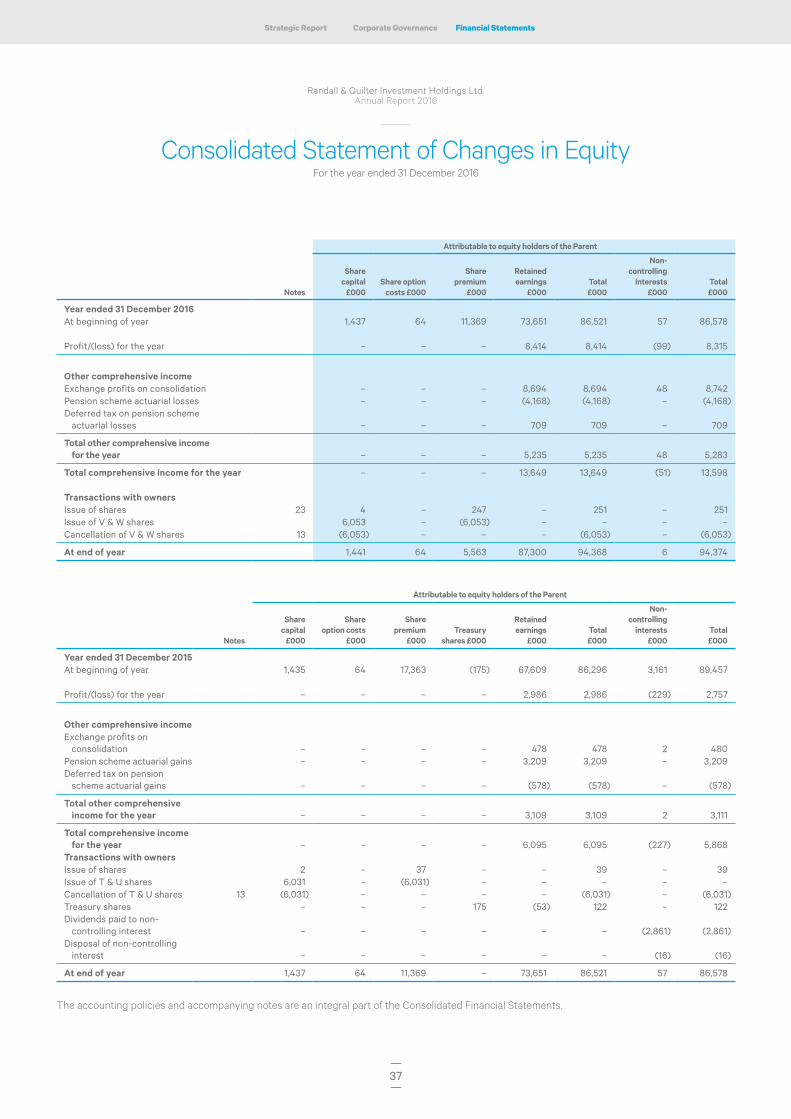
Year ended 31 December 2016At beginning of year 1,437 64 11,369 73,651 86,521 57 86,578
Profit/(loss) for the year – – – 8,414 8,414 (99) 8,315
Other comprehensive incomeExchange profits on consolidation – – – 8,694 8,694 48 8,742 Pension scheme actuarial losses – – – (4,168) (4,168) – (4,168)Deferred tax on pension scheme
actuarial losses – – – 709 709 – 709
Total other comprehensive income for the year – – – 5,235 5,235 48 5,283
Total comprehensive income for the year – – – 13,649 13,649 (51) 13,598
Transactions with ownersIssue of shares 23 4 – 247 – 251 – 251 Issue of V & W shares 6,053 – (6,053) – – – – Cancellation of V & W shares 13 (6,053) – – – (6,053) – (6,053)
At end of year 1,441 64 5,563 87,300 94,368 6 94,374
Attributable to equity holders of the Parent
Notes
Share capital
£000
Share option costs
£000
Share premium
£000 Treasury
shares £000
Retained earnings
£000 Total £000
Non-controlling
interests £000
Total £000
Year ended 31 December 2015At beginning of year 1,435 64 17,363 (175) 67,609 86,296 3,161 89,457
Profit/(loss) for the year – – – – 2,986 2,986 (229) 2,757
Other comprehensive incomeExchange profits on
consolidation – – – – 478 478 2 480 Pension scheme actuarial gains – – – – 3,209 3,209 – 3,209 Deferred tax on pension
scheme actuarial gains – – – – (578) (578) – (578)
Total other comprehensive income for the year – – – – 3,109 3,109 2 3,111
Total comprehensive income for the year – – – – 6,095 6,095 (227) 5,868
Transactions with ownersIssue of shares 2 – 37 – – 39 – 39 Issue of T & U shares 6,031 – (6,031) – – – – – Cancellation of T & U shares 13 (6,031) – – – – (6,031) – (6,031)Treasury shares – – – 175 (53) 122 – 122 Dividends paid to non-
controlling interest – – – – – – (2,861) (2,861)Disposal of non-controlling
interest – – – – – – (16) (16)
At end of year 1,437 64 11,369 – 73,651 86,521 57 86,578
The accounting policies and accompanying notes are an integral part of the Consolidated Financial Statements.
Consolidated Statement of Changes in EquityFor the year ended 31 December 2016
38
Randall & Quilter Investment Holdings Ltd.Annual Report 2016
Consolidated Statement of Financial PositionAs at 31 December 2016
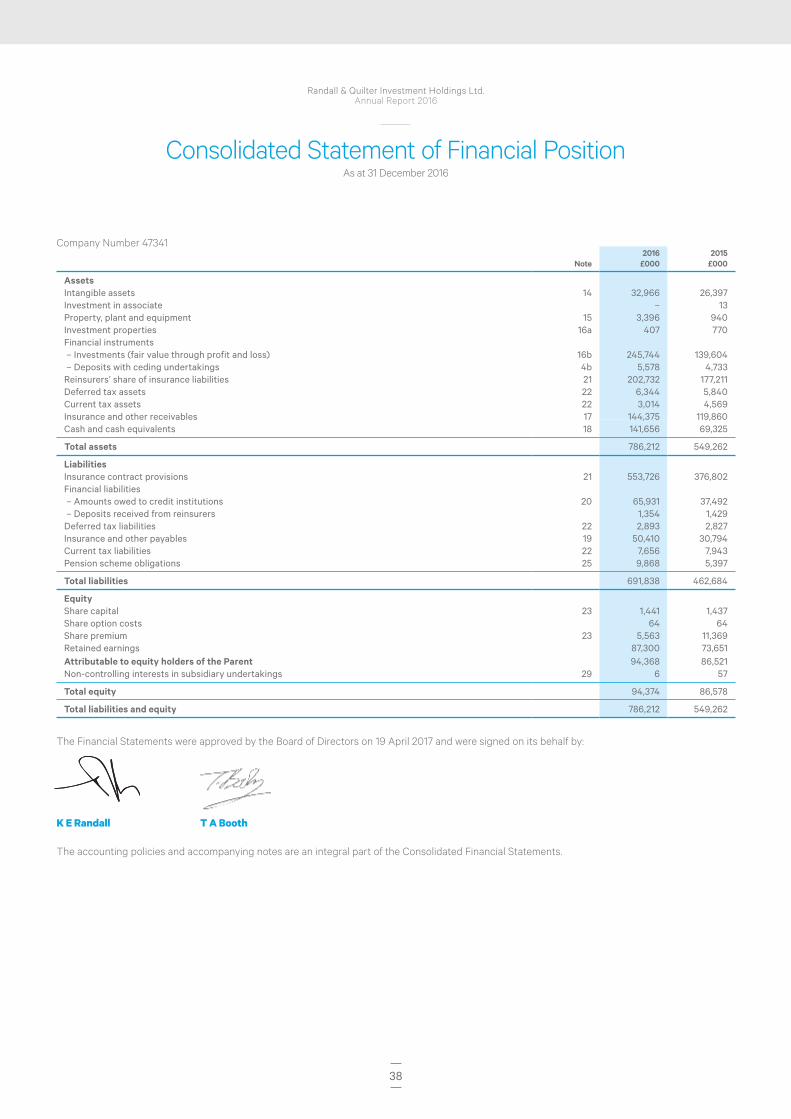
Company Number 47341
Note2016
£0002015
£000
AssetsIntangible assets 14 32,966 26,397 Investment in associate – 13 Property, plant and equipment 15 3,396 940 Investment properties 16a 407 770 Financial instruments – Investments (fair value through profit and loss) 16b 245,744 139,604 – Deposits with ceding undertakings 4b 5,578 4,733 Reinsurers’ share of insurance liabilities 21 202,732 177,211 Deferred tax assets 22 6,344 5,840 Current tax assets 22 3,014 4,569 Insurance and other receivables 17 144,375 119,860 Cash and cash equivalents 18 141,656 69,325
Total assets 786,212 549,262
LiabilitiesInsurance contract provisions 21 553,726 376,802 Financial liabilities – Amounts owed to credit institutions 20 65,931 37,492 – Deposits received from reinsurers 1,354 1,429 Deferred tax liabilities 22 2,893 2,827 Insurance and other payables 19 50,410 30,794 Current tax liabilities 22 7,656 7,943 Pension scheme obligations 25 9,868 5,397
Total liabilities 691,838 462,684
EquityShare capital 23 1,441 1,437 Share option costs 64 64 Share premium 23 5,563 11,369 Retained earnings 87,300 73,651 Attributable to equity holders of the Parent 94,368 86,521 Non-controlling interests in subsidiary undertakings 29 6 57
Total equity 94,374 86,578
Total liabilities and equity 786,212 549,262
The Financial Statements were approved by the Board of Directors on 19 April 2017 and were signed on its behalf by:
K E Randall T A Booth
The accounting policies and accompanying notes are an integral part of the Consolidated Financial Statements.
39
Financial StatementsCorporate GovernanceStrategic Report
Randall & Quilter Investment Holdings Ltd.Annual Report 2016
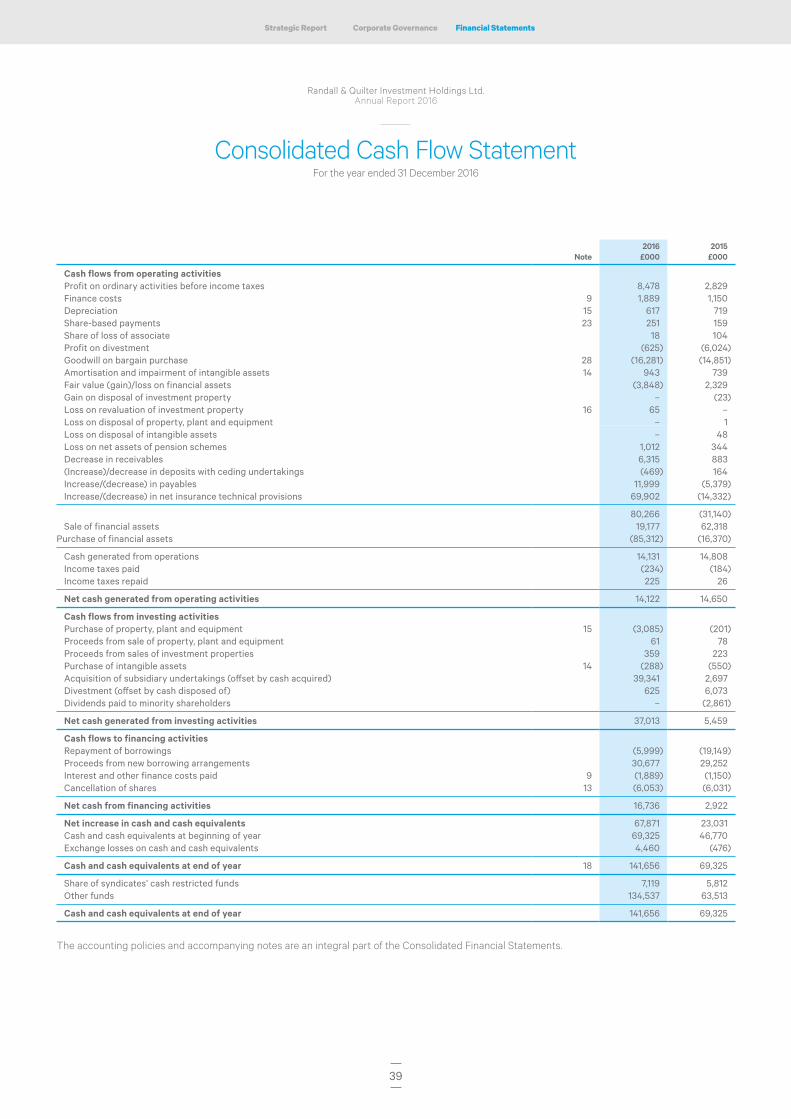
Note2016
£0002015
£000
Cash flows from operating activitiesProfit on ordinary activities before income taxes 8,478 2,829 Finance costs 9 1,889 1,150 Depreciation 15 617 719 Share-based payments 23 251 159 Share of loss of associate 18 104 Profit on divestment (625) (6,024)Goodwill on bargain purchase 28 (16,281) (14,851)Amortisation and impairment of intangible assets 14 943 739 Fair value (gain)/loss on financial assets (3,848) 2,329 Gain on disposal of investment property – (23)Loss on revaluation of investment property 16 65 – Loss on disposal of property, plant and equipment – 1 Loss on disposal of intangible assets – 48 Loss on net assets of pension schemes 1,012 344 Decrease in receivables 6,315 883 (Increase)/decrease in deposits with ceding undertakings (469) 164 Increase/(decrease) in payables 11,999 (5,379)Increase/(decrease) in net insurance technical provisions 69,902 (14,332)
80,266 (31,140)Sale of financial assets 19,177 62,318
Purchase of financial assets (85,312) (16,370)
Cash generated from operations 14,131 14,808 Income taxes paid (234) (184)Income taxes repaid 225 26
Net cash generated from operating activities 14,122 14,650
Cash flows from investing activitiesPurchase of property, plant and equipment 15 (3,085) (201)Proceeds from sale of property, plant and equipment 61 78 Proceeds from sales of investment properties 359 223 Purchase of intangible assets 14 (288) (550)Acquisition of subsidiary undertakings (offset by cash acquired) 39,341 2,697 Divestment (offset by cash disposed of) 625 6,073 Dividends paid to minority shareholders – (2,861)
Net cash generated from investing activities 37,013 5,459
Cash flows to financing activitiesRepayment of borrowings (5,999) (19,149)Proceeds from new borrowing arrangements 30,677 29,252 Interest and other finance costs paid 9 (1,889) (1,150)Cancellation of shares 13 (6,053) (6,031)
Net cash from financing activities 16,736 2,922
Net increase in cash and cash equivalents 67,871 23,031 Cash and cash equivalents at beginning of year 69,325 46,770 Exchange losses on cash and cash equivalents 4,460 (476)
Cash and cash equivalents at end of year 18 141,656 69,325
Share of syndicates’ cash restricted funds 7,119 5,812 Other funds 134,537 63,513
Cash and cash equivalents at end of year 141,656 69,325
The accounting policies and accompanying notes are an integral part of the Consolidated Financial Statements.
Consolidated Cash Flow StatementFor the year ended 31 December 2016
40
Randall & Quilter Investment Holdings Ltd.Annual Report 2016
Notes to the Consolidated Financial StatementsFor the year ended 31 December 2016
1. Corporate informationRandall & Quilter Investment Holdings Ltd. (the ‘Company’) is a company incorporated in Bermuda and listed on AIM, a sub-market of the London Stock Exchange. The Company and its subsidiaries (together forming the ‘Group’) carry on business worldwide as owners and managers of insurance companies, live and in run-off, as underwriting managers for active insurers, as participators and managers of Lloyd’s Syndicates, as purchasers of insurance receivables and as service providers to the non-life insurance market. The Consolidated Financial Statements were approved by the Board of Directors on 19 April 2017.
2. Accounting policiesThe principal accounting policies adopted in the preparation of these Consolidated Financial Statements are set out below. These policies have been consistently applied to all the periods presented, unless otherwise stated.
a. Basis of preparationThe Consolidated Financial Statements have been prepared in accordance with International Financial Reporting Standards (‘IFRS’), endorsed by the European Union, International Financial Reporting Interpretations Committee interpretations and with the Bermuda Companies Act 1981 (as amended).
The Group Consolidated Financial Statements have been prepared under the historical cost convention, except that financial assets (including investment property), financial liabilities (including derivative instruments) and purchased reinsurance receivables are recorded at fair value through profit and loss. All amounts are stated in sterling and thousands, unless otherwise stated.
The preparation of the Consolidated Financial Statements in conformity with IFRS requires the use of estimates and assumptions that affect the reported amounts of assets and liabilities at the date of the Consolidated Financial Statements and the reported amounts of revenues and expenses during the year (Note 3). Although these estimates are based on management’s best knowledge of the amount, event or actions, actual results may differ from these estimates. The estimates and underlying assumptions are reviewed on an ongoing basis. Revisions to estimates are recognised in the current and future years depending on when the revision is made and the year it affects.
New and amended standards adopted by the GroupIn the current year, the Group has applied amendments to IFRSs issued by the IASB that are mandatorily effective for an accounting period that begins on or after 1 January 2016.
• IFRS 10: Amendment: Applying the consolidation exception• IFRS 11: Amendment: Accounting for acquisitions of interests in joint operations• IFRS 12: Amendment: Applying the consolidation exception• IAS 1: Amendment: Disclosure Initiative• IAS 16: Amendment: Clarification of acceptable methods of depreciation and amortisation• IAS 19: Amendment: Employee benefits and employee contributions• IAS 27: Amendment: Equity method in separate financial statements• IAS 28: Amendment: Applying the consolidation exception• IAS 38: Amendment: Clarification of acceptable methods of depreciation and amortisation• IFRS 2010-2012 annual improvement cycle• IFRS 2012-2014 annual improvement cycle
IFRS 10, IFRS 12 and IAS 28 Amendments, Applying the consolidation exceptionThese narrow scope amendments clarify the application of the requirements for investment entities to measure subsidiaries at fair value instead of consolidating them. There are no implications for the Group’s Consolidated Financial Statements as the Group does not meet the definition of an investment entity.
IFRS 11 Amendment, Accounting for acquisitions of interests in joint operationsThis amendment clarifies that the acquirer of an interest in a joint operation in which the activity constitutes a business, as defined in IFRS 3, is required to apply all of the principles on business combinations accounting in IFRS 3 and other IFRSs with the exception of those principles that conflict with the guidance in IFRS 11. The Group does not participate in joint operations which constitute a business and is not affected by the amendment.
IAS 1 Amendment, Disclosure initiative These amendments clarify guidance in IAS 1 on materiality and aggregation, the presentation of subtotals, the structure of financial statements and the disclosure of accounting policies. The amendments form part of the IASB’s Disclosure Initiative, which explores how financial statement disclosures can be improved. The adoption of these amendments has no impact on the Group’s profit or loss or equity.

41
Financial StatementsCorporate GovernanceStrategic Report
Randall & Quilter Investment Holdings Ltd.Annual Report 2016
IAS 16 and IAS 38 Amendments, Clarification of acceptable methods of depreciation and amortisationThese amendments provide additional guidance on how the depreciation or amortisation of property, plant and equipment and intangible assets should be calculated. The amendments to IAS 16 and IAS 38 prohibit the use of revenue-based depreciation for property, plant and equipment and significantly limit the use of revenue-based amortisation for intangible assets.
The adoption of these amendments has no impact for the Group’s Consolidated Financial Statements as the Group does not apply revenue-based depreciation or amortisation.
IAS 19, Employee benefits and employee contributions These narrow scope amendments simplify accounting for defined benefit plans that require contributions from employees or third parties. The adoption of the amendments has no impact on the Group’s Consolidated Financial Statements as the Group does not have defined benefit plans that require employees or third parties to contribute to the cost of the plan.
IAS 27 Amendments, Equity method in separate financial statements The amendments to IAS 27 allow investments in subsidiaries to be accounted for using the equity method within the Company’s financial statements. The Company does not intend to use the equity method in its separate financial statements.
IFRS 2010-2012 annual improvement cycleThese improvements consist of amendments to the following IFRS.
IFRS 2 Share Based Payments. Amendment to the definition on ‘vesting conditions’
IFRS 3 Business Combinations. Clarification that contingent consideration that is classified as an asset or a liability is measured at fair value.
IFRS 8 Operating Segments. Requires an entity to disclose the judgements made by management in applying the aggregation criteria to operating segments and clarification regarding when the disclosure of the reconciliation of reportable segments should be disclosed.
IFRS 13 Fair value measurement. Clarifies that issuing IFRS 13 and amending IFRS 9 and IAS 39 did not remove the ability to measure short-term receivables and payables with no stated interest rate at their invoice amounts without discounting if the effect of not discounting is immaterial.
IAS 16 Property, Plant and Equipment. IAS 38 Intangible Assets. To clarify that, when revaluing property, plant and equipment and intangible assets, the restatement of the accumulated depreciation or amortisation need not be proportionate to the change in the gross carrying amount of the asset.
IAS 24 Related Party Disclosures. Clarifies that an entity providing key management personnel services to the reporting entity or to the parent of the reporting entity is a related party of the reporting entity.
The amendments clarify existing guidance and the adoption of these amendments has not had a significant impact on the Group’s Consolidated Financial Statements.
IFRS 2012-2014 annual improvement cycleThese improvements consist of amendments to the following IFRS.
IFRS 5 Non-current Assets Held for Sale and Discontinued Operations. Provides disclosure guidance when an asset is reclassified as held for distribution and vice versa.
IFRS 7 Financial Instruments. Clarification on whether a servicing contract represents continuing involvement in a transferred asset for the purpose of disclosure requirements. Clarifies the disclosure requirements of financial asset and liability offsetting in respect of condensed interim financial statements.
IAS 19 Employee Benefits. Clarification on what discount rate should apply based on the currency in which the obligation is denominated.
IAS 34 Interim Financial Reporting. Clarification on the term ‘elsewhere in the interim financial report.’The amendments clarify existing guidance and the adoption of these amendments has not had a significant impact on the Group’s Consolidated Financial Statements.
A number of new standards and interpretations adopted by the EU which are not mandatorily effective, as well as standards and interpretations issued by the IASB but not yet adopted by the EU, have not been applied in preparing these financial statements.
42
Randall & Quilter Investment Holdings Ltd.Annual Report 2016
Notes to the Consolidated Financial StatementsFor the year ended 31 December 2016
2. Accounting policies continueda. Basis of preparation continuedThe Group does not plan to adopt these standards early; instead it will apply them from their effective dates as determined by their dates of EU endorsement. The Group is still reviewing the upcoming standards to determine their impact.
IFRS 9, Financial instruments (IASB effective date 1 January 2018)
IFRS 14, Regulatory deferral accounts (IASB effective date 1 January 2016)
IFRS 15, Revenue from contracts with customers (IASB effective date 1 January 2018)
IFRS 16, Leases (IASB effective date 1 January 2019)
IFRS 10 Amendment, Sale or contribution of assets between an investor and its associate or joint venture. (IASB have deferred the effective date)
IAS 7 Amendment, Disclosure initiative (IASB effective date 1 January 2017)
IAS 12 Amendment, Recognition of deferred tax assets for unrealised losses. (IASB effective date 1 January 2017)
IAS 28 Amendment, Sale or contribution of assets between an investor and its associate or joint venture. (IASB have deferred the effective date) Of the upcoming accounting standard changes that we are aware of, we anticipate that IFRS 4 Phase II, IFRS 9 and IFRS 15 will have the most material impact to the financial statements presentation and disclosures. The accounting developments and implementation timelines of these standards are being closely monitored and the impacts of the standards themselves are being reviewed. Full impact analysis in respect of these standards is expected to be completed at least 12 months prior to the effective date of each standard. A brief overview of these standards is provided below:
IFRS 4 Phase II will replace IFRS 4 Phase I (an interim standard that allows insurers to continue to use various accounting practices already in place) with a single principle-based accounting framework applicable to all types of insurance contracts (including reinsurance contracts);
IFRS 9 provides a reform of financial instruments accounting to supersede IAS 39 financial instruments: recognition and measurement. The standard contains the requirements for: a) the classification and measurement of financial liabilities; b) a new impairment methodology; and c) general hedge accounting. EU endorsement of IFRS 9 may continue to be delayed for insurers to align better with the release and adoption of IFRS 4 Phase II; andIFRS 15 establishes a single comprehensive model for entities to use in accounting for revenue from contracts with customers. Revenue from contracts accounted for under IFRS 4 is outside the scope of IFRS 15 however the Group will have to apply the new revenue recognition standard to non-insurance contracts. Furthermore, the Group may have to apply the new standard to non-insurance components of contracts traditionally considered to be insurance contracts. The new standard’s requirement for accounting for variable consideration could change the timing of revenue recognition for non-insurance contracts issued by the Group.
IFRS 16 ‘Leases’ specifies how an IFRS reporter will recognise, measure, prepare and disclose leases. The standard provides a single lessee accounting model, requiring lessees to recognise assets and liabilities for all leases unless the lease term is 12 months or less or the underlying asset has a low value. Lessors continue to classify leases as operating or finance, with IFRS 16’s approach to lessor accounting substantially unchanged from its predecessor IAS 17. The standard replaces IAS 17 ‘Leases’ and related interpretations. The standard is effective for annual periods beginning on or after 1 January 2019, with earlier adoption permitted if IFRS 15 ‘Revenue from contracts with customers’ has also been applied (subject to EU endorsement). b. Selection of accounting policiesJudgement, estimates and assumptions are made by the Directors in selecting each Group accounting policy. The accounting policies are selected by the Directors to present Consolidated Financial Statements that they consider provide the most relevant information. In the case of certain accounting policies, there are different accounting treatments that could be adopted, each of which would be in compliance with IFRS and would have a significant influence upon the basis on which the Consolidated Financial Statements are presented.
In respect of financial instruments, the Group accounting policy is to designate all financial assets as fair value through profit or loss, including purchased reinsurance receivables.
c. ConsolidationThe Consolidated Financial Statements incorporate the Financial Statements of the Company, and entities controlled by the Company (its subsidiaries), for the years ended 31 December 2016 and 2015. Control exists when the Group is exposed to, or has the right to, variable returns from its involvement with the entity and has the ability to affect those returns through its power over the entity. In assessing control, the Group takes into consideration potential voting rights that are currently exercisable. The acquisition date is the date on which control is transferred to the acquirer. The financial results of subsidiaries are included in the Consolidated Financial Statements from the date that control commences until the date that

43
Financial StatementsCorporate GovernanceStrategic Report
Randall & Quilter Investment Holdings Ltd.Annual Report 2016
control ceases. Losses applicable to the non-controlling interests in a subsidiary are allocated to the non-controlling interests even if doing so causes non-controlling interests to have a deficit balance.
The Group uses the acquisition method of accounting to account for business combinations. The cost of an acquisition is measured as the fair value of the assets given, equity instruments issued and liabilities incurred or assumed at the date of acquisition directly attributable to the acquisition. Acquisition-related costs are charged to the Consolidated Income Statement in the year in which they are incurred.
Certain Group subsidiaries underwrite as corporate members of Lloyd’s on syndicates managed by R&Q Managing Agency Limited. In view of the several and direct liability of underwriting members at Lloyd’s for the transactions of syndicates in which they participate, only attributable shares of transactions, assets and liabilities of those syndicates are included in the Consolidated Financial Statements. The Group continues to conclude that it remains appropriate to consolidate its share of the result of these syndicates and accordingly, as the Group is the sole provider of capacity on Syndicate 3330, these Financial Statements include 100.00% of the economic interest in that syndicate. For Syndicate 1991, the Group provides 20.01% on the 2014 year of account, 13.61% on the 2015 year of account and 13.61% on the 2016 year of account. These Consolidated Financial Statements include its relevant share of the result for those years and attributable assets and liabilities.
Associates are those entities in which the Group has power to exert influence but which it does not control. Investments in associates are accounted for using the equity method of accounting. Under this method the investments are initially measured at cost. Thereafter the Group’s share of post-acquisition profits or losses are recognised in the Consolidated Income Statement. Therefore, the cumulative post-acquisition movements in the associates’ net assets are adjusted against the cost of the investment.
When the Group’s share of losses equals or exceeds the carrying amount of the investment in the associate, the carrying amount is reduced to nil and recognition for the losses is discontinued except to the extent that the Group has incurred obligations in respect of the associate.
Equity accounting is discontinued when the Group no longer has significant influence over the investment.
Inter-company transactions, balances and unrealised gains on transactions between Group companies are eliminated in preparing the Consolidated Financial Statements. Unrealised losses are also eliminated unless the transaction provides evidence of impairment of the asset transferred. Non-controlling interests represent the portion of profit or loss and net assets not held by the Group and are presented separately in the Consolidated Income Statement and Consolidated Statement of Comprehensive Income and within equity in the Consolidated Statement of Financial Position, separately from the equity attributable to the shareholders of the Parent.
Insurance broking cash, receivables and payables held by subsidiary companies, other than the receivable for fees, commissions and interest earned on a transaction, are not included in the Group’s Consolidated Statement of Financial Position as the subsidiaries act as agents for the client in placing the insurable risks of their clients with insurers and as such are not liable as principals for amounts arising from such transactions.
d. Going concernThe Consolidated Financial Statements have been prepared on a going concern basis. The Directors have assessed the position of the Group and have concluded that the Group has adequate cash resources to meet its liabilities as they fall due. On this basis, the Directors have a reasonable expectation that the Group will be able to continue in operational existence for the foreseeable future.
e. Foreign currency translationFunctional and presentational currencyItems included in the financial statements of each of the Group’s entities are measured using the currency of the primary economic environment in which the entity operates (the ‘functional currency’). The Consolidated Financial Statements are presented in sterling, which is the Group’s presentational currency.
Transactions and balancesTransactions in foreign currencies are recorded at the functional currency rate ruling at the date of the transaction. Monetary assets and liabilities denominated in foreign currencies are retranslated at the functional currency rate of exchange ruling at the end of the reporting period; the resulting exchange gain or loss is recognised in the Consolidated Income Statement. Non-monetary items recorded at historical cost in a foreign currency are translated using the exchange rate as at the date of the initial transaction and are not subsequently restated.
Group translationThe assets and liabilities of overseas subsidiaries, including associated goodwill, held in functional currencies other than the Group’s presentational currency, are translated at the exchange rate as at the period end date. Income and expenses are translated at average rates for the period. All resulting exchange differences are recognised in Other Comprehensive Income and accumulated in retained earnings and other reserves in the Consolidated Statement of Financial Position.
On the disposal of foreign operations, cumulative exchange differences previously recognised in Other Comprehensive Income are recognised in the Consolidated Income Statement as part of the gain or loss on disposal.
44
Randall & Quilter Investment Holdings Ltd.Annual Report 2016
Notes to the Consolidated Financial StatementsFor the year ended 31 December 2016
2. Accounting policies continuedf. PremiumsGross premiums written represent premiums on business commencing in the financial year together with adjustments to premiums written in previous accounting periods and estimates for premiums from contracts entered into during the course of the year. Gross premiums written are stated before deduction of brokerage and commission but net of taxes and duties levied on premiums.
Unearned premiums A provision for unearned premiums represents that part of the gross premiums written that is estimated will be earned in the following financial periods. It is calculated on a time-apportionment basis having regard, where appropriate, to the incidence of risk.
Reinsurance premium costs are allocated to reflect the protection arranged in respect of the business written and earned.
Acquisition costsAcquisition costs, which represent commission and other related expenses, are deferred over the period in which the related premiums are earned. Acquisition costs incurred during the period are recorded in operating expenses in the Consolidated Income Statement.
g. Claims These include the cost of claims and related expenses paid in the year, together with changes in the provisions for outstanding claims, including provisions for claims incurred but not reported and related expenses, together with any other adjustments to claims from previous years. Where applicable, deductions are made for salvage and other recoveries. These are shown as net claims provisions (increased)/released in the Consolidated Income Statement.
h. Insurance contract provisions and reinsurers’ share of insurance liabilitiesProvisions are made in the insurance company subsidiaries and in the Lloyd’s Syndicates on which the Group participates for the full estimated costs of claims notified but not settled, including claims handling costs, on the basis of the best information available, taking account of inflation and latest trends in court awards. The Directors of the subsidiaries, with the assistance of run-off managers, independent actuaries and internal actuaries, have established such provisions on the basis of their own investigations and their best estimates of insurance payables, in accordance with accounting standards. Legal advice is taken where appropriate. Deductions are made for salvage and other recoveries as appropriate.
The provisions for claims incurred but not reported (‘IBNR’) have been based on a number of factors including previous experience in claims and settlement patterns, the nature and amount of business written, inflation and the latest available information as regards specific and general industry experience and trends.
A reinsurance asset (reinsurers’ share of technical provisions) is recognised to reflect the amount estimated to be recoverable under the reinsurance contracts in respect of the outstanding claims reported and IBNR. The amount recoverable from reinsurers is initially valued on the same basis as the underlying claims provision. The amount recoverable is reduced when there is an event arising after the initial recognition that provides objective evidence that the Group may not receive all amounts due under the contract.
Neither the outstanding claims nor the provisions for IBNR have been discounted.
The uncertainties which are inherent in the process of estimating are such that, in the normal course of events, unforeseen or unexpected future developments may cause the ultimate cost of settling the outstanding liabilities to differ materially from that presently estimated. Any differences between provisions and subsequent settlements are recorded in the Consolidated Income Statement in the year in which they arise.
Having regard to the significant uncertainty inherent in the business of insurance as explained in Note 3, and in light of the information presently available, in the opinion of the Directors the provisions for outstanding claims and IBNR in the Consolidated Financial Statements are fairly stated.
Provision for future claims handling costs Provision for future run-off costs relating to the Group’s run-off businesses is made to the extent that the estimate of such costs exceeds the estimated future investment income expected to be earned by those businesses.
Estimates are made for the anticipated costs of running-off the business of those insurance subsidiaries and the Group’s participation in syndicates which have insurance businesses in run-off. Where insurance company subsidiaries have businesses in run-off and underwrite new business, management estimates the run-off costs and the future investment income relating to the run-off business. Syndicates are treated as being in run-off for the Group financial statements where they have ceased writing new business and, in the opinion of management, there is no current probable reinsurer available to close the relevant syndicate year of account.
Changes in the estimates of such costs and future investment income are reflected in the year in which the estimates are made.

45
Financial StatementsCorporate GovernanceStrategic Report
Randall & Quilter Investment Holdings Ltd.Annual Report 2016
When assessing the amount of any provision to be made, the future investment income and claims handling and all other costs of all the insurance company subsidiaries’ and syndicates’ businesses in run-off are considered in aggregate.
The uncertainty inherent in the process of estimating the period of run-off and the payout pattern over that period, the anticipated run-off administration costs to be incurred over that period and the level of investment income to be received are such that in the normal course of events unforeseen or unexpected future developments may cause the ultimate costs of settling the outstanding liabilities to differ from that previously estimated.
Unexpired risks provision Provisions for unexpired risks are made where the costs of outstanding claims, related expense and deferred acquisition costs are expected to exceed the unearned premium provision carried forward at the end of the reporting period. The provision for unexpired risks is calculated separately by reference to classes of business which are managed together, after taking into account relevant investment return.
i. ProvisionsProvisions are recognised when the Group has a present obligation (legal or constructive) as a result of a past event, it is probable that the Group will be required to settle the obligation, and a reliable estimate can be made of the amount of the obligation.
Provisions are measured at the present value of the expenditures expected to be required to settle the obligation, using a pre-tax rate that reflects current market assessments of the time value of money and the risks specific to the obligation. The increase in the provision due to the passage of time is recognised as an interest expense.
j. Structured settlementsCertain of the US insurance company subsidiaries have entered into structured settlements whereby their liability has been settled by the purchase of annuities from third party life insurance companies in favour of the claimants. The subsidiary retains the credit risk in the unlikely event that the life insurance company defaults on its obligations to pay the annuity amounts. Provided that the life insurance company continues to meet the annuity obligations, no further liability will fall on the insurance company subsidiary. The amounts payable to claimants are recognised in liabilities. The amount payable to claimants by the third party life insurance companies are also shown in liabilities as reducing the Group’s liability to nil.
In the opinion of the Directors, this treatment reflects the substance of the transaction on the basis that any remaining liability of Group companies under structured settlements will only arise upon the failure of the relevant third party life insurance companies and will be reduced by any available reinsurance cover.
Should the Directors become aware that a third party life insurance company responsible for the payment of an annuity under a structured settlement may not be in a position to meet its annuity obligations in full, provision will be made for any such failure.
Disclosure of the position in relation to structured settlements is shown in Note 19.
k. Segmental reportingThe Group’s business segments are based on the Group’s management and internal reporting structures and represent the level at which financial information is reported to the Board, being the chief operating decision maker as defined in IFRS 8.
l. Financial instrumentsFinancial instruments are recognised in the Consolidated Statement of Financial Position at such time that the Group becomes a party to the contractual provisions of the financial instrument. A financial asset is derecognised when the contractual rights to receive cash flows from the financial assets expire, or where the financial assets have been transferred, together with substantially all the risks and rewards of ownership. Financial liabilities are derecognised if the Group’s obligations specified in the contract expire, are discharged or cancelled.
Financial assetsi) AcquisitionOn acquisition of a financial asset, the Group is required under IFRS to classify the asset into one of the following categories: ‘financial assets at fair value through profit and loss’, ‘loans and receivables held to maturity’ and ‘available for sale’. The Group does not currently make use of the ‘held to maturity’ and ‘available for sale’ classifications.
ii) Financial assets at fair value through profit and lossAll financial assets, other than cash, loans and receivables, are currently designated as fair value through profit and loss upon initial recognition because they are managed and their performance is evaluated on a fair value basis. Information about these financial assets is provided internally on a fair value basis to the Group’s key management. The Group’s investment strategy is to invest and evaluate their performance with reference to their fair values.
46
Randall & Quilter Investment Holdings Ltd.Annual Report 2016
Notes to the Consolidated Financial StatementsFor the year ended 31 December 2016
2. Accounting policies continuedl. Financial instruments continuediii) Fair value measurementWhen available, the Group measures the fair value of an instrument using quoted prices in an active market for that instrument.
If a market for a financial instrument is not active, the Group establishes fair value using a valuation technique. Valuation techniques include using recent arm’s length transactions between knowledgeable, willing parties (if available) and reference to the current fair value of other instruments that are substantially the same or discounted cash flow analyses.
Assets and long positions are measured at a bid price; liabilities and short positions are measured at an asking price. Where the Group has positions with offsetting risks, mid-market prices are used to measure the offsetting risk positions and a bid or asking price adjustment is applied only to the net open position as appropriate. Fair values reflect the credit risk of the instrument and include adjustments to take account of the credit risk of the Group entity and counterparty where appropriate. Fair value estimates obtained from models are adjusted for any other factors, such as liquidity risk or model uncertainties, to the extent that the Group believes a third party market participant would take them into account in pricing a transaction.
Upon initial recognition, attributable transaction costs relating to financial instruments at fair value through profit or loss are recognised when incurred in other operating expenses in the Consolidated Income Statement. Financial assets at fair value through profit and loss are measured at fair value, and changes therein are recognised in the Consolidated Income Statement. Net changes in the fair value of financial assets at fair value through profit and loss exclude interest and dividend income, as these items are accounted for separately as set out in the investment income section below.
iv) Insurance receivables and payablesInsurance receivables and payables are recognised when due. These include amounts due to and from agents, brokers and insurance contract holders. Insurance receivables are classified as ‘loans and receivables’ as they are non-derivative financial assets with fixed or determinable payments that are not quoted on an active market. Insurance receivables are measured at amortised cost less any provision for impairments. Insurance payables are stated at amortised cost.
v) Investment incomeInvestment income consists of dividends, interest, realised and unrealised gains and losses and exchange gains and losses on financial assets at fair value through profit and loss. The realised gains or losses on disposal of an investment are the difference between the proceeds and the original cost of the investment. Unrealised investment gains and losses represent the difference between the carrying amount at the reporting date, and the carrying amount at the previous period end or the purchase value during the period. Financial liabilitiesBorrowingsBorrowings are initially recorded at fair value less transaction costs incurred. Subsequently, borrowings are stated at amortised cost and interest is recognised in the Consolidated Income Statement over the period of the borrowings.
Subordinated debtGroup subsidiaries have issued subordinated debt. At Group level this is treated as a financial liability and interest charges are recognised in the Consolidated Income Statement.
Derivative financial instrumentsDerivatives are initially recognised at fair value on the date on which a derivative contract is entered into and are subsequently remeasured at their fair value. The best evidence of fair value of a derivative at initial recognition is the transaction price. The method of recognising the resulting fair value gains or losses depends on whether the derivative is designated as a hedging instrument and, if so, the nature of the item being hedged. Fair values are obtained from quoted market prices in active markets, recent market transactions, and valuation techniques which include discounted cash flow models. All derivatives are carried as assets when fair value is positive and as liabilities when fair value is negative.
The Group has not designated any derivatives as fair value hedges, cash flow hedges or net investment hedges.
m. Treasury sharesThe Employee Benefit Trust was closed on 23 December 2015. There are no shares held in Treasury.
n. LeasesLeases in which a significant portion of the risks and rewards of ownership are retained by the lessor are classed as operating leases. Payments made under operating leases (net of any incentives received from the lessor) are charged to the Consolidated Income Statement on a straight-line basis over the period of the lease.

47
Financial StatementsCorporate GovernanceStrategic Report
Randall & Quilter Investment Holdings Ltd.Annual Report 2016
o. Property, plant and equipmentAll assets included within property, plant and equipment (‘PPE’) are carried at historical cost less depreciation. Depreciation is calculated to write down the cost less estimated residual value of motor vehicles, office equipment, IT equipment, freehold property and leasehold improvements by the straight-line method over their expected useful lives.
The principal rates per annum used for this purpose are:
%
Motor vehicles 25Office equipment 8 – 50IT equipment 20 – 25Freehold property 2Leasehold improvements Term of lease
The gain or loss arising on the disposal of an item of PPE is determined as the difference between the sales proceeds and the carrying amount of the asset and is recognised in the Consolidated Income Statement.
p. GoodwillThe Group uses the acquisition method in accounting for acquisitions. The difference between the cost of acquisition and the fair value of the Group’s share of the identifiable net assets acquired is capitalised and recorded as goodwill. If the cost of an acquisition is less than the fair value of the net assets of the subsidiary acquired the difference is recognised directly in the Consolidated Income Statement as goodwill on bargain purchase.
Goodwill acquired in a business combination is initially measured at cost, being the excess of the fair value of the consideration paid for the business combination over the Group’s interest in the net fair value of the identifiable assets, liabilities and contingent liabilities. Following initial recognition, goodwill is measured at cost less any accumulated impairment losses. Goodwill is tested for impairment at the cash generating unit level, as shown in Note 14, on a biannual basis or if events or changes in circumstances indicate that the carrying amount may be impaired.
q. Other intangible assetsIntangible assets, other than goodwill, that are acquired separately are stated at cost less accumulated amortisation and impairment.
Intangible assets acquired in a business combination, and recognised separately from goodwill, are recognised initially at fair value at the acquisition date.
Amortisation is charged to operating expenses in the Consolidated Income Statement as follows:
Purchased IT software 3 – 5 years, on a straight-line basisOn acquisition of insurance companies in run-off Estimated pattern of run-offOn acquisitions – other Useful life, which may be indefinite
Assets that are subject to amortisation are reviewed for impairment whenever events or changes in circumstances indicate that the carrying amount may not be recoverable. An impairment loss is recognised in the Consolidated Income Statement to reduce the carrying amount to the recoverable amount.
US insurance authorisation licencesUS state insurance authorisation licences acquired in business combinations are recognised initially at their fair value. The asset is not amortised, as the Directors consider that economic benefits will accrue to the Group over an indefinite period due to the stability of the US insurance market. The licences are tested annually for impairment. This assumption is reviewed annually to determine whether the asset continues to have an indefinite life.
Rights to customer contractual relationshipsCosts directly attributable to securing the intangible rights to customer contractual relationships are recognised as an intangible asset where they can be identified separately and measured reliably and it is probable that they will be recovered by directly related future profits. These costs are amortised on a straight-line basis over the useful economic life which is deemed to be 15 years and are carried at cost less accumulated amortisation and impairment losses.

48
Randall & Quilter Investment Holdings Ltd.Annual Report 2016
Notes to the Consolidated Financial StatementsFor the year ended 31 December 2016
2. Accounting policies continuedr. Employee BenefitsThe Group makes contributions to defined contribution schemes and a defined benefit scheme.
The pension cost in respect of the defined contribution schemes represents the amounts payable by the Group for the year. The funds of the schemes are administered by trustees and are separate from the Group. The Group’s liability is limited to the amount of the contributions.
The defined benefit scheme is funded by contributions from a subsidiary company and its assets are held in a separate trustee-administered fund. Pension scheme assets are measured at market value, and liabilities are measured using the projected unit method and discounted at the current rate of return on high quality corporate bonds of equivalent term and currency to the liability.
Current service cost, net interest income or cost and any curtailments/settlements are charged to the Consolidated Income Statement. The present value of the defined benefit obligation at the end of the reporting period less the fair value of plan assets is recognised and disclosed separately as a net pension liability in the Consolidated Statement of Financial Position. Surpluses are only recognised up to the aggregate of any cumulative unrecognised net actuarial gains and past service costs, and the present value of any economic benefits available in the form of any refunds or reductions in future contributions.
Subject to the restrictions relating to the recognition of a pension surplus, all actuarial gains and losses are recognised in full in Other Comprehensive Income in the period in which they occur.
s. Cash and cash equivalentsFor the purposes of the Consolidated Cash Flow Statement, cash and cash equivalents comprise cash at bank and other short-term highly liquid investments with a maturity of three months or less from the date of acquisition, and bank overdrafts which are repayable on demand.
t. Finance costsFinance costs comprise interest payable and are recognised in the Consolidated Income Statement in line with the effective interest rate on liabilities.
u. Operating expensesOperating expenses are accounted for in the Consolidated Income Statement in the period to which they relate.
Pre-contract costs Directly attributable pre-contract costs are recognised as an asset when it is virtually certain that a contract will be obtained and the contract is expected to result in future net cash inflows in excess of any amounts recognised as an asset.
Pre-contract costs are charged to the Consolidated Income Statement over the shorter of the life of the contract or five years.
Onerous contracts Onerous contract provisions are provided for in circumstances where the Group has a present legal or constructive obligation as a result of past events to provide services, the costs of which exceed future income. The costs of providing the services are projected based on management’s assessment of the contract.
Arrangement fees Arrangement fees in relation to loan facilities are deducted from the relevant financial liability and amortised over the period of the facility.
v. Other incomeOther income is stated excluding any applicable value added tax and includes the following items:
Management feesManagement fees are from non-Group customers and are recognised when the right to such fees is established through a contract and to the extent that the services concerned have been performed.
Purchased reinsurance receivablesThe Group accounts for these financial assets at fair value through profit and loss. Fair value is defined as the price at which an orderly transaction would take place between market participants at the reporting date and is therefore an estimate which requires the use of judgement.
Profit commission on managed Lloyd’s SyndicatesProfit commission from managed syndicates is earned as the related underwriting profits are recognised. Profit commission receivable on open underwriting years may be subject to further adjustment (up or down) as the results are reported prior to closure of the account in accordance with Lloyd’s Reinsurance to Close arrangements.

49
Financial StatementsCorporate GovernanceStrategic Report
Randall & Quilter Investment Holdings Ltd.Annual Report 2016
Insurance commissions from Managing General AgenciesInsurance commissions comprise brokerage and profit commission arising from the placement of insurance contracts. Brokerage is recognised at the inception date of the policy, or the date of contractual entitlement, if later. Alterations in brokerage arising from premium adjustments are taken into account as and when such adjustments are notified. To the extent that the Group is contractually obliged to provide services after this date, a suitable proportion of income is deferred and recognised over the life of the relevant contracts to ensure that revenue appropriately reflects the cost of fulfilling those obligations. Profit commission is recognised when the right to such profit commission is established through a contract but only to the extent that a reliable estimate of the amount due can be made. Such estimates are made on a prudent basis that reflects the level of uncertainty involved.
w. Share-based paymentsThe Group issues equity-settled payments to certain of its employees.
The cost of equity-settled transactions with employees is measured by reference to the fair value at the date at which they are granted and is recognised as an expense on a straight-line basis over the vesting period. The fair value is measured using the binomial option pricing method, taking into account the terms and conditions on which the awards were granted.
x. Current and deferred income taxTax on the profit or loss for the year comprises current and deferred tax.
Tax is recognised in the Consolidated Income Statement except to the extent that it relates to items recognised in Other Comprehensive Income, in which case it is recognised in the Consolidated Statement of Comprehensive Income.
The current income tax charge is calculated on the basis of the tax laws enacted or substantively enacted at the end of the reporting period in the countries where the Company’s subsidiaries and associates operate and generate taxable income.
Deferred tax liabilities are provided in full, using the liability method, on temporary differences arising between the tax bases of assets and liabilities and their carrying amounts in the Consolidated Financial Statements. However, if the deferred tax arises from initial recognition of an asset or liability in a transaction other than a business combination and which, at the time of the transaction, affects neither accounting nor taxable profit or loss, it is not provided for.
Deferred tax assets are recognised to the extent that it is probable that future taxable profits will be available against which these temporary differences can be utilised. Deferred tax assets and liabilities are not discounted.
Deferred income tax assets and liabilities are offset when there is a legally enforceable right to offset current tax assets against current tax liabilities and when the deferred income tax assets and liabilities relate to income taxes levied by the same taxation authority on either the taxable entity or different taxable entities where there is an intention to settle the balances on a net basis. Deferred tax assets and liabilities are determined using tax rates that have been enacted or substantively enacted by the period end date and are expected to apply when the related deferred tax asset is realised or the deferred tax liability is settled.
y. Share capitalOrdinary Shares and Preference A and B shares are classified as equity. Incremental costs directly attributable to the issue of new shares or options are shown in equity as a deduction, net of tax, from the proceeds. z. DistributionsDistributions payable to the Company’s shareholders are recognised as a liability in the Consolidated Financial Statements in the period in which the distributions are declared and appropriately approved.
3. Estimation techniques, uncertainties and contingenciesEstimates and judgements are continually evaluated, and are based on historical experience and other factors, including expectations of future events that are believed to be reasonable under the circumstances.
Significant uncertainty in technical provisions Significant uncertainty exists as to the accuracy of the insurance contract provisions and the reinsurers’ share of insurance liabilities established in the insurance company subsidiaries and the Lloyd’s Syndicates on which the Group participates as shown in the Consolidated Statement of Financial Position. The ultimate costs of claims and the amounts ultimately recovered from reinsurers could vary materially from the amounts established at the year end.
In the event that further information were to become available to the Directors of an insurance company subsidiary which gave rise to material additional liabilities, the going concern basis might no longer be appropriate for that company and adjustments would have to be made to reduce the value of its assets to their realisable amount, and to provide for any further liabilities which might arise. However, should this occur it will not impact on the going concern basis applicable to the Group.
50
Randall & Quilter Investment Holdings Ltd.Annual Report 2016
Notes to the Consolidated Financial StatementsFor the year ended 31 December 2016
3. Estimation techniques, uncertainties and contingencies continuedThe Company bears no financial responsibility for any liabilities or obligations of any insurance company subsidiary in run-off. Should any insurance company subsidiary cease to be able to continue as a going concern in the light of further information becoming available, any loss to the Company and its other subsidiaries would thus be restricted to the book value of their investment in and amounts due from that subsidiary and any guarantee liability that may arise.
Claims provisionsThe Group participates on a number of syndicates and owns a number of insurance companies in run-off. The Consolidated Financial Statements include provisions for all outstanding claims and IBNR, for related reinsurance recoveries and for all costs expected to be incurred to run off its liabilities.
The insurance contract provisions including IBNR are based upon actuarial and other studies of the ultimate cost of liabilities including exposure-based and statistical estimation techniques. There are significant uncertainties inherent in the estimation of each insurance company subsidiary’s and Lloyd’s Syndicate’s insurance liabilities and reinsurance recoveries. There are many assumptions and estimation techniques that may be applied in assessing the amount of those provisions which individually could have a material impact on the amounts of liabilities, related reinsurance assets and reported shareholders’ equity funds. Actual experience will often vary from these assumptions, and any consequential adjustments to amounts previously reported will be reflected in the results of the year in which they are identified. Potential adjustments arising in the future could, if adverse in the aggregate, exceed the amount of shareholders’ equity funds of an insurance company subsidiary.
The Group also contracts with independent external actuaries to obtain a Statement of Actuarial Opinion for the Lloyd’s Syndicates that it participates on. This statement shows that the booked reserves are greater than or equal to their view of best estimate. In the case of the Group’s larger insurance companies in run-off, independent external actuaries provide a range of acceptable estimates. The Group sets its reserves to lie within this acceptable range.
The business written by the insurance company subsidiaries consists in part of long-tail liabilities, including asbestos, pollution, health hazard and other US liability insurance. The claims for this type of business are typically not settled until many years after policies have been written. Furthermore, much of the business written by these companies is reinsurance and retrocession of other insurance companies’ business, which lengthens the settlement period.
Significant delays occur in the notification and settlement of certain claims and a substantial measure of experience and judgement is involved in making the assumptions necessary for assessing outstanding liabilities, the ultimate cost of which cannot be known with certainty at the period end date. The gross insurance contract provisions and related reinsurers’ share of insurance liabilities are estimated on the basis of information currently available. Provisions are calculated gross of any reinsurance recoveries. A separate estimate is made of the amounts that will be recoverable from reinsurers based upon the gross provisions and having due regard to collectability.
The insurance contract provisions include significant amounts in respect of notified and potential IBNR claims for long-tail liabilities. The settlement of most of these claims is not expected to occur for many years, and there is significant uncertainty as to the timing of such settlements and the amounts at which they will be settled.
While many claims are clearly covered and are paid quickly, many other claims are subject to significant disputes, for example over the terms of a policy and the amount of the claim. The provisions for disputed claims are based on the view of the Directors of each insurance company subsidiary as to the expected outcomes of such disputes. Claim types impacted by such disputes include asbestos, pollution and certain health hazards and retrocessional reinsurance claims.
Uncertainty is further increased because of the potential for unforeseen changes in the legal, judicial, technological or social environments, which may increase or decrease the cost, frequency or reporting of claims, and because of the potential for new sources or types of claim to emerge.
Asbestos, pollution and health hazard claimsThe estimation of the provisions for the ultimate cost of claims for asbestos, pollution, health hazard and other US liability insurance is subject to a range of uncertainties that is generally greater than those encountered for other classes of insurance business. As a result it is not possible to determine the future development of asbestos, pollution, health hazard and other US liability insurance with the same degree of reliability as with other types of claims. Consequently, traditional techniques for estimating claims provisions cannot wholly be relied upon. The Group employs further techniques which utilise, where practical, the exposure to these losses by contract to determine the claims provisions.
Insurance claims handling expensesThe provision for the cost of handling and settling outstanding claims to extinction and all other costs of managing the run-off is based on an analysis of the expected costs to be incurred in run-off activities, incorporating expected savings from the reduction of transaction volumes over time.
The period of the run-off may be between five and 50 years depending upon the nature of the liabilities within each insurance company subsidiary. Ultimately, the period of run-off is dependent on the timing and settlement of claims and the collection of reinsurance recoveries; consequently similar uncertainties apply to the assessment of the provision for such costs.
51
Financial StatementsCorporate GovernanceStrategic Report
Randall & Quilter Investment Holdings Ltd.Annual Report 2016
Reinsurance recoveriesReinsurance recoveries are included in respect of claims outstanding (including IBNR claims) and claims paid after making provision for irrecoverable amounts.
The reinsurance recoveries on IBNR claims are estimated based on the recovery rate experienced on notified and paid claims for each class of business.
The insurance company subsidiaries are exposed to disputes on contracts with their reinsurers and the possibility of default by reinsurers. In establishing the provision for non-recovery of reinsurance balances, the Directors of each insurance company subsidiary consider the financial strength of each reinsurer, its ability to settle their liabilities as they fall due, the history of past settlements with the reinsurer, and the Group’s own reserving standards and have regard to legal advice regarding the merits of any dispute.
Recognition and de-recognition of assets and liabilities in run-offsIn the course of the Group’s business of managing run-offs of insurers and brokers, accounting records are initially recognised in the form provided by previous management. As part of managing run-offs the Group carries out extensive enquiries to clarify the assets and liabilities of the run-off and to obtain all available and relevant information. Those enquiries may lead the Group to identify and record additional assets and liabilities relating to that run-off, or to conclude that previously recognised assets and liabilities should be increased or no longer exist and should be de-recognised. Where decisions to de-recognise liabilities are supported by an absence of relevant information there may remain a remote possibility that a third party may subsequently provide evidence of its entitlement to such de-recognised liabilities which may lead to a transfer of economic benefit to settle such entitlement. The right of a third party to such a settlement will be recognised in the accounting period in which the position is clarified.
Defined benefit pension schemeThe pension assets and post retirement liabilities are calculated in accordance with IAS 19. The assets, liabilities and Consolidated Income Statement charge or credit, calculated in accordance with IAS 19, are sensitive to the assumptions made, including inflation, interest rate, investment return and mortality. IAS 19 compares, at a given date, the current market value of a pension fund’s assets with its long-term liabilities, which are calculated using a discount rate in line with yields on ‘AA’ rated bonds of suitable duration and currency. As such, the financial position of a pension fund on this basis is highly sensitive to changes in bond rates and equity markets.
Litigation, mediation and arbitrationThe Group, in common with the insurance industry in general, is subject to litigation, mediation and arbitration, and regulatory, governmental and other sectorial inquiries in the normal course of its business. The Directors do not believe that, in the aggregate, current litigation, governmental or sectorial inquiries and pending or threatened litigation or dispute is likely to have a material impact on the Group’s financial position. However, if the outcome of any individual dispute differs substantially from expectation, there could be a material impact on the Group’s profit or loss, financial position or cash flows in the year in which that impact is recognised.
Changes in foreign exchange ratesThe Group’s Consolidated Financial Statements are prepared in sterling. Therefore, fluctuations in exchange rates used to translate other currencies, particularly the Euro and US dollar, into sterling will impact the reported Consolidated Statement of Financial Position, results of operations and cash flows from year to year. These fluctuations in exchange rates will also impact the sterling value of the Group’s investments and the return on its investments. Income and expenses are translated into sterling at average exchange rates. Monetary assets and liabilities are translated at the closing exchange rates at the period end date.
Assessment of impairment of intangible assetsGoodwill and US insurance authorisation licences are deemed to have an indefinite life as they are expected to have a value in use that does not erode or become obsolete over the course of time. Consequently, they are not amortised but tested for impairment on a biannual basis or if events or changes in circumstances indicate that the carrying amount may be impaired.
The impairment tests involve evaluating the recoverable amount of the Group’s cash generating units and comparing them to the relevant carrying amounts. The recoverable amount of each cash generating unit is determined based on cash flow projections. These cash flow projections are based on the financial budgets approved by management covering a five year period. Management also consider the current net asset value and earnings of each cash generating unit for impairment.
ProvisionsIncluded in Other payables in Note 19 is the Directors’ estimate of the Group’s exposure to the various liabilities of the Southern Illinois Land Company.
These estimates have been based on reports provided by recognised specialists as well as the Group’s own internal review. These liabilities may not be settled for many years and significant judgement is involved in making an assessment of these liabilities, the period over which they will be settled and where appropriate the discount rate to be applied to assess the present value of these amounts to be settled.
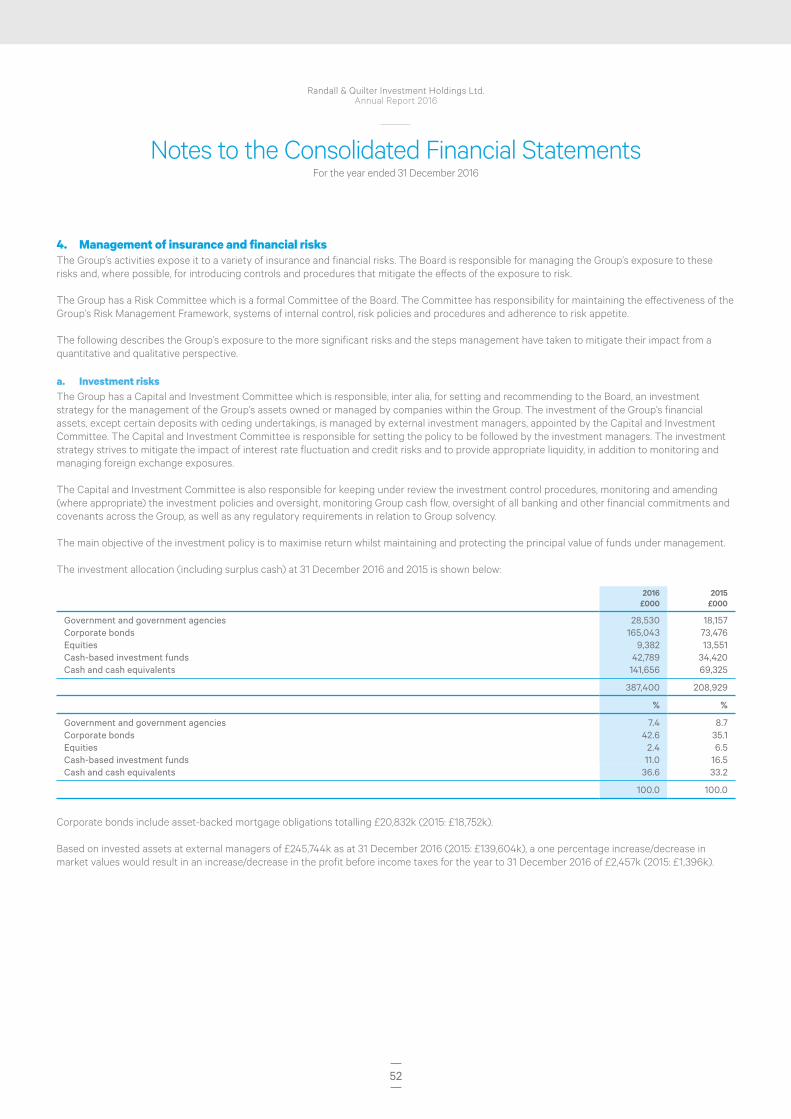
52
Randall & Quilter Investment Holdings Ltd.Annual Report 2016
Notes to the Consolidated Financial StatementsFor the year ended 31 December 2016
4. Management of insurance and financial risksThe Group’s activities expose it to a variety of insurance and financial risks. The Board is responsible for managing the Group’s exposure to these risks and, where possible, for introducing controls and procedures that mitigate the effects of the exposure to risk.
The Group has a Risk Committee which is a formal Committee of the Board. The Committee has responsibility for maintaining the effectiveness of the Group’s Risk Management Framework, systems of internal control, risk policies and procedures and adherence to risk appetite.
The following describes the Group’s exposure to the more significant risks and the steps management have taken to mitigate their impact from a quantitative and qualitative perspective.
a. Investment risksThe Group has a Capital and Investment Committee which is responsible, inter alia, for setting and recommending to the Board, an investment strategy for the management of the Group’s assets owned or managed by companies within the Group. The investment of the Group’s financial assets, except certain deposits with ceding undertakings, is managed by external investment managers, appointed by the Capital and Investment Committee. The Capital and Investment Committee is responsible for setting the policy to be followed by the investment managers. The investment strategy strives to mitigate the impact of interest rate fluctuation and credit risks and to provide appropriate liquidity, in addition to monitoring and managing foreign exchange exposures.
The Capital and Investment Committee is also responsible for keeping under review the investment control procedures, monitoring and amending (where appropriate) the investment policies and oversight, monitoring Group cash flow, oversight of all banking and other financial commitments and covenants across the Group, as well as any regulatory requirements in relation to Group solvency.
The main objective of the investment policy is to maximise return whilst maintaining and protecting the principal value of funds under management.
The investment allocation (including surplus cash) at 31 December 2016 and 2015 is shown below:
2016 £000
2015 £000
Government and government agencies 28,530 18,157Corporate bonds 165,043 73,476Equities 9,382 13,551Cash-based investment funds 42,789 34,420Cash and cash equivalents 141,656 69,325
387,400 208,929
% %
Government and government agencies 7.4 8.7Corporate bonds 42.6 35.1Equities 2.4 6.5Cash-based investment funds 11.0 16.5Cash and cash equivalents 36.6 33.2
100.0 100.0
Corporate bonds include asset-backed mortgage obligations totalling £20,832k (2015: £18,752k).
Based on invested assets at external managers of £245,744k as at 31 December 2016 (2015: £139,604k), a one percentage increase/decrease in market values would result in an increase/decrease in the profit before income taxes for the year to 31 December 2016 of £2,457k (2015: £1,396k).
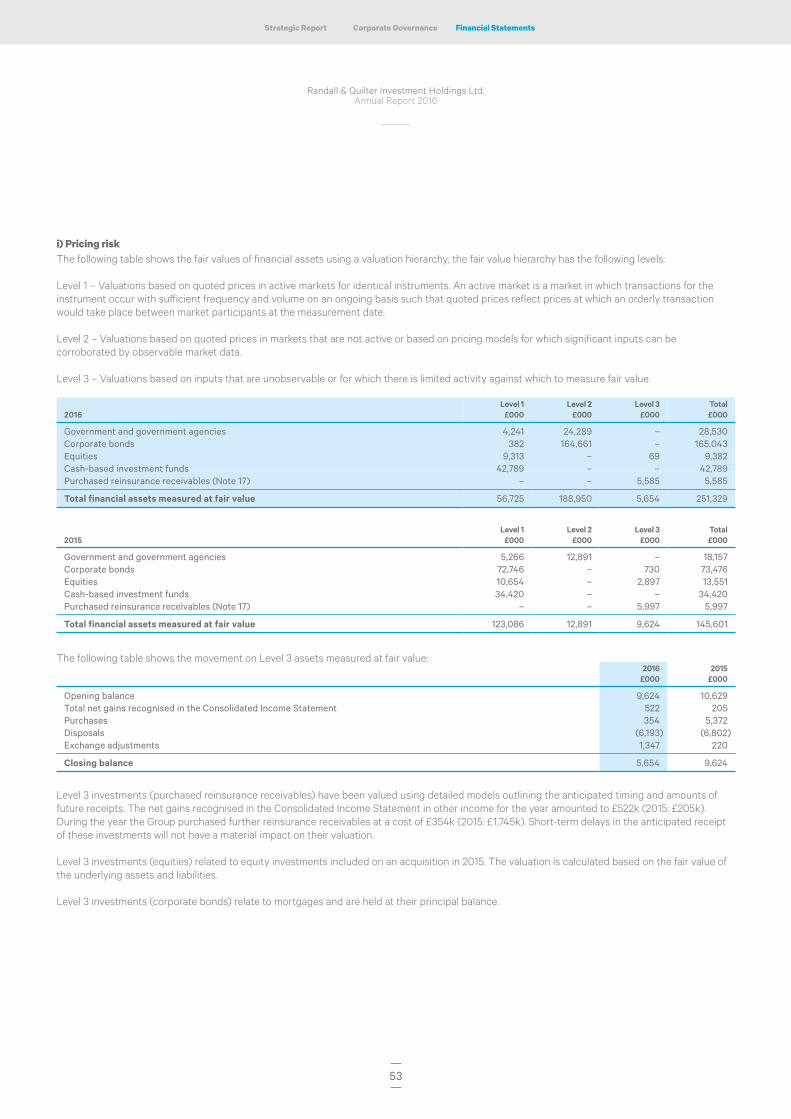
53
Financial StatementsCorporate GovernanceStrategic Report
Randall & Quilter Investment Holdings Ltd.Annual Report 2016
i) Pricing riskThe following table shows the fair values of financial assets using a valuation hierarchy; the fair value hierarchy has the following levels:
Level 1 – Valuations based on quoted prices in active markets for identical instruments. An active market is a market in which transactions for the instrument occur with sufficient frequency and volume on an ongoing basis such that quoted prices reflect prices at which an orderly transaction would take place between market participants at the measurement date.
Level 2 – Valuations based on quoted prices in markets that are not active or based on pricing models for which significant inputs can be corroborated by observable market data.
Level 3 – Valuations based on inputs that are unobservable or for which there is limited activity against which to measure fair value.
2016Level 1
£000Level 2
£000Level 3
£000Total £000
Government and government agencies 4,241 24,289 – 28,530Corporate bonds 382 164,661 – 165,043Equities 9,313 – 69 9,382Cash-based investment funds 42,789 – – 42,789Purchased reinsurance receivables (Note 17) – – 5,585 5,585
Total financial assets measured at fair value 56,725 188,950 5,654 251,329
2015Level 1
£000Level 2
£000Level 3
£000Total £000
Government and government agencies 5,266 12,891 – 18,157Corporate bonds 72,746 – 730 73,476Equities 10,654 – 2,897 13,551Cash-based investment funds 34,420 – – 34,420Purchased reinsurance receivables (Note 17) – – 5,997 5,997
Total financial assets measured at fair value 123,086 12,891 9,624 145,601
The following table shows the movement on Level 3 assets measured at fair value:2016
£0002015
£000
Opening balance 9,624 10,629 Total net gains recognised in the Consolidated Income Statement 522 205 Purchases 354 5,372 Disposals (6,193) (6,802)Exchange adjustments 1,347 220
Closing balance 5,654 9,624
Level 3 investments (purchased reinsurance receivables) have been valued using detailed models outlining the anticipated timing and amounts of future receipts. The net gains recognised in the Consolidated Income Statement in other income for the year amounted to £522k (2015: £205k). During the year the Group purchased further reinsurance receivables at a cost of £354k (2015: £1,745k). Short-term delays in the anticipated receipt of these investments will not have a material impact on their valuation.
Level 3 investments (equities) related to equity investments included on an acquisition in 2015. The valuation is calculated based on the fair value of the underlying assets and liabilities.
Level 3 investments (corporate bonds) relate to mortgages and are held at their principal balance.
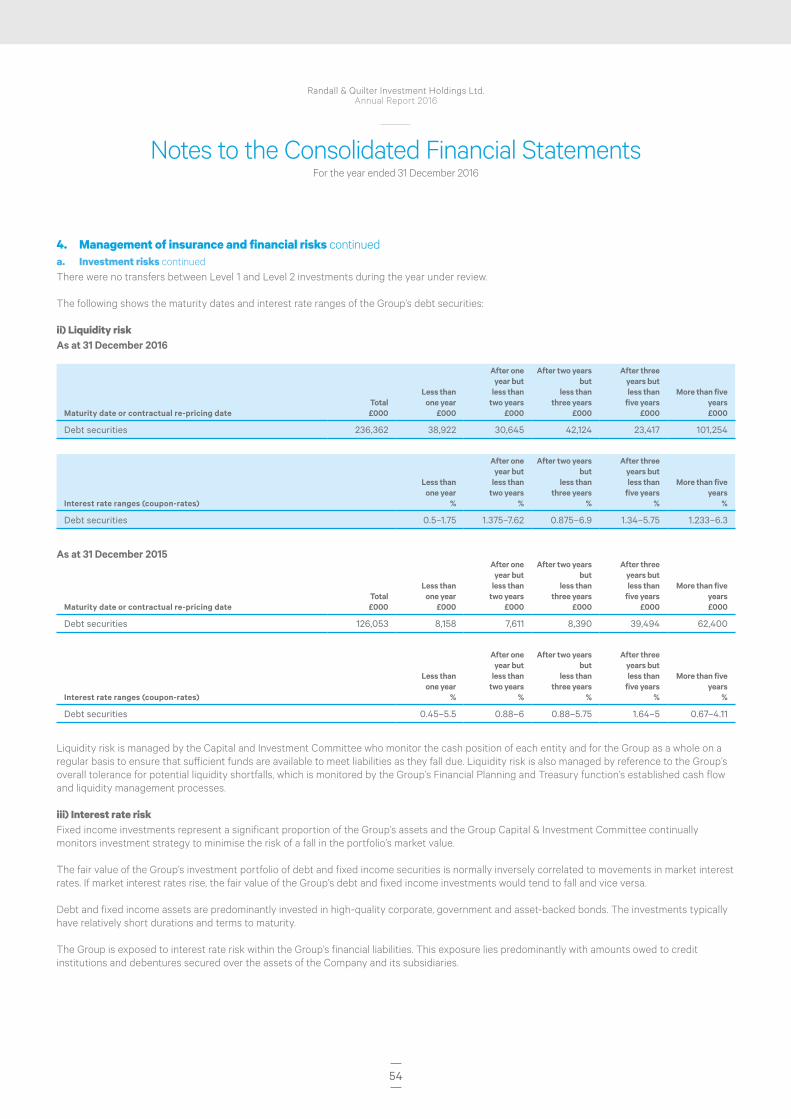
54
Randall & Quilter Investment Holdings Ltd.Annual Report 2016
Notes to the Consolidated Financial StatementsFor the year ended 31 December 2016
4. Management of insurance and financial risks continueda. Investment risks continuedThere were no transfers between Level 1 and Level 2 investments during the year under review.
The following shows the maturity dates and interest rate ranges of the Group’s debt securities:
ii) Liquidity riskAs at 31 December 2016
Maturity date or contractual re-pricing dateTotal£000
Less than one year
£000
After one year but
less than two years
£000
After two years but
less than three years
£000
After three years but less than five years
£000
More than five years£000
Debt securities 236,362 38,922 30,645 42,124 23,417 101,254
Interest rate ranges (coupon-rates)
Less than one year
%
After one year but
less than two years
%
After two years but
less than three years
%
After three years but less than five years
%
More than five years
%
Debt securities 0.5–1.75 1.375–7.62 0.875–6.9 1.34–5.75 1.233–6.3
As at 31 December 2015
Maturity date or contractual re-pricing dateTotal£000
Less than one year
£000
After one year but
less than two years
£000
After two years but
less than three years
£000
After three years but less than five years
£000
More than five years£000
Debt securities 126,053 8,158 7,611 8,390 39,494 62,400
Interest rate ranges (coupon-rates)
Less than one year
%
After one year but
less than two years
%
After two years but
less than three years
%
After three years but less than five years
%
More than five years
%
Debt securities 0.45–5.5 0.88–6 0.88–5.75 1.64–5 0.67–4.11
Liquidity risk is managed by the Capital and Investment Committee who monitor the cash position of each entity and for the Group as a whole on a regular basis to ensure that sufficient funds are available to meet liabilities as they fall due. Liquidity risk is also managed by reference to the Group’s overall tolerance for potential liquidity shortfalls, which is monitored by the Group’s Financial Planning and Treasury function’s established cash flow and liquidity management processes.
iii) Interest rate riskFixed income investments represent a significant proportion of the Group’s assets and the Group Capital & Investment Committee continually monitors investment strategy to minimise the risk of a fall in the portfolio’s market value.
The fair value of the Group’s investment portfolio of debt and fixed income securities is normally inversely correlated to movements in market interest rates. If market interest rates rise, the fair value of the Group’s debt and fixed income investments would tend to fall and vice versa.
Debt and fixed income assets are predominantly invested in high-quality corporate, government and asset-backed bonds. The investments typically have relatively short durations and terms to maturity.
The Group is exposed to interest rate risk within the Group’s financial liabilities. This exposure lies predominantly with amounts owed to credit institutions and debentures secured over the assets of the Company and its subsidiaries.
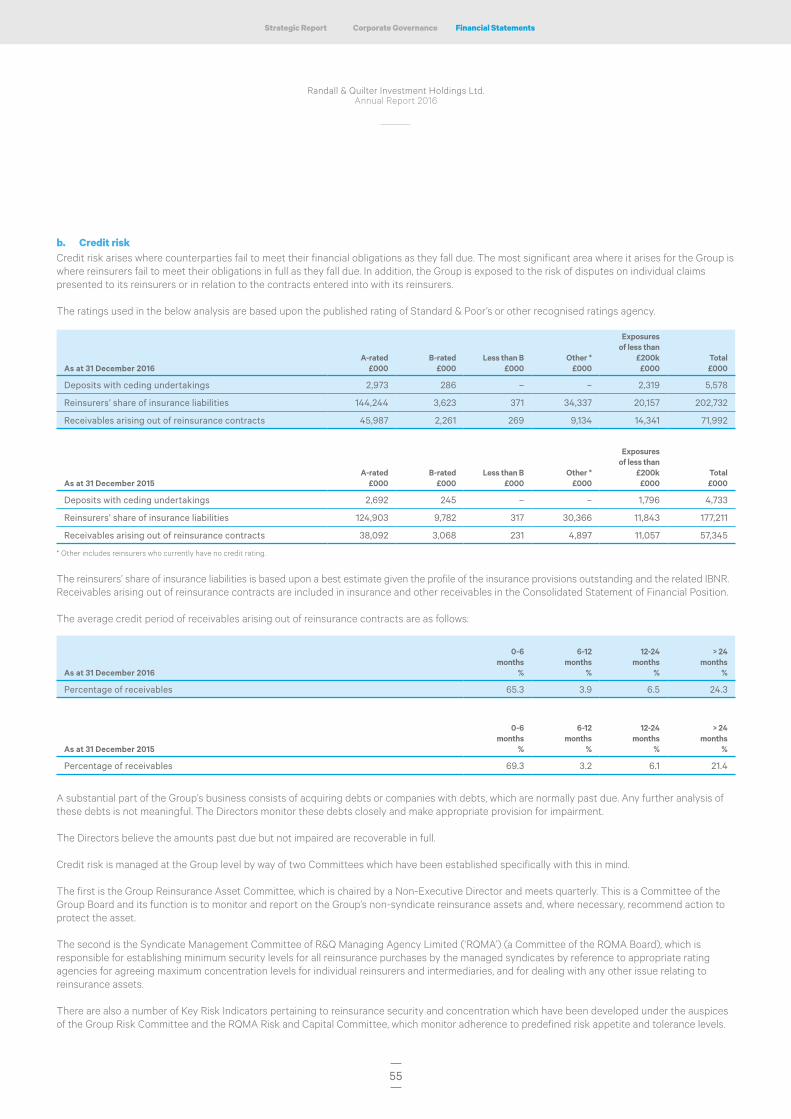
55
Financial StatementsCorporate GovernanceStrategic Report
Randall & Quilter Investment Holdings Ltd.Annual Report 2016
b. Credit riskCredit risk arises where counterparties fail to meet their financial obligations as they fall due. The most significant area where it arises for the Group is where reinsurers fail to meet their obligations in full as they fall due. In addition, the Group is exposed to the risk of disputes on individual claims presented to its reinsurers or in relation to the contracts entered into with its reinsurers.
The ratings used in the below analysis are based upon the published rating of Standard & Poor’s or other recognised ratings agency.
As at 31 December 2016A-rated
£000B-rated
£000 Less than B
£000 Other *
£000
Exposuresof less than
£200k£000
Total£000
Deposits with ceding undertakings 2,973 286 – – 2,319 5,578
Reinsurers’ share of insurance liabilities 144,244 3,623 371 34,337 20,157 202,732
Receivables arising out of reinsurance contracts 45,987 2,261 269 9,134 14,341 71,992
As at 31 December 2015A-rated
£000B-rated
£000 Less than B
£000 Other *
£000
Exposuresof less than
£200k£000
Total£000
Deposits with ceding undertakings 2,692 245 – – 1,796 4,733
Reinsurers’ share of insurance liabilities 124,903 9,782 317 30,366 11,843 177,211
Receivables arising out of reinsurance contracts 38,092 3,068 231 4,897 11,057 57,345
* Other includes reinsurers who currently have no credit rating.
The reinsurers’ share of insurance liabilities is based upon a best estimate given the profile of the insurance provisions outstanding and the related IBNR. Receivables arising out of reinsurance contracts are included in insurance and other receivables in the Consolidated Statement of Financial Position.
The average credit period of receivables arising out of reinsurance contracts are as follows:
As at 31 December 2016
0-6 months
%
6-12 months
%
12-24 months
%
> 24 months
%
Percentage of receivables 65.3 3.9 6.5 24.3
As at 31 December 2015
0-6 months
%
6-12 months
%
12-24 months
%
> 24 months
%
Percentage of receivables 69.3 3.2 6.1 21.4
A substantial part of the Group’s business consists of acquiring debts or companies with debts, which are normally past due. Any further analysis of these debts is not meaningful. The Directors monitor these debts closely and make appropriate provision for impairment.
The Directors believe the amounts past due but not impaired are recoverable in full.
Credit risk is managed at the Group level by way of two Committees which have been established specifically with this in mind.
The first is the Group Reinsurance Asset Committee, which is chaired by a Non-Executive Director and meets quarterly. This is a Committee of the Group Board and its function is to monitor and report on the Group’s non-syndicate reinsurance assets and, where necessary, recommend action to protect the asset.
The second is the Syndicate Management Committee of R&Q Managing Agency Limited (‘RQMA’) (a Committee of the RQMA Board), which is responsible for establishing minimum security levels for all reinsurance purchases by the managed syndicates by reference to appropriate rating agencies for agreeing maximum concentration levels for individual reinsurers and intermediaries, and for dealing with any other issue relating to reinsurance assets.
There are also a number of Key Risk Indicators pertaining to reinsurance security and concentration which have been developed under the auspices of the Group Risk Committee and the RQMA Risk and Capital Committee, which monitor adherence to predefined risk appetite and tolerance levels.
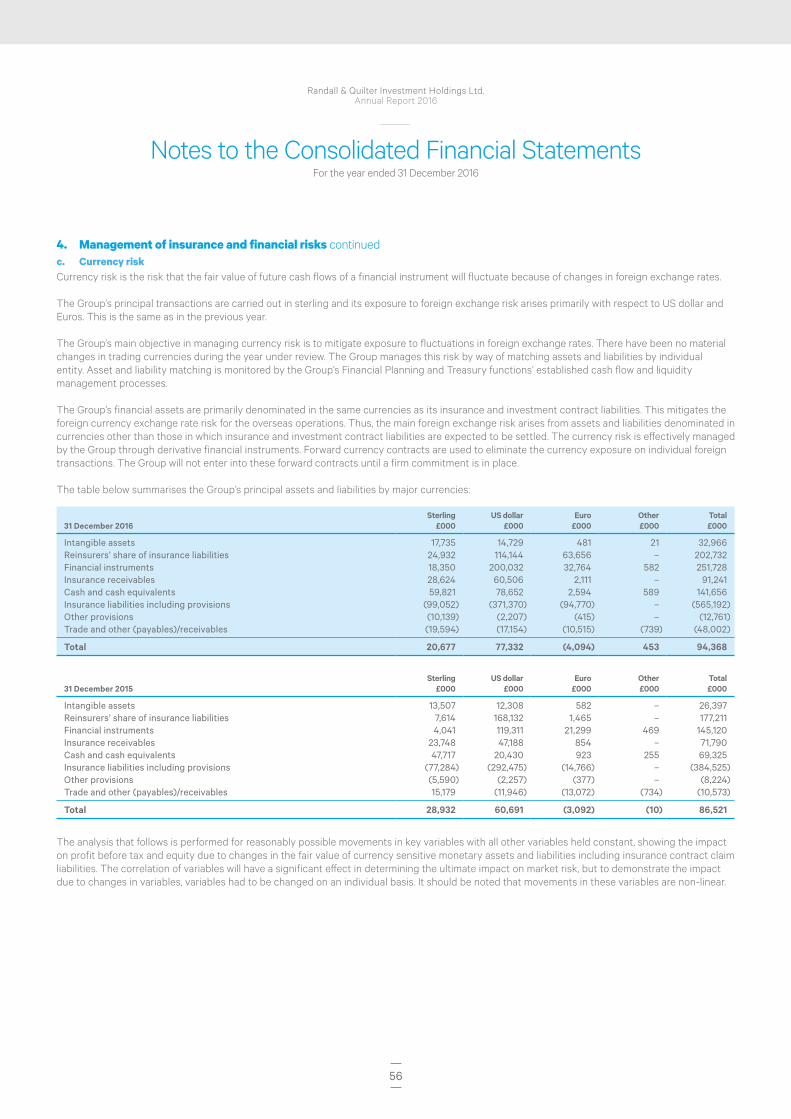
56
Randall & Quilter Investment Holdings Ltd.Annual Report 2016
Notes to the Consolidated Financial StatementsFor the year ended 31 December 2016
4. Management of insurance and financial risks continuedc. Currency riskCurrency risk is the risk that the fair value of future cash flows of a financial instrument will fluctuate because of changes in foreign exchange rates.
The Group’s principal transactions are carried out in sterling and its exposure to foreign exchange risk arises primarily with respect to US dollar and Euros. This is the same as in the previous year.
The Group’s main objective in managing currency risk is to mitigate exposure to fluctuations in foreign exchange rates. There have been no material changes in trading currencies during the year under review. The Group manages this risk by way of matching assets and liabilities by individual entity. Asset and liability matching is monitored by the Group’s Financial Planning and Treasury functions’ established cash flow and liquidity management processes.
The Group’s financial assets are primarily denominated in the same currencies as its insurance and investment contract liabilities. This mitigates the foreign currency exchange rate risk for the overseas operations. Thus, the main foreign exchange risk arises from assets and liabilities denominated in currencies other than those in which insurance and investment contract liabilities are expected to be settled. The currency risk is effectively managed by the Group through derivative financial instruments. Forward currency contracts are used to eliminate the currency exposure on individual foreign transactions. The Group will not enter into these forward contracts until a firm commitment is in place.
The table below summarises the Group’s principal assets and liabilities by major currencies:
31 December 2016Sterling
£000 US dollar
£000 Euro
£000 Other£000
Total£000
Intangible assets 17,735 14,729 481 21 32,966 Reinsurers’ share of insurance liabilities 24,932 114,144 63,656 – 202,732 Financial instruments 18,350 200,032 32,764 582 251,728 Insurance receivables 28,624 60,506 2,111 – 91,241 Cash and cash equivalents 59,821 78,652 2,594 589 141,656 Insurance liabilities including provisions (99,052) (371,370) (94,770) – (565,192)Other provisions (10,139) (2,207) (415) – (12,761)Trade and other (payables)/receivables (19,594) (17,154) (10,515) (739) (48,002)
Total 20,677 77,332 (4,094) 453 94,368
31 December 2015Sterling
£000 US dollar
£000 Euro
£000 Other£000
Total£000
Intangible assets 13,507 12,308 582 – 26,397 Reinsurers’ share of insurance liabilities 7,614 168,132 1,465 – 177,211 Financial instruments 4,041 119,311 21,299 469 145,120 Insurance receivables 23,748 47,188 854 – 71,790 Cash and cash equivalents 47,717 20,430 923 255 69,325 Insurance liabilities including provisions (77,284) (292,475) (14,766) – (384,525)Other provisions (5,590) (2,257) (377) – (8,224)Trade and other (payables)/receivables 15,179 (11,946) (13,072) (734) (10,573)
Total 28,932 60,691 (3,092) (10) 86,521
The analysis that follows is performed for reasonably possible movements in key variables with all other variables held constant, showing the impact on profit before tax and equity due to changes in the fair value of currency sensitive monetary assets and liabilities including insurance contract claim liabilities. The correlation of variables will have a significant effect in determining the ultimate impact on market risk, but to demonstrate the impact due to changes in variables, variables had to be changed on an individual basis. It should be noted that movements in these variables are non-linear.
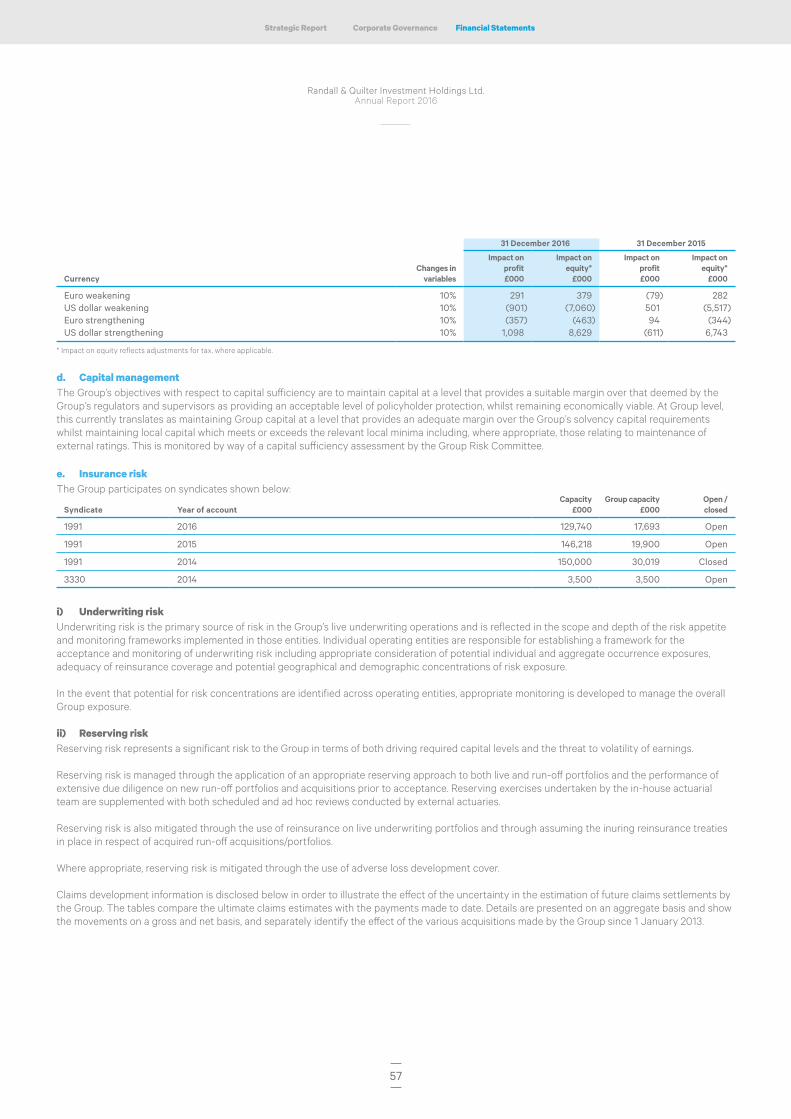
57
Financial StatementsCorporate GovernanceStrategic Report
Randall & Quilter Investment Holdings Ltd.Annual Report 2016
31 December 2016 31 December 2015
Currency Changes in
variables
Impact on profit£000
Impact on equity*
£000
Impact on profit£000
Impact on equity*
£000
Euro weakening 10% 291 379 (79) 282 US dollar weakening 10% (901) (7,060) 501 (5,517)Euro strengthening 10% (357) (463) 94 (344)US dollar strengthening 10% 1,098 8,629 (611) 6,743
* Impact on equity reflects adjustments for tax, where applicable.
d. Capital managementThe Group’s objectives with respect to capital sufficiency are to maintain capital at a level that provides a suitable margin over that deemed by the Group’s regulators and supervisors as providing an acceptable level of policyholder protection, whilst remaining economically viable. At Group level, this currently translates as maintaining Group capital at a level that provides an adequate margin over the Group’s solvency capital requirements whilst maintaining local capital which meets or exceeds the relevant local minima including, where appropriate, those relating to maintenance of external ratings. This is monitored by way of a capital sufficiency assessment by the Group Risk Committee.
e. Insurance riskThe Group participates on syndicates shown below:
Syndicate Year of accountCapacity
£000 Group capacity
£000Open / closed
1991 2016 129,740 17,693 Open
1991 2015 146,218 19,900 Open
1991 2014 150,000 30,019 Closed
3330 2014 3,500 3,500 Open
i) Underwriting riskUnderwriting risk is the primary source of risk in the Group’s live underwriting operations and is reflected in the scope and depth of the risk appetite and monitoring frameworks implemented in those entities. Individual operating entities are responsible for establishing a framework for the acceptance and monitoring of underwriting risk including appropriate consideration of potential individual and aggregate occurrence exposures, adequacy of reinsurance coverage and potential geographical and demographic concentrations of risk exposure.
In the event that potential for risk concentrations are identified across operating entities, appropriate monitoring is developed to manage the overall Group exposure.
ii) Reserving riskReserving risk represents a significant risk to the Group in terms of both driving required capital levels and the threat to volatility of earnings.
Reserving risk is managed through the application of an appropriate reserving approach to both live and run-off portfolios and the performance of extensive due diligence on new run-off portfolios and acquisitions prior to acceptance. Reserving exercises undertaken by the in-house actuarial team are supplemented with both scheduled and ad hoc reviews conducted by external actuaries.
Reserving risk is also mitigated through the use of reinsurance on live underwriting portfolios and through assuming the inuring reinsurance treaties in place in respect of acquired run-off acquisitions/portfolios.
Where appropriate, reserving risk is mitigated through the use of adverse loss development cover.
Claims development information is disclosed below in order to illustrate the effect of the uncertainty in the estimation of future claims settlements by the Group. The tables compare the ultimate claims estimates with the payments made to date. Details are presented on an aggregate basis and show the movements on a gross and net basis, and separately identify the effect of the various acquisitions made by the Group since 1 January 2013.

58
Randall & Quilter Investment Holdings Ltd.Annual Report 2016
Notes to the Consolidated Financial StatementsFor the year ended 31 December 2016
4. Management of insurance and financial risks continuede. Insurance risk continuedThe analysis of claims development in the Group’s run-off insurance entities is as follows:
Gross
Group entities at 1 January
2013 £000
Entities acquired by
the Group during 2013
£000
Entities acquired by
the Group during 2014
£000
Entities acquired by
the Group during 2015
£000
Entities acquired by
the Group during 2016
£000
Gross claims at:1 January/acquisition 392,778 13,296 28,082 12,147 107,121 First year movement (89,626) (605) (4,656) 26 (2,793)Second year movement 9,994 (2,569) (8,667) 1,222 Third year movement 1,683 (2,983) 13,043 Fourth year movement 42,208 1,232
Gross provision at 31 December 2016 357,037 8,371 27,802 13,395 104,328
Gross claims at :1 January/acquisition 392,778 13,296 28,082 12,147 107,121 Exchange adjustments 73,939 622 2,560 109 (3,314)Payments (250,023) (3,512) (3,049) (999) (1,075)Gross provision at 31 December 2016 (357,037) (8,371) (27,802) (13,395) (104,328)
(Deficit)/surplus to date (140,343) 2,035 (209) (2,138) (1,596)
Gross claims provisions – live business – – 19,905 19,848 3,040
Total gross insurance contract provisions (Note 21) 357,037 8,371 47,707 33,243 107,368
Net
Group entities at 1 January
2013 £000
Entities acquired by
the Group during 2013
£000
Entities acquired by
the Group during 2014
£000
Entities acquired by
the Group during 2015
£000
Entities acquired by
the Group during 2016
£000
Net claims at:1 January/acquisition 223,349 11,571 24,150 11,283 42,540 First year movement (75,827) (438) (3,940) 9 (1,171)Second year movement 459 (2,108) (7,177) 1,037 Third year movement (4,490) (2,710) 13,174 Fourth year movement 80,949 953
Net provision at 31 December 2016 224,440 7,268 26,207 12,329 41,369
Net claims at :1 January/acquisition 223,349 11,571 24,150 11,283 42,540 Exchange adjustments 45,503 7 2,363 100 629 Payments (10,962) (1,896) (1,224) (999) (846)Net position at 31 December 2016 (224,440) (7,268) (26,386) (12,329) (41,369)
Surplus/(deficit) to date 33,450 2,414 (1,097) (1,945) 954
Net claims provisions – live business – – 17,455 18,985 2,941
Total net insurance contract provisions (Note 21) 224,440 7,268 43,662 31,314 44,310
The above figures include the Group’s participation on Lloyd’s Syndicates treated as being in run-off.
Foreign exchange movements shown above are offset by favourable foreign exchange movements in cash and investments held to meet insurance liabilities.
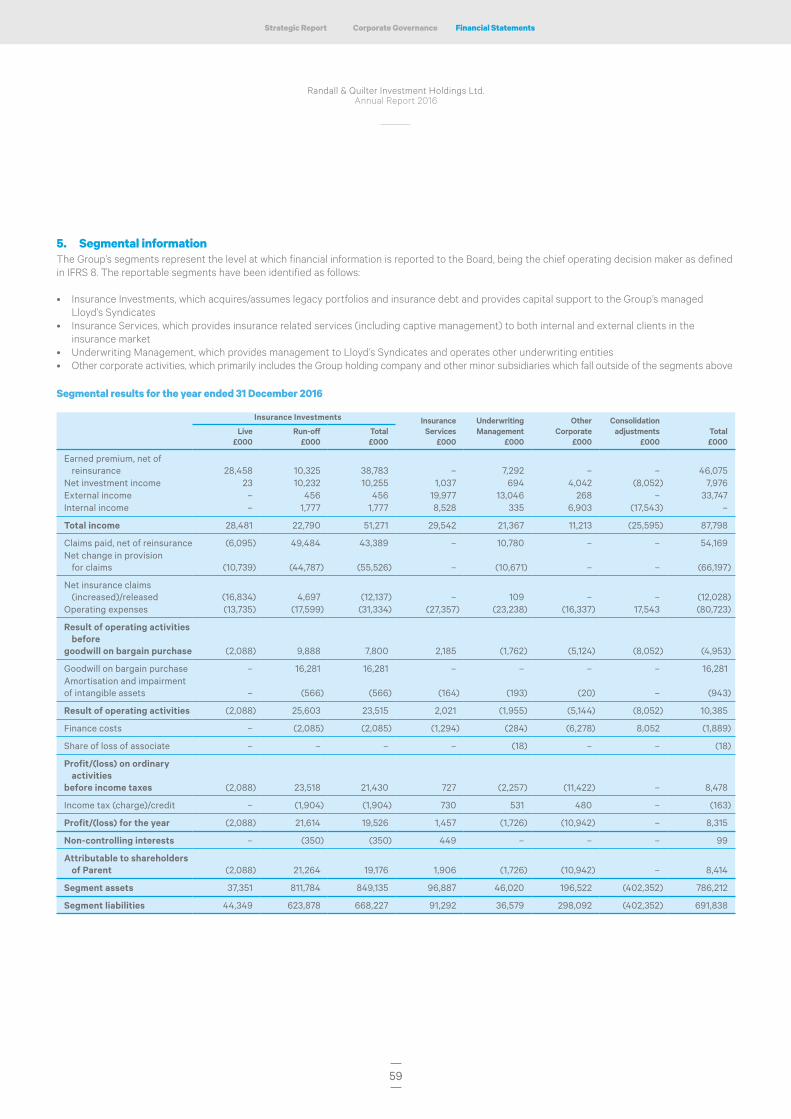
59
Financial StatementsCorporate GovernanceStrategic Report
Randall & Quilter Investment Holdings Ltd.Annual Report 2016
5. Segmental information The Group’s segments represent the level at which financial information is reported to the Board, being the chief operating decision maker as defined in IFRS 8. The reportable segments have been identified as follows:
• Insurance Investments, which acquires/assumes legacy portfolios and insurance debt and provides capital support to the Group’s managed Lloyd’s Syndicates
• Insurance Services, which provides insurance related services (including captive management) to both internal and external clients in the insurance market
• Underwriting Management, which provides management to Lloyd’s Syndicates and operates other underwriting entities • Other corporate activities, which primarily includes the Group holding company and other minor subsidiaries which fall outside of the segments above Segmental results for the year ended 31 December 2016
Insurance Investments InsuranceServices
£000
UnderwritingManagement
£000
Other Corporate
£000
Consolidation adjustments
£000Total£000
Live£000
Run-off£000
Total£000
Earned premium, net of reinsurance 28,458 10,325 38,783 – 7,292 – – 46,075
Net investment income 23 10,232 10,255 1,037 694 4,042 (8,052) 7,976 External income – 456 456 19,977 13,046 268 – 33,747 Internal income – 1,777 1,777 8,528 335 6,903 (17,543) –
Total income 28,481 22,790 51,271 29,542 21,367 11,213 (25,595) 87,798
Claims paid, net of reinsurance (6,095) 49,484 43,389 – 10,780 – – 54,169 Net change in provision
for claims (10,739) (44,787) (55,526) – (10,671) – – (66,197)
Net insurance claims (increased)/released (16,834) 4,697 (12,137) – 109 – – (12,028)
Operating expenses (13,735) (17,599) (31,334) (27,357) (23,238) (16,337) 17,543 (80,723)
Result of operating activities before
goodwill on bargain purchase (2,088) 9,888 7,800 2,185 (1,762) (5,124) (8,052) (4,953)
Goodwill on bargain purchase – 16,281 16,281 – – – – 16,281 Amortisation and impairment of intangible assets – (566) (566) (164) (193) (20) – (943)
Result of operating activities (2,088) 25,603 23,515 2,021 (1,955) (5,144) (8,052) 10,385
Finance costs – (2,085) (2,085) (1,294) (284) (6,278) 8,052 (1,889)
Share of loss of associate – – – – (18) – – (18)
Profit/(loss) on ordinary activities
before income taxes (2,088) 23,518 21,430 727 (2,257) (11,422) – 8,478
Income tax (charge)/credit – (1,904) (1,904) 730 531 480 – (163)
Profit/(loss) for the year (2,088) 21,614 19,526 1,457 (1,726) (10,942) – 8,315
Non-controlling interests – (350) (350) 449 – – – 99
Attributable to shareholders of Parent (2,088) 21,264 19,176 1,906 (1,726) (10,942) – 8,414
Segment assets 37,351 811,784 849,135 96,887 46,020 196,522 (402,352) 786,212
Segment liabilities 44,349 623,878 668,227 91,292 36,579 298,092 (402,352) 691,838
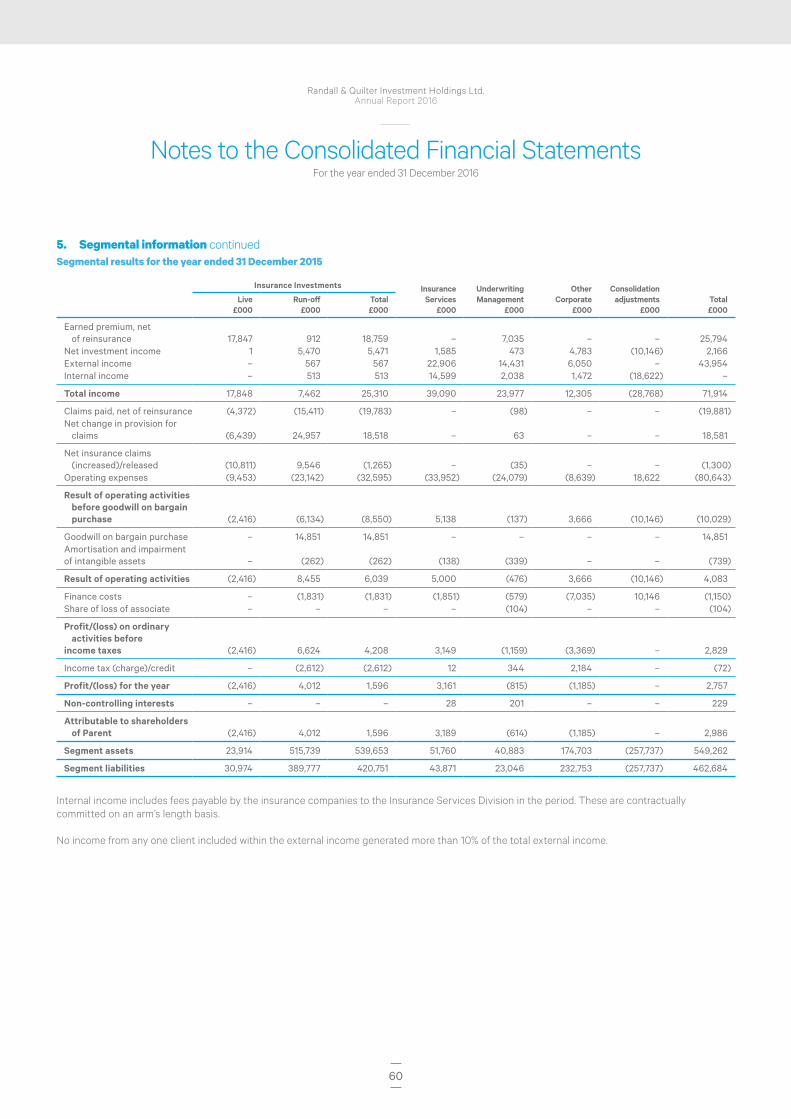
60
Randall & Quilter Investment Holdings Ltd.Annual Report 2016
Notes to the Consolidated Financial StatementsFor the year ended 31 December 2016
5. Segmental information continuedSegmental results for the year ended 31 December 2015
Insurance Investments InsuranceServices
£000
UnderwritingManagement
£000
Other Corporate
£000
Consolidation adjustments
£000Total£000
Live£000
Run-off£000
Total£000
Earned premium, net of reinsurance 17,847 912 18,759 – 7,035 – – 25,794
Net investment income 1 5,470 5,471 1,585 473 4,783 (10,146) 2,166 External income – 567 567 22,906 14,431 6,050 – 43,954 Internal income – 513 513 14,599 2,038 1,472 (18,622) –
Total income 17,848 7,462 25,310 39,090 23,977 12,305 (28,768) 71,914
Claims paid, net of reinsurance (4,372) (15,411) (19,783) – (98) – – (19,881)Net change in provision for
claims (6,439) 24,957 18,518 – 63 – – 18,581
Net insurance claims (increased)/released (10,811) 9,546 (1,265) – (35) – – (1,300)
Operating expenses (9,453) (23,142) (32,595) (33,952) (24,079) (8,639) 18,622 (80,643)
Result of operating activities before goodwill on bargain purchase (2,416) (6,134) (8,550) 5,138 (137) 3,666 (10,146) (10,029)
Goodwill on bargain purchase – 14,851 14,851 – – – – 14,851 Amortisation and impairment of intangible assets – (262) (262) (138) (339) – – (739)
Result of operating activities (2,416) 8,455 6,039 5,000 (476) 3,666 (10,146) 4,083
Finance costs – (1,831) (1,831) (1,851) (579) (7,035) 10,146 (1,150)Share of loss of associate – – – – (104) – – (104)
Profit/(loss) on ordinary activities before
income taxes (2,416) 6,624 4,208 3,149 (1,159) (3,369) – 2,829
Income tax (charge)/credit – (2,612) (2,612) 12 344 2,184 – (72)
Profit/(loss) for the year (2,416) 4,012 1,596 3,161 (815) (1,185) – 2,757
Non-controlling interests – – – 28 201 – – 229
Attributable to shareholders of Parent (2,416) 4,012 1,596 3,189 (614) (1,185) – 2,986
Segment assets 23,914 515,739 539,653 51,760 40,883 174,703 (257,737) 549,262
Segment liabilities 30,974 389,777 420,751 43,871 23,046 232,753 (257,737) 462,684
Internal income includes fees payable by the insurance companies to the Insurance Services Division in the period. These are contractually committed on an arm’s length basis.
No income from any one client included within the external income generated more than 10% of the total external income.

61
Financial StatementsCorporate GovernanceStrategic Report
Randall & Quilter Investment Holdings Ltd.Annual Report 2016
Geographical analysisAs at 31 December 2016
UK £000
North America
£000 Europe
£000 Total £000
Gross assets 312,688 640,129 235,747 1,188,564 Intercompany eliminations (206,717) (134,274) (61,361) (402,352)
Segment assets 105,971 505,855 174,386 786,212
Gross liabilities 293,504 620,388 180,298 1,094,190
Intercompany eliminations (200,497) (191,832) (10,023) (402,352)
Segment liabilities 93,007 428,556 170,275 691,838
Revenue from external customers 51,943 19,451 16,404 87,798
As at 31 December 2015
UK £000
North America
£000 Europe
£000 Total £000
Gross assets 202,865 466,941 137,193 806,999 Intercompany eliminations (110,281) (97,063) (50,393) (257,737)
Segment assets 92,584 369,878 86,800 549,262
Gross liabilities 180,650 461,663 78,108 720,421 Intercompany eliminations (117,521) (137,613) (2,603) (257,737)
Segment liabilities 63,129 324,050 75,505 462,684
Revenue from external customers 21,278 26,785 23,851 71,914
6. Gross investment income2016
£0002015
£000
Investment income 4,127 4,044 Realised net gains on financial assets 3,191 136 Unrealised gains/(losses) on financial assets 658 (2,014)
7,976 2,166
7. Other income2016
£0002015
£000
Management fees 31,442 33,418 Profit commission on managed Lloyd’s Syndicates – 237 Insurance commissions 1,371 3,127 Profit on divestment (note 28) 625 6,024 Interest expense on pension scheme deficit (213) (282)Purchased reinsurance receivables 522 1,430
33,747 43,954
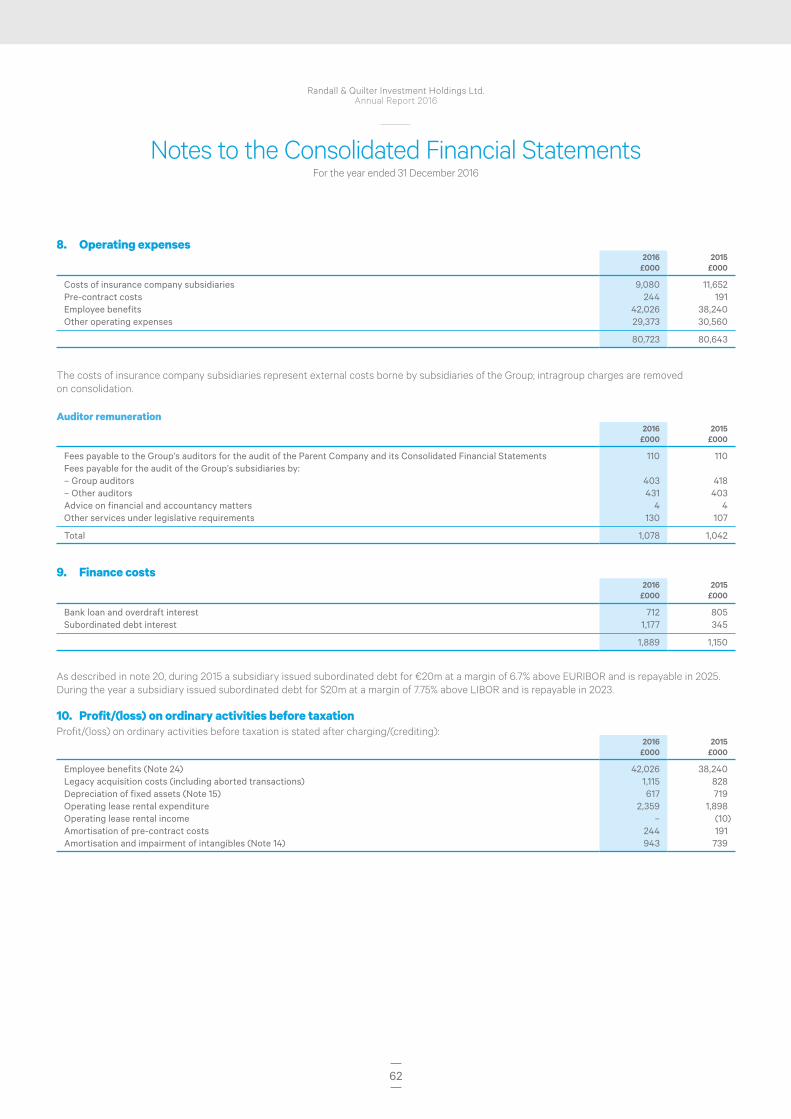
62
Randall & Quilter Investment Holdings Ltd.Annual Report 2016
Notes to the Consolidated Financial StatementsFor the year ended 31 December 2016
8. Operating expenses2016
£0002015
£000
Costs of insurance company subsidiaries 9,080 11,652 Pre-contract costs 244 191 Employee benefits 42,026 38,240 Other operating expenses 29,373 30,560
80,723 80,643
The costs of insurance company subsidiaries represent external costs borne by subsidiaries of the Group; intragroup charges are removed on consolidation.
Auditor remuneration2016
£0002015
£000
Fees payable to the Group’s auditors for the audit of the Parent Company and its Consolidated Financial Statements 110 110Fees payable for the audit of the Group’s subsidiaries by:– Group auditors 403 418– Other auditors 431 403Advice on financial and accountancy matters 4 4Other services under legislative requirements 130 107
Total 1,078 1,042
9. Finance costs2016
£0002015
£000
Bank loan and overdraft interest 712 805 Subordinated debt interest 1,177 345
1,889 1,150
As described in note 20, during 2015 a subsidiary issued subordinated debt for €20m at a margin of 6.7% above EURIBOR and is repayable in 2025. During the year a subsidiary issued subordinated debt for $20m at a margin of 7.75% above LIBOR and is repayable in 2023.
10. Profit/(loss) on ordinary activities before taxationProfit/(loss) on ordinary activities before taxation is stated after charging/(crediting):
2016 £000
2015 £000
Employee benefits (Note 24) 42,026 38,240 Legacy acquisition costs (including aborted transactions) 1,115 828 Depreciation of fixed assets (Note 15) 617 719 Operating lease rental expenditure 2,359 1,898 Operating lease rental income – (10)Amortisation of pre-contract costs 244 191 Amortisation and impairment of intangibles (Note 14) 943 739

63
Financial StatementsCorporate GovernanceStrategic Report
Randall & Quilter Investment Holdings Ltd.Annual Report 2016
11. Income tax chargea. Analysis of charge in the year
2016 £000
2015 £000
Current taxCurrent year 27 (176)Adjustments in respect of previous years (849) (966)Foreign tax 714 1,883
(108) 741 Deferred tax 271 (669)
Income tax charge 163 72
b. Factors affecting tax charge for the yearThe tax assessed differs from the standard rate of corporation tax in the United Kingdom. The differences are explained below:
2016 £000
2015 £000
Profit on ordinary activities before taxation 8,478 2,829
Profit on ordinary activities at the standard rate of corporation tax in the UK of 20% (2015: 20.25%) 1,696 573 Temporary differences (5,247) (495)Capital allowances in excess of depreciation 111 (21)Utilisation of tax losses (82) (17)Tax losses carried back – 67 Timing differences in respect of pension schemes 63 173 Unrelieved losses 1,964 33 Foreign tax rate differences 2,507 725 Adjustments to the tax charge in respect of prior years (849) (966)
Income tax charge for the year 163 72
c. Factors that may affect future tax chargesIn addition to the recognised deferred tax asset, the Group has other trading losses of approximately £47,153k (2015: £43,824k) in various Group companies available to be carried forward against future trading profits of those companies. The recovery of these losses is uncertain and no deferred tax asset has been provided in respect of these losses. Should it become possible to offset these losses against taxable profits in future years the Group tax charge in those years will be reduced accordingly.
The Group has available capital losses of £27,461k (2015: £29,776k).
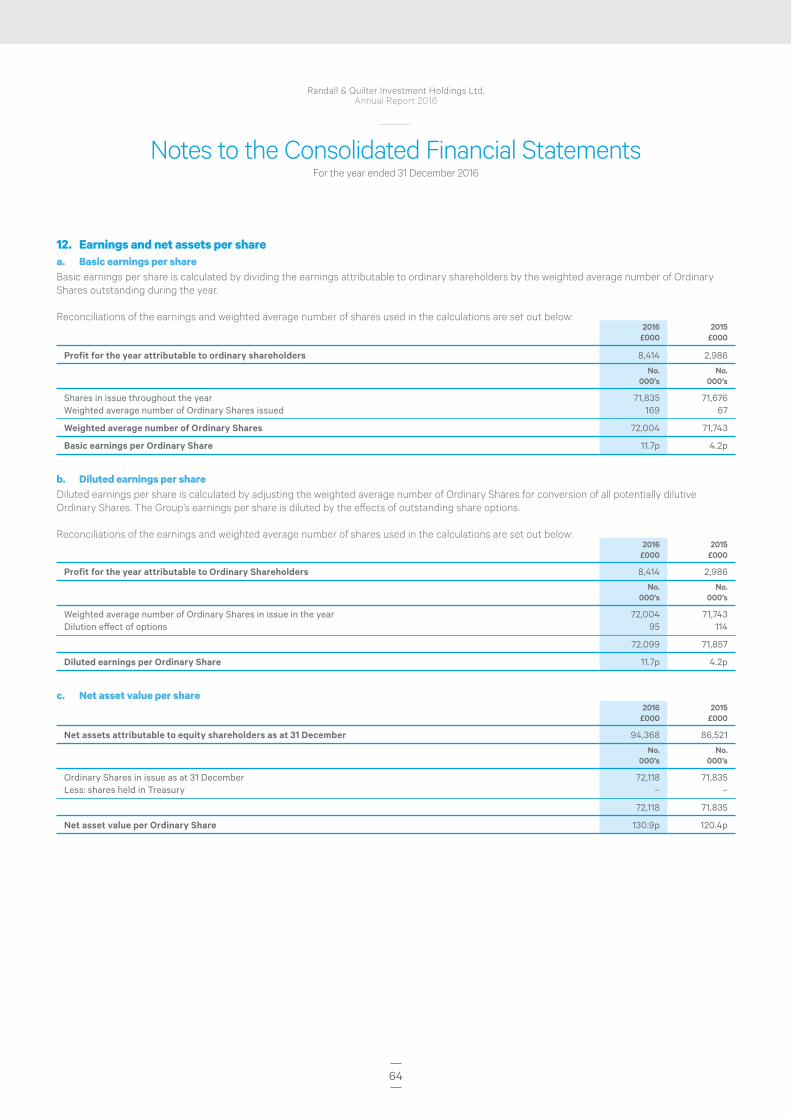
64
Randall & Quilter Investment Holdings Ltd.Annual Report 2016
Notes to the Consolidated Financial StatementsFor the year ended 31 December 2016
12. Earnings and net assets per sharea. Basic earnings per shareBasic earnings per share is calculated by dividing the earnings attributable to ordinary shareholders by the weighted average number of Ordinary Shares outstanding during the year.
Reconciliations of the earnings and weighted average number of shares used in the calculations are set out below:2016
£0002015
£000
Profit for the year attributable to ordinary shareholders 8,414 2,986
No. 000’s
No. 000’s
Shares in issue throughout the year 71,835 71,676 Weighted average number of Ordinary Shares issued 169 67
Weighted average number of Ordinary Shares 72,004 71,743
Basic earnings per Ordinary Share 11.7p 4.2p
b. Diluted earnings per shareDiluted earnings per share is calculated by adjusting the weighted average number of Ordinary Shares for conversion of all potentially dilutive Ordinary Shares. The Group’s earnings per share is diluted by the effects of outstanding share options.
Reconciliations of the earnings and weighted average number of shares used in the calculations are set out below:2016
£0002015
£000
Profit for the year attributable to Ordinary Shareholders 8,414 2,986
No. 000’s
No. 000’s
Weighted average number of Ordinary Shares in issue in the year 72,004 71,743 Dilution effect of options 95 114
72,099 71,857
Diluted earnings per Ordinary Share 11.7p 4.2p
c. Net asset value per share2016
£0002015
£000
Net assets attributable to equity shareholders as at 31 December 94,368 86,521
No. 000’s
No. 000’s
Ordinary Shares in issue as at 31 December 72,118 71,835 Less: shares held in Treasury – –
72,118 71,835
Net asset value per Ordinary Share 130.9p 120.4p
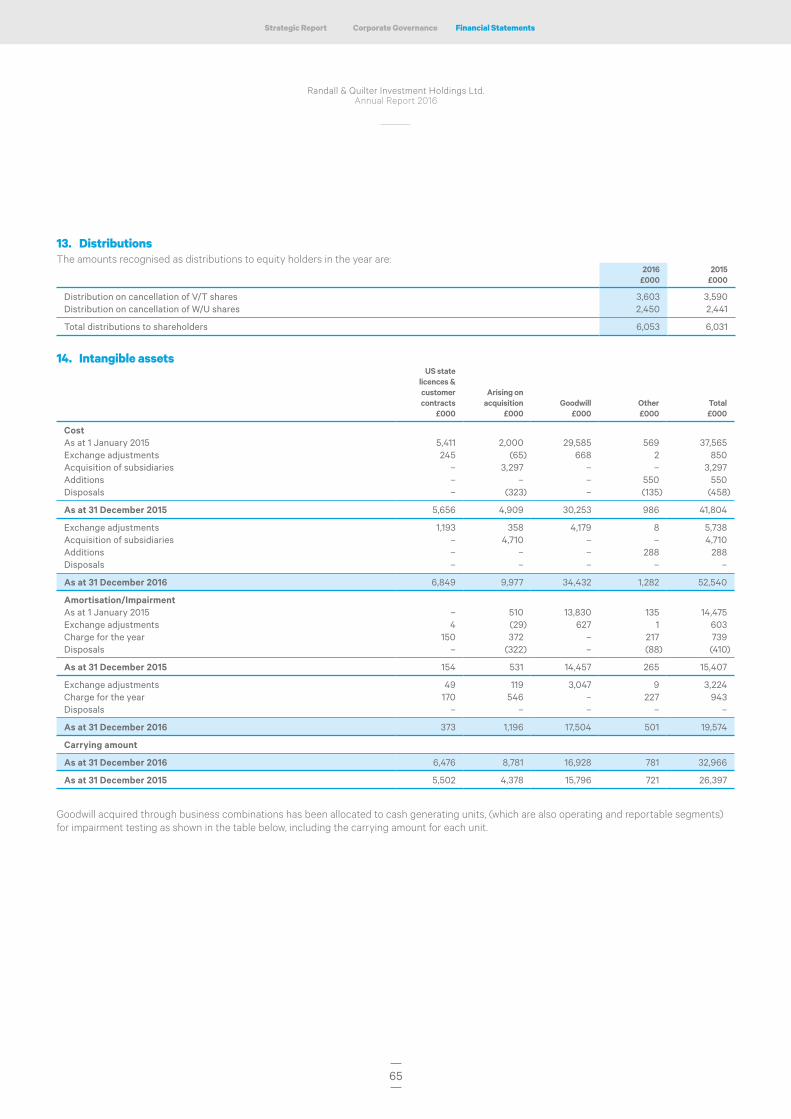
65
Financial StatementsCorporate GovernanceStrategic Report
Randall & Quilter Investment Holdings Ltd.Annual Report 2016
13. DistributionsThe amounts recognised as distributions to equity holders in the year are:
2016 £000
2015 £000
Distribution on cancellation of V/T shares 3,603 3,590Distribution on cancellation of W/U shares 2,450 2,441
Total distributions to shareholders 6,053 6,031
14. Intangible assetsUS state
licences & customer contracts
£000
Arising on acquisition
£000 Goodwill
£000 Other £000
Total£000
CostAs at 1 January 2015 5,411 2,000 29,585 569 37,565 Exchange adjustments 245 (65) 668 2 850 Acquisition of subsidiaries – 3,297 – – 3,297 Additions – – – 550 550 Disposals – (323) – (135) (458)
As at 31 December 2015 5,656 4,909 30,253 986 41,804
Exchange adjustments 1,193 358 4,179 8 5,738 Acquisition of subsidiaries – 4,710 – – 4,710 Additions – – – 288 288 Disposals – – – – –
As at 31 December 2016 6,849 9,977 34,432 1,282 52,540
Amortisation/ImpairmentAs at 1 January 2015 – 510 13,830 135 14,475 Exchange adjustments 4 (29) 627 1 603 Charge for the year 150 372 – 217 739 Disposals – (322) – (88) (410)
As at 31 December 2015 154 531 14,457 265 15,407
Exchange adjustments 49 119 3,047 9 3,224 Charge for the year 170 546 – 227 943 Disposals – – – – –
As at 31 December 2016 373 1,196 17,504 501 19,574
Carrying amount
As at 31 December 2016 6,476 8,781 16,928 781 32,966
As at 31 December 2015 5,502 4,378 15,796 721 26,397
Goodwill acquired through business combinations has been allocated to cash generating units, (which are also operating and reportable segments) for impairment testing as shown in the table below, including the carrying amount for each unit.
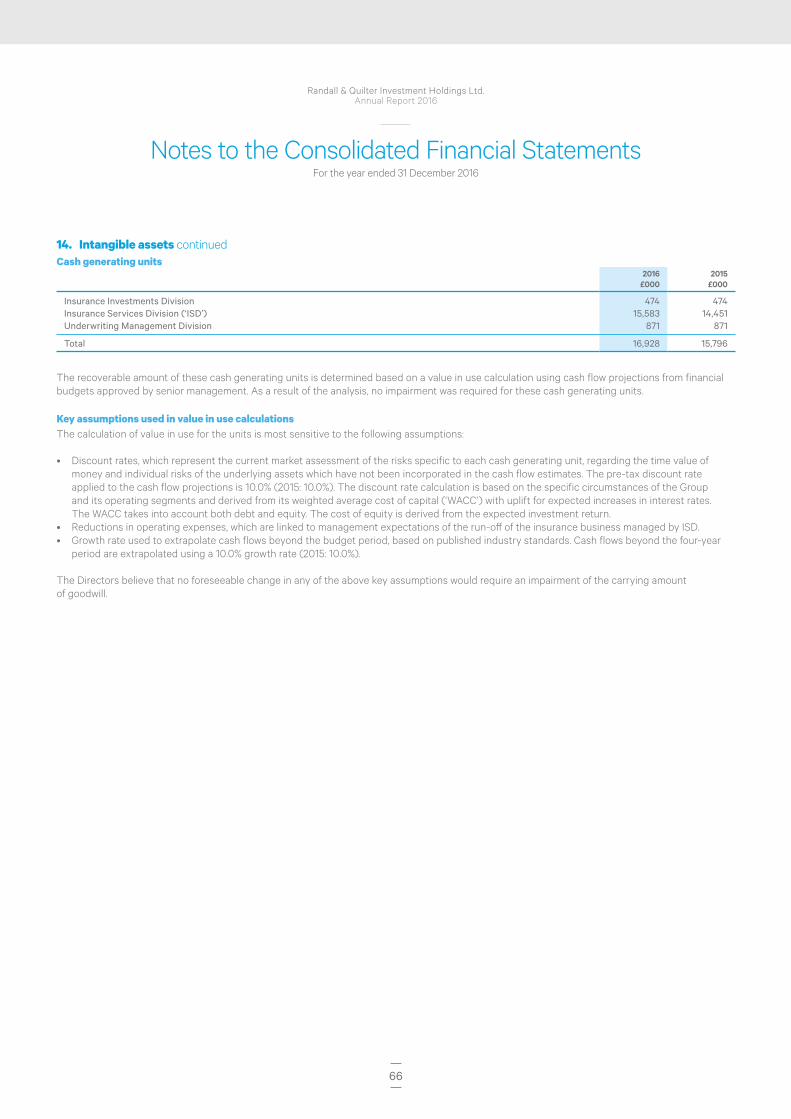
66
Randall & Quilter Investment Holdings Ltd.Annual Report 2016
Notes to the Consolidated Financial StatementsFor the year ended 31 December 2016
14. Intangible assets continuedCash generating units
2016 £000
2015 £000
Insurance Investments Division 474 474 Insurance Services Division (‘ISD’) 15,583 14,451 Underwriting Management Division 871 871
Total 16,928 15,796
The recoverable amount of these cash generating units is determined based on a value in use calculation using cash flow projections from financial budgets approved by senior management. As a result of the analysis, no impairment was required for these cash generating units.
Key assumptions used in value in use calculationsThe calculation of value in use for the units is most sensitive to the following assumptions:
• Discount rates, which represent the current market assessment of the risks specific to each cash generating unit, regarding the time value of money and individual risks of the underlying assets which have not been incorporated in the cash flow estimates. The pre-tax discount rate applied to the cash flow projections is 10.0% (2015: 10.0%). The discount rate calculation is based on the specific circumstances of the Group and its operating segments and derived from its weighted average cost of capital (‘WACC’) with uplift for expected increases in interest rates. The WACC takes into account both debt and equity. The cost of equity is derived from the expected investment return.
• Reductions in operating expenses, which are linked to management expectations of the run-off of the insurance business managed by ISD.• Growth rate used to extrapolate cash flows beyond the budget period, based on published industry standards. Cash flows beyond the four-year
period are extrapolated using a 10.0% growth rate (2015: 10.0%).
The Directors believe that no foreseeable change in any of the above key assumptions would require an impairment of the carrying amount of goodwill.

67
Financial StatementsCorporate GovernanceStrategic Report
Randall & Quilter Investment Holdings Ltd.Annual Report 2016
15. Property, plant and equipmentComputer
equipment £000
Motor vehicles
£000
Office equipment
£000
Leasehold improvements
£000
Freeholdproperty
£000 Total£000
CostAs at 1 January 2015 1,981 35 2,145 358 – 4,519 Exchange adjustments 61 1 (16) 58 – 104 Acquisition of subsidiaries – – – – – – Additions 121 – 78 2 – 201 Disposals (330) – (332) – – (662)
As at 31 December 2015 1,833 36 1,875 418 – 4,162
Exchange adjustments 253 5 84 236 – 578Acquisition of subsidiaries – – – – – – Additions 111 – 488 – 2,486 3,085 Disposals (482) – (770) (1) – (1,253)
As at 31 December 2016 1,715 41 1,677 653 2,486 6,572
DepreciationAs at 1 January 2015 1,259 23 1,572 137 – 2,991 Exchange adjustments 39 – 17 39 – 95 Charge for the year 324 8 321 66 – 719 Disposals (251) – (332) – – (583)
As at 31 December 2015 1,371 31 1,578 242 – 3,222
Exchange adjustments 240 5 82 203 – 530 Charge for the year 258 5 289 65 – 617 Disposals (433) – (759) (1) – (1,193)
As at 31 December 2016 1,436 41 1,190 509 – 3,176
Carrying amount
As at 31 December 2016 279 – 487 144 2,486 3,396
As at 31 December 2015 462 5 297 176 – 940
As at 31 December 2014 722 12 573 221 – 1,528
As at 31 December 2016, the Group had no significant capital commitments (2015: none). The depreciation charge for the year is included in operating expenses.
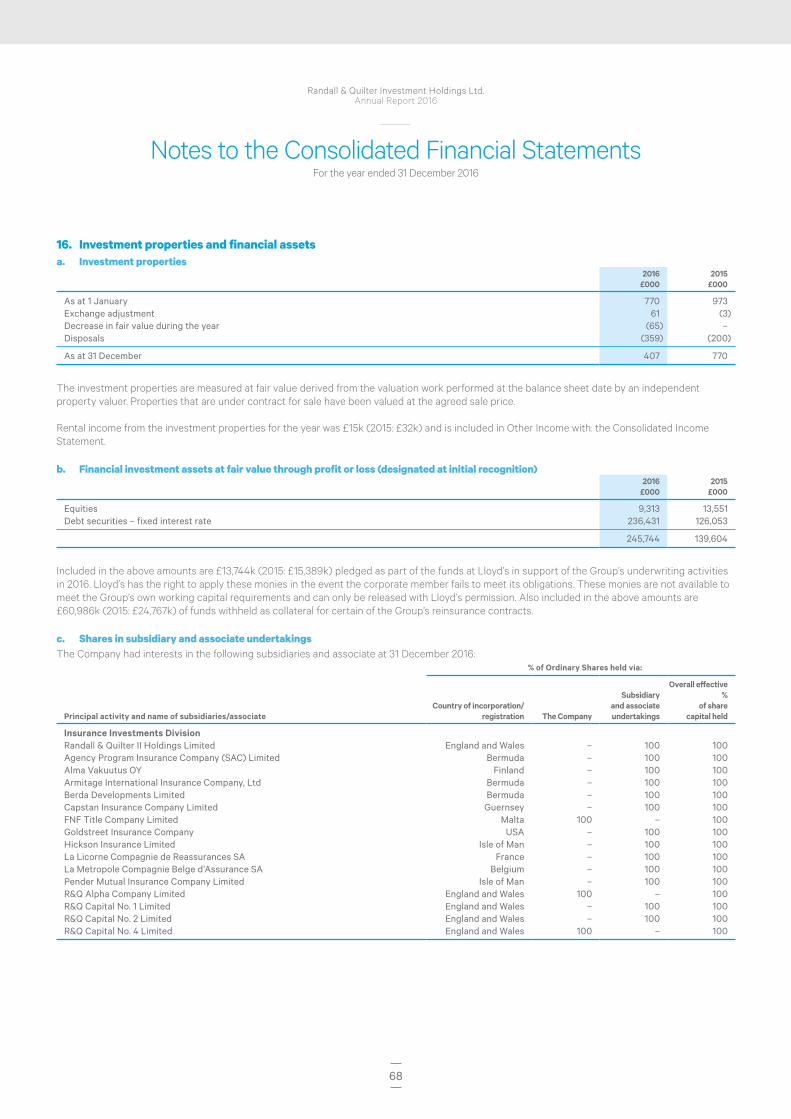
68
Randall & Quilter Investment Holdings Ltd.Annual Report 2016
Notes to the Consolidated Financial StatementsFor the year ended 31 December 2016
16. Investment properties and financial assets a. Investment properties
2016 £000
2015 £000
As at 1 January 770 973 Exchange adjustment 61 (3)Decrease in fair value during the year (65) – Disposals (359) (200)
As at 31 December 407 770
The investment properties are measured at fair value derived from the valuation work performed at the balance sheet date by an independent property valuer. Properties that are under contract for sale have been valued at the agreed sale price.
Rental income from the investment properties for the year was £15k (2015: £32k) and is included in Other Income with: the Consolidated Income Statement.
b. Financial investment assets at fair value through profit or loss (designated at initial recognition) 2016
£0002015
£000
Equities 9,313 13,551 Debt securities – fixed interest rate 236,431 126,053
245,744 139,604
Included in the above amounts are £13,744k (2015: £15,389k) pledged as part of the funds at Lloyd’s in support of the Group’s underwriting activities in 2016. Lloyd’s has the right to apply these monies in the event the corporate member fails to meet its obligations. These monies are not available to meet the Group’s own working capital requirements and can only be released with Lloyd’s permission. Also included in the above amounts are £60,986k (2015: £24,767k) of funds withheld as collateral for certain of the Group’s reinsurance contracts.
c. Shares in subsidiary and associate undertakings The Company had interests in the following subsidiaries and associate at 31 December 2016:
% of Ordinary Shares held via:
Principal activity and name of subsidiaries/associateCountry of incorporation/
registration The Company
Subsidiary and associate undertakings
Overall effective %
of share capital held
Insurance Investments DivisionRandall & Quilter II Holdings Limited England and Wales – 100 100Agency Program Insurance Company (SAC) Limited Bermuda – 100 100Alma Vakuutus OY Finland – 100 100Armitage International Insurance Company, Ltd Bermuda – 100 100Berda Developments Limited Bermuda – 100 100Capstan Insurance Company Limited Guernsey – 100 100FNF Title Company Limited Malta 100 – 100Goldstreet Insurance Company USA – 100 100Hickson Insurance Limited Isle of Man – 100 100La Licorne Compagnie de Reassurances SA France – 100 100La Metropole Compagnie Belge d’Assurance SA Belgium – 100 100Pender Mutual Insurance Company Limited Isle of Man – 100 100R&Q Alpha Company Limited England and Wales 100 – 100R&Q Capital No. 1 Limited England and Wales – 100 100R&Q Capital No. 2 Limited England and Wales – 100 100R&Q Capital No. 4 Limited England and Wales 100 – 100
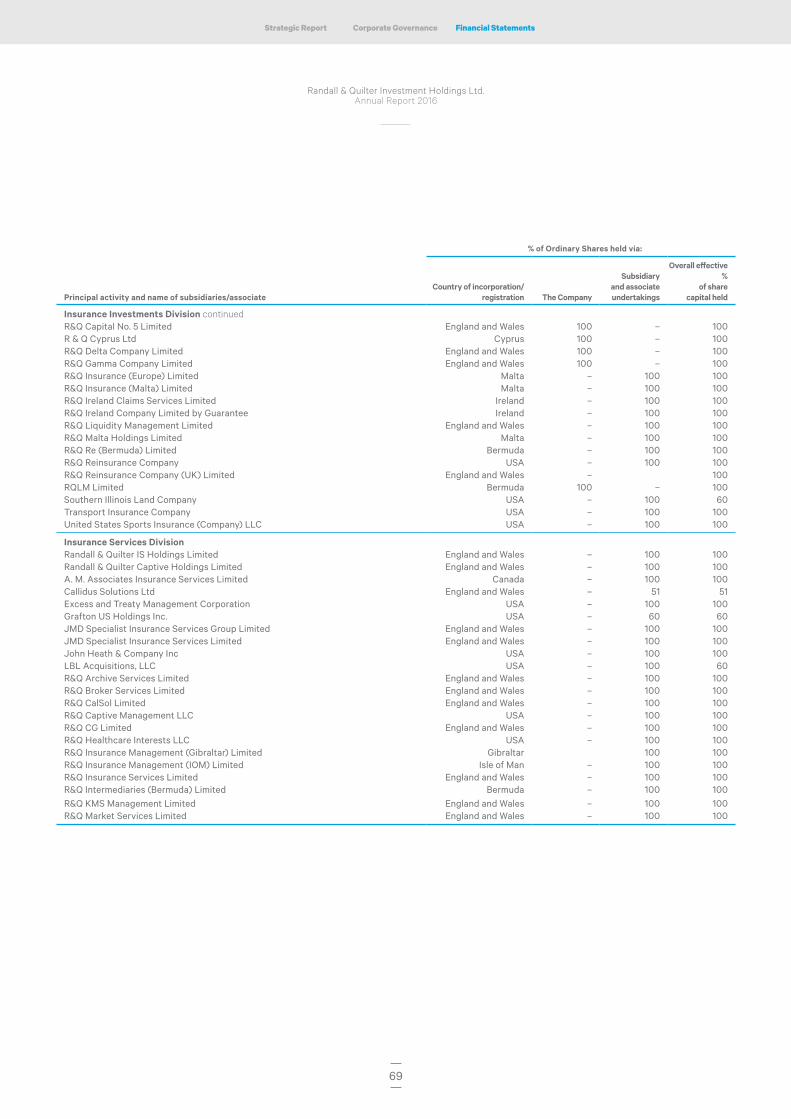
69
Financial StatementsCorporate GovernanceStrategic Report
Randall & Quilter Investment Holdings Ltd.Annual Report 2016
% of Ordinary Shares held via:
Principal activity and name of subsidiaries/associateCountry of incorporation/
registration The Company
Subsidiary and associate undertakings
Overall effective %
of share capital held
Insurance Investments Division continuedR&Q Capital No. 5 Limited England and Wales 100 – 100R & Q Cyprus Ltd Cyprus 100 – 100R&Q Delta Company Limited England and Wales 100 – 100R&Q Gamma Company Limited England and Wales 100 – 100R&Q Insurance (Europe) Limited Malta – 100 100R&Q Insurance (Malta) Limited Malta – 100 100R&Q Ireland Claims Services Limited Ireland – 100 100R&Q Ireland Company Limited by Guarantee Ireland – 100 100R&Q Liquidity Management Limited England and Wales – 100 100R&Q Malta Holdings Limited Malta – 100 100R&Q Re (Bermuda) Limited Bermuda – 100 100R&Q Reinsurance Company USA – 100 100R&Q Reinsurance Company (UK) Limited England and Wales – 100RQLM Limited Bermuda 100 – 100Southern Illinois Land Company USA – 100 60Transport Insurance Company USA – 100 100United States Sports Insurance (Company) LLC USA – 100 100
Insurance Services DivisionRandall & Quilter IS Holdings Limited England and Wales – 100 100Randall & Quilter Captive Holdings Limited England and Wales – 100 100A. M. Associates Insurance Services Limited Canada – 100 100Callidus Solutions Ltd England and Wales – 51 51Excess and Treaty Management Corporation USA – 100 100Grafton US Holdings Inc. USA – 60 60JMD Specialist Insurance Services Group Limited England and Wales – 100 100JMD Specialist Insurance Services Limited England and Wales – 100 100John Heath & Company Inc USA – 100 100LBL Acquisitions, LLC USA – 100 60R&Q Archive Services Limited England and Wales – 100 100R&Q Broker Services Limited England and Wales – 100 100R&Q CalSol Limited England and Wales – 100 100R&Q Captive Management LLC USA – 100 100R&Q CG Limited England and Wales – 100 100R&Q Healthcare Interests LLC USA – 100 100R&Q Insurance Management (Gibraltar) Limited Gibraltar 100 100R&Q Insurance Management (IOM) Limited Isle of Man – 100 100R&Q Insurance Services Limited England and Wales – 100 100R&Q Intermediaries (Bermuda) Limited Bermuda – 100 100R&Q KMS Management Limited England and Wales – 100 100R&Q Market Services Limited England and Wales – 100 100
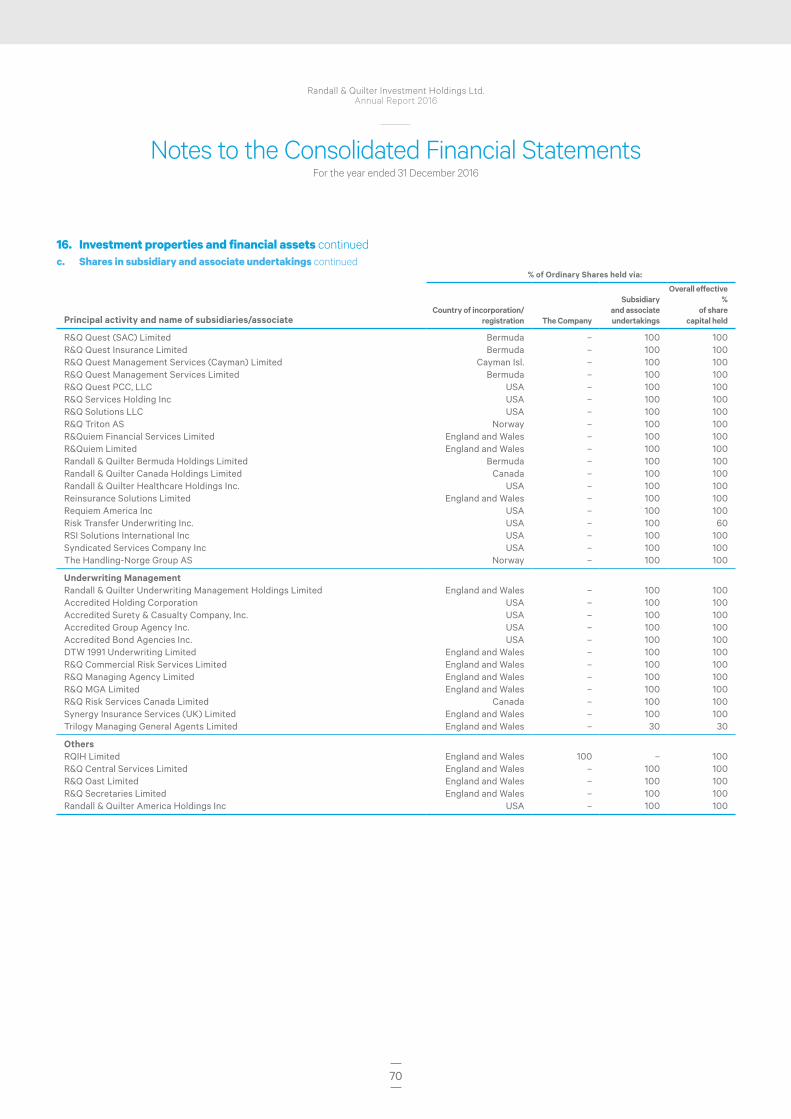
70
Randall & Quilter Investment Holdings Ltd.Annual Report 2016
Notes to the Consolidated Financial StatementsFor the year ended 31 December 2016
% of Ordinary Shares held via:
Principal activity and name of subsidiaries/associateCountry of incorporation/
registration The Company
Subsidiary and associate undertakings
Overall effective %
of share capital held
R&Q Quest (SAC) Limited Bermuda – 100 100R&Q Quest Insurance Limited Bermuda – 100 100R&Q Quest Management Services (Cayman) Limited Cayman Isl. – 100 100R&Q Quest Management Services Limited Bermuda – 100 100R&Q Quest PCC, LLC USA – 100 100R&Q Services Holding Inc USA – 100 100R&Q Solutions LLC USA – 100 100R&Q Triton AS Norway – 100 100R&Quiem Financial Services Limited England and Wales – 100 100R&Quiem Limited England and Wales – 100 100Randall & Quilter Bermuda Holdings Limited Bermuda – 100 100Randall & Quilter Canada Holdings Limited Canada – 100 100Randall & Quilter Healthcare Holdings Inc. USA – 100 100Reinsurance Solutions Limited England and Wales – 100 100Requiem America Inc USA – 100 100Risk Transfer Underwriting Inc. USA – 100 60RSI Solutions International Inc USA – 100 100Syndicated Services Company Inc USA – 100 100The Handling-Norge Group AS Norway – 100 100
Underwriting ManagementRandall & Quilter Underwriting Management Holdings Limited England and Wales – 100 100Accredited Holding Corporation USA – 100 100Accredited Surety & Casualty Company, Inc. USA – 100 100Accredited Group Agency Inc. USA – 100 100Accredited Bond Agencies Inc. USA – 100 100DTW 1991 Underwriting Limited England and Wales – 100 100R&Q Commercial Risk Services Limited England and Wales – 100 100R&Q Managing Agency Limited England and Wales – 100 100R&Q MGA Limited England and Wales – 100 100R&Q Risk Services Canada Limited Canada – 100 100Synergy Insurance Services (UK) Limited England and Wales – 100 100Trilogy Managing General Agents Limited England and Wales – 30 30
OthersRQIH Limited England and Wales 100 – 100R&Q Central Services Limited England and Wales – 100 100R&Q Oast Limited England and Wales – 100 100R&Q Secretaries Limited England and Wales – 100 100Randall & Quilter America Holdings Inc USA – 100 100
16. Investment properties and financial assets continuedc. Shares in subsidiary and associate undertakings continued
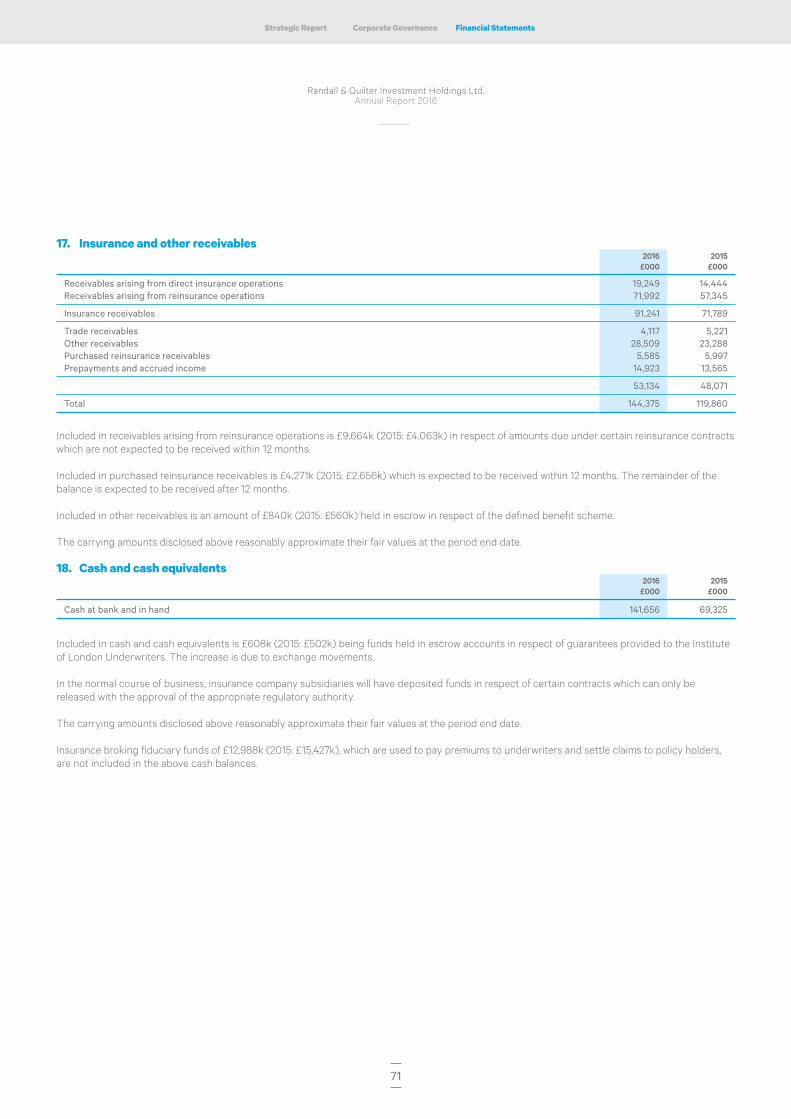
71
Financial StatementsCorporate GovernanceStrategic Report
Randall & Quilter Investment Holdings Ltd.Annual Report 2016
17. Insurance and other receivables2016
£0002015
£000
Receivables arising from direct insurance operations 19,249 14,444Receivables arising from reinsurance operations 71,992 57,345
Insurance receivables 91,241 71,789
Trade receivables 4,117 5,221Other receivables 28,509 23,288Purchased reinsurance receivables 5,585 5,997Prepayments and accrued income 14,923 13,565
53,134 48,071
Total 144,375 119,860
Included in receivables arising from reinsurance operations is £9,664k (2015: £4,063k) in respect of amounts due under certain reinsurance contracts which are not expected to be received within 12 months.
Included in purchased reinsurance receivables is £4,271k (2015: £2,656k) which is expected to be received within 12 months. The remainder of the balance is expected to be received after 12 months.
Included in other receivables is an amount of £840k (2015: £560k) held in escrow in respect of the defined benefit scheme.
The carrying amounts disclosed above reasonably approximate their fair values at the period end date.
18. Cash and cash equivalents2016
£0002015
£000
Cash at bank and in hand 141,656 69,325
Included in cash and cash equivalents is £608k (2015: £502k) being funds held in escrow accounts in respect of guarantees provided to the Institute of London Underwriters. The increase is due to exchange movements.
In the normal course of business, insurance company subsidiaries will have deposited funds in respect of certain contracts which can only be released with the approval of the appropriate regulatory authority.
The carrying amounts disclosed above reasonably approximate their fair values at the period end date.
Insurance broking fiduciary funds of £12,988k (2015: £15,427k), which are used to pay premiums to underwriters and settle claims to policy holders, are not included in the above cash balances.
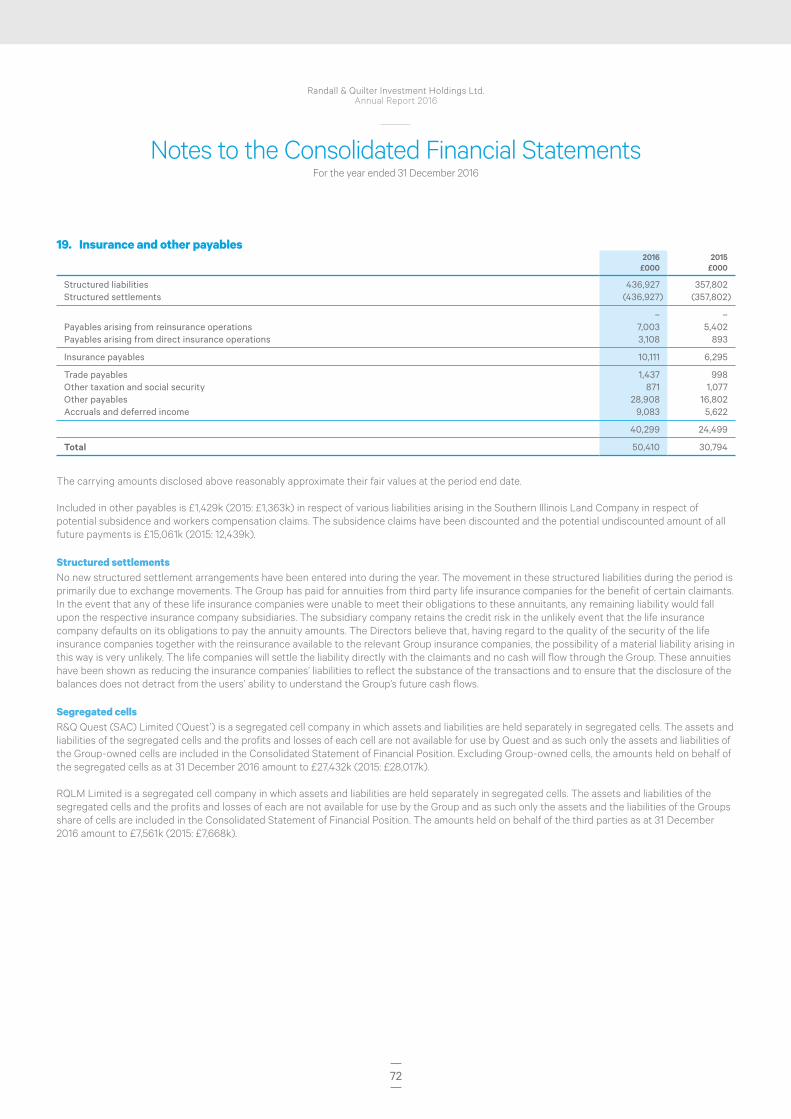
72
Randall & Quilter Investment Holdings Ltd.Annual Report 2016
Notes to the Consolidated Financial StatementsFor the year ended 31 December 2016
19. Insurance and other payables2016
£0002015
£000
Structured liabilities 436,927 357,802 Structured settlements (436,927) (357,802)
– – Payables arising from reinsurance operations 7,003 5,402 Payables arising from direct insurance operations 3,108 893
Insurance payables 10,111 6,295
Trade payables 1,437 998 Other taxation and social security 871 1,077 Other payables 28,908 16,802 Accruals and deferred income 9,083 5,622
40,299 24,499
Total 50,410 30,794
The carrying amounts disclosed above reasonably approximate their fair values at the period end date.
Included in other payables is £1,429k (2015: £1,363k) in respect of various liabilities arising in the Southern Illinois Land Company in respect of potential subsidence and workers compensation claims. The subsidence claims have been discounted and the potential undiscounted amount of all future payments is £15,061k (2015: 12,439k).
Structured settlementsNo new structured settlement arrangements have been entered into during the year. The movement in these structured liabilities during the period is primarily due to exchange movements. The Group has paid for annuities from third party life insurance companies for the benefit of certain claimants. In the event that any of these life insurance companies were unable to meet their obligations to these annuitants, any remaining liability would fall upon the respective insurance company subsidiaries. The subsidiary company retains the credit risk in the unlikely event that the life insurance company defaults on its obligations to pay the annuity amounts. The Directors believe that, having regard to the quality of the security of the life insurance companies together with the reinsurance available to the relevant Group insurance companies, the possibility of a material liability arising in this way is very unlikely. The life companies will settle the liability directly with the claimants and no cash will flow through the Group. These annuities have been shown as reducing the insurance companies’ liabilities to reflect the substance of the transactions and to ensure that the disclosure of the balances does not detract from the users’ ability to understand the Group’s future cash flows.
Segregated cellsR&Q Quest (SAC) Limited (‘Quest’) is a segregated cell company in which assets and liabilities are held separately in segregated cells. The assets and liabilities of the segregated cells and the profits and losses of each cell are not available for use by Quest and as such only the assets and liabilities of the Group-owned cells are included in the Consolidated Statement of Financial Position. Excluding Group-owned cells, the amounts held on behalf of the segregated cells as at 31 December 2016 amount to £27,432k (2015: £28,017k).
RQLM Limited is a segregated cell company in which assets and liabilities are held separately in segregated cells. The assets and liabilities of the segregated cells and the profits and losses of each are not available for use by the Group and as such only the assets and the liabilities of the Groups share of cells are included in the Consolidated Statement of Financial Position. The amounts held on behalf of the third parties as at 31 December 2016 amount to £7,561k (2015: £7,668k).

73
Financial StatementsCorporate GovernanceStrategic Report
Randall & Quilter Investment Holdings Ltd.Annual Report 2016
20. Financial liabilities2016
£0002015
£000
Amounts owed to credit institutions 65,931 37,492
Amounts due to credit institutions are payable as follows:2016
£0002015
£000
Less than one year 21,697 6,949 Between one to five years 11,373 16,284 Over five years 32,861 14,259
65,931 37,492
As outlined in Note 30, £31,874k (2015: £19,953k) owed to credit institutions is secured by debentures over the assets of the Company and several of its subsidiaries. £8,000k was due to a short-term bridge facility to fund acquisitions, which was repaid in January 2017.
In the prior year a subsidiary issued subordinated debt for €20m at a margin of 6.7% above EURIBOR and is repayable in 2025.
During the year a subsidiary issued subordinated debt for $20m at a margin of 7.75% above LIBOR and is repayable in 2023.
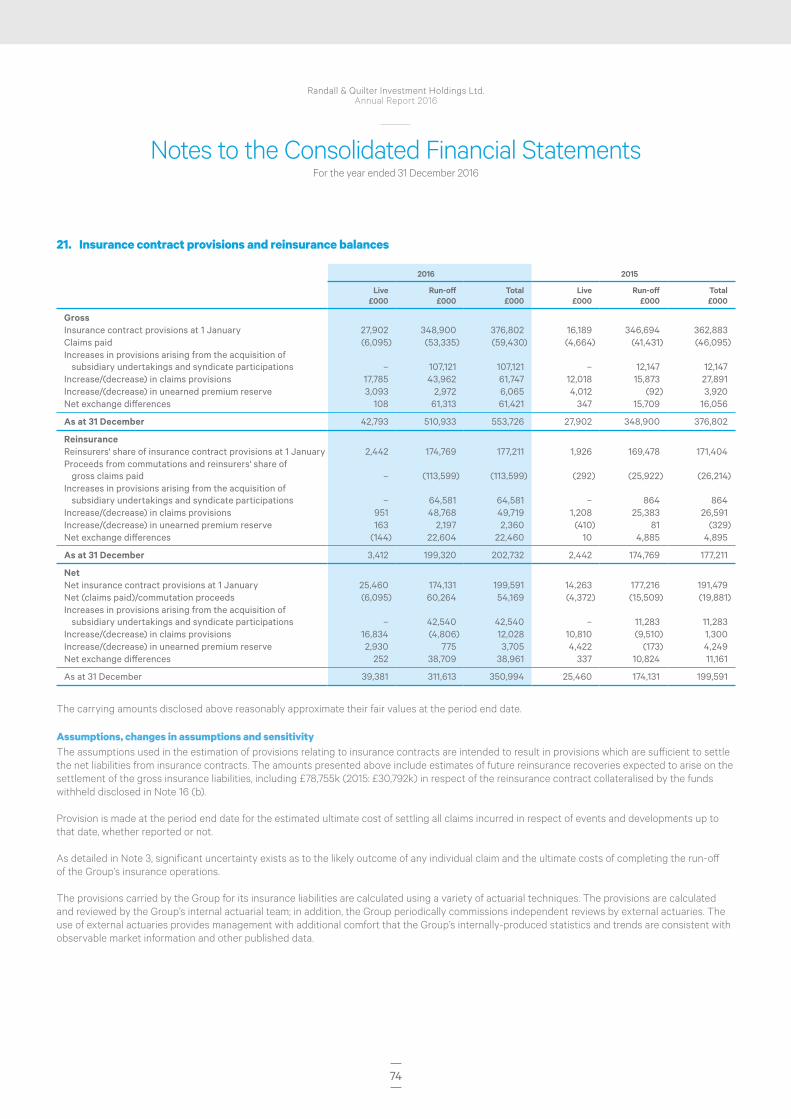
74
Randall & Quilter Investment Holdings Ltd.Annual Report 2016
Notes to the Consolidated Financial StatementsFor the year ended 31 December 2016
21. Insurance contract provisions and reinsurance balances
2016 2015
Live £000
Run-off £000
Total£000
Live£000
Run-off£000
Total£000
GrossInsurance contract provisions at 1 January 27,902 348,900 376,802 16,189 346,694 362,883 Claims paid (6,095) (53,335) (59,430) (4,664) (41,431) (46,095)Increases in provisions arising from the acquisition of
subsidiary undertakings and syndicate participations – 107,121 107,121 – 12,147 12,147 Increase/(decrease) in claims provisions 17,785 43,962 61,747 12,018 15,873 27,891 Increase/(decrease) in unearned premium reserve 3,093 2,972 6,065 4,012 (92) 3,920 Net exchange differences 108 61,313 61,421 347 15,709 16,056
As at 31 December 42,793 510,933 553,726 27,902 348,900 376,802
ReinsuranceReinsurers' share of insurance contract provisions at 1 January 2,442 174,769 177,211 1,926 169,478 171,404 Proceeds from commutations and reinsurers' share of
gross claims paid – (113,599) (113,599) (292) (25,922) (26,214)Increases in provisions arising from the acquisition of
subsidiary undertakings and syndicate participations – 64,581 64,581 – 864 864 Increase/(decrease) in claims provisions 951 48,768 49,719 1,208 25,383 26,591 Increase/(decrease) in unearned premium reserve 163 2,197 2,360 (410) 81 (329)Net exchange differences (144) 22,604 22,460 10 4,885 4,895
As at 31 December 3,412 199,320 202,732 2,442 174,769 177,211
NetNet insurance contract provisions at 1 January 25,460 174,131 199,591 14,263 177,216 191,479 Net (claims paid)/commutation proceeds (6,095) 60,264 54,169 (4,372) (15,509) (19,881)Increases in provisions arising from the acquisition of
subsidiary undertakings and syndicate participations – 42,540 42,540 – 11,283 11,283 Increase/(decrease) in claims provisions 16,834 (4,806) 12,028 10,810 (9,510) 1,300 Increase/(decrease) in unearned premium reserve 2,930 775 3,705 4,422 (173) 4,249 Net exchange differences 252 38,709 38,961 337 10,824 11,161
As at 31 December 39,381 311,613 350,994 25,460 174,131 199,591
The carrying amounts disclosed above reasonably approximate their fair values at the period end date.
Assumptions, changes in assumptions and sensitivityThe assumptions used in the estimation of provisions relating to insurance contracts are intended to result in provisions which are sufficient to settle the net liabilities from insurance contracts. The amounts presented above include estimates of future reinsurance recoveries expected to arise on the settlement of the gross insurance liabilities, including £78,755k (2015: £30,792k) in respect of the reinsurance contract collateralised by the funds withheld disclosed in Note 16 (b).
Provision is made at the period end date for the estimated ultimate cost of settling all claims incurred in respect of events and developments up to that date, whether reported or not.
As detailed in Note 3, significant uncertainty exists as to the likely outcome of any individual claim and the ultimate costs of completing the run-off of the Group’s insurance operations.
The provisions carried by the Group for its insurance liabilities are calculated using a variety of actuarial techniques. The provisions are calculated and reviewed by the Group’s internal actuarial team; in addition, the Group periodically commissions independent reviews by external actuaries. The use of external actuaries provides management with additional comfort that the Group’s internally-produced statistics and trends are consistent with observable market information and other published data.
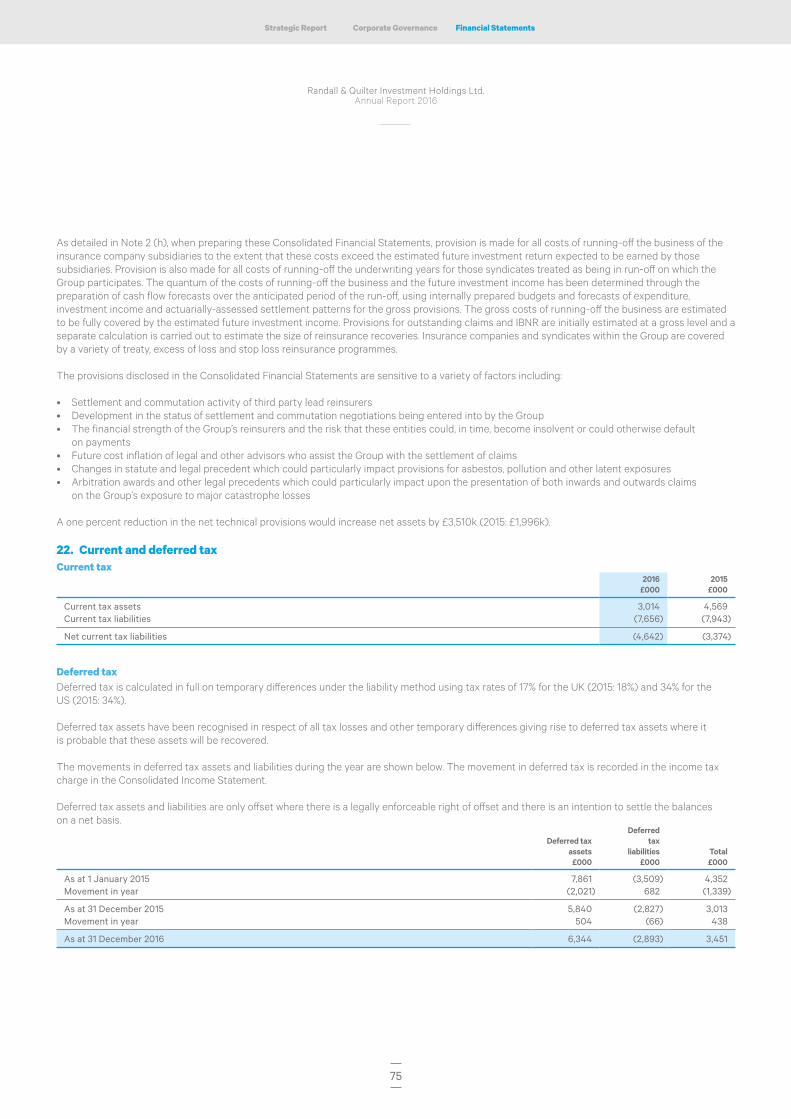
75
Financial StatementsCorporate GovernanceStrategic Report
Randall & Quilter Investment Holdings Ltd.Annual Report 2016
As detailed in Note 2 (h), when preparing these Consolidated Financial Statements, provision is made for all costs of running-off the business of the insurance company subsidiaries to the extent that these costs exceed the estimated future investment return expected to be earned by those subsidiaries. Provision is also made for all costs of running-off the underwriting years for those syndicates treated as being in run-off on which the Group participates. The quantum of the costs of running-off the business and the future investment income has been determined through the preparation of cash flow forecasts over the anticipated period of the run-off, using internally prepared budgets and forecasts of expenditure, investment income and actuarially-assessed settlement patterns for the gross provisions. The gross costs of running-off the business are estimated to be fully covered by the estimated future investment income. Provisions for outstanding claims and IBNR are initially estimated at a gross level and a separate calculation is carried out to estimate the size of reinsurance recoveries. Insurance companies and syndicates within the Group are covered by a variety of treaty, excess of loss and stop loss reinsurance programmes.
The provisions disclosed in the Consolidated Financial Statements are sensitive to a variety of factors including:
• Settlement and commutation activity of third party lead reinsurers• Development in the status of settlement and commutation negotiations being entered into by the Group• The financial strength of the Group’s reinsurers and the risk that these entities could, in time, become insolvent or could otherwise default
on payments• Future cost inflation of legal and other advisors who assist the Group with the settlement of claims• Changes in statute and legal precedent which could particularly impact provisions for asbestos, pollution and other latent exposures• Arbitration awards and other legal precedents which could particularly impact upon the presentation of both inwards and outwards claims
on the Group’s exposure to major catastrophe losses
A one percent reduction in the net technical provisions would increase net assets by £3,510k (2015: £1,996k).
22. Current and deferred taxCurrent tax
2016 £000
2015 £000
Current tax assets 3,014 4,569 Current tax liabilities (7,656) (7,943)
Net current tax liabilities (4,642) (3,374)
Deferred taxDeferred tax is calculated in full on temporary differences under the liability method using tax rates of 17% for the UK (2015: 18%) and 34% for the US (2015: 34%).
Deferred tax assets have been recognised in respect of all tax losses and other temporary differences giving rise to deferred tax assets where it is probable that these assets will be recovered.
The movements in deferred tax assets and liabilities during the year are shown below. The movement in deferred tax is recorded in the income tax charge in the Consolidated Income Statement.
Deferred tax assets and liabilities are only offset where there is a legally enforceable right of offset and there is an intention to settle the balances on a net basis.
Deferred tax assets £000
Deferred tax
liabilities £000
Total£000
As at 1 January 2015 7,861 (3,509) 4,352 Movement in year (2,021) 682 (1,339)
As at 31 December 2015 5,840 (2,827) 3,013 Movement in year 504 (66) 438
As at 31 December 2016 6,344 (2,893) 3,451
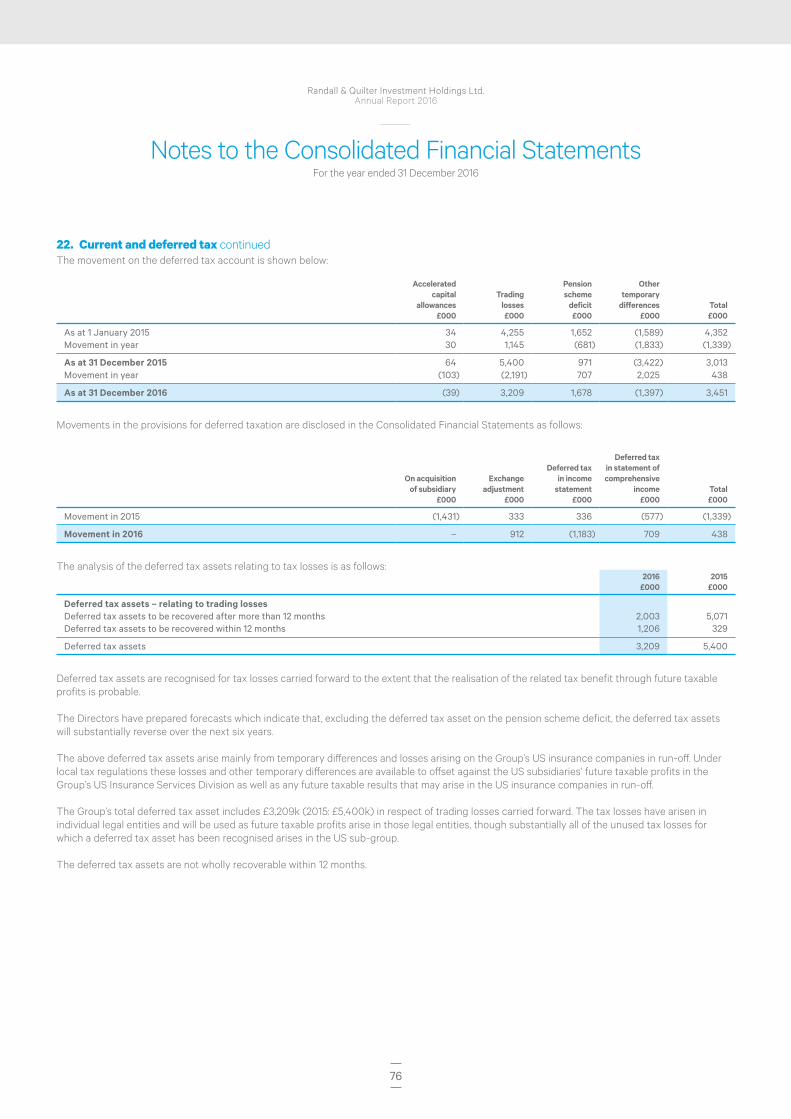
76
Randall & Quilter Investment Holdings Ltd.Annual Report 2016
Notes to the Consolidated Financial StatementsFor the year ended 31 December 2016
22. Current and deferred tax continuedThe movement on the deferred tax account is shown below:
Accelerated capital
allowances £000
Trading losses £000
Pension scheme
deficit £000
Other temporary differences
£000 Total £000
As at 1 January 2015 34 4,255 1,652 (1,589) 4,352 Movement in year 30 1,145 (681) (1,833) (1,339)
As at 31 December 2015 64 5,400 971 (3,422) 3,013 Movement in year (103) (2,191) 707 2,025 438
As at 31 December 2016 (39) 3,209 1,678 (1,397) 3,451
Movements in the provisions for deferred taxation are disclosed in the Consolidated Financial Statements as follows:
On acquisition of subsidiary
£000
Exchange adjustment
£000
Deferred tax in income statement
£000
Deferred tax in statement of comprehensive
income £000
Total £000
Movement in 2015 (1,431) 333 336 (577) (1,339)
Movement in 2016 – 912 (1,183) 709 438
The analysis of the deferred tax assets relating to tax losses is as follows:2016
£0002015
£000
Deferred tax assets – relating to trading lossesDeferred tax assets to be recovered after more than 12 months 2,003 5,071 Deferred tax assets to be recovered within 12 months 1,206 329
Deferred tax assets 3,209 5,400
Deferred tax assets are recognised for tax losses carried forward to the extent that the realisation of the related tax benefit through future taxable profits is probable.
The Directors have prepared forecasts which indicate that, excluding the deferred tax asset on the pension scheme deficit, the deferred tax assets will substantially reverse over the next six years.
The above deferred tax assets arise mainly from temporary differences and losses arising on the Group’s US insurance companies in run-off. Under local tax regulations these losses and other temporary differences are available to offset against the US subsidiaries’ future taxable profits in the Group’s US Insurance Services Division as well as any future taxable results that may arise in the US insurance companies in run-off.
The Group’s total deferred tax asset includes £3,209k (2015: £5,400k) in respect of trading losses carried forward. The tax losses have arisen in individual legal entities and will be used as future taxable profits arise in those legal entities, though substantially all of the unused tax losses for which a deferred tax asset has been recognised arises in the US sub-group.
The deferred tax assets are not wholly recoverable within 12 months.
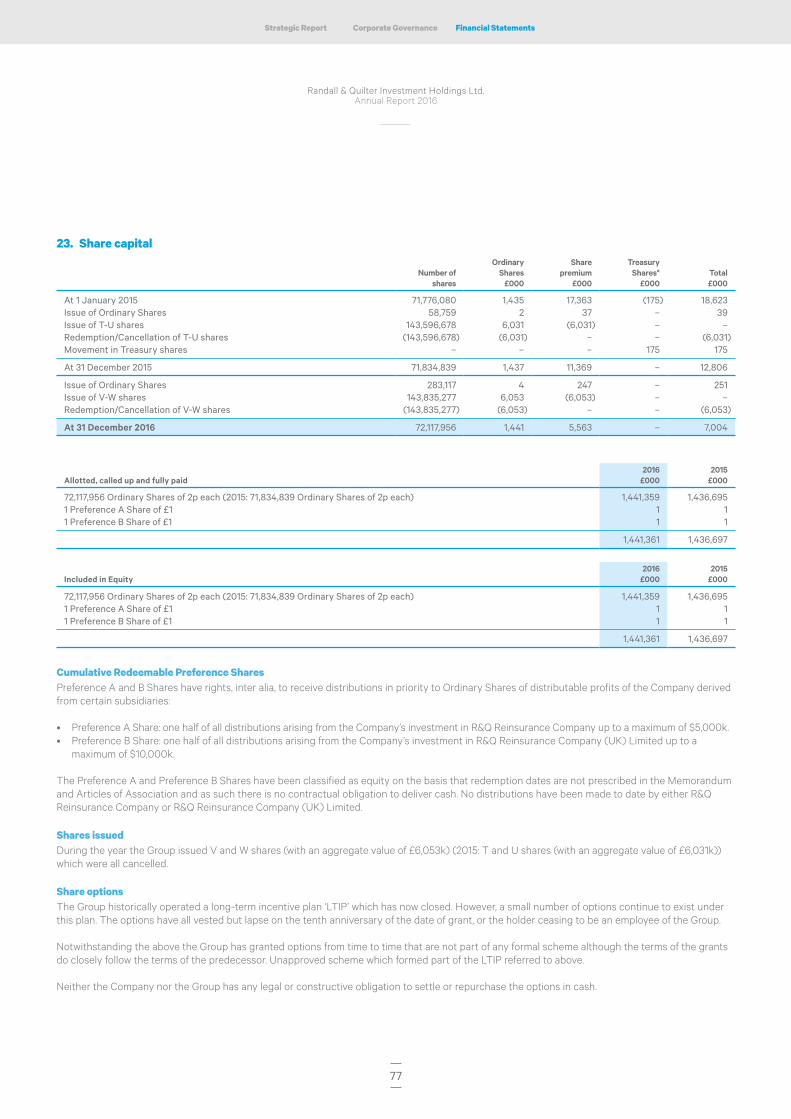
77
Financial StatementsCorporate GovernanceStrategic Report
Randall & Quilter Investment Holdings Ltd.Annual Report 2016
23. Share capital
Number of shares
Ordinary Shares
£000
Share premium
£000
Treasury Shares*
£000Total £000
At 1 January 2015 71,776,080 1,435 17,363 (175) 18,623 Issue of Ordinary Shares 58,759 2 37 – 39 Issue of T-U shares 143,596,678 6,031 (6,031) – – Redemption/Cancellation of T-U shares (143,596,678) (6,031) – – (6,031)Movement in Treasury shares – – – 175 175
At 31 December 2015 71,834,839 1,437 11,369 – 12,806
Issue of Ordinary Shares 283,117 4 247 – 251 Issue of V-W shares 143,835,277 6,053 (6,053) – – Redemption/Cancellation of V-W shares (143,835,277) (6,053) – – (6,053)
At 31 December 2016 72,117,956 1,441 5,563 – 7,004
Allotted, called up and fully paid2016
£0002015
£000
72,117,956 Ordinary Shares of 2p each (2015: 71,834,839 Ordinary Shares of 2p each) 1,441,359 1,436,6951 Preference A Share of £1 1 11 Preference B Share of £1 1 1
1,441,361 1,436,697
Included in Equity2016
£0002015
£000
72,117,956 Ordinary Shares of 2p each (2015: 71,834,839 Ordinary Shares of 2p each) 1,441,359 1,436,6951 Preference A Share of £1 1 11 Preference B Share of £1 1 1
1,441,361 1,436,697
Cumulative Redeemable Preference SharesPreference A and B Shares have rights, inter alia, to receive distributions in priority to Ordinary Shares of distributable profits of the Company derived from certain subsidiaries:
• Preference A Share: one half of all distributions arising from the Company’s investment in R&Q Reinsurance Company up to a maximum of $5,000k.• Preference B Share: one half of all distributions arising from the Company’s investment in R&Q Reinsurance Company (UK) Limited up to a
maximum of $10,000k.
The Preference A and Preference B Shares have been classified as equity on the basis that redemption dates are not prescribed in the Memorandum and Articles of Association and as such there is no contractual obligation to deliver cash. No distributions have been made to date by either R&Q Reinsurance Company or R&Q Reinsurance Company (UK) Limited.
Shares issuedDuring the year the Group issued V and W shares (with an aggregate value of £6,053k) (2015: T and U shares (with an aggregate value of £6,031k)) which were all cancelled.
Share optionsThe Group historically operated a long-term incentive plan ‘LTIP’ which has now closed. However, a small number of options continue to exist under this plan. The options have all vested but lapse on the tenth anniversary of the date of grant, or the holder ceasing to be an employee of the Group.
Notwithstanding the above the Group has granted options from time to time that are not part of any formal scheme although the terms of the grants do closely follow the terms of the predecessor. Unapproved scheme which formed part of the LTIP referred to above.
Neither the Company nor the Group has any legal or constructive obligation to settle or repurchase the options in cash.

78
Randall & Quilter Investment Holdings Ltd.Annual Report 2016
Notes to the Consolidated Financial StatementsFor the year ended 31 December 2016
23. Share capital continuedMovements in the number of share options and their related exercise price are as follows:
Weighted average
exercise price 2016
pence Number of
options 2016
Weighted average
exercise price 2015
pence
Number of options
2015
Outstanding at 1 January 56.5 135,000 66.0 115,000 Exercised 5.2 (323,117) 2.0 (122,449)Granted 2.0 283,117 2.0 142,449
At 31 December 68.4 95,000 56.5 135,000
The total number of options in issue during the year has given rise to a charge to the Consolidated Income Statement of £261k (2015: £159k) based on the fair values at the time the options were granted.
The fair value of the share options was determined using the binomial option pricing method. The parameters used are detailed below. The volatility measured at the standard deviation of continuously compounded share returns is based on statistical analysis of the daily share price over a 100-day period.
2016 options
2015 options
Weighted average fair value 68.4 pence 57.3 penceWeighted average share price 108.0 pence 113.8 penceExercise price 68.4 pence 56.5 pence
Expiry date 10 years
after granting10 years
after grantingVesting period 3 years 3 yearsVolatility 21.0% 21.0%Dividend yield 8.5% 8.5%Expected option life 3 years 3 yearsAnnual risk-free interest rate 0.91% 0.91%
The options outstanding at 31 December 2016 are all exercisable and had a weighted average remaining contractual life of 3.0 (2015: 4.0) years.
The range of prices on the outstanding share options is 40.0 pence to 70.0 pence.
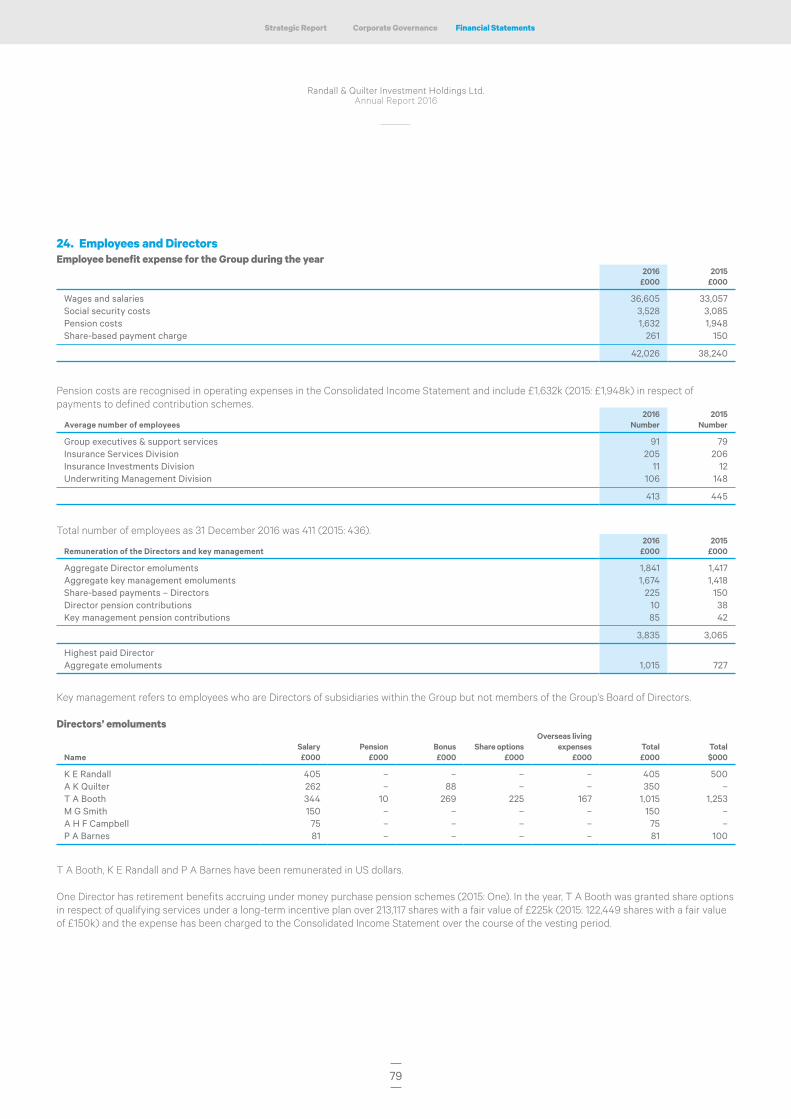
79
Financial StatementsCorporate GovernanceStrategic Report
Randall & Quilter Investment Holdings Ltd.Annual Report 2016
24. Employees and DirectorsEmployee benefit expense for the Group during the year
2016 £000
2015 £000
Wages and salaries 36,605 33,057Social security costs 3,528 3,085Pension costs 1,632 1,948Share-based payment charge 261 150
42,026 38,240
Pension costs are recognised in operating expenses in the Consolidated Income Statement and include £1,632k (2015: £1,948k) in respect of payments to defined contribution schemes.
Average number of employees2016
Number2015
Number
Group executives & support services 91 79Insurance Services Division 205 206Insurance Investments Division 11 12Underwriting Management Division 106 148
413 445
Total number of employees as 31 December 2016 was 411 (2015: 436).
Remuneration of the Directors and key management2016
£0002015
£000
Aggregate Director emoluments 1,841 1,417Aggregate key management emoluments 1,674 1,418Share-based payments – Directors 225 150Director pension contributions 10 38Key management pension contributions 85 42
3,835 3,065
Highest paid DirectorAggregate emoluments 1,015 727
Key management refers to employees who are Directors of subsidiaries within the Group but not members of the Group’s Board of Directors.
Directors’ emoluments
NameSalary£000
Pension£000
Bonus£000
Share options£000
Overseas living expenses
£000 Total£000
Total$000
K E Randall 405 – – – – 405 500A K Quilter 262 – 88 – – 350 –T A Booth 344 10 269 225 167 1,015 1,253M G Smith 150 – – – – 150 –A H F Campbell 75 – – – – 75 –P A Barnes 81 – – – – 81 100
T A Booth, K E Randall and P A Barnes have been remunerated in US dollars.
One Director has retirement benefits accruing under money purchase pension schemes (2015: One). In the year, T A Booth was granted share options in respect of qualifying services under a long-term incentive plan over 213,117 shares with a fair value of £225k (2015: 122,449 shares with a fair value of £150k) and the expense has been charged to the Consolidated Income Statement over the course of the vesting period.
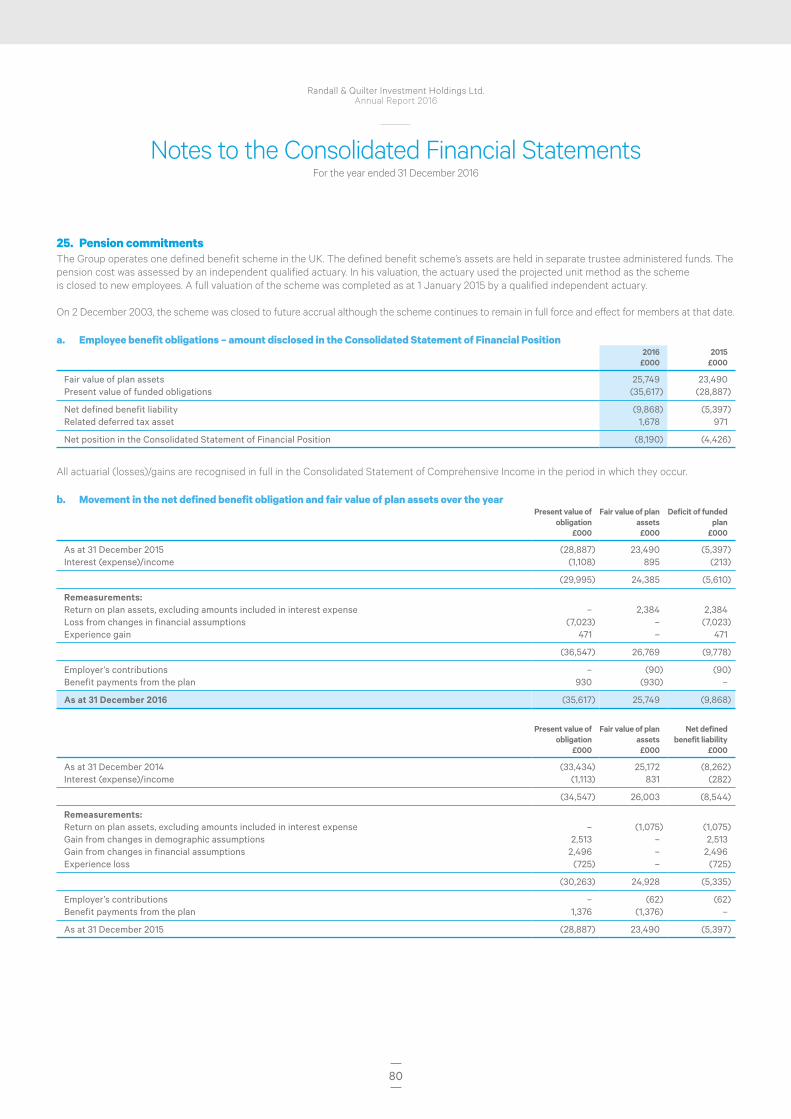
80
Randall & Quilter Investment Holdings Ltd.Annual Report 2016
Notes to the Consolidated Financial StatementsFor the year ended 31 December 2016
25. Pension commitmentsThe Group operates one defined benefit scheme in the UK. The defined benefit scheme’s assets are held in separate trustee administered funds. The pension cost was assessed by an independent qualified actuary. In his valuation, the actuary used the projected unit method as the scheme is closed to new employees. A full valuation of the scheme was completed as at 1 January 2015 by a qualified independent actuary.
On 2 December 2003, the scheme was closed to future accrual although the scheme continues to remain in full force and effect for members at that date.
a. Employee benefit obligations – amount disclosed in the Consolidated Statement of Financial Position2016
£0002015
£000
Fair value of plan assets 25,749 23,490 Present value of funded obligations (35,617) (28,887)
Net defined benefit liability (9,868) (5,397)Related deferred tax asset 1,678 971
Net position in the Consolidated Statement of Financial Position (8,190) (4,426)
All actuarial (losses)/gains are recognised in full in the Consolidated Statement of Comprehensive Income in the period in which they occur. b. Movement in the net defined benefit obligation and fair value of plan assets over the year
Present value of obligation
£000
Fair value of plan assets£000
Deficit of funded plan
£000
As at 31 December 2015 (28,887) 23,490 (5,397)Interest (expense)/income (1,108) 895 (213)
(29,995) 24,385 (5,610)
Remeasurements:Return on plan assets, excluding amounts included in interest expense – 2,384 2,384 Loss from changes in financial assumptions (7,023) – (7,023)Experience gain 471 – 471
(36,547) 26,769 (9,778)
Employer’s contributions – (90) (90)Benefit payments from the plan 930 (930) –
As at 31 December 2016 (35,617) 25,749 (9,868)
Present value of obligation
£000
Fair value of plan assets£000
Net defined benefit liability
£000
As at 31 December 2014 (33,434) 25,172 (8,262)Interest (expense)/income (1,113) 831 (282)
(34,547) 26,003 (8,544)
Remeasurements:Return on plan assets, excluding amounts included in interest expense – (1,075) (1,075)Gain from changes in demographic assumptions 2,513 – 2,513 Gain from changes in financial assumptions 2,496 – 2,496 Experience loss (725) – (725)
(30,263) 24,928 (5,335)
Employer’s contributions – (62) (62)Benefit payments from the plan 1,376 (1,376) –
As at 31 December 2015 (28,887) 23,490 (5,397)
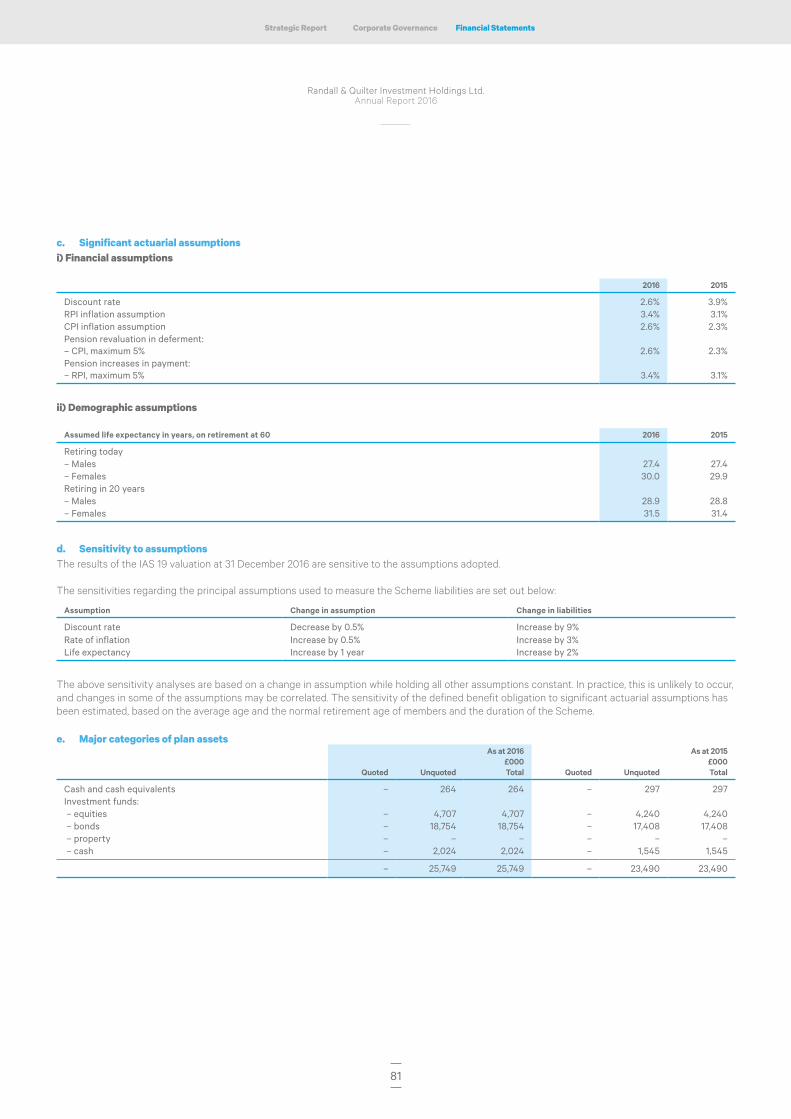
81
Financial StatementsCorporate GovernanceStrategic Report
Randall & Quilter Investment Holdings Ltd.Annual Report 2016
c. Significant actuarial assumptionsi) Financial assumptions
2016 2015
Discount rate 2.6% 3.9%RPI inflation assumption 3.4% 3.1%CPI inflation assumption 2.6% 2.3%Pension revaluation in deferment:– CPI, maximum 5% 2.6% 2.3%Pension increases in payment:– RPI, maximum 5% 3.4% 3.1%
ii) Demographic assumptions
Assumed life expectancy in years, on retirement at 60 2016 2015
Retiring today– Males 27.4 27.4– Females 30.0 29.9Retiring in 20 years– Males 28.9 28.8– Females 31.5 31.4
d. Sensitivity to assumptionsThe results of the IAS 19 valuation at 31 December 2016 are sensitive to the assumptions adopted. The sensitivities regarding the principal assumptions used to measure the Scheme liabilities are set out below:
Assumption Change in assumption Change in liabilities
Discount rate Decrease by 0.5% Increase by 9%Rate of inflation Increase by 0.5% Increase by 3%Life expectancy Increase by 1 year Increase by 2%
The above sensitivity analyses are based on a change in assumption while holding all other assumptions constant. In practice, this is unlikely to occur, and changes in some of the assumptions may be correlated. The sensitivity of the defined benefit obligation to significant actuarial assumptions has been estimated, based on the average age and the normal retirement age of members and the duration of the Scheme. e. Major categories of plan assets
Quoted Unquoted
As at 2016£000Total Quoted Unquoted
As at 2015£000Total
Cash and cash equivalents – 264 264 – 297 297 Investment funds: – equities – 4,707 4,707 – 4,240 4,240 – bonds – 18,754 18,754 – 17,408 17,408 – property – – – – – – – cash – 2,024 2,024 – 1,545 1,545
– 25,749 25,749 – 23,490 23,490
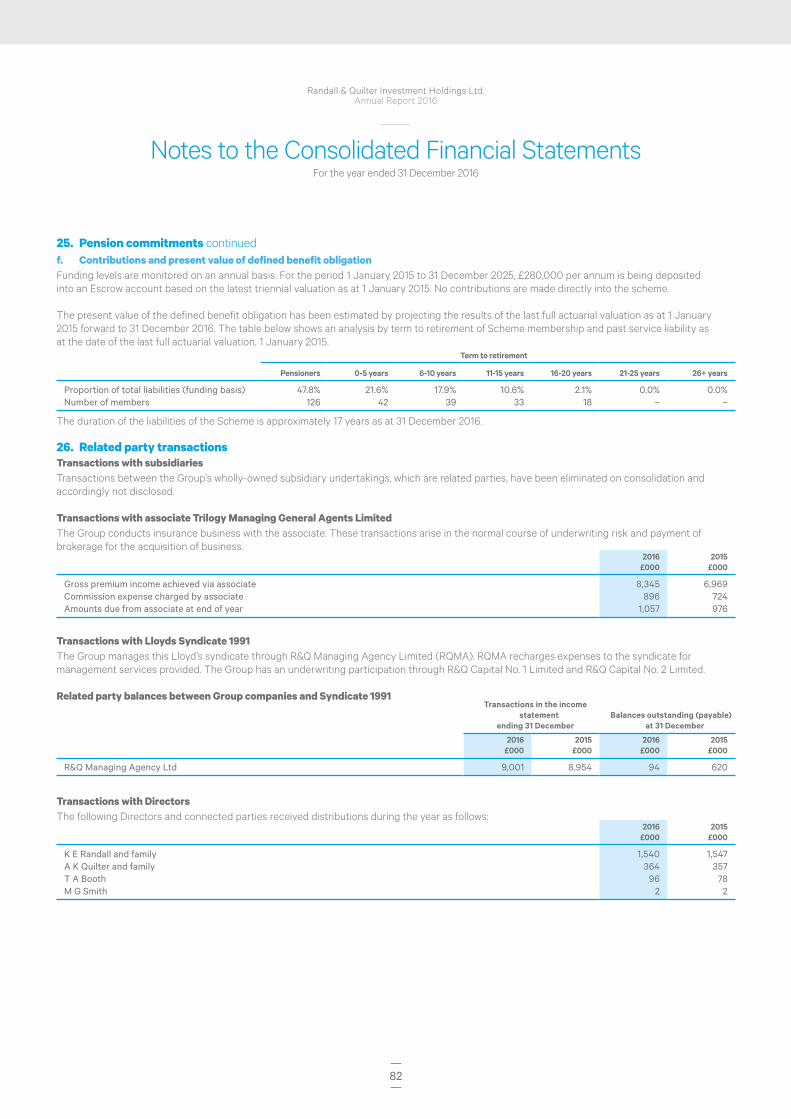
82
Randall & Quilter Investment Holdings Ltd.Annual Report 2016
Notes to the Consolidated Financial StatementsFor the year ended 31 December 2016
25. Pension commitments continuedf. Contributions and present value of defined benefit obligationFunding levels are monitored on an annual basis. For the period 1 January 2015 to 31 December 2025, £280,000 per annum is being deposited into an Escrow account based on the latest triennial valuation as at 1 January 2015. No contributions are made directly into the scheme.
The present value of the defined benefit obligation has been estimated by projecting the results of the last full actuarial valuation as at 1 January 2015 forward to 31 December 2016. The table below shows an analysis by term to retirement of Scheme membership and past service liability as at the date of the last full actuarial valuation, 1 January 2015.
Term to retirement
Pensioners 0-5 years 6-10 years 11-15 years 16-20 years 21-25 years 26+ years
Proportion of total liabilities (funding basis) 47.8% 21.6% 17.9% 10.6% 2.1% 0.0% 0.0%Number of members 126 42 39 33 18 – –
The duration of the liabilities of the Scheme is approximately 17 years as at 31 December 2016.
26. Related party transactionsTransactions with subsidiariesTransactions between the Group’s wholly-owned subsidiary undertakings, which are related parties, have been eliminated on consolidation and accordingly not disclosed.
Transactions with associate Trilogy Managing General Agents LimitedThe Group conducts insurance business with the associate. These transactions arise in the normal course of underwriting risk and payment of brokerage for the acquisition of business.
2016£000
2015£000
Gross premium income achieved via associate 8,345 6,969 Commission expense charged by associate 896 724 Amounts due from associate at end of year 1,057 976
Transactions with Lloyds Syndicate 1991 The Group manages this Lloyd’s syndicate through R&Q Managing Agency Limited (RQMA). RQMA recharges expenses to the syndicate for management services provided. The Group has an underwriting participation through R&Q Capital No. 1 Limited and R&Q Capital No. 2 Limited.
Related party balances between Group companies and Syndicate 1991Transactions in the income
statementending 31 December
Balances outstanding (payable) at 31 December
2016£000
2015£000
2016£000
2015£000
R&Q Managing Agency Ltd 9,001 8,954 94 620
Transactions with DirectorsThe following Directors and connected parties received distributions during the year as follows:
2016£000
2015£000
K E Randall and family 1,540 1,547A K Quilter and family 364 357T A Booth 96 78M G Smith 2 2
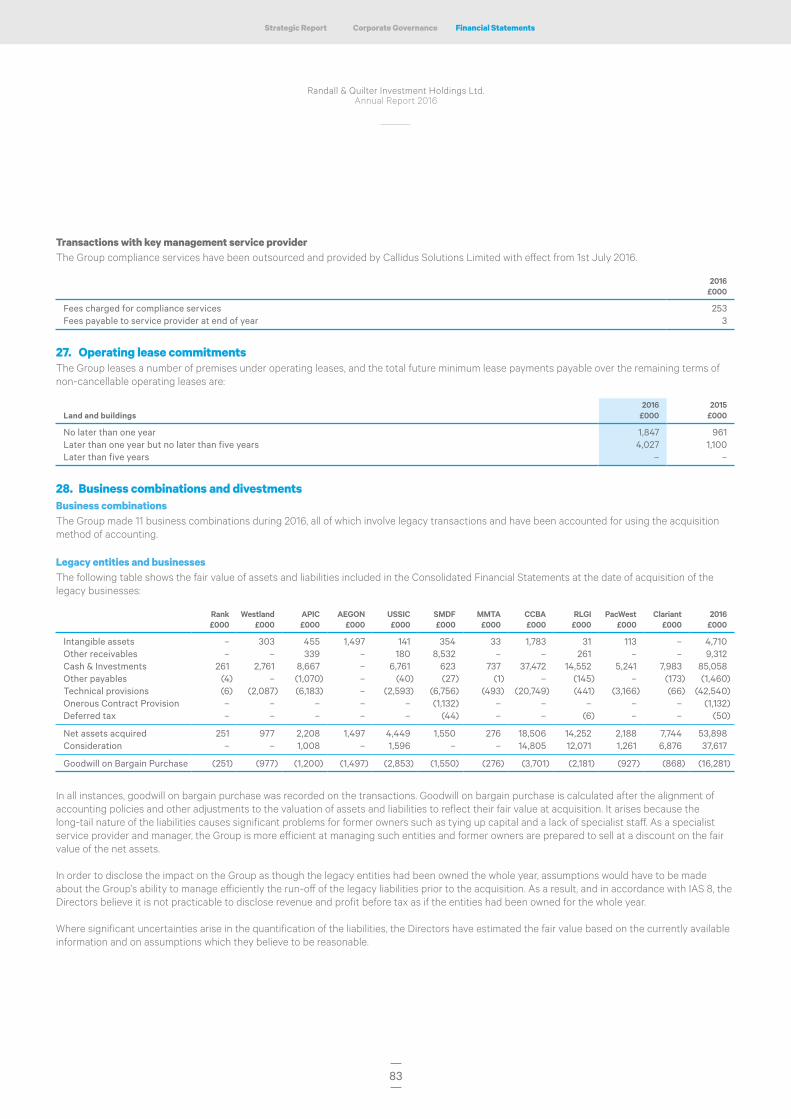
83
Financial StatementsCorporate GovernanceStrategic Report
Randall & Quilter Investment Holdings Ltd.Annual Report 2016
Transactions with key management service providerThe Group compliance services have been outsourced and provided by Callidus Solutions Limited with effect from 1st July 2016.
2016£000
Fees charged for compliance services 253 Fees payable to service provider at end of year 3
27. Operating lease commitmentsThe Group leases a number of premises under operating leases, and the total future minimum lease payments payable over the remaining terms of non-cancellable operating leases are:
Land and buildings2016
£0002015
£000
No later than one year 1,847 961 Later than one year but no later than five years 4,027 1,100 Later than five years – –
28. Business combinations and divestmentsBusiness combinationsThe Group made 11 business combinations during 2016, all of which involve legacy transactions and have been accounted for using the acquisition method of accounting.
Legacy entities and businesses The following table shows the fair value of assets and liabilities included in the Consolidated Financial Statements at the date of acquisition of the legacy businesses:
Rank£000
Westland£000
APIC£000
AEGON£000
USSIC£000
SMDF£000
MMTA£000
CCBA£000
RLGI£000
PacWest£000
Clariant£000
2016£000
Intangible assets – 303 455 1,497 141 354 33 1,783 31 113 – 4,710Other receivables – – 339 – 180 8,532 – – 261 – – 9,312Cash & Investments 261 2,761 8,667 – 6,761 623 737 37,472 14,552 5,241 7,983 85,058Other payables (4) – (1,070) – (40) (27) (1) – (145) – (173) (1,460)Technical provisions (6) (2,087) (6,183) – (2,593) (6,756) (493) (20,749) (441) (3,166) (66) (42,540)Onerous Contract Provision – – – – – (1,132) – – – – – (1,132)Deferred tax – – – – – (44) – – (6) – – (50)
Net assets acquired 251 977 2,208 1,497 4,449 1,550 276 18,506 14,252 2,188 7,744 53,898Consideration – – 1,008 – 1,596 – – 14,805 12,071 1,261 6,876 37,617
Goodwill on Bargain Purchase (251) (977) (1,200) (1,497) (2,853) (1,550) (276) (3,701) (2,181) (927) (868) (16,281)
In all instances, goodwill on bargain purchase was recorded on the transactions. Goodwill on bargain purchase is calculated after the alignment of accounting policies and other adjustments to the valuation of assets and liabilities to reflect their fair value at acquisition. It arises because the long-tail nature of the liabilities causes significant problems for former owners such as tying up capital and a lack of specialist staff. As a specialist service provider and manager, the Group is more efficient at managing such entities and former owners are prepared to sell at a discount on the fair value of the net assets.
In order to disclose the impact on the Group as though the legacy entities had been owned the whole year, assumptions would have to be made about the Group’s ability to manage efficiently the run-off of the legacy liabilities prior to the acquisition. As a result, and in accordance with IAS 8, the Directors believe it is not practicable to disclose revenue and profit before tax as if the entities had been owned for the whole year.
Where significant uncertainties arise in the quantification of the liabilities, the Directors have estimated the fair value based on the currently available information and on assumptions which they believe to be reasonable.

84
Randall & Quilter Investment Holdings Ltd.Annual Report 2016
Notes to the Consolidated Financial StatementsFor the year ended 31 December 2016
28. Business combinations and divestments continuedThe Group completed the following business combinations during 2016:
• On 24 March 2016, the Group purchased the entire issued share capital of Rank Insurance Limited (‘Rank’), a company incorporated in Guernsey. Rank wrote employers’ and public liabilities and has been in run-off since 2004. External costs incurred in acquiring Rank were £10k. Post-acquisition Rank has been amalgamated into Capstan.
• On 26 May 2016, the Group novated liabilities from Westland Insurance Company, a Cayman Islands domiciled captive. The liabilities transferred related to workers compensation policies. External costs incurred in novating the policies were £12k.
• On 30 June 2016 the Group purchased the entire issued share capital of Agency Program Insurance Company (SAC), Limited, a segregated cell captive company incorporated in Bermuda and the cells operated by it. APIC has 28 separate cells which reinsured various insurance companies for workers compensation, general, commercial auto, auto, property and inland marine liabilities. External costs incurred in the acquisition were nil.
• On 8 September 2016, the Group completed the Part VII (FSMA 2000) transfer in respect of AEGON’s non-life insurance liabilities which were previously subject to a retrospective reinsurance policy. External costs incurred in the transfer were £172k.
• On 23 September 2016, the Group purchased the entire issued share capital of United States Sports Insurance Company, LLC, the captive insurer of USA Swimming, domiciled in Washington D.C., USA. External costs incurred in the acquisition amounted to £251k.
• On 3 November 2016, the Group acquired Solicitors Mutual Defence Fund (‘SMDF’), a company limited by guarantee in Ireland. SMDF provided professional indemnity protection for solicitors practising in Ireland. External costs incurred in relation to acquiring SMDF were £156k.
• On 7 November 2016, the Group novated liabilities from Maryland Motor Truck Association Workers’ Compensation Self Insurance Group, a Maryland domiciled self-insurance group. External costs incurred in the novation were nil.
• On 27 December 2016, the Group novated the workers’ compensation, general liability, auto liability and auto property damages reinsurance policies from Georgia Atlantic Insurance, Ltd., a wholly-owned Bermuda based captive of the Coca-Cola Bottlers’ Association, Inc. External costs incurred in novating the policies were £157k.
• On 29 December 2016, the Group acquired The Royal London General Insurance Company Limited (‘RLGI’), a company incorporated in England and Wales. RLGI underwrote non-life insurance from 1985 to 1999; the remaining liabilities relate to employers’ liability. External costs incurred in acquiring RLGI were £29k.
• On 29 December 2016, the Group novated liabilities for policy years 2001 to 2011 from PacWest Captive Insurance Company, Inc, an Arizona, U.S. domiciled company. The liabilities transferred relate to workers’ compensation policies. External costs incurred in the novation were nil.
• On 30 December 2016, the Group acquired the entire issued share capital of Clariant Insurance AG ‘(Clariant’), a Liechtenstein domiciled captive insurer. Clariant primarily wrote the high layer excess products and general liability protections for the worldwide Clariant group. External costs incurred in the acquisition were £173k.
DivestmentOn 26 February 2016, the Group completed the sale of the Synergy business to Plum Underwriting. The cash consideration was £625k.
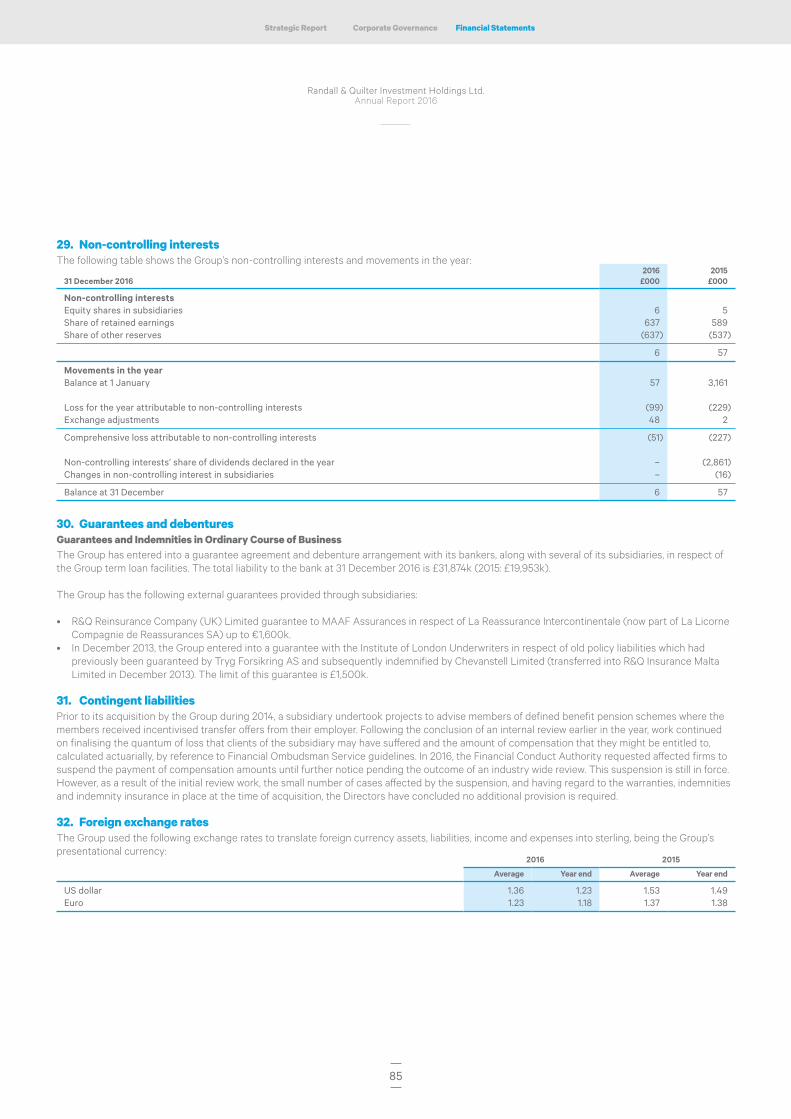
85
Financial StatementsCorporate GovernanceStrategic Report
Randall & Quilter Investment Holdings Ltd.Annual Report 2016
29. Non-controlling interestsThe following table shows the Group’s non-controlling interests and movements in the year:
31 December 20162016
£0002015
£000
Non-controlling interestsEquity shares in subsidiaries 6 5 Share of retained earnings 637 589 Share of other reserves (637) (537)
6 57
Movements in the yearBalance at 1 January 57 3,161
Loss for the year attributable to non-controlling interests (99) (229)Exchange adjustments 48 2
Comprehensive loss attributable to non-controlling interests (51) (227)
Non-controlling interests’ share of dividends declared in the year – (2,861)Changes in non-controlling interest in subsidiaries – (16)
Balance at 31 December 6 57
30. Guarantees and debenturesGuarantees and Indemnities in Ordinary Course of BusinessThe Group has entered into a guarantee agreement and debenture arrangement with its bankers, along with several of its subsidiaries, in respect of the Group term loan facilities. The total liability to the bank at 31 December 2016 is £31,874k (2015: £19,953k).
The Group has the following external guarantees provided through subsidiaries:
• R&Q Reinsurance Company (UK) Limited guarantee to MAAF Assurances in respect of La Reassurance Intercontinentale (now part of La Licorne Compagnie de Reassurances SA) up to €1,600k.
• In December 2013, the Group entered into a guarantee with the Institute of London Underwriters in respect of old policy liabilities which had previously been guaranteed by Tryg Forsikring AS and subsequently indemnified by Chevanstell Limited (transferred into R&Q Insurance Malta Limited in December 2013). The limit of this guarantee is £1,500k.
31. Contingent liabilitiesPrior to its acquisition by the Group during 2014, a subsidiary undertook projects to advise members of defined benefit pension schemes where the members received incentivised transfer offers from their employer. Following the conclusion of an internal review earlier in the year, work continued on finalising the quantum of loss that clients of the subsidiary may have suffered and the amount of compensation that they might be entitled to, calculated actuarially, by reference to Financial Ombudsman Service guidelines. In 2016, the Financial Conduct Authority requested affected firms to suspend the payment of compensation amounts until further notice pending the outcome of an industry wide review. This suspension is still in force. However, as a result of the initial review work, the small number of cases affected by the suspension, and having regard to the warranties, indemnities and indemnity insurance in place at the time of acquisition, the Directors have concluded no additional provision is required.
32. Foreign exchange ratesThe Group used the following exchange rates to translate foreign currency assets, liabilities, income and expenses into sterling, being the Group’s presentational currency:
2016 2015
Average Year end Average Year end
US dollar 1.36 1.23 1.53 1.49Euro 1.23 1.18 1.37 1.38
86
Randall & Quilter Investment Holdings Ltd.Annual Report 2016
Notes to the Consolidated Financial StatementsFor the year ended 31 December 2016
33. Events after the reporting dateOn 28 March 2017 the Group placed 15,278,291 additional shares at 117p raising approximately £17.9 million.
The Group has acquired the following legacy entities and business after the reporting date:
• On 16 March 2017, the Group acquired the entire issued share capital of ICDC Ltd.(‘ICDC’), a Vermont, U.S. captive insurance company. ICDC reinsured workers’ compensation, commercial general liability, business auto liability, business auto physical damage and property risks of the parent. Consideration amounted to £4,846k, the provisional estimate of goodwill on bargain purchase is £1,589k.
• On 30 March 2017, the Group acquired the entire issued share capital of LinCo Limited, a wholly-owned Bermuda domiciled captive insurer of Ameripride Services Inc. and Alsco Inc. Consideration amounted to £120k, the provisional estimate of goodwill on bargain purchase is £189k.
• These Consolidated Financial Statements do not include any financial impact arising from these acquisitions.
34. Ultimate controlling partyThe Directors consider that the Group has no ultimate controlling party.

87
Financial StatementsCorporate GovernanceStrategic Report
Randall & Quilter Investment Holdings Ltd.Annual Report 2016
Shareholder Information
SecretaryM L Glover
Registered OfficeClarendon House 2 Church Street Hamilton HM11 Bermuda
Registered Number47341
BankersThe Royal Bank of Scotland plc 280 Bishopsgate London EC2M 4RB
AuditorsPKF Littlejohn LLP 1 Westferry Circus Canary Wharf London E14 4HD

88
Randall & Quilter Investment Holdings Ltd.Annual Report 2016

UK Offices
London
71 Fenchurch Street London EC3M 4BS
Witham
R&Q House, Freebournes Road, Witham Essex CM8 3UN
Norwich
Floor 3, Lawrence House 5 St Andrews Hill Norwich NR2 1AD
Principal worldwide office locations
US Offices
New York
340 Madison Avenue Suite 1911 New York NY 10173
Philadelphia
2 Logan Square 100 North 18th Street Suite 600 Philadelphia PA 19103
Orlando
4798 New Broad Street Suite 200 Orlando FL 32814
Bermuda Office
Head Office
FB Perry Building 40 Church Street PO Box HM 2062 Hamilton
www.rqih.com
Randall & Q
uilter Investment H
oldings Ltd. Annual Report 2016