2010 (3.5 mb)
TRANSCRIPT


REPORT ON THE ACHIEVEMENTOF THE MILLENNIUM DEVELOPMENT
GOALS INDONESIA2010
Published by:


iii
Foreword
Prof. Dr. Armida S. Alisjahbana, SE, MA
iv
Acknowledgements
Prof. Dr. Armida S. Alisjahbana, SE, MA
v
Table of Contents
Foreword ......................................................................................................................................... iiiAcknowledgements ...........................................................................................................................ivTable of Contents............................................................................................................................... vList of Figures ....................................................................................................................................viList of Tables ...................................................................................................................................viiiList of Boxes ....................................................................................................................................viiiList of Abbreviation ...........................................................................................................................ixIntroduction ..................................................................................................................................... 1Summary by Goal .............................................................................................................................. 5Overview of Status of MDGs Targets.................................................................................................. 9
GOAL 1: ERADICATE EXTREME POVERTY AND HUNGER.................................................................... 12
GOAL 2: ACHIEVE UNIVERSAL PRIMARY EDUCATION........................................................................ 35
GOAL 3: PROMOTE GENDER EQUALITY AND EMPOWER WOMEN .................................................... 47
GOAL 4: REDUCE CHILD MORTALITY RATE ....................................................................................... 57
GOAL 5: IMPROVE MATERNAL HEALTH ............................................................................................ 47
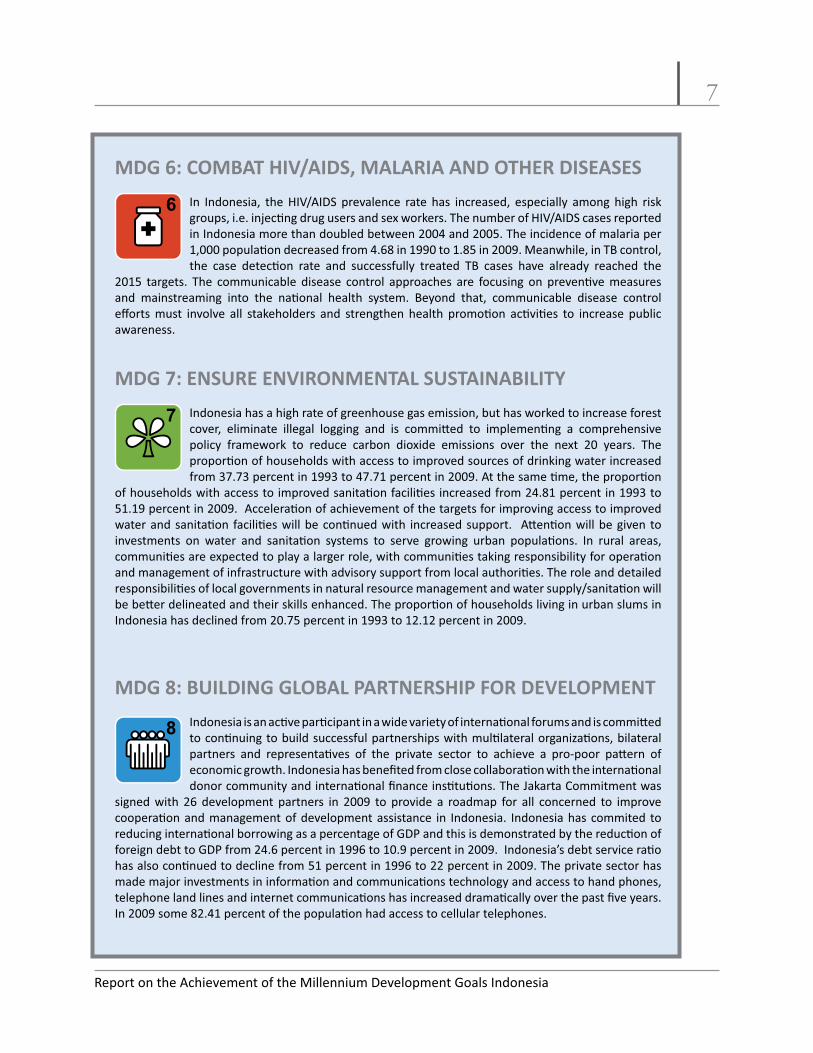
GOAL 6: COMBAT HIV/AIDS, MALARIA AND OTHER DISEASES .......................................................... 77
vi
GOAL 7: ENSURE ENVIRONMENTAL SUSTAINABILITY........................................................................ 95
GOAL 8: DEVELOP A GLOBAL PARTNERSHIP FOR DEVELOPMENT.....................................................119
Bibliography ..................................................................................................................................133
vii

viii
”

ix
Kementerian Negara Perencanaan Pembangunan Nasional
Biaya Operasional Kesehatan
Bantuan Operasional Sekolah
Beasiswa Miskin

x
Dewan Perwakilan Rakyat
Dewan Perwakilan Rakyat Daerah
Jamkesmas Jaminan Kesehatan Masyarakat
Kampung Kampungs
Kawasan Pelestarian Alam
Komisi Pemilihan Umum
Kawasan Suaka Alam

xi
Kredit Usaha Rakyat
Lembaga Jasa Keuangan
Madrasah Aliyah
MTs Madrasah Tsanawiyah
Musrenbangdes Musyawarah Perencanaan Pembangunan Desa
Pendidikan Anak Usia Dini
Perumnas Perumahan Nasional
Perilaku Hidup Bersih Sehat
Program Keluarga Harapan
Program Nasional Pemberdayaan Masyarakat
Posyandu Pos Pelayanan Terpadu
Puskesmas Pusat Kesehatan Masyarakat
Pustu Puskesmas Pembantu
Beras Miskin
Riskesdas RIset Kesehatan Dasar

xii
Rencana Pembangunan Jangka Menengah Nasional
Rencana Pembangunan Jangka Panjang Nasional
Rusunawa Rumah Susun Sewa
Sakernas Survei Tenagakerja Nasional
Sekolah Dasar
SDKI
SKRT Survei Kesehatan Rumah Tangga
SMA Sekolah Menengah Atas
SMP Sekolah Menengah Pertama
Sanitasi Total Berbasis Masyarakat
Susenas Survei Sosial Ekonomi Nasional
Upah Minimum Regional

1
Introduction
Achievement of the MDG Targets
MDG 1
MDG 3 -
MDG 6 -
MDG 1 -

2
MDG 2
MDG 3 - SMA/MA/
MDG 4
MDG 8
MDG 1 -
MDG 5 -
MDG 6 -
MDG 7 -

3
BPS
4

5
Summary by Goal
MDG 1: ERADICATE EXTREME POVERTY AND HUNGER
1
MDG 2: ACHIEVE UNIVERSAL PRIMARY EDUCATION
aims to go beyond the MDG education target for primaryeducation by expanding the target to junior secondary education (SMP andmadrasah tsanawiyah-MTs, grades 7 to 9) to the universal basic educationtargets. In 2008/09 gross enrolment rate (GER) at primary education level (SD/
MI/Package A) was 116.77 percent and the nett enrolment rate (NER) was 95.23 percent.At the primary education level, disparity in education participation among provinces has
challenge in acelerating the achievment of MDG education target is improving equalaccess of children, girls and boys, to quality basic education.
2

6
MDG 3: PROMOTE GENDER EQUALITY AND EMPOWER WOMEN
MDG 4: REDUCE CHILD MORTALITY
3
4
MDG 5: IMPROVE MATERNAL HEALTH
5
7
MDG 6: COMBAT HIV/AIDS, MALARIA AND OTHER DISEASES
6
MDG 7: ENSURE ENVIRONMENTAL SUSTAINABILITY
7
MDG 8: BUILDING GLOBAL PARTNERSHIP FOR DEVELOPMENT
8

8

9
Overview of Status of MDGs Targets
Status: Already achieved On-track Need special attention
Indicators Baseline CurrentMDGsTarget2015
Status Source
GOAL 1. ERADICATE EXTREME POVERTY AND HUNGER
BPS
BPS Susenas
BPS
BPS
BPS Susenas
Riskesdas
BPS Susenas
GOAL 2: ACHIEVE UNIVERSAL PRIMARY EDUCATION
BPS Susenas
BPS Susenas
BPS Susenas
GOAL 3: PROMOTE GENDER EQUALITY AND EMPOWER WOMEN

10
Status: Already achieved On-track Need special attention
Indicators Baseline CurrentMDGsTarget2015
Status Source
BPS Susenas
BPS
KPU
GOAL 4: REDUCE CHILD MORTALITY
BPS
BPS Riskesdas
GOAL 5: IMPROVE MATERNAL HEALTH
BPS
BPS Susenas
BPS
GOAL 6: COMBAT HIV/AIDS, MALARIA AND OTHER DISEASES

11
Status: Already achieved On-track Need special attention
Indicators Baseline CurrentMDGsTarget2015
Status Source
BPS
Female:Male:
Female:Male:
BPSRiskesdas
FemaleMale:
FemaleMale:
BPSRiskesdas
Riskesdas
BPSRiskesdas
Riskesdas
Riskesdas

12
Status: Already achieved On-track Need special attention
Indicators Baseline CurrentMDGsTarget2015
Status Source
GOAL 7: ENSURE ENVIRONMENTAL SUSTAINABILITY
Ministry of
Ministry of
Ministry of
Ministry of
Ministry of
BPS Susenas
BPS Susenas
GOAL 8: DEVELOP A GLOBAL PARTNERSHIP FOR DEVELOPMENT
13
Status: Already achieved On-track Need special attention
Indicators Baseline CurrentMDGsTarget2015
Status Source
BPS
Ministry of
BPS Susenas
BPS Susenas

14

GOAL 1 : ERADICATE EXTREMEPOVERTY AND HUNGER
PNPM Mandiri-Rural (infrastructure) by World Bank

16

17
1 GOAL 1: ERADICATE EXTREME POVERTYAND HUNGER
TARGET 1A: HALVE, BETWEEN 1990 AND 2015, THE PROPORTION
A DAY
Indicators Baseline CurrentMDGsTarget2015
Status Source
Goal 1. Eradicate Extreme Poverty and Hunger
BPS
BPS Susenas
Status:
BPS
of poverty has generally trended downwards.
Figure 1.2
There has been an improvement in the level of welfare of those below the poverty line.

18
25
.Progress in
reducing extremepoverty (USD 1/
capita/day) as compared to the
MDG target
Perc
enta
ge20
15
10
5
:BPS, Susenas 0
(several years) and the World Bank
2008.
20.6
14.8
7.8
9.9
12.0
9.9
9.2
7.2
6.6 7.
4
6.0
8.5
6.7
5.9
10.3
1990
1993
1996
1998
1999
2000
2001
2002
2003
2004
2005
2006
2007
2008
2009
2010
2011
2012
2013
2014
2015
incidence of povertyhas been supported by
Empowerment Program
has been implemented inall sub-districts in 2009 insynergy with other poverty
three clusters, improveddata on the poor and the
Kredit Usaha Rakyat – KUR
it is
.
Indonesia.Figure 1.3

19
0
10
20
30
40
Na�onal average 2010
Perc
enta
ge
Number of poor popula�on % Below The Na�onal Poverty Line years).
36.8
-
60
50
1976
1978
1980
1981
1984
1987
1990
1993
1996
1998
*
1999
2000
2001
2002
2003
2004
2005
2006
2007
2008
2009
2010
54.2
47.2
42.3
40.6
35.0
30.0
27.2
25.9
22.5
49.5
48.0
38.7
37.9
38.4
37.3
36.1
35.1 39
.3
37.2
35.0
32.5
31.0
40.1
33.3
28.6
26.9
21.6
17.4
15.1
13.7
11.3
24.2
23.4
19.1
18.4
18.2
17.4
16.7
16.0 17
.8
16.6
15.4
14.2
13.3
Indonesiameasured using the indicator for
trends in povertyLong-term
5
10
40
35
30
25
20
15
DKIJ
akar
taBa
liKa
liman
tan
Sela
tan
Bang
kaBe
litun
gKa
liman
tan
Teng
ahBa
nten
Kalim
anta
nTi
mur
Kepu
laua
nRi
auJa
mbi
Riau
Kalim
anta
nBa
rat
Sula
wes
iUta
raM
aluk
uU
tara
Sum
ater
aBa
rat
Jaw
aBa
rat
Sum
ater
aU
tara
Sula
wes
iSel
atan
INDO
NES
IASu
law
esiB
arat
Jaw
aTi
mur
Sum
ater
aSe
lata
nJa
wa
Teng
ahDI
Yogy
akar
taSu
law
esiT
engg
ara
Sula
wes
iTen
gah
Beng
kulu
Lam
pung
Aceh
Nus
aTe
ngga
raBa
rat
Nus
aTe
ngga
raTi
mur
Gor
onta
loM
aluk
uPa
pua
Bara
tPa
pua
3.5 4.
9 5.2 6.
56.
8 7.2 8.1
8.3
8.7 9.0
9.1
9.4
9.5 11
.311
.311
.6
7.7
13.3
13.6 15
.315
.5 16.6
16.8
17.1 18
.118
.318
.9 21.0
21.6 23
.023
.227
.734
.9
poverty line by province of Indonesia, 2010
BPS, Susenas
Percentages of
Line, 1976-2010
BPS, Susenas (several

20
Box 1.1.In the District of SIKKA: Those who Celebrate, Gambleand Are Lazy Are Not Considered to Be Poor
The district government of Sikka in East Nusa Tenggara (NTT) has a special approach toencourage the poor in the region to work harder to emerge from poverty. The Head ofthe local government in Sikka, Sosimus Mitang, has established a rule that anyone whoengages in celebrations more than twice a year, those who gamble and allow their farmland to go fallow, will not be classified as poor. Revocation of the status of poor would makethem lose their right to obtain assistance from various aid schemes for the poor such asdirect cash assistance, rice subsidies for the poor and conditional cash transfers. The localrules have been in effect since last year and have encouraged the poor to not only rely onsupport from the government but also to take initiative to be self-reliant.
To encourage underprivileged communities to engage in business activities, the localgovernment in Sikka will also implement a “rice for work” program. Based on a localdecision, rice from Raskin will not be shared at the subsidized price of Rp 1,600 perkilogram, but recipients will be required to work, for example, to participate in buildingvillage infrastructure. The motto of Sikka Regency , namely: “Let us build the village of Sikkato be a village of conscience”, seems to relate directly to the local policies that have beenestablished.
The local government has also adopted the method of Pro-Poor Planning, Budgeting,Monitoring and Evaluation to improve the quality of local programs and budgets. Qualityimprovement and changes in priorities in the budget allocation is reflected by the increasein Sikka district budget allocations for programs that support achievement of the MDGsin the 2010-2011 budget to more than 67 percent, especially for poverty reduction (22.8percent), improvement of education (21.07 percent) and health improvement (19.55percent).
1. Improving the business climate to be more conducive at the local level

21
3. Increasing access of the poor to basic needs and services
to economic and social shocks
stakeholders to work to reduce poverty.
JamkesnasRaskin
TKPKD
22
the achievement of the Millennium Development Goals in 2015 through provision of
poverty.
Bappenas

23
TARGET 1B: ACHIEVE FULL AND PRODUCTIVE EMPLOYMENT ANDDECENT WORK FOR ALL, INCLUDING WOMEN ANDYOUNG PEOPLE
Indicators Baseline CurrentMDGsTarget2015
Status Source
Goal 1. Eradicate Extreme Poverty and Hunger
BPS,Sakernas
BPS, Sakernas
Status:
percent.
Figure1.4
Figure 1.5

24
20%
Growth rate of
(percentage),1990, 1993, 1996, 1999, 2000-2009
BPS, Sakernas and
(computed), 1990, 1993, 1996, 1999,
2000-2009
The
grow
thra
teof
labo
rpr
oduc
�vity
(%)
15%
10%
5%
0%
-5%
-10%
-15%
1990
1993
1996
1999
2000
2001
2002
2003
2004
2005
2006
2007
2008
2009
1990
1991
1996
1997
Agriculture Industry Services Total
2000
80%20
0170%
60%
50%
40%
30%
to working age 20%
10%2010Ag
u-08
0%Ag
u-09BPS, Sakernas
(computed), 1990-2010
1992
1993
1994
1998
1999
2002
2003
2004
Nov-
05
Agu-
06
Agu-
07
EPR - Urban EPR - Rural EPR Total
decline from 65 percent to 62 percent.
declined between 1990 and 2010.
Figure 1.6

25
BengkuluNusa Tenggara Timur
BaliKalimantan Tengah
Di YogyakartaKalimantan Barat
PapuaJawa Tengah
Sulawesi TenggaraLampung
Nusa Tenggara BaratKalimantan Selatan
Jawa TimurAceh
Sulawesi TengahJambi
Sumatera SelatanINDONESIA
Kalimantan TimurSumatera BaratSulawesi Utara
Jawa BaratRiau
MalukuSulawesi Selatan
Dki JakartaSulawesi Barat 0.69
Papua Barat 0.65Gorontalo 0.65
Bangka Belitung 0.63Kepulauan Riau 0.60
Maluku Utara 0.59Banten 0.55
1990 1999 February 2010
approximately 55 percent to 65 percent Figure 1.7
0.700.700.700.700.700.700.740.740.770.79
0.650.660.690.720.680.670.680.740.710.72
0.650.680.640.760.710.670.710.740.730.71
0.480.550.570.580.590.620.620.630.650.650.650.660.660.670.680.69
0.510.560.640.570.560.560.610.580.630.660.640.670.570.660.710.71
0.590.570.610.590.560.560.610.600.630.660.640.690.570.660.670.65
Employment to
by province, 1990, 1999 and 2010
BPS, Sakernas(computed), 1990, 1999 and 2010.

26
9080 71.57 71.55 70.21
Perc
enta
ge706050403020100
54.7661.20 64.82
Urban Rural Urban Rural Urban Rural
1990 1999 February 2010
Workforce
(percentage) byregion, 1990, 1999
and 2010
BPS, Sakernas(computed), 1990,
1999 and 2010
Figure 1.8
50
45
40
35
Urban Rural Urban Rural Urban Rural
1990 1999 February 2010
Uneducated Uncomplete primary school Primary schoolJunior secondary Senior secondary Voca�onal seniorsecondaryDiploma University
Perc
enta
ge
30
25
20
15
workers based 10
on their latest 5
0region, 1990, 1999
and 2010
BPS, Sakernas(computed), 1990,
1999 and 2010

27
Figure 1.9
90%
80%
70%
60%
50%
40%
30%
20%
10%
0%
Male- Female Urban Rural Total
1990
1991
1992
1993
1996
1997
1998
1999
2000
2001
2002
2003
2004
Nov-
05
Aug-
06
Aug-
07
Aug-
08
Aug-
09
Feb-
10
vulnerable workersto total workers,1990-2010
BPS, Sakernas(computed), 1990-2010
workers accordingto job status,February 2010
BPS, Sakernas(computed), 2010

28
employment.
are challenges.
Upah Minimum Regional
and Business Expansion.
6. Developing Social Security and Empowering Workers.

29
TARGET 1C: HALVE, BETWEEN 1990 AND 2015, THE PROPORTIONOF PEOPLE WHO SUFFER FROM HUNGER
Indicators Baseline CurrentMDGsTarget2015
Status Source
GOAL 1. Eradicate Extreme Poverty and Hunger
BPS Susenas
Riskesdas
BPS Susenas
Status:
past two decades.
RiskesdasRiskesdas
Figure 1.11RPJMN
Riskesdas

30
The prevalenceof underweight
years of age byprovince (2007)
MOH, Riskesdas 2007
40Trend in the
prevalence of underweight
children under 30
(1989-2010) using the WHO 2005
10
BPS, Susenas 1989 to2005 and Riskesdas
2007 and 2010to 02005 and Riskesdas
2007 and 2010
15
Moderate Severe Malnourished
40
35
30
25
20
Severely Underweight Moderately Underweight Total Underweight
15.5
standard and the MDG Target forthis indicator in
2015
11.910
53.6
0
10.9
11.4 12.4
12.9 15
.015
.816
.0Su
law
esiU
tara
16.6
16.7
Beng
kulu
17.4
17.5
Lam
pung
17.6
18.2
Sum
ater
aSe
lata
n18
.318
.4IN
DO
NES
IA18
.919
.3Ka
liman
tan
Tim
ur20
.2 21.2
Papu
a21
.4 22.5
Kalim
anta
nBa
rat
22.7
22.7
Sum
ater
aU
tara
22.8
23.2
Papu
aBa
rat
24.2
24.8
Nus
aTe
ngga
raBa
rat
25.4
25.4
Sula
wes
iBar
at26
.526
.6Ka
liman
tan
Sela
tan
27.6
27.8
Mal
uku
33.6
DIY
ogya
kart
aBa
liKe
pula
uan
Riau
DKI
Jaka
rta
Jaw
aBa
rat
Jaw
aTe
ngah
Bant
en
Jaw
aTi
mur
Sula
wes
iSel
atan
Bang
kaBe
litun
g
Jam
bi
Sum
ater
aBa
rat
Riau
Sula
wes
iTen
ggar
a
Mal
uku
Uta
ra
Kalim
anta
nTe
ngah
Gor
onta
lo
Ace
h
Sula
wes
iTen
gah
Nus
aTe
ngga
raTi
mur
TARGET2015
Pers
enta
se 20
1989
23.8
21.7
15.4
14.8
13.9
13.2
15.0
14.6
14.5
14.8
13.0
13.0
7.2
8.1
12.3
11.3
8.9
8.4
6.8
8.6
8.7
9.7
5.4
4.9
31.0 29.827.7
26.1
22.8 21.6 21.823.2 23.2
24.5
18.4 17.915.5
2015
Target MDG2015
1992
1995
1998
1999
2000
2001
2002
2003
2005
2007
2010
2011
2013

31
Underweightprevalence among
years of age byrural and urban areas of Indonesia (2007))
5.4 13 18.4 MOH, Riskesdas 2007
high. Susenas
kadarzi
2.0502.038
2.040
2.030
2.020 2.0152.0072.010
2.000
1.990 1.986
1.980
1.970
1.960
1.950
Kcal
/cap
ita/D
ay
2002 2005 2007 2008
Trends in the average calorie
rural and urban households (2002-2009)
BPS, Susenas, various years
32
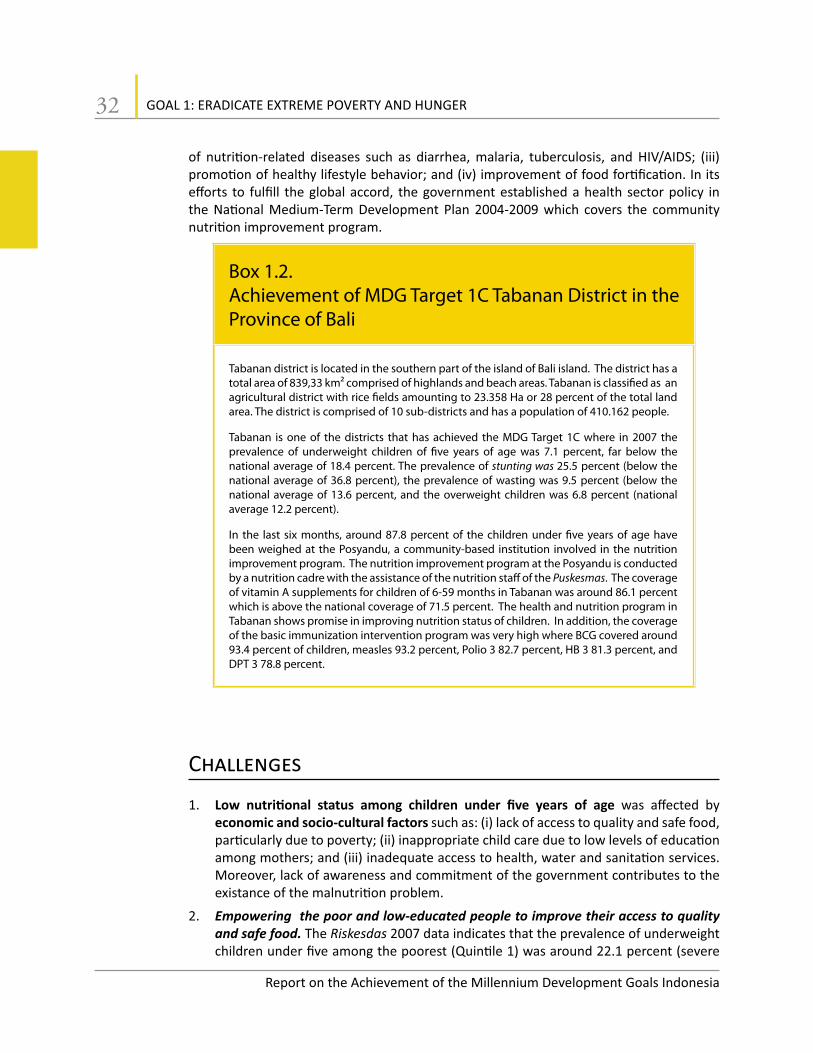
Box 1.2. Achievement of MDG Target 1C Tabanan District in theProvince of Bali
Tabanan district is located in the southern part of the island of Bali island. The district has atotal area of 839,33 km² comprised of highlands and beach areas. Tabanan is classified as anagricultural district with rice fields amounting to 23.358 Ha or 28 percent of the total landarea. The district is comprised of 10 sub-districts and has a population of 410.162 people.
Tabanan is one of the districts that has achieved the MDG Target 1C where in 2007 theprevalence of underweight children of five years of age was 7.1 percent, far below thenational average of 18.4 percent. The prevalence of stunting was 25.5 percent (below thenational average of 36.8 percent), the prevalence of wasting was 9.5 percent (below thenational average of 13.6 percent, and the overweight children was 6.8 percent (nationalaverage 12.2 percent).
In the last six months, around 87.8 percent of the children under five years of age havebeen weighed at the Posyandu, a community-based institution involved in the nutritionimprovement program. The nutrition improvement program at the Posyandu is conductedby a nutrition cadre with the assistance of the nutrition staff of the Puskesmas. The coverageof vitamin A supplements for children of 6-59 months in Tabanan was around 86.1 percentwhich is above the national coverage of 71.5 percent. The health and nutrition program inTabanan shows promise in improving nutrition status of children. In addition, the coverageof the basic immunization intervention program was very high where BCG covered around93.4 percent of children, measles 93.2 percent, Polio 3 82.7 percent, HB 3 81.3 percent, andDPT 3 78.8 percent.
economic and socio-cultural factors
Riskesdas

33
.Susenas
PPH: Pola Pangan Harapan
PPHPPH score of 100 Figure 1.14 .
88.0 85.986.0
83.684.0 81.9
80.8 81.282.0
80.0
78.0
76.0 75.0
74.0
72.0
70.0
68.0
2002 2005 2007
77.677.579.1
Rural Urban Indonesia
PPH
scor
e Trend in the desirable dietary
score of food
rural and urban households, 2002-2007
BPS, Susenas, various years
PosyanduPosyandu
.

34
PosyanduPAUD

GOAL 2 : ACHIEVE UNIVERSALPRIMARY EDUCATION
Future Vision by World Bank

36

37
2 GOAL 2: ACHIEVE UNIVERSAL PRIMARYEDUCATION
TARGET 2A: ENSURE THAT, BY 2015, CHILDREN EVERYWHERE, BOYSAND GIRLS ALIKE, WILL BE ABLE TO COMPLETE A FULLCOURSE OF PRIMARY SCHOOLING
Indicators Baseline Current MDGs Target2015 Status Source
Status:
management.
A

38
SD/MI
SMP madrasahtsanawiyah MTs SMP/MTs Package B
SD/MI
120
100
.Trends for Net 80
Enrolment Ratesfor primary and
junior secondary
levels (including Madrasah)
Pers
enta
se
60
40
20
:BPS, Susenas and 0
9 years Wajar Dikdas
Crisis "big bang"Decentraliza�on
BOS Programand Scholarship
1992
1993
1994
1995
1996
1997
1998
1999
2000
2001
2002
2003
2004
2005
2006
2007
2008
2009
APM-SD/MI APK-SD/MI APM-SMP/MTs APK-SMP/MTs
The early entry phenomenon which has occured in the last several years has contributed

39
progress. Susenas
Perc
enta
ge
100
90
80
70
60
50
40
30
20
10
01 2 3 4 5 6 PS 7 8 9 Junior Secondary 10
93.0
87.8 75.7
ComplePrimary Sc
tionhool 46.7
Junior Secondary
1995 2000 2006Complet
Schoolion
2007 2008
SchoolComple�on Comple�on
Susenas
Susenas
There is no disparity among provinces in the literacy rate of 15-24 year olds
Trend of highest
16-18 years old, 1995-2008
BPS, Susenas 1995, 2000, 2006, 2007, 2008.

40
.NER of primary
)by province, 2009
BPS and MONE, Susenas 2008/09.
2.5
Dana Alokasi Khusus DAK
0
95.23100
80
60
BPS, Susenas
1992
1993
1994
1995
1996
1997
1998
1999
2000
2001
2002
2003
2004
2005
2006
2007
2008
2009
96.70
97.2297.72
97.61
97.77
98.15
98.35
98.42
98.44
98.2798.66
98.55
98.71
98.74
98.76
98.84 99.46
99.47
95
96
97
98
99
100
Pece
ntag
e
Trend of literacyrate among
15-24 years, 1992-2009
Aceh
Kalim
anta
nTe
ngah
Jaw
aTe
ngah
Riau
Jaw
aTi
mur
INDO
NES
IAJa
mbi
Bali
Beng
kulu
Lam
pung
Sum
ater
aBa
rat
Nus
aTe
ngga
raBa
rat
Sula
wes
iTen
ggar
aJa
wa
Bara
tKa
liman
tan
Sela
tan
Sum
ater
aU
tara
Mal
uku
DIYo
gyak
arta
DKIJ
akar
taBa
nten
Kalim
anta
nBa
rat
Kepu
laua
nRi
auKa
liman
tan
Tim
urSu
mat
era
Sela
tan
Mal
uku
Uta
raSu
law
esiT
enga
hSu
law
esiB
arat
Bang
kaBe
litun
gN
usa
Teng
gara
Tim
urSu
law
esiS
elat
anSu
law
esiU
tara
Papu
aBa
rat
Gor
onta
loPa
pua
Perc
enta
ge
40
20

41
10099.47
80
60
40
0
20
The literacy
Pece
ntag
e
DIYo
gyak
arta
DKIJ
akar
taJa
mbi
Riau
Bant
enLa
mpu
ngSu
mat
era
Sela
tan
Kepu
laua
nRi
auAc
ehSu
law
esiT
enga
hJa
wa
Bara
tBe
ngku
luKa
liman
tan
Teng
ahSu
mat
era
Uta
raKa
liman
tan
Tim
urSu
law
esiU
tara
Kalim
anta
nSe
lata
nM
aluk
uJa
wa
Teng
ahSu
mat
era
Bara
tM
aluk
uU
tara
Bang
kaBe
litun
gIN
DON
ESIA
Jaw
aTi
mur
Sula
wes
iTen
ggar
aKa
liman
tan
Bara
tBa
liG
oron
talo
Nus
aTe
ngga
raBa
rat
Sula
wes
iSel
atan
Nus
aTe
ngga
raTi
mur
Sula
wes
iBar
atPa
pua
Bara
tPa
pua rate among the
15-24 years, 2009
BPS, Susenas
DAKDAK
funding directly to schools to reduce the burden of
SD/MI SMP/MTsBOS
BOSof BOS BOS
SD SMPMI MTs
:
of BSM BSM
SD/MI

42
”
Source: Summary Report AIBEP School and District Survey, 2009-2010
1. Reaching the unreached is a major challenge in achieving the MDG target of 100

43
Number of Teachers
Diploma1-3 / S1 Total Senior
SS
Diploma1-3 / S1 Total
Number and
of teachersby academic
school levels for
.
Taman Kanak-Kanak/TK)
Table 2.1
TK Indonesia (2009),not including
SD/MI madrasah teachers
SMP/MT
DirectorateSMA/ General of Quality
SMK/MA Improvementof Teachers and
535,601 961,120 1,110,590 2,607,311 20.54 36.88 46.60 100MONE, 2010
meet the minimum standards.Not all schools provide text books
80%
SD/MI 60%
-34%-21%
-37%
-66%
55%68%
52%
17%
Total Urban Rural Remote /Isolated Areas
Excess Shortage
40% Teacher20%
5. Improving the coverage 0% urban, rural, and-20% remote areas
of Indonesia, 2007/2008
-40%
the drop-out students -60%
and for children who -80%
are not able to enrollIndicators in in formal schooling.Indonesia 2007/2008
44
system.
and.
of .BOS
BOS
underserved areas.
45
dropouts.
1. Improving Quality and Relevance:
Accelerate improvements in pre-service and in-service teacher training provision.
Lembaga Pendidikan Tenaga Kependidikan/LPTKs)
school principals and supervisors.

46

GOAL 3 : PROMOTE GENDEREQUALITY AND EMPOWERWOMEN
by ADB

48

49
3 GOAL 3: PROMOTE GENDER EQUALITY ANDEMPOWER WOMEN
TARGET 3A: ELIMINATE GENDER DISPARITY IN PRIMARY ANDSECONDARY EDUCATION, PREFERABLY BY 2005, ANDIN ALL LEVELS OF EDUCATION NO LATER THAN 2015
Indicators Baseline CurrentMDGsTarget2015
Status Source
than 2015
Status:
GPI.
Susenas

50
.Gender Parity
Index (GPI) of NetEnrolment Rates
(NER) for primary(SD/MI/Package
A) and junior secondary schoolsl
(SMP/MTs/PackageB) by province,
2009
:BPS, Susenas 2009
.Gender ParityIndex (GPI) of
Net EnrolmentRates (NER) senior secondary schools by province, 2009
:BPS, Susenas 2009
SD/MI/SMP/MT
SM/MA
Susenas

51
age group has been acihieved.
theopen unemployment rate of females had declined
Sakernas
KPU
Dewan Perwakilan Rakyat-DPR Dewan PerwakilanDaerah-DPD Dewan Perwakilan RakyatDaerah-DPRD

52
Box 3.1. Overview of MDGs achievement in disaster andconflict areas: The case of Aceh
The results of a survey of households performed by KAPAL Perempuan in three relocatedvillages in 2008 in the district of Aceh Besar, namely Kampung Persabahatan, DesaLambaed and Desa Cot Preh, showed that: (i) average household expenditures weregreater than household incomes; (ii) most households spent money to buy drinking water(58.4 percent) due to a scarcity of improved water sources; (iii) almost all of the facilities atthe relocated villages, including school buildings (elementary and junior high school) andauxiliary health centers (puskesmas pembantu/PUSTU), could not be used due to a lack ofteachers, medical personnel (including midwives) and supporting equipment; and (iv)other public facilities, such as markets, were not yet functional at the time of the survey.These conditions influenced the level of poverty, health and education of the refugeeswho had been relocated permanently to the three villages.
In that context, KAPAL Perempuan has worked to improve leadership, education as wellas economic and political participation of women in the three relocated villages. Theorganization facilitates leadership education for women while assisting to developwomen’s economic resources through establishment of savings and loan groups andviable business activities. Eight savings and loan groups were established which thenjoined into an association called “Beudoh Beusareh”, meaning “Rising Together”. Thesewomen’s groups have been able to accumulate savings and loan capital. They have alsomanaged to integrate their priorities into the agenda of the Village Development Plan(Musrenbangdes), which provides assistance to improve the availability of midwives andeducation for women. Slowly but surely, these women’s groups have assumed the roleof initiator for change in their villages, which is one condition for the achievement ofMDGs in areas affected by conflict and disaster. Women’s participation has become adriving force behind the improvement of public welfare. (Written by KAPAL Perempuan,a women’s organization that focuses on the issues of alternative education, gender andpluralism
poverty. not only improving the NER of females but also for males
for women and men in employment and in the job place.
Law enforcement

53
needs to be strengthened
work in the informal sector
regions and among socio-economic groups
2. In employment:
54
4. A strategy to implement gender mainstreaming in local governance processes will becarried out
55
Box 3.2. The Acceleration of Gender MainstreamingImplementation in Indonesia
(PengarusutamaanGender/PUG)
Bappenas
anggaran responsif genderRPJMN
PMK
Pendidikan Keluarga Berwawasan Gender/

56
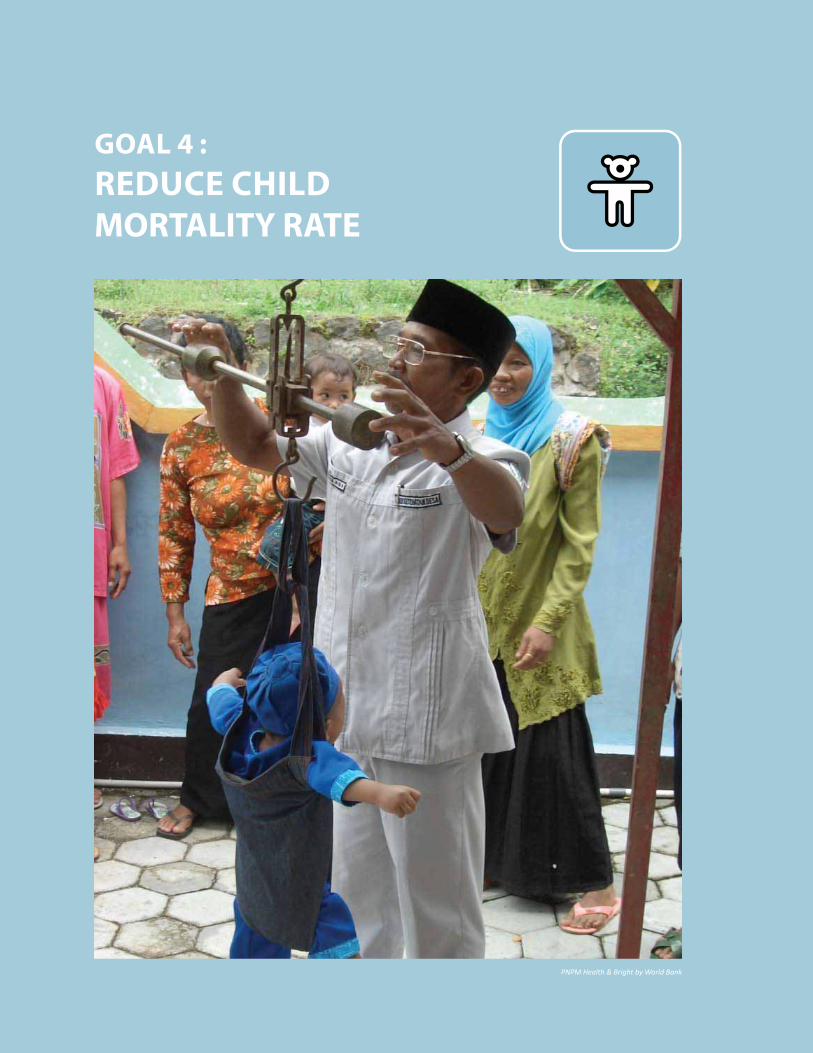
GOAL 4 : REDUCE CHILDMORTALITY RATE
PNPM Health & Bright by World Bank

58

59
4 GOAL 4:REDUCE CHILD MORTALITY RATE
TARGET 4A:
Indicators Baseline CurrentMDGsTarget2015
Status Source
Goal 4: Reduce Child Mortality
Status:
.
Figure 4.1
Child, Infant and Neonatal MortalityRates, 1991-2015
BPS, IDHS severalyears

60
as social and economic status remain major problems
Most of child, infant and neonatal mortality causes are preventable
increase.
average
Figure 4.2Riskesdas
.
year-old children immunized against
measles, byprovince 2007
:BPS, IDHS 2007.
61
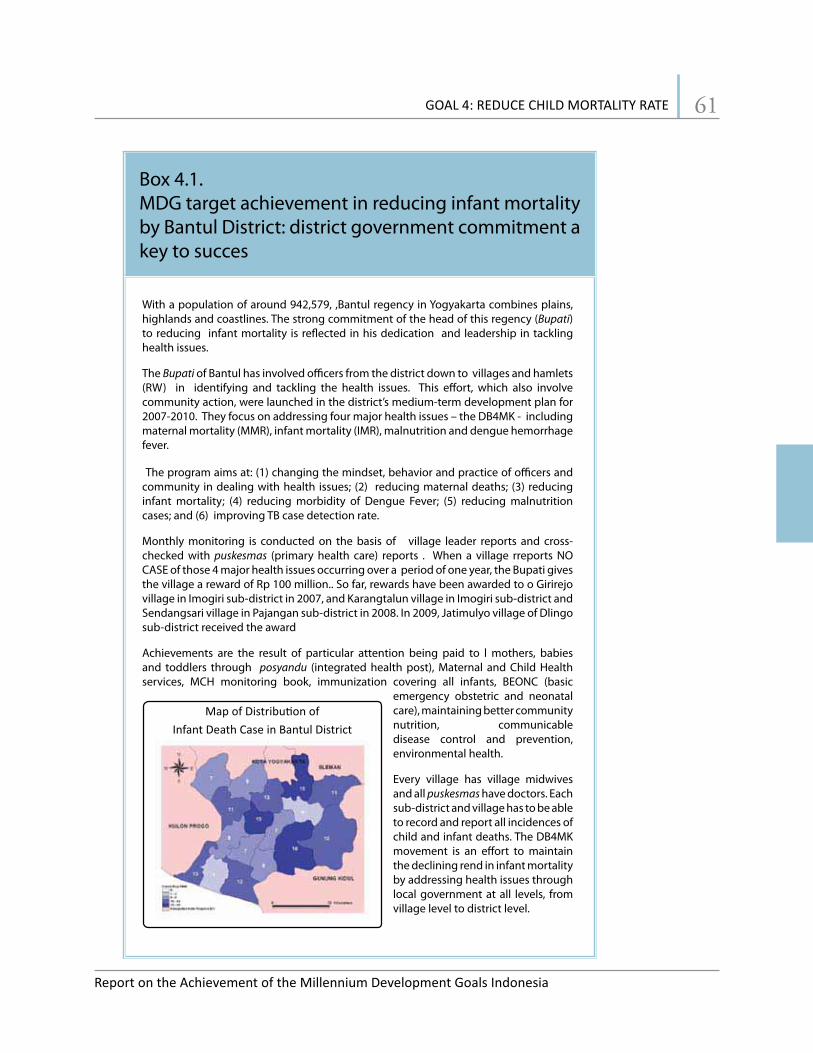
Box 4.1. MDG target achievement in reducing infant mortalityby Bantul District: district government commitment akey to succes
With a population of around 942,579, ,Bantul regency in Yogyakarta combines plains,highlands and coastlines. The strong commitment of the head of this regency (Bupati)to reducing infant mortality is reflected in his dedication and leadership in tacklinghealth issues.
The Bupati of Bantul has involved officers from the district down to villages and hamlets(RW) in identifying and tackling the health issues. This effort, which also involvecommunity action, were launched in the district’s medium-term development plan for2007-2010. They focus on addressing four major health issues – the DB4MK - includingmaternal mortality (MMR), infant mortality (IMR), malnutrition and dengue hemorrhagefever.
The program aims at: (1) changing the mindset, behavior and practice of officers andcommunity in dealing with health issues; (2) reducing maternal deaths; (3) reducinginfant mortality; (4) reducing morbidity of Dengue Fever; (5) reducing malnutritioncases; and (6) improving TB case detection rate.
Monthly monitoring is conducted on the basis of village leader reports and cross-checked with puskesmas (primary health care) reports . When a village rreports NOCASE of those 4 major health issues occurring over a period of one year, the Bupati givesthe village a reward of Rp 100 million.. So far, rewards have been awarded to o Girirejovillage in Imogiri sub-district in 2007, and Karangtalun village in Imogiri sub-district andSendangsari village in Pajangan sub-district in 2008. In 2009, Jatimulyo village of Dlingosub-district received the award
Achievements are the result of particular attention being paid to l mothers, babiesand toddlers through posyandu (integrated health post), Maternal and Child Healthservices, MCH monitoring book, immunization covering all infants, BEONC (basic
emergency obstetric and neonatalcare), maintaining better communitynutrition, communicabledisease control and prevention,environmental health.
Every village has village midwivesand allpuskesmashave doctors. Eachsub-district and village has to be ableto record and report all incidences ofchild and infant deaths. The DB4MKmovement is an effort to maintainthe declining rend in infant mortalityby addressing health issues throughlocal government at all levels, fromvillage level to district level.

62
monitoring,
6. Persistent low access to proper health services
Riskesdas
and covers:
child growth
4. Developing strategies at family level

63
6. Improving Newborn care and Maternal Health
.
9. Enhancing policy advocacy
to accelerate achievement of targets for child,infant and neonatal mortality.
64

GOAL 5 : IMPROVE MATERNALHEALTH
Puskesmas: The “spearhead” of health service by World Bank

66

67
5 GOAL 5:IMPROVE MATERNAL HEALTH
TARGET 5A:2015, THE MATERNAL MORTALITY RATIO
TARGET 5B: ACHIEVE, BY 2015, UNIVERSAL ACCESS TOREPRODUCTIVE HEALTH
Indicators Baseline CurrentMDGsTarget2015
Status Source
Goal 5: Improve Maternal Health
Status:
Figure 5.1

68
.
for the Maternal
1991-2025
:BPS, IDHS several
years.
Percentage of births assisted by
skilled provider, byprovinces , 2009
BPS, Susenas 2009
provider. Susenas
Riskesdas
Disparity in births assisted by skilled personnel among regions remains a major problemSusenas
Figure 5.2

69
Riskesdas
Antenatal care is crucial in ensuring the mothers are healthy during pregnancy and in
Ninety-three percent of women receive antenatal care from a health professional during
health targets
First and fourthantenatal visits, in Indonesia, 1991-2007
BPS, IDHS severalyears.

70
Trend of CPR in married women
aged 15-49, 1991-2007
BPS, IDHS 2007
Figure 5.5
Prevalence Rateby method, byprovince, 2007
BPS, IDHS 2007

71
Figure 5.6
Unmet needs, Indonesia 1991-2007
BPS, IDHS 1991, 1994, 1997, 2002/2003, 2007.
Unmet need varies greatly among provinces, regions and socio-economic status.

72
Unmet need byintended purposes
by province,Indonesia 2007
BPS, IDHS 2007
15-19 by province,2007
BPS, IDHS 2007
100908070605040302010
0
7
11 14
19
23 25 25 25 27 30 31 31 33 34 34 34 34 36 39 40 41 43 44 47 48 51 54 54 57 60 61
82
92
DIYo
gyak
arta
DKIJ
akar
taSu
mat
era
Bara
tSu
mat
era
Uta
raBa
nten
Riau
Sum
ater
aSe
lata
nKe
pula
uan
Riau
Jaw
aTe
ngah
Jam
biN
usa
Teng
gara
Tim
urM
aluk
uAc
ehKa
liman
tan
Teng
ahKa
liman
tan
Tim
urSu
law
esiU
tara
Sula
wes
iSel
atan
Jaw
aBa
rat
Lam
pung
Papu
aKa
liman
tan
Bara
tBa
liBe
ngku
luSu
law
esiB
arat
Sula
wes
iTen
ggar
aPa
pua
Bara
tJa
wa
Tim
urKa
liman
tan
Sela
tan
Bang
kaBe
litun
gN
usa
Teng
gara
Bara
tG
oron
talo
Mal
uku
Uta
raSu
law
esiT
enga
h
Nasional

73
from 67 births per
Puskesmas in
puskesmas

74
Riskesdas
of maternal deaths is not robust.

75
, BEONC, CEONC,
2. increasing access to family planning services,
pursued through a series of strategies, among others:
Source:
4. strengthening the referral system

76
7. Increasing the availability of health workers
8. Raising awareness about safe motherhood at the community and household level
10. Providing an enabling environment to support management and
Minimum Services Standards MMSs
GOAL 6 :COMBAT HIV/AIDS,MALARIA AND OTHERDISEASES
Campaign of HIV/AIDS Care by Antara
78

79
6 GOAL 6: COMBAT HIV/AIDS, MALARIA ANDOTHER DISEASES
TARGET 6A: HAVE HALTED BY 2015 AND BEGUN TO REVERSE THESPREAD OF HIV/AIDS
TARGET 6B: ACHIEVE, BY 2010, UNIVERSAL ACCESS TO TREATMENTFOR HIV/AIDS FOR ALL THOSE WHO NEED IT
Indicators Baseline CurrentMDGsTarget2015
Status Source
Goal 6: Combat HIV/AIDS, Malaria and Other Diseases
Status:

80
Number of AIDS 4.000cases in Indonesia, 3.500
3.000by province, 2009 2.5002.0001.500
DG of CDC and EH, 1.000MoH, 2009 500
-
Number of AIDS Cases Cumula�ve AIDS Cases
4.500
1998
2009
21 27 43 58 91 117
119
138
144
165
173
192
219
290
318
330
333
475
485
591
717
794
1,61
52,
808
2,82
83,
227
3,59
8
Sula
wes
iTen
ggar
aKa
liman
tan
Sela
tan
Aceh
Papu
aBa
rat
Beng
kulu
Bang
kaBe
litun
gNu
saTe
ngga
raBa
rat
Nusa
Teng
gara
Tim
urLa
mpu
ngJa
mbi
Sula
wes
iUta
raM
aluk
u
Kalim
anta
nBa
rat
Bali
Papu
aDK
IJak
arta
Jaw
aTi
mur
Jaw
aBa
rat
20,00018,00016,00014,00012,000
AIDS casesper 100,000 10,000
8,000Indonesia, 1989- 6,000
2009 4,0002,000
DG of CDC and -EH, MoH, several
years.
it was more than double the number in 2006, when AIDS cases totaled 8,194 Figure6.1
Figure 6.2
Modes of HIV/AIDS transmission as of December 2009 are indicated in Figure 6.3
Sula
wes
iBar
atGo
ront
alo
Mal
uku
Utar
aKa
liman
tan
Tim
urSu
law
esiT
enga
hKa
liman
tan
Teng
ah
0 3 10 11 12 21
1987
1988
1989
1990
1991
1992
1993
1994
1995
1996
1997
Sum
ater
aSe
lata
n19
99DI
Yogy
akar
taBa
nten
2000
2001
316 1,19
52,
639
2,87
32,
947 4,96
93,
863
1,1712,682
5,321
8,194
11,141
16,110
19,973
Sum
ater
aBa
rat
Kepu
laua
nRi
auRi
au20
0220
03Su
mat
era
Utar
aSu
law
esiS
elat
anJa
wa
Teng
ah20
0420
0520
0620
0720
08

81
Another related factor in HIV/AIDS transmission is the absence of condom use duringBlood
transfussion, 0.1Unknown, 4.4%%Perinatal, 2.6%
MSM , 3.3%
IDUs, 39.3%
Heterosex, 50.3%
intercourse
Figure 6.4
15.6
20.0
28.0
9.4
10.6
11.7
15.3
24.8
18.4
13.2
4.0
7.5
12.1
8.4
21.3
10.3
- 5.0 10.0 15.0 20.0 25.0 30.0
15-19
20-24
Urban
Rural
Less than completed primary
Completed primary
Some secondary
Secondary +
Age
Resid
ence
Educ
ation
Tota
l
Men
Women
2009
Surveillance reports,
Programme, Ministryof Health, Indonesia, 2009
Percentage of unmarried women and men age 15-24 who have everhad sex, who use of condom at lastsex, accordingto background
2007
BPS, Indonesian Youth and Adolescence
Health Survey(IYARHS) 2007

82
behaviors.
Riskesdas
Indicators used to measure the comprehensive knowledge about HIV/AIDS in 2010 Riskesdas consists of two
indicators on methods of HIV/AIDS transmission prevention (limiting sexual intercourse to one HIV-negative
partner -partner who has no other partners- and using condoms during sexual intercourse) and two indicators
of wrong perception against the spread of HIV/AIDS (a person cannot get HIV by sharing food with a person with
HIV/AIDS or transmitted by mosquito bites).
2.1
15.5
14.7
18.5
8.4
0.1
2.2
4.9
10.2
28.8
3.1
27.5
12.7
5.7
10.3
9.5
14.9
5.0
0.2
1.1
3.9
10.2
22.7
1.9
21.7
9.1
1.6
1.2
1.4
0.6
2.2
2.2
1.3
1.7
0.9
1.4
2.8
2.2
2.6
1.6
3.8
2.0
2.8
3.1
1.9
2.6
0.0 10.0 20.0 30.0 40.0
15-19
20-24
15-24
Urban
Rural
No Educa�on
Some Primary
Complete Primary
Some Secondary
Secondary +
Lowest
Higest
Age
Resid
ence
Educ
a�on
Wea
lthQ
uin�
leTo
tal
Married Man- *
Married Woman**
Unmarried Men
Unmarried Women
and woemn aged 15-24 with correct of comprehensive
knowledge about AIDS, by
back ground
Indonesia 2007
*) covering age group of 15-54 years old for married man, except
when describing married men by age
group.**) covering age
group of 15-49 years old for married
women, except when describing marreid
women by age group
BPS, IDHS and IYARHS 2007

83
Knowledge of married men and women in urban areas was higher than in rural areas
Figure 6.5
Figure 6.6
Coverage of ART
Indonesia, 2006– 2009
treatment (ART) is given to individuals with advanced HIV
protocols
Country reports
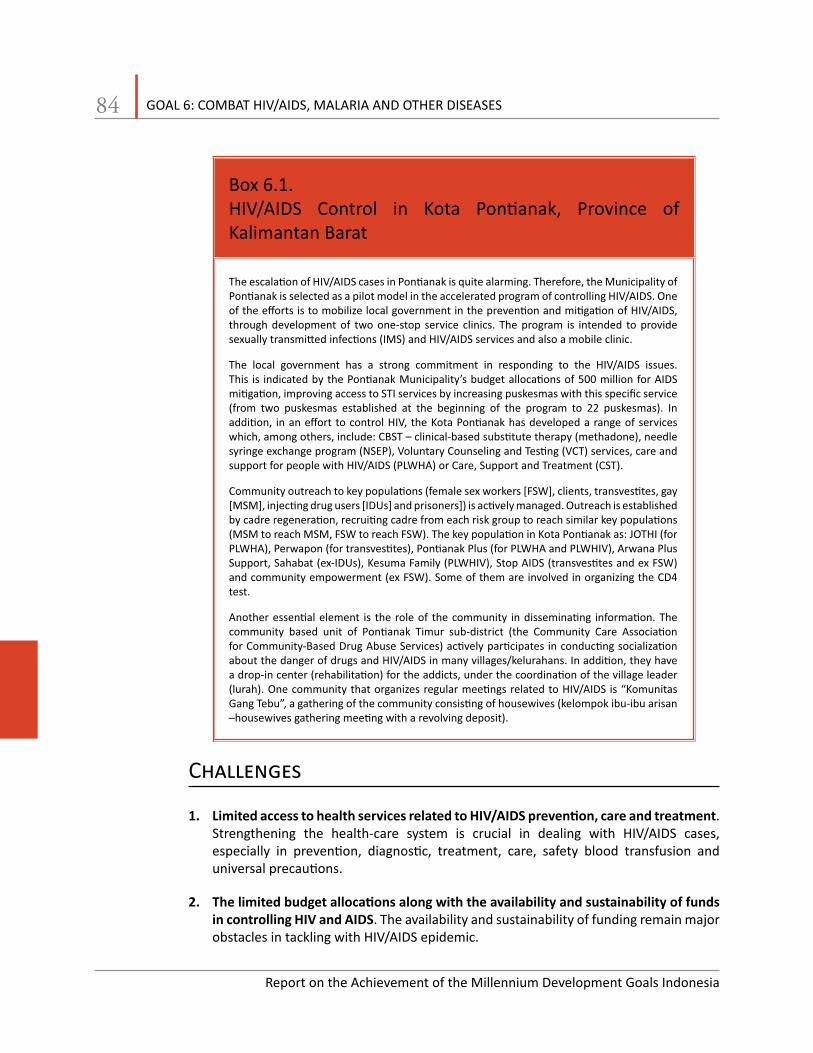
84
in controlling HIV and AIDS
85
systems
Rights.
Improving access by strengthening public health services so that they have the
86
TARGET 6C: HAVE HALTED BY 2015 AND BEGUN TO REVERSETHE INCIDENCE OF HIV/AIDS, MALARIA AND OTHERMAJOR DISEASES
Indicators Baseline CurrentMDGsTarget2015
Status Source
GOAL 6: COMBAT HIV/AIDS, MALARIA AND OTHER DISEASES
Riskesdas
Riskesdas
Riskesdas
Riskesdas
Status:
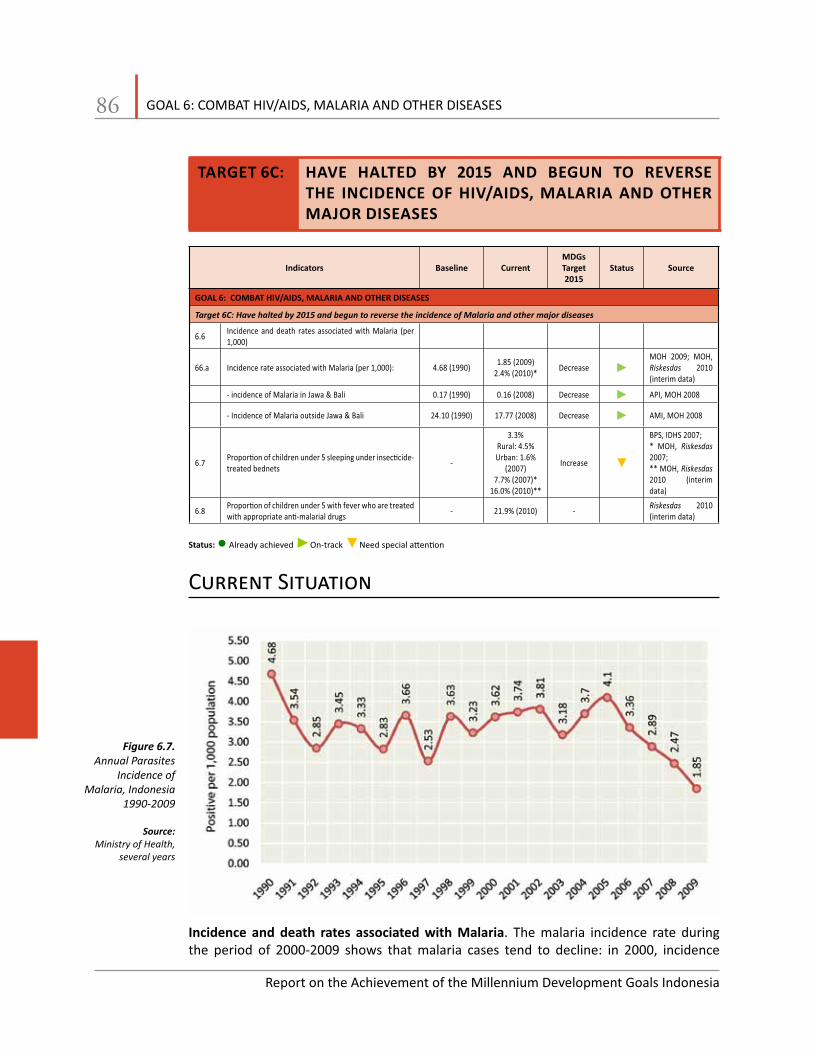
Annual ParasitesIncidence of
Malaria, Indonesia 1990-2009
Ministry of Health, several years
Incidence and death rates associated with Malaria

87
35.030.025.020.015.010.0
5.00.0
Figure 6.7Riskesdas
Riskesdas
There is disparity in malaria incidence among regions.
Figure 6.8
The vector of malaria in Jawa and Bali is dominated by plasmodium vivax malaria that inmost cases is drug-resistant
0.3
0.6
0.7
0.8
0.9
1.0
1.1
1.4
1.6
1.9
2.0
2.0
2.2
2.4
2.6
2.6
2.7
2.8 3.7
3.8
4.0 4.6
4.7 5.3
5.6
5.7 6.2
6.4 7.7 9.
2 10.3
10.7
25.5 31
.4
Bali
Jaw
aTi
mur
DKIJ
akar
taJa
wa
Bara
tJa
wa
Teng
ahDI
Yogy
akar
taBa
nten
Sum
ater
aBa
rat
Riau
Kalim
anta
nSe
lata
nSu
law
esiS
elat
anSu
law
esiT
engg
ara
Sum
ater
aUt
ara
INDO
NESI
AGo
ront
alo
Lam
pung
Aceh
Sum
ater
aSe
lata
nSu
law
esiT
enga
hKa
liman
tan
Tim
urKa
liman
tan
Teng
ahNu
saTe
ngga
raBa
rat
Kepu
laua
nRi
auJa
mbi
Sula
wes
iBar
atBe
ngku
luKa
liman
tan
Bara
tSu
law
esiU
tara
Mal
uku
Bang
kaBe
litun
gM
aluk
uUt
ara
Nusa
Teng
gara
Tim
urPa
pua
Bara
tPa
pua
API Malaria byprovince, 2010
Ministry of Health, 2010
to improve.
Riskesdas
Riskesdas

88
puskesmas
puskesmas puskesmaspuskesmas
Posmaldes Posmaldes

89
needed, through:
posmaldes
Improving capacity of human resources at all aspects.
Improving management structures and governance that include strategies, work

90
TARGET 6C: HAVE HALTED BY 2015 AND BEGUN TO REVERSE THEINCIDENCE OF MALARIA AND OTHER MAJOR DISEASES
Indicators Baseline CurrentMDGsTarget2015
Status Source
GOAL 6: COMBAT HIV/AIDS, MALARIA AND OTHER DISEASES
Status:
The TB control program has been improved. The c
Riskesdas

91
100 91 91 91 91 91
81
5458
73.8
87 86 86.1 86.7 89.5
1.4 4.67.5
12
19 20 21
30.637.6
54
6875.7
69.8 72.8 73.1
0102030405060708090
Perc
entg
e
(CDR) and SuccessRate (SR) of TB (%) 1995-2009)
1995
1996
1997
1998
1999
2000
2001
2002
2003
2004
2005
2006
2007
2008
2009 MoH-RI, Directorate
CDC, DG of CDC&EH, several years
SR CDR
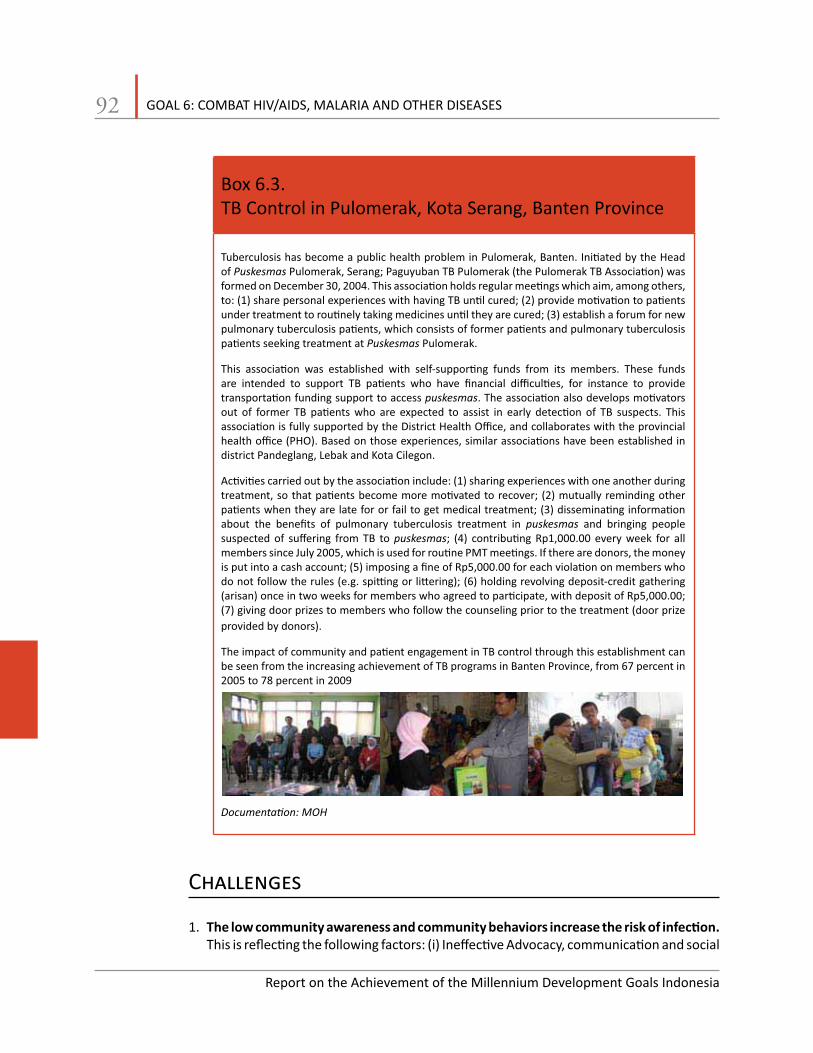
92
of Puskesmas
Puskesmas
puskesmas
puskesmaspuskesmas

93
health care services
Expanding DOTS coverage

94
APBNAPBD

GOAL 7:
ENSURE ENVIRONMENTALSUSTAINABILITY
Geothermal in North Sulawesi, by ADB

96

97
7 GOAL 7: ENSURE ENVIRONMENTALSUSTAINABILITY
TARGET 7A: INTEGRATING THE PRINCIPLES OF SUSTAINABLEDEVELOPMENTINNATIONALPOLICIESANDPROGRAMSAND REVERSING THE LOSS OF ENVIRONMENTALRESOURCES
Indicators Baseline CurrentMDGsTarget2015
Status Source
Goal 7: Ensure Environmental Sustainability
Ministry of
Ministry of
Status:
98
and Indonesia is vulnerable.
In March 2010 the government launched the Indonesia Climate Change Sectoral Roadmap
planning.
and aerial photographic surveys was 52.43 percent in 2008.
Figure 7.1.
The total area of lands legally designated by the government in 2010 as forest lands
136.88 million hectares or about 72.89 percent of the total land area of Indonesia.

99
70%
59.97%60%
52.43%48.97% 49.98%
50%
40%
30%
20%
10%
0%1990 2002 (Satellite Image 2005 (Satellite Image 2008 (Satellite Image
(1999/2000) 2002/2003) 2005/2006)
Percentage of Forest Cover
Protected areas are those areas
Taman Buru
.The percentageof forest cover of the total land area of Indonesia from 1990 to 2008
:Ministry of Forestry(1990-2008).

100
16
4
2
0
5.656.97
8.649.29
13.53
2005 2006 2007 2008 2009
years and the total area allocated for this use reached 13.53 million hectares in 2009 or
for marine species Table 7.1
Mill
ion
Ha.
14
12
10
8
6Areas of
Indonesian marine
areas, 2005-2009
Ministry of Marine
Indonesian marine
(2009)
Ministry of Marine
Fisheries
No Numberof areas
Total area
6
Total 76 13.529

101
in accordance with the Montreal Protocol.
10,000
Cons
ump�
on O
DP to
nnes
9,000
8,000
7,000
6,000
5,000
4,000
3,000
2,000
1,000
0
ODS was phased out (CFC, Halon, CTC, TCA, MBr)HCFCs
.
Substance
Indonesia from 1992 to 2008
:
1992
1993
1994
1995
1996
1997
1998
1999
2000
2001
2002
2003
2004
2005
2006
2007
2008 Ministry of
Environment
Total energy use tripled in Indonesia between 1990 and 2008.
Figure 7.4.
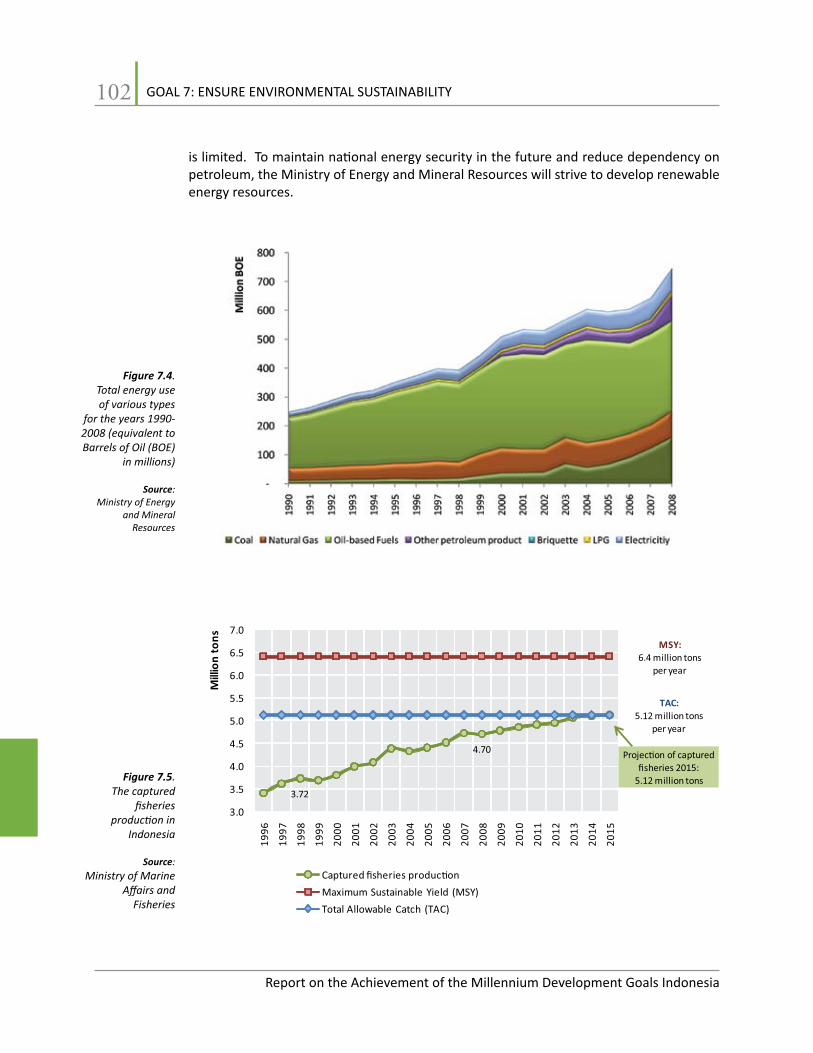
102
.Total energy use of various types
for the years 1990-
Barrels of Oil (BOE) in millions)
:Ministry of Energy
and Mineral Resources
Mill
ion
tons
7.0MSY:
6.5 6.4 million tonsper year6.0
5.5 TAC:5.12 million tons5.0
per year
3.72
4.70 Projec�on of capturedfisheries 2015:
5.12 million tons
4.5
4.0
3.5
3.0
.The captured
Indonesia
:
1996
1997
1998
1999
2000
2001
2002
2003
2004
2005
2006
2007
2008
2009
2010
2011
2012
2013
2014
2015
Captured fisheries produc�onMinistry of Marine Maximum Sustainable Yield (MSY)
Fisheries Total Allowable Catch (TAC)

103
Climate change creates tremendous challenges for sustainable development in Indonesia.
One of the causes of climate change is the high-level of carbon dioxide released into theatmosphere in consuming energy.
.

104
Box 7.1. District Wakatobi and its “Environment Warrior”
‘’We, the people of Wakatobi, did not work in vain.’’, the words were the spontaneousresponse from Ir. Hugua, the Head of the District of Wakatobi, after receiving the MDGLeadership Award in Jakarta last year, granted by the Coordinating Ministry for People’sWelfare in cooperation with the Leadership Park Institute. It was a proper reaction andreflected a sense of pride considering that Hugua had only taken over as the leader ofWakatobi just four years ago. Wakatobi itself is also quite a new district, having split fromthe district of Buton in the province of Sulawesi Tenggara, seven years ago.
Hugua has used his personal capacity, also the natural resources of the small islands ofWakatobi and the willingness of all elements of the society to‘solve’the challenges of MDGs.One of his success stories is in changing people’s behavior. Initially, it was of course noteasy, especially if that behavior was directly related to the necessities of their lives and hadbecome a traditional practice. Long before he became the Head of the district of Wakatobi,this father of two sons was known as an ‘Environmental Warrior’ who never gave up. In themidst of people relying on coral reefs as home building materials, he was never detered. Hisability to approach residents in coastal areas in their homes, by offering solutions to buildhouses using wood material, finally obtained results.
The United Nations (UN) has also given awards to the district of Wakatobi for its success inlowering the poverty rate to 7 percent in a short period, as well as its success in the 12-yearcompulsory education program and improving the health of the community.
During the World Ocean Conference held in mid-May 2009 in Manado (North Sulawesi),Hugua was one of the local leaders who was recognized by the World Wildlife Fund (WWF)for his commitment to preserve the population of sea turtles and the diversity of coral reefsalong the coasts of Wakatobi. This was revealed by survey data that within a period of oneyear the sea turtle nesting populations in the area of the islands of the district have beenincreased.
ChallengesOnly seven of 142 islands in the district of Wakatobi are inhabited.The coral reefs in Wakatobiare structures as steep walls - 60 percent are in very good condition. It is estimated thatthere are about 750 coral reef species together with 942 species of fish on the reefs. Thecultivation and exploitation of coral reefs or selling of ornamental fish are not allowed inWakatobi.
Currently, the coral reefs in this district are considered to be among the best preservedin the triangle area of coral reefs worldwide. However, increasing of sea temperatures hascaused coral bleaching in Wakatobi. Bleaching of coral reefs is caused by an increase in theillegal use of anesthesia in the capture of ornamental fish and sunlight. In collaborationwith the Ministry of Research and Technology, the district Wakatobi is conducting researchon biodiversity in these islands where land comprises only 3 percent of the total area of thedistrict. The rest is sea. Hopefully the challenges mentioned will be overcome with supportfrom all concerned parties.
Sources )

105
TARGET 7B: REDUCE BIODIVERSITY LOSS, ACHIEVING, BY 2010, ASIGNIFICANT REDUCTION IN THE RATE OF LOSS
Indonesia is endowed with rich biodiversity in the level of ecosystems, species and

106
The
Figures 7.6, 7.7, 7.8, 7.9
Figure 7.6. Distribution of the Sumatran Tiger
Figure 7.7. Distribution of the Kalimantan OrangutanPongo pymaeus sp
Figure 7.8. Distribution of the Javan Rhino (Rhinoceros sondaicus sondaicus
Figure 7.9. Distribution of the Sumatran Rhino in Leuser(Dicerorhinus sumatrensis sp)
a
species.
.
Figure 7.10

107
species by year,1990-2010
:Total number of protected/endangered fresh water fish speciesMinistry of Marine
Total number of protected/endangered marine fish species
-
100
200
300
400
.The total number
and the number of protected fresh water and marine
1990
1991
1992
1993
1994
1995
1996
1997
1998
1999
2000
2001
2002
2003
2004
2005
2006
2007
2008
2009
2010
Despite the richness, the biodiversity of Indonesia has been threatened due to the
.
Clupea toliCypselurus
Neolissochilus .Mystacoleucus padangensis
macraranthus ,

108
documented.

109
TARGET 7C: HALVE, BY 2015, THE PROPORTION OF PEOPLEWITHOUT SUSTAINABLE ACCESS TO SAFE DRINKINGWATER AND BASIC SANITATION
Indicators Baseline CurrentMDGsTarget2015
Status Source
Goal 7: Ensure Environmental Sustainability
Status:
Drinking Water
Household access to improved sources of drinkingSUSENAS
Figure7.11
Figure7.12, t

110
.
rural, urban andall householdswith access to
improved drinkingwater sources inIndonesia (1993-
2009)
Data does not include Timor Timur.
:Susenas, several
years
8070
90
.Percentages Pe
rcen
tage 60
504030
of households 20with access to 10
improved drinking 0water sources by
urban and rural
province (2009)
:Susenas 2009
27.4
730
.60
33.0
234
.81
35.4
436
.84
36.8
937
.74
40.2
940
.51
40.9
642
.92
43.7
544
.36
44.4
944
.85
44.9
645
.45
46.6
247
.71
48.0
848
.53
50.1
351
.04
51.1
951
.97
54.0
255
.50
55.7
055
.71
58.3
059
.12
59.9
960
.38
Bant
enAc
ehBe
ngku
luDK
IJak
arta
Papu
aBa
ngka
Belit
ung
Kalim
anta
nTe
ngah
Kepu
laua
nRi
auLa
mpu
ngJa
wa
Bara
tRi
auSu
law
esiB
arat
Mal
uku
Uta
raSu
law
esiT
enga
hSu
law
esiU
tara
Gor
onta
loN
usa
Teng
gara
Bara
tN
usa
Teng
gara
Tim
urSu
mat
era
Bara
tIN
DON
ESIA
Papu
aBa
rat
Sum
ater
aSe
lata
nSu
law
esiS
elat
anSu
mat
era
Uta
raJa
mbi
Kalim
anta
nSe
lata
nKa
liman
tan
Bara
tM
aluk
uJa
wa
Tim
urKa
liman
tan
Tim
urJa
wa
Teng
ahSu
law
esiT
engg
ara
Bali
DIYo
gyak
arta
TOTAL URBAN RURAL
SUSENAS
Figure 7.13
and between urban and rural areas.

0
30
40
50
60
70
80
1020
20
10
Perc
enta
ge
-
111
Figure 7.14
TARGET100 MDG
90.
76.8rural, urban and all
62 4 households with.55.6 access to improved
(1993-2009) and the MDG targetsfor these indicatorsin 201534
.051
.269
.5
Kepu
laua
nRi
au45
.78
20.6
35.0
54.1
Sula
wes
iTen
ggar
a45
.91
28.6
44.2
64.7
Jaw
aTi
mur
51.0
7
INDO
NES
IA51
.19
31.4
48.6
66.7
59.2
53.6 57
.7
45.0 49
.4
51.1
51.2 56
.9
24.8 27
.5
21.9 25
.2 27.5
28.9 32
.6
11.1
12.2
9.6
12.1 14
.2
15.6
17.3
17.4
32.7
53.7
17.3
34.3
56.6
18.0
35.6
57.3
Sula
wes
iTen
gah
42.0
2
Aceh
42.0
320
.735
.656
.7
Mal
uku
Uta
ra43
.18
22.5
38.1
Note:Data does not includeTimor Timur
:BPS, Susenas 1993 –
URBAN RURAL TOTAL 2009.
100908070 .6050 households with 40 access to improved30
by rural/urban areas by province(2009)14
.98
21.6
528
.78
32.6
334
.66
38.4
338
.69
39.2
139
.83
Nus
aTe
ngga
raTi
mur
Papu
aKa
liman
tan
Teng
ahPa
pua
Bara
tBe
ngku
luLa
mpu
ngM
aluk
uSu
mat
era
Bara
tN
usa
Teng
gara
Bara
tKa
liman
tan
Bara
t40
.12
Jam
bi40
.93
Kalim
anta
nSe
lata
n41
.16
Sum
ater
aSe
lata
n41
.48
Gor
onta
lo43
.84
Sula
wes
iBar
at45
.35
Sum
ater
aU
tara
51.9
252
.17
52.7
554
.06
57.5
858
.48
58.8
260
.66
63.5
975
.35
75.9
580
.37
Jaw
aBa
rat
Riau
Jaw
aTe
ngah
Sula
wes
iSel
atan
Kalim
anta
nTi
mur
Bant
enBa
ngka
Belit
ung
Sula
wes
iUta
raDI
Yogy
akar
taBa
liDK
IJak
arta
Note:Data does not includeTimor Timur
:BPS, Susenas 2009.
TOTAL URBAN RURAL
112
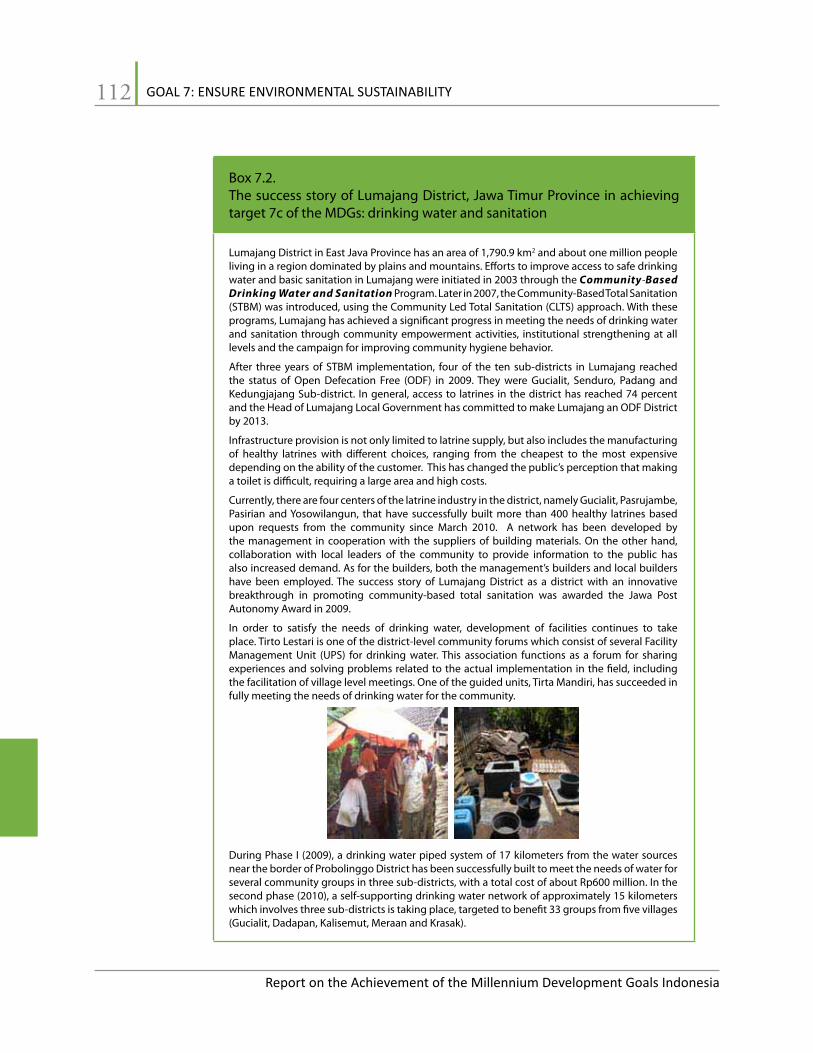
Box 7.2. The success story of Lumajang District, Jawa Timur Province in achievingtarget 7c of the MDGs: drinking water and sanitation
Lumajang District in East Java Province has an area of 1,790.9 km2 and about one million peopleliving in a region dominated by plains and mountains. Efforts to improve access to safe drinkingwater and basic sanitation in Lumajang were initiated in 2003 through the Community-BasedDrinking Water and Sanitation Program. Later in 2007, the Community-BasedTotal Sanitation(STBM) was introduced, using the Community Led Total Sanitation (CLTS) approach. With theseprograms, Lumajang has achieved a significant progress in meeting the needs of drinking waterand sanitation through community empowerment activities, institutional strengthening at alllevels and the campaign for improving community hygiene behavior.
After three years of STBM implementation, four of the ten sub-districts in Lumajang reachedthe status of Open Defecation Free (ODF) in 2009. They were Gucialit, Senduro, Padang andKedungjajang Sub-district. In general, access to latrines in the district has reached 74 percentand the Head of Lumajang Local Government has committed to make Lumajang an ODF Districtby 2013.
Infrastructure provision is not only limited to latrine supply, but also includes the manufacturingof healthy latrines with different choices, ranging from the cheapest to the most expensivedepending on the ability of the customer. This has changed the public’s perception that makinga toilet is difficult, requiring a large area and high costs.
Currently, there are four centers of the latrine industry in the district, namely Gucialit, Pasrujambe,Pasirian and Yosowilangun, that have successfully built more than 400 healthy latrines basedupon requests from the community since March 2010. A network has been developed bythe management in cooperation with the suppliers of building materials. On the other hand,collaboration with local leaders of the community to provide information to the public hasalso increased demand. As for the builders, both the management’s builders and local buildershave been employed. The success story of Lumajang District as a district with an innovativebreakthrough in promoting community-based total sanitation was awarded the Jawa PostAutonomy Award in 2009.
In order to satisfy the needs of drinking water, development of facilities continues to takeplace. Tirto Lestari is one of the district-level community forums which consist of several FacilityManagement Unit (UPS) for drinking water. This association functions as a forum for sharingexperiences and solving problems related to the actual implementation in the field, includingthe facilitation of village level meetings. One of the guided units, Tirta Mandiri, has succeeded infully meeting the needs of drinking water for the community.
During Phase I (2009), a drinking water piped system of 17 kilometers from the water sourcesnear the border of Probolinggo District has been successfully built to meet the needs of water forseveral community groups in three sub-districts, with a total cost of about Rp600 million. In thesecond phase (2010), a self-supporting drinking water network of approximately 15 kilometerswhich involves three sub-districts is taking place, targeted to benefit 33 groups from five villages(Gucialit, Dadapan, Kalisemut, Meraan and Krasak).

113

114
TARGET 7D: BY 2020, TO HAVE ACHIEVED A SIGNIFICANTIMPROVEMENT IN THE LIVES OF AT LEAST 100 MILLIONSLUM DWELLERS
Indicators Baseline CurrentMDGsTarget2015
Status Source
Goal 7: Ensure Environmental Sustainability
Status:

115
1 in Indonesia has declined from 20.75percent in 1993 to 12.12 percent in 2009.
Figure 7.15,
35
30
25
20
15
10
5
5.1 5.6
5.7 7.
67.
7 7.9 8.5
8.5
8.6
8.6 9.0 9.7
9.8 10
.510
.710
.9 12.1
12.5 13.3
13.3
13.3
14.0
14.1
14.1
14.6 15
.7 17.0 18
.819
.1 21.4 24
.0 25.1
25.4
28.9
Nus
aTe
ngga
raTi
mur
Perc
enta
ge
.
0 of urban slum
DIYo
gyak
arta
Jaw
aTe
ngah
Kalim
anta
nBa
rat
Mal
uku
Uta
raJa
mbi
Sum
ater
aU
tara
Bang
kaBe
litun
gSu
mat
era
Bara
tSu
law
esiS
elat
anJa
wa
Tim
urKa
liman
tan
Sela
tan
Kalim
anta
nTi
mur
Aceh
Riau
Sula
wes
iTen
ggar
aLa
mpu
ngIN
DON
ESIA
Gor
onta
loBa
liKa
liman
tan
Teng
ahBe
ngku
luSu
mat
era
Sela
tan
Sula
wes
iTen
gah
Kepu
laua
nRi
auJa
wa
Bara
tBa
nten
Sula
wes
iUta
raM
aluk
uSu
law
esiB
arat
Papu
aBa
rat
Nus
aTe
ngga
raBa
rat
DKIJ
akar
taPa
pua households by
province, 2009
:BPS, Susenas.

116
117

118

GOAL 8 : DEVELOP A GLOBALPARTNERSHIP FORDEVELOPMENT
JAKARTACOMMITMENT:AID FOR DEVELOPMENTEFFECTIVENESS
TO 2014
GOVERNMENT OF INDONESIAAND ITS DEVELOPMENTPARTNERS
120

121
8 GOAL 8: DEVELOP A GLOBAL PARTNERSHIPFOR DEVELOPMENT
TARGET 8A
FINANCIAL SYSTEM
Indicators Baseline CurrentMDGsTarget2015
Status Source
Goal 8: Develop a Global Partnership for Development
Status:
Greatereconomicopennesssupportedbyanimprovedregulatoryframeworkfortradehas
growth in Indonesia.
imports to GDP, and it has shown improvement.

122
100%
37.9% 39.5%
-
100
200
300
400
500
600
Mili
arDo
lar
AS
Perc
enta
ge(le
velo
feco
nom
icop
enne
ss) 90%
80%
70%
60%
50%
40%
30%
20%
10%
.The trends for
imports, exports,GDP growth and
and exports toGDP as the MDG
indicator foreconomic openness
0%:
BPS and the WorldBank, 2009 . 19
9019
9119
9219
9319
9419
9519
9619
9719
9819
9920
0020
0120
0220
0320
0420
0520
0620
0720
0820
09
Level of Economic Openness EXPORTS
IMPORTS GDP at Current Price (billion USD)
Table 8.1
Indonesian non-oil and gas exports Indonesian non-oil and gas imports
Country of Country of Origin .
Ranking of the tencountries which
were the main
Indonesian non-oil and gas exports
and the origin of Indonesian non-oil and gas imports in
2009
:Ministry of Trade
(computed byBappenas), 2010 .
*Members of ASEAN

123
1997/1998, including by strengthening the resilience of the banking industry through
banking industry.
Indicators 2000 2001 2002 2003 2004 2005 2006 2007 2008 2009
In the period following the economic crisis, the LDR for commercial banks and rural
Table 8.2
Indicators 2003 2004 2005 2006 2007 2008 2009
.Selected indicators
commercial banksin Indonesia, 2000 – 2009
:Bank of Indonesia,Indonesian
.Selected indicators
of rural banks in Indonesia, 2003 – 2009
:Indonesian Banking
Indonesia
124
have now lasted for eight years without reaching an agreement.
LKM
-

125
B3K
LJK
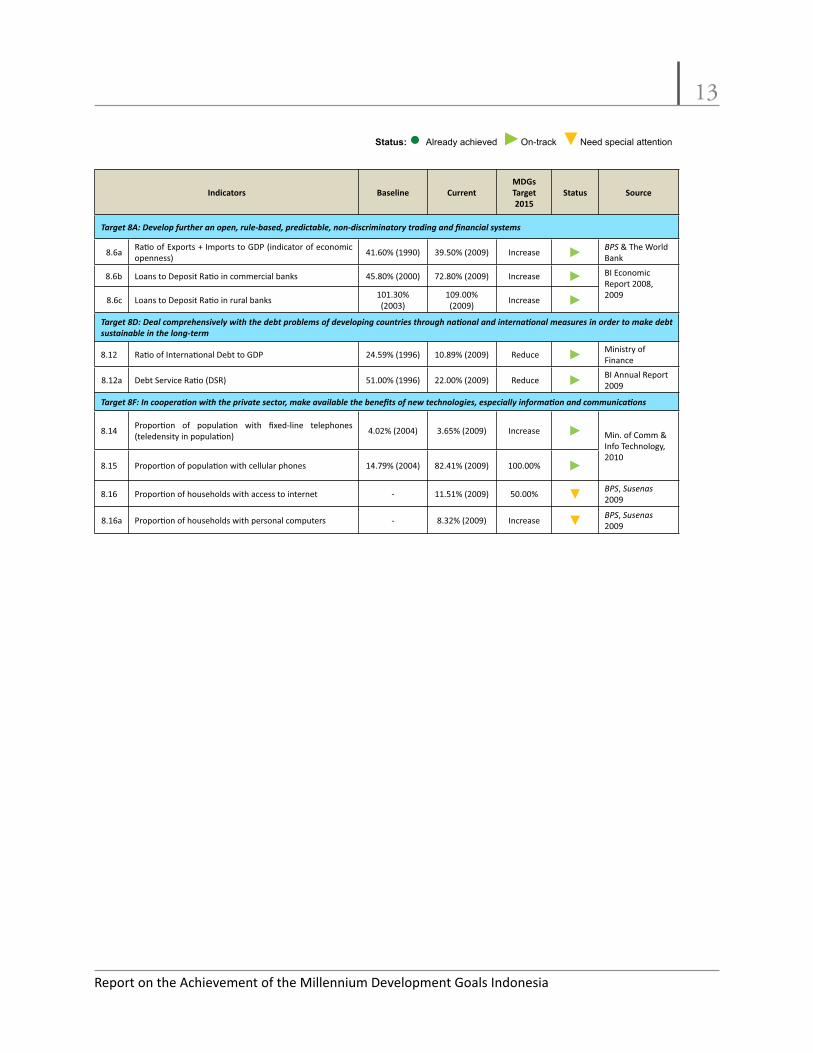
TARGET 8D: DEAL COMPREHENSIVELY WITH THE DEBT PROBLEMSOF DEVELOPING COUNTRIES THROUGH NATIONALAND INTERNATIONAL MEASURES IN ORDER TO MAKE
Indicators Baseline CurrentMDGsTarget2015
Status Source
Goal 8: Develop a Global Partnership for Development
Status: Already achieved On-track Need special attention

126
Trilliun IDR
6,000
5,000
4,000
3,000
2,000
1,000
0
50.7%
60.0% 57.9% 56.8%
41.1% 39.4%33.1% 34.1%
27.1%
17.3%24.8%
19.2%24.2% 21.9%
24.6%
37.9%
47.3%39.9% 41.9%
37.2%31.3% 29.0% 27.8%
22.4%16.8% 14.8% 14.7%
10.9%
1996 1997 1998 1999 2000 2001 2002 2003 2004 2005 2006 2007 2008 2009
Ra�o of Foreign Debt to GDP
( % )
120%
100%
80%
60%
40%
20%
0%
.The trend of
foreign debt toGDP and the Debt
during 1996-2009
:Bank of Indonesia,
Indonesian Economic
Ministry of Finance,2010 .
Outstanding Debt GDB Ra�o of Debt to GDPDSR Foreign Loan Ra�o of Foreign Debt to GDP
GDP had declined from a peak of 89 percent in 2000 to 30 percent in 2009.
Figure 8.2
borrowing.
per year during the 2010-2014 period is a major challenge for the Government.

127
no longer be eligible to receive loans with the lowest interest rates and longer maturity

128

129
TARGET 8F: IN COOPERATION WITH THE PRIVATE SECTOR, MAKEAVAILABLE THE BENEFITS OF NEW TECHNOLOGIES,ESPECIALLY INFORMATION AND COMMUNICATIONS
Indicators Baseline CurrentMDGsTarget2015
Status Source
Goal 8: Develop a Global Partnership for Development
Status:
development during the 2005-2009 period shows that the total teledensity of
1
On the other hand, there
in the availability of
about 85 percent of
infrastructures areconcentrated in westernIndonesia and there are
villages that do not havet e l e c o m m u n i c a t i o n s

130
1. Improving the management of limited resources
local contents to spur demand

131
period is aimed at strengthening

132
133
Bibliography
The Way Forward 2015
Kaji ulang status gizi anak 0-59 bulan (berat badan menurut umur) menggunakan data nasional Susenas 1989-2005: Perbandingan standar NCHS/WHO dan rujukan WHO 2005. Jakarta
Survei Sosial Ekonomi Nasional (Susenas)Pendataan Program Perlindungan Sosial (PPLS)Data Strategis BPS
Rencana Aksi Nasional Pangan dan Gizi 2006-2010Millennium Development Goals Report 2007Pembangunan Kesehatan dan Gizi di Indonesia: Overview dan Arah ke Depan.
Background Study RPJMN 2010-2014Riset Kesehatan
Dasar 2007Sustainable Food Security Development in Indonesia: Policies
Food Security in Indonesia: Current Challenges and the Long-Run Outlook
Achieving MDGs through RPJMN
Spending for Development: Making the Most of Indonesia’s New
Assessment
134
Improvemnet through Community EmpowermentKaji ulang status gizi anak 0-59 bulan (berat badan menurut umur)
menggunakan data nasional Susenas 1989-2005: Perbandingan standar NCHS/WHO dan rujukan WHO 2005.
Survei Sosial Ekonomi Nasional (Susenas)
Medium-Term Development PlanMillennium Development Goals Report 200Report on MDGs Achievement IndonesiaPembangunan Kesehatan dan Gizi di Indonesia: Overview dan Arah ke Depan.
Backround study RPJMN 2101-2014
Literacy for Life, EFA Global Monitoring Report
Program in Bali and Nusa Tenggara Barat
Study on Teacher Employment & Deployment in Indonesia
Petunjuk Teknis Program BOSRencana Strategis Pembangunan Pendidikan
Dasar (SD)Data
Capaian Indikator MDGsSustainable food security development in Indonesia: Policies
Food Security in Indonesia: Current Challenges and the Long-Run Outlook

135
Upgrading Project (BERMUTU)
Spending
Public Expenditure Review 2007Spending for Development - Making the Most of Indonesia’s New
of Regional Public Expenditure and Financial Management
Survei Angkatan Kerja Nasional (Sakernas)
Bappenas. (2007) Report on MDGs Achievement Indonesia
Indonesia
Indicators Table 2008, Human Development Indices
developing countries
Millennium Development Goals for Health: What Will It Take to Accelerate Progress?

136
Survei Sosial dan Ekonomi Nasional (Susenas), 2007Laporan Pencapaian Millennium Development Goals, Indonesia 2007
Pengembangan DatabasePembangunan Kesehatan Dan Gizi Masyarakat
Pembiayaan Pencapaian MDGs di Indonesia, Laporan KajianPembangunan Kesehatan dan Gizi di Indonesia: Overview dan Arah ke Depan.
Backgorund Study RPJMN 2010-2014Keluarga Berencana, Kesehatan Reproduksi, Gender, dan Pembangunan
Kependudukan
Making Pregnancy Safer in Indonesia 2001-2010
Healthy Indonesia 2010 - Make Pregnancy Safer IndonesiaRiset Kesehatan
Dasar (Riskesdas) Laporan Nasional Tahun 2007
Analisis dari erbagai survei SDKI BPS tahun 1997, 2002-2003 and 2007
the Millennium Development GoalsThe Millennium Development Goals Report 2008
The World Health Report 2005: Make Every Mother and Child Count.
The Millennium Development Goals will not be
developing countries
Millennium Development Goals for Health: What Will It Take to Accelerate Progress?
Berpengaruh

137
Survei Sosial dan Ekonomi Nasional (Susenas), 2007Laporan Pencapaian Millennium Development Goals Indonesia 2007
Sasaran MDGs
Pengembangan DatabasePembangunan Kesehatan dan Gizi Masyarakat 2008
Pembiayaan Pencapaian MDGs di IndonesiaPembangunan Kesehatan dan Gizi di Indonesia: Overview dan Arah ke Depan.
Backgorund Study RPJMN 2010-2014Keluarga Berencana, Kesehatan Reproduksi, Gender, dan Pembangunan
Kependudukan
Rencana Strategis Nasional. Making Pregnancy Safer in Indonesia2001-2010
Healthy Indonesia 2010 - Make Pregnancy Safer Indonesia
Dasar (Riskesdas) Laporan Nasional Tahun 2007
Measuring Maternal Mortality: Challenges,
The Millennium Development Goals Report 2008WHO Report 2004The World Health Report 2005: Make Every Mother and Child
CountWHO Report 2006
The Millennium Development Goals will not be
poor rural areas
to The Member Countries.

138
Millennium Development Goals for Health: What Will It Take to Accelerate Progress?
Supply Chain Status Assessment in Tanah Papua
Lessons of Experience”
Resources Needed to Address HIV/AIDS
Network
Pedoman Perluasan Jejaring Perawatan, Dukungan dan Pengobatan
Anak Di Indonesia
Laporan AIDS
HIV and AIDS Response Strategies2007-2010
Rencana Aksi dan Strategi Nasional Penanggulangan AIDS, 2010-2014
Keputusan Menteri Kesehatan Republik Indonesia,
Personal

139
f
The Millennium Development
Guidelines
surveys
Malaria Emergency Fund for the Containmentof Malaria Epidemics in Africa
The Global Plan to Stop TB: a
Addressing HIV/AIDS, Malaria and Tuberculosis : The resource needs of the Global Fund 2005 – 2007
Malaria-free Indonesia by 2030.
AIDS epidemic update: Desember 2007.
Global Strategic Plan 2005 – 2015
reversing the spread of HIV in the developing world
Coming to Grips with Malaria in the New Millennium
Children and AIDS: Third StocktakingReport, 2008.
in the health sector, 2008
Global Reference Group on HIV/AIDS and Human Rights: Review and Assessment
140
Reducing Poverty and Achieving the Millennium Development Goals: arguments for
the MDGs: Project Facts the Indonesian Partnership Fund for HIV and AIDS.
The Millennium Development Goals Report 2008
Project Report 1996
A Billion-dollar Moment for a Centuries Old Disease?
Global Strategic Framework for Integrated Vector Management
impactf
f
ODHA & Akses PelayananKesehatan DasarResearch
f
A strategic framework for malaria
WHO We Are: The HIV/AIDS Programme at
and care.Expanding Access to HIV/
Expanding Access to HIV/AIDS Treatment Mission Report – Indonesia, 19-31 Januari 2004
Regional Strategic Plan On HIV/TB, October 200
Regional Strategy for the
141
transmission
Care and Treatment
TB and HIV/AIDS in the South-East Asia Region, Report of the
Health Policy
The Roll Back Malaria Strategy for Improving Access toTreatment Through Home Management of Malaria
THE STOP TB STRATEGY, Building on and Enhancing DOTS toMeet the TB-related Millennium Development Goals
Asia Region
HIV Burden
Partners Support for Malaria Control in Indonesia, 2008
World Malaria Report
World Malaria Report: Summary and Key points
“Economic Impacts of

142
Survei Sosial Ekonomi Nasional 2008
Report on the Achievement of Indonesia’s MillenniumDevelopment Goals 2004
Rencana Pembangunan Jangka Menengah Nasional 2010-2014Hasil Lokakarya Konsolidasi Masukan RPJMN 2010-2014 Bidang Air
Minum dan Penyehatan LingkunganLessons from Around the World, Building an Indonesian Framework for
Temuan Isu dan Permasalahan Serta Usulan Kebijakan Awal (Prematur Policy) Pembangunan Air Minum dan Sanitasi.
Indonesia Climate Change Sectoral Roadmap (ICCSR)
Water safety plan manual: step-by-step risk management for drinking-watersuppliers
Buku Data
Mobilisasi Pendanaan Guna MendukungPengembangan Sanitasi
Pendekatan Strategis Pengembangan Sanitasi di Indonesia
Peranserta Swasta Dalam Peningkatan Layanan Sanitasi
Public-Private Partnership in Handwashing with Soap
SPM Sebagai Target Pencapaian PengembanganSanitasi.
Strategi Sanitasi Melalui Pendekatan PengembanganKelembagaan
Keputusan Menteri Kesehatan Republik Indonesia Nomor 852/ Menkes/SK/IX/2008 Tentang Strategi Nasional Sanitasi Total Berbasis Masyarakat
Strategi Nasional Sanitasi Total Berbasis Masyarakat
Indonesia and Climate Change
Survei rumah tangga pelayanan kesehatan dasar di 30 kabupaten di 6

143
provinsi di Indonesia 2005
Providing Access to Marine Protected Areas Data and Marine Related Researchin Indonesia
Health, Dignity, and Development: What Will it Take?
The Other Half of Climate Change – Why Indonesia Must Adapt to Protect Its Poorest People
Southeast Asia: A Free Trade AreaASEAN Economic Community Blueprint
Survei Sosial Ekonomi Nasional 2009Laporan Perekonomian Indonesia 2008Laporan Perekonomian Indonesia 2009
Laporan Pencapaian Millennium Development Goals Indonesia 2007Jurnal Kerjasama Pemerintah dan SwastaThe Jakarta Commitment – Indonesia Roadmap to 2014
Statement on Plenary Session of 7th
BPS The Availability of ICT Indicatorsfor Households and Individuals: Case of Indonesia
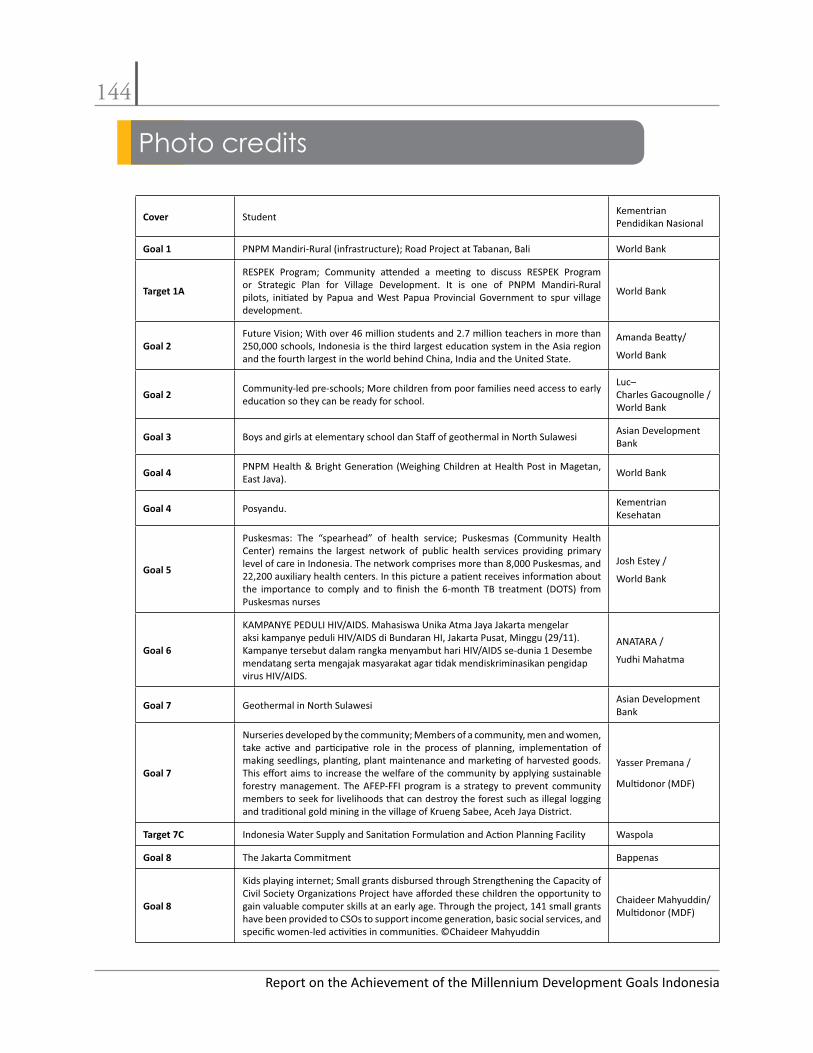
144
Photo credits
Cover
Goal 1
Target 1A
Goal 2
Goal 2
Goal 3
Goal 4
Goal 4
Goal 5
Goal 6
Goal 7
Goal 7
Target 7C
Goal 8
Goal 8

