20091218_rei_report
DESCRIPTION
20091218_REI_ReportTRANSCRIPT
Real Estate Asset Class Review
December 18, 2009
Gary R. Dokes, ASRS Chief Investment Officer
Eric Rovelli, ASRS Real Estate Portfolio Manager
Micolyn Yalonis, The Townsend Group Principal
Jennifer Young, The Townsend Group Consultant
Bruce Rosenberg, Director, Credit Suisse, CFIG
Page(s)
■ Real Estate Program Overview 3
■ Real Estate Program Constraints 4
■ Real Estate Program Activity 5
■ Portfolio Performance 6 - 7
■ Portfolio Composition 8 - 9
■ Portfolio Vintage Exposure 10 - 13
■ Risk Assessment 14 - 16
■ View of the World & ASRS Capital Plan (Exhibit A)
2
ASRS Real Estate Program – Discussion Items
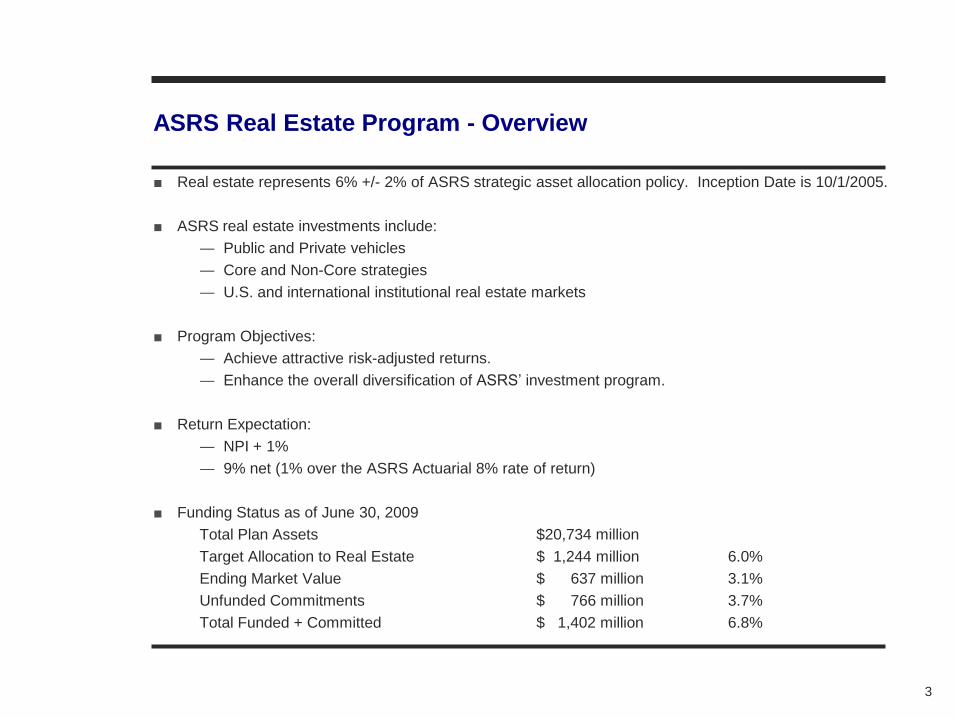
■ Real estate represents 6% +/- 2% of ASRS strategic asset allocation policy. Inception Date is 10/1/2005.
■ ASRS real estate investments include:
― Public and Private vehicles
― Core and Non-Core strategies
― U.S. and international institutional real estate markets
■ Program Objectives:
― Achieve attractive risk-adjusted returns.
― Enhance the overall diversification of ASRS‟ investment program.
■ Return Expectation:
― NPI + 1%
― 9% net (1% over the ASRS Actuarial 8% rate of return)
■ Funding Status as of June 30, 2009
Total Plan Assets $20,734 million
Target Allocation to Real Estate $ 1,244 million 6.0%
Ending Market Value $ 637 million 3.1%
Unfunded Commitments $ 766 million 3.7%
Total Funded + Committed $ 1,402 million 6.8%
3
ASRS Real Estate Program - Overview

* ASRS‟ 31% exposure to Non-U.S. investments represents the Plan‟s current Funded Portfolio.
Significant capital has been committed, but not yet called for domestic strategies which will decrease
ASRS‟ exposure to Non-U.S. investments over time (AEW, CBRE, CIM, Dune and Westbrook).
― The ASRS Strategic Plan allows for temporary variances in diversification during initial
allocations and Portfolio formation.
** The Core Private Portfolio has exceeded its loan-to-value constraint due to unrealized equity losses,
not deliberate use of excess debt. However, all debt was in compliance of Strategic Plan guidelines at
the time of origination.
4
ASRS Real Estate Program – Constraints
1Percentages representative of private assets only. 2F&C is defined as Funded & Committed which equals the 6/30/2009 market value + unfunded commitments. 3Percentages represent ASRS‟ Funded status as of 6/30/2009.
Constraint1 Strategic
Allowance
% of Portfolio F&C as
of 6/30/20092
Total Core Portfolio Minimum 20% 23%
Public Securities Maximum 30% 6%
Total Non-Core Portfolio Maximum 80% 77%
International Exposure3 Maximum 30% 31%*
Total Portfolio Leverage3 Maximum 65% 58%
Total Core Private Portfolio Leverage3 Maximum 30% 42%**
ASRS % Interest in Commingled Fund Maximum 20% N/A
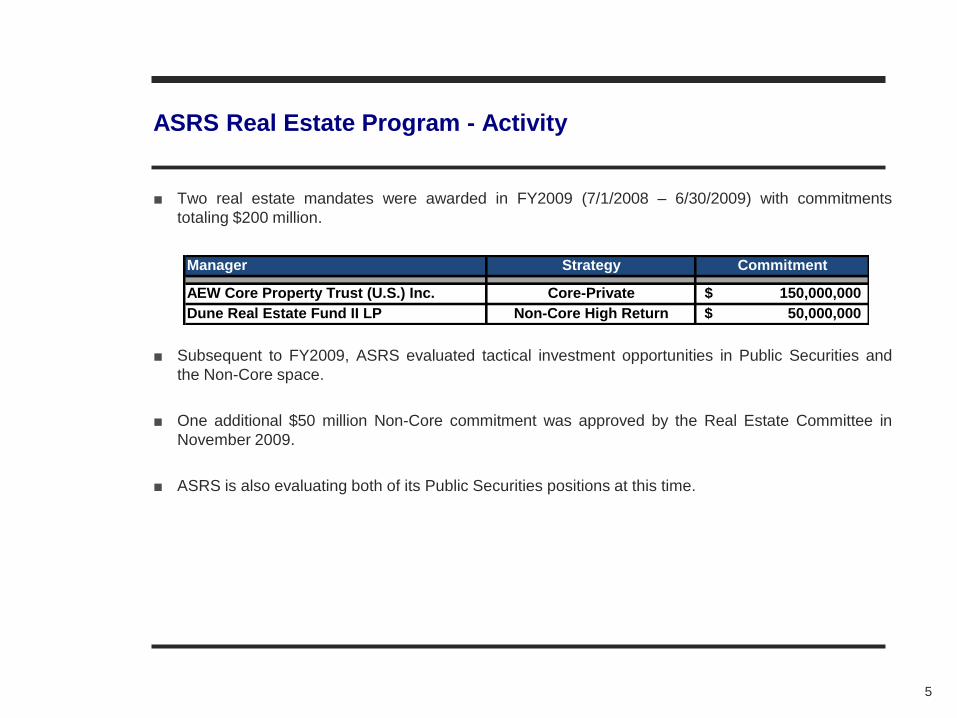
■ Two real estate mandates were awarded in FY2009 (7/1/2008 – 6/30/2009) with commitments
totaling $200 million.
■ Subsequent to FY2009, ASRS evaluated tactical investment opportunities in Public Securities and
the Non-Core space.
■ One additional $50 million Non-Core commitment was approved by the Real Estate Committee in
November 2009.
■ ASRS is also evaluating both of its Public Securities positions at this time.
5
ASRS Real Estate Program - Activity
Manager Strategy Commitment
AEW Core Property Trust (U.S.) Inc. Core-Private 150,000,000$
Dune Real Estate Fund II LP Non-Core High Return 50,000,000$
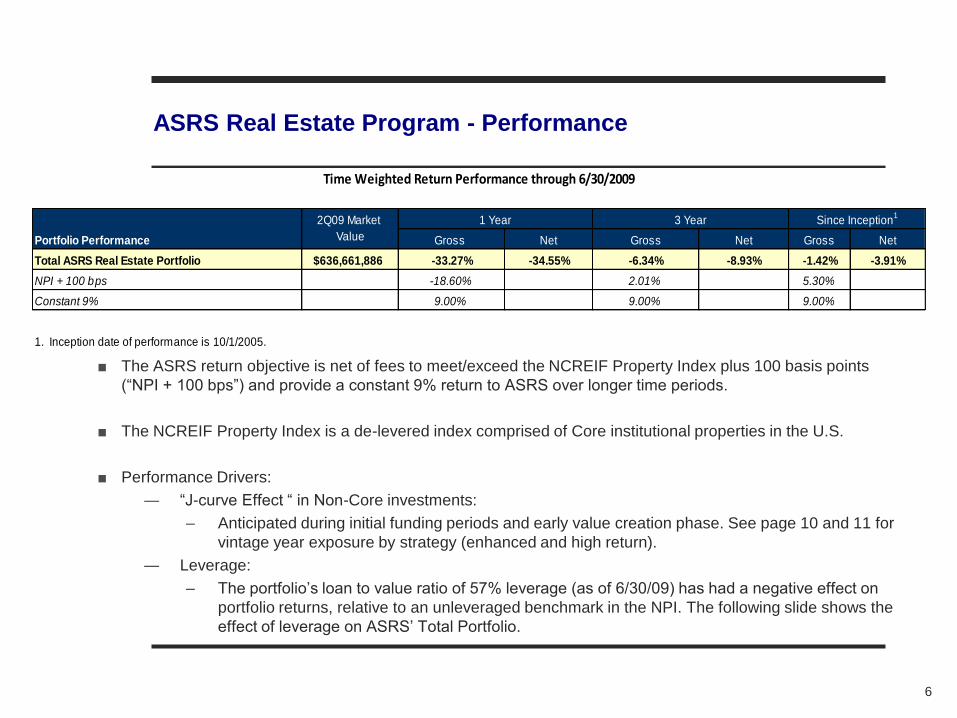
■ The ASRS return objective is net of fees to meet/exceed the NCREIF Property Index plus 100 basis points
(“NPI + 100 bps”) and provide a constant 9% return to ASRS over longer time periods.
■ The NCREIF Property Index is a de-levered index comprised of Core institutional properties in the U.S.
■ Performance Drivers:
― “J-curve Effect “ in Non-Core investments:
– Anticipated during initial funding periods and early value creation phase. See page 10 and 11 for
vintage year exposure by strategy (enhanced and high return).
― Leverage:
– The portfolio‟s loan to value ratio of 57% leverage (as of 6/30/09) has had a negative effect on
portfolio returns, relative to an unleveraged benchmark in the NPI. The following slide shows the
effect of leverage on ASRS‟ Total Portfolio.
6
ASRS Real Estate Program - Performance
Gross Net Gross Net Gross Net
Total ASRS Real Estate Portfolio $636,661,886 -33.27% -34.55% -6.34% -8.93% -1.42% -3.91%
NPI + 100 bps -18.60% 2.01% 5.30%
Constant 9% 9.00% 9.00% 9.00%
1. Inception date of performance is 10/1/2005.
1 Year 3 Year Since Inception1
Portfolio Performance
2Q09 Market
Value
Time Weighted Return Performance through 6/30/2009
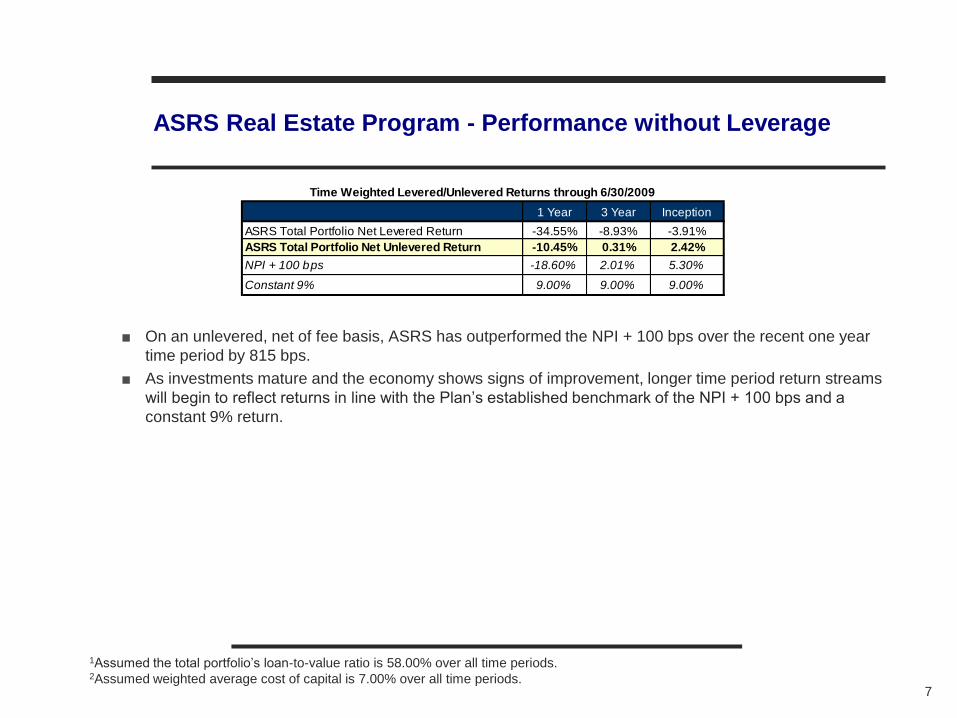
■ On an unlevered, net of fee basis, ASRS has outperformed the NPI + 100 bps over the recent one year
time period by 815 bps.
■ As investments mature and the economy shows signs of improvement, longer time period return streams
will begin to reflect returns in line with the Plan‟s established benchmark of the NPI + 100 bps and a
constant 9% return.
7
ASRS Real Estate Program - Performance without Leverage
1 Year 3 Year Inception
ASRS Total Portfolio Net Levered Return -34.55% -8.93% -3.91%
ASRS Total Portfolio Net Unlevered Return -10.45% 0.31% 2.42%
NPI + 100 bps -18.60% 2.01% 5.30%
Constant 9% 9.00% 9.00% 9.00%
Time Weighted Levered/Unlevered Returns through 6/30/2009
1Assumed the total portfolio‟s loan-to-value ratio is 58.00% over all time periods. 2Assumed weighted average cost of capital is 7.00% over all time periods.
8
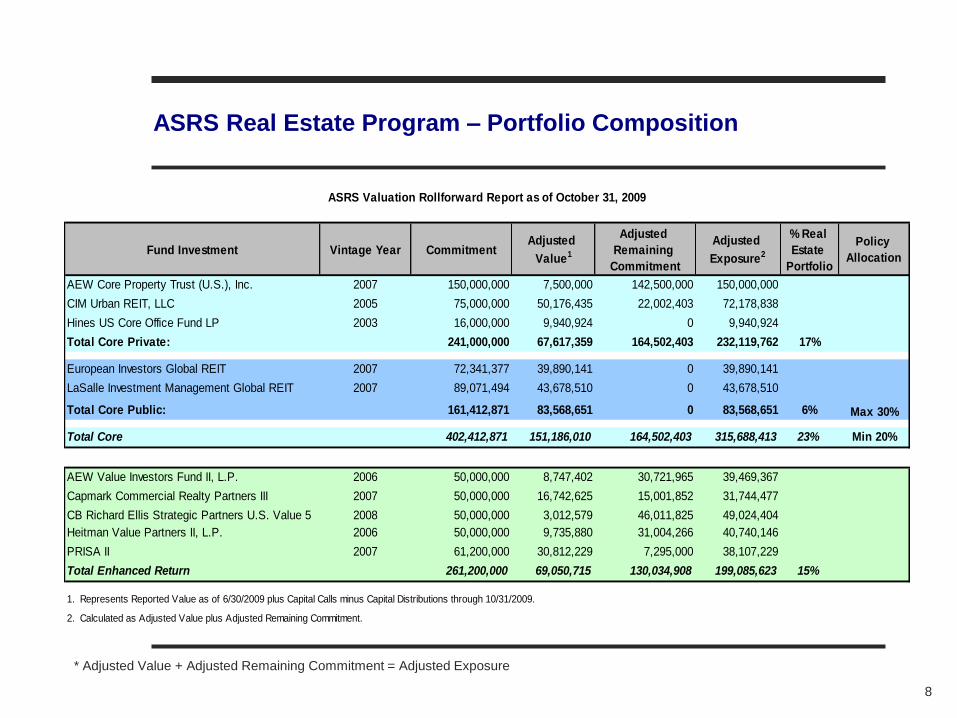
ASRS Real Estate Program – Portfolio Composition
* Adjusted Value + Adjusted Remaining Commitment = Adjusted Exposure
Fund Investment Vintage Year CommitmentAdjusted
Value1
Adjusted
Remaining
Commitment
Adjusted
Exposure2
% Real
Estate
Portfolio
Policy
Allocation
AEW Core Property Trust (U.S.), Inc. 2007 150,000,000 7,500,000 142,500,000 150,000,000
CIM Urban REIT, LLC 2005 75,000,000 50,176,435 22,002,403 72,178,838
Hines US Core Office Fund LP 2003 16,000,000 9,940,924 0 9,940,924
Total Core Private: 241,000,000 67,617,359 164,502,403 232,119,762 17%
European Investors Global REIT 2007 72,341,377 39,890,141 0 39,890,141
LaSalle Investment Management Global REIT 2007 89,071,494 43,678,510 0 43,678,510
Total Core Public: 161,412,871 83,568,651 0 83,568,651 6%
Total Core 402,412,871 151,186,010 164,502,403 315,688,413 23% Min 20%
AEW Value Investors Fund II, L.P. 2006 50,000,000 8,747,402 30,721,965 39,469,367
Capmark Commercial Realty Partners III 2007 50,000,000 16,742,625 15,001,852 31,744,477
CB Richard Ellis Strategic Partners U.S. Value 5 2008 50,000,000 3,012,579 46,011,825 49,024,404
Heitman Value Partners II, L.P. 2006 50,000,000 9,735,880 31,004,266 40,740,146
PRISA II 2007 61,200,000 30,812,229 7,295,000 38,107,229
Total Enhanced Return 261,200,000 69,050,715 130,034,908 199,085,623 15%
ASRS Valuation Rollforward Report as of October 31, 2009
Max 30%
1. Represents Reported Value as of 6/30/2009 plus Capital Calls minus Capital Distributions through 10/31/2009.
2. Calculated as Adjusted Value plus Adjusted Remaining Commitment.
9
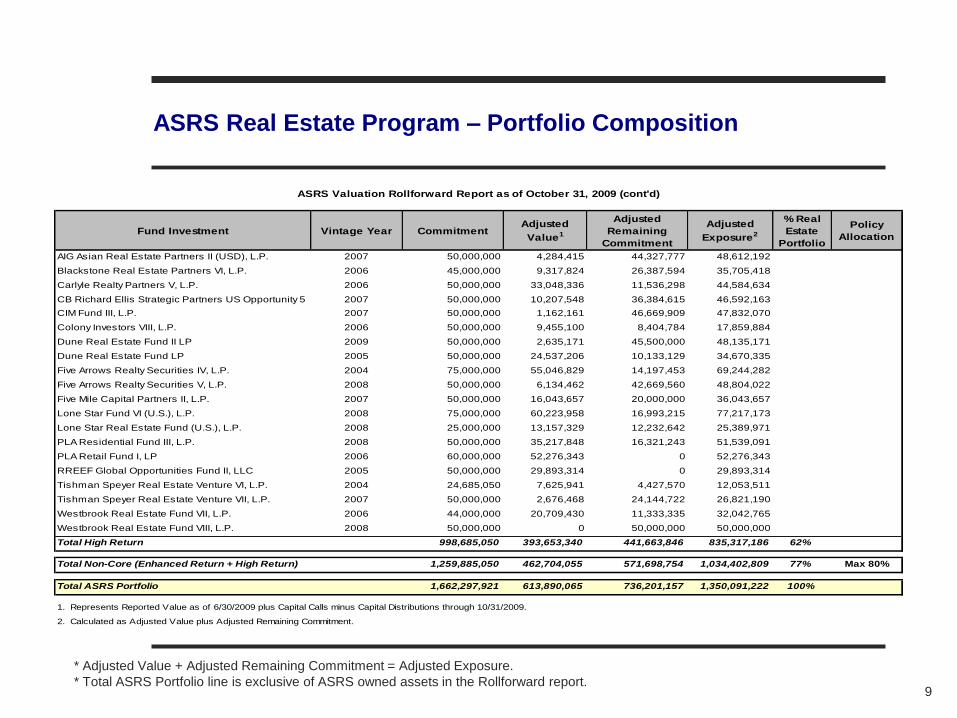
ASRS Real Estate Program – Portfolio Composition
* Adjusted Value + Adjusted Remaining Commitment = Adjusted Exposure.
* Total ASRS Portfolio line is exclusive of ASRS owned assets in the Rollforward report.
Fund Investment Vintage Year CommitmentAdjusted
Value1
Adjusted
Remaining
Commitment
Adjusted
Exposure2
% Real
Estate
Portfolio
Policy
Allocation
AIG Asian Real Estate Partners II (USD), L.P. 2007 50,000,000 4,284,415 44,327,777 48,612,192
Blackstone Real Estate Partners VI, L.P. 2006 45,000,000 9,317,824 26,387,594 35,705,418
Carlyle Realty Partners V, L.P. 2006 50,000,000 33,048,336 11,536,298 44,584,634
CB Richard Ellis Strategic Partners US Opportunity 5 2007 50,000,000 10,207,548 36,384,615 46,592,163
CIM Fund III, L.P. 2007 50,000,000 1,162,161 46,669,909 47,832,070
Colony Investors VIII, L.P. 2006 50,000,000 9,455,100 8,404,784 17,859,884
Dune Real Estate Fund II LP 2009 50,000,000 2,635,171 45,500,000 48,135,171
Dune Real Estate Fund LP 2005 50,000,000 24,537,206 10,133,129 34,670,335
Five Arrows Realty Securities IV, L.P. 2004 75,000,000 55,046,829 14,197,453 69,244,282
Five Arrows Realty Securities V, L.P. 2008 50,000,000 6,134,462 42,669,560 48,804,022
Five Mile Capital Partners II, L.P. 2007 50,000,000 16,043,657 20,000,000 36,043,657
Lone Star Fund VI (U.S.), L.P. 2008 75,000,000 60,223,958 16,993,215 77,217,173
Lone Star Real Estate Fund (U.S.), L.P. 2008 25,000,000 13,157,329 12,232,642 25,389,971
PLA Residential Fund III, L.P. 2008 50,000,000 35,217,848 16,321,243 51,539,091
PLA Retail Fund I, LP 2006 60,000,000 52,276,343 0 52,276,343
RREEF Global Opportunities Fund II, LLC 2005 50,000,000 29,893,314 0 29,893,314
Tishman Speyer Real Estate Venture VI, L.P. 2004 24,685,050 7,625,941 4,427,570 12,053,511
Tishman Speyer Real Estate Venture VII, L.P. 2007 50,000,000 2,676,468 24,144,722 26,821,190
Westbrook Real Estate Fund VII, L.P. 2006 44,000,000 20,709,430 11,333,335 32,042,765
Westbrook Real Estate Fund VIII, L.P. 2008 50,000,000 0 50,000,000 50,000,000
Total High Return 998,685,050 393,653,340 441,663,846 835,317,186 62%
Total Non-Core (Enhanced Return + High Return) 1,259,885,050 462,704,055 571,698,754 1,034,402,809 77% Max 80%
Total ASRS Portfolio 1,662,297,921 613,890,065 736,201,157 1,350,091,222 100%
1. Represents Reported Value as of 6/30/2009 plus Capital Calls minus Capital Distributions through 10/31/2009.
2. Calculated as Adjusted Value plus Adjusted Remaining Commitment.
ASRS Valuation Rollforward Report as of October 31, 2009 (cont'd)

10
ASRS Real Estate Program – Vintage Exposure (IRR1)
The Average Projected IRR represents the average targeted return promised by investment managers in
their respective vintage year. The Average Actual Gross ASRS IRR represents the average gross IRR of
investments to date relative to the displayed vintage year based on actual cash flows. Total commitments to
the enhanced space represent $261 million since inception.
As of June 30th, 2009 the market value of all enhanced investments represents 26.4% of total commitments
made to enhanced strategies and 49.7% of total capital committed remains for future investments.
Vintage
ASRS
Exposure (#
of Funds)
2006 2
2007 2
2008 1
13.5% 13.5% 14.0%
-41.1%-44.2%
-30.5%
-50%
-40%
-30%
-20%
-10%
0%
10%
20%
2006 2007 2008
IRR
Enhanced Investment Performance by Vintage Year
Average Targeted Gross IRR Average Actual Gross ASRS IRR
1Internal Rate of Return.
*Measures the promised average IRR relative to current average IRR with in place cash flow. Current performance is not indicative of fund
level performance at maturity.
11
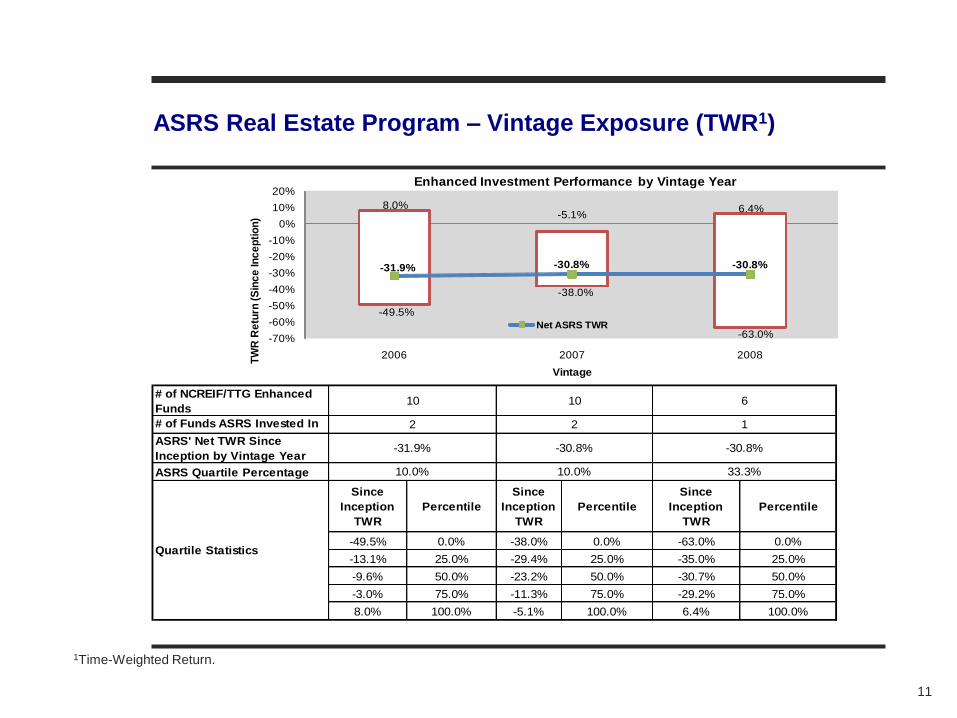
ASRS Real Estate Program – Vintage Exposure (TWR1)
1Time-Weighted Return.
# of NCREIF/TTG Enhanced
Funds
# of Funds ASRS Invested In
ASRS' Net TWR Since
Inception by Vintage Year
ASRS Quartile Percentage
Since
Inception
TWR
Percentile
Since
Inception
TWR
Percentile
Since
Inception
TWR
Percentile
-49.5% 0.0% -38.0% 0.0% -63.0% 0.0%
-13.1% 25.0% -29.4% 25.0% -35.0% 25.0%
-9.6% 50.0% -23.2% 50.0% -30.7% 50.0%
-3.0% 75.0% -11.3% 75.0% -29.2% 75.0%
8.0% 100.0% -5.1% 100.0% 6.4% 100.0%
Quartile Statistics
-30.8%
10.0%
6
1
-30.8%
33.3%
10
2
-31.9%
10
2
10.0%
8.0%-5.1%
6.4%
-49.5%
-38.0%
-63.0%
-31.9% -30.8% -30.8%
-70%
-60%
-50%
-40%
-30%
-20%
-10%
0%
10%
20%
2006 2007 2008
TW
R R
etu
rn (
Sin
ce
In
ce
pti
on
)
Vintage
Enhanced Investment Performance by Vintage Year
Net ASRS TWR
12
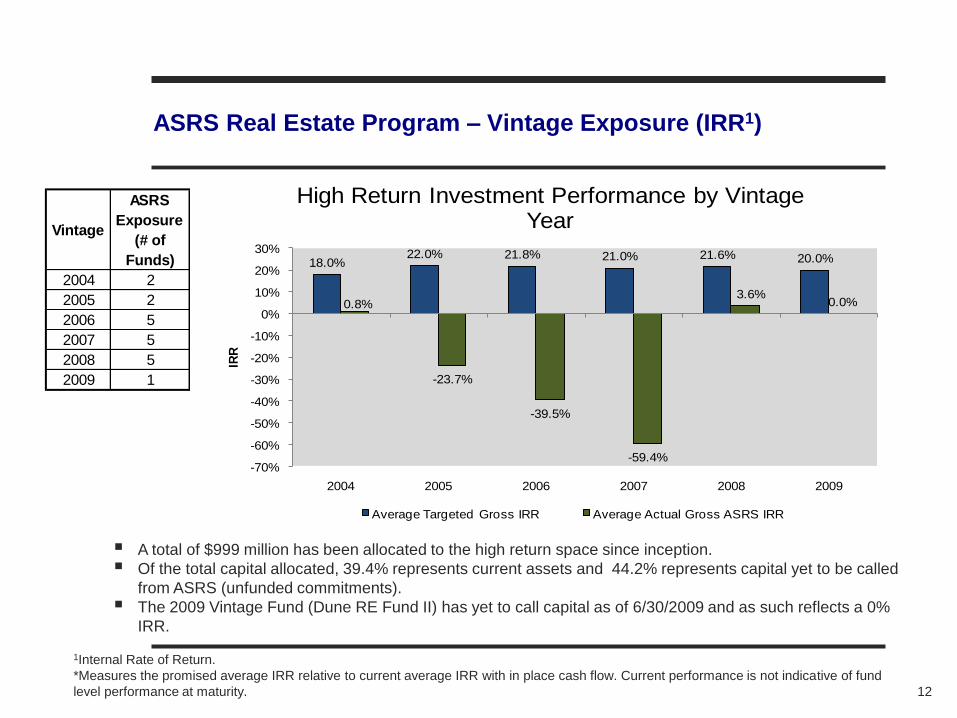
ASRS Real Estate Program – Vintage Exposure (IRR1)
A total of $999 million has been allocated to the high return space since inception.
Of the total capital allocated, 39.4% represents current assets and 44.2% represents capital yet to be called
from ASRS (unfunded commitments).
The 2009 Vintage Fund (Dune RE Fund II) has yet to call capital as of 6/30/2009 and as such reflects a 0%
IRR.
Vintage
ASRS
Exposure
(# of
Funds)
2004 2
2005 2
2006 5
2007 5
2008 5
2009 1
18.0%22.0% 21.8% 21.0% 21.6% 20.0%
0.8%
-23.7%
-39.5%
-59.4%
3.6%0.0%
-70%
-60%
-50%
-40%
-30%
-20%
-10%
0%
10%
20%
30%
2004 2005 2006 2007 2008 2009
IRR
High Return Investment Performance by Vintage Year
Average Targeted Gross IRR Average Actual Gross ASRS IRR
1Internal Rate of Return.
*Measures the promised average IRR relative to current average IRR with in place cash flow. Current performance is not indicative of fund
level performance at maturity.
13
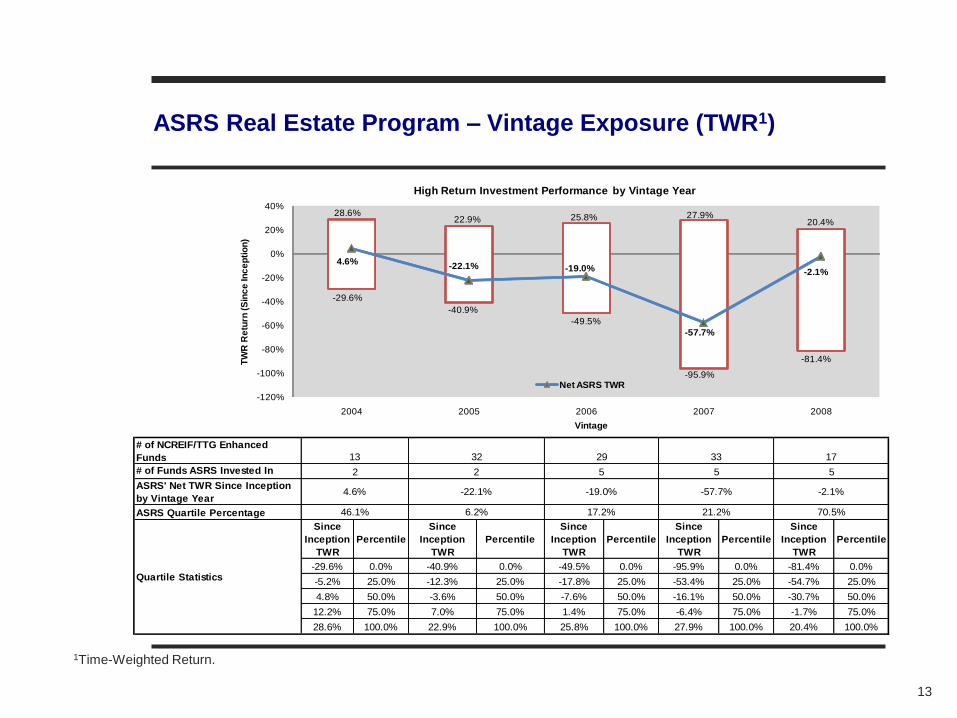
ASRS Real Estate Program – Vintage Exposure (TWR1)
1Time-Weighted Return.
# of NCREIF/TTG Enhanced
Funds
# of Funds ASRS Invested In
ASRS' Net TWR Since Inception
by Vintage Year
ASRS Quartile Percentage
Since
Inception
TWR
Percentile
Since
Inception
TWR
Percentile
Since
Inception
TWR
Percentile
Since
Inception
TWR
Percentile
Since
Inception
TWR
Percentile
-29.6% 0.0% -40.9% 0.0% -49.5% 0.0% -95.9% 0.0% -81.4% 0.0%
-5.2% 25.0% -12.3% 25.0% -17.8% 25.0% -53.4% 25.0% -54.7% 25.0%
4.8% 50.0% -3.6% 50.0% -7.6% 50.0% -16.1% 50.0% -30.7% 50.0%
12.2% 75.0% 7.0% 75.0% 1.4% 75.0% -6.4% 75.0% -1.7% 75.0%
28.6% 100.0% 22.9% 100.0% 25.8% 100.0% 27.9% 100.0% 20.4% 100.0%
5
-22.1%
21.2% 70.5%
29
5
-19.0%
17.2%
33 17
5
6.2%
-57.7% -2.1%
Quartile Statistics
13
2
46.1%
4.6%
32
2
-29.6%
-40.9%
-49.5%
-95.9%
-81.4%
28.6%22.9% 25.8% 27.9%
20.4%
4.6%-22.1% -19.0%
-57.7%
-2.1%
-120%
-100%
-80%
-60%
-40%
-20%
0%
20%
40%
2004 2005 2006 2007 2008
TW
R R
etu
rn (
Sin
ce
In
ce
pti
on
)
Vintage
High Return Investment Performance by Vintage Year
Net ASRS TWR
■ Evaluate Current Market Environment
― Broad based diversification (sectors, styles, location, life cycle) did not protect against the market collapse.
― All portfolio‟s with existing exposure to real estate were impacted.
― Expect “workout” to consume efforts in 2009, 2010 and into 2011.
■ Assess Risk and Exposure
― Identify debt maturities, mark-to-market progress and covenants.
― Expose and monitor assets at risk or those with permanent impairment.
― Identify available equity; whether through unfunded commitments, reserves, future cash flow or other sources.
― Minimize capital loss and stop „good money-after-bad‟ capital requests.
― Consider organizational stability and retention within the General Partnership.
■ Manage Future Portfolio
― Position portfolio to take advantage of inevitable recovery.
― Diversify away from “bad vintages.”
■ Five quarters of „reset‟ has exceeded 30% expected core equity declines
― Not all of NPI index has been revalued
― Write-downs in 2010 will reflect fundamental declines
■ ASRS - One Year Performance Ending June 30, 2009
― Levered Time Weighted Return of -33.3%
― Unlevered Time Weighted Return of -9.9%, assuming current Portfolio leverage of 58% and a 7% WACC.
14
ASRS Portfolio Risk Assessment
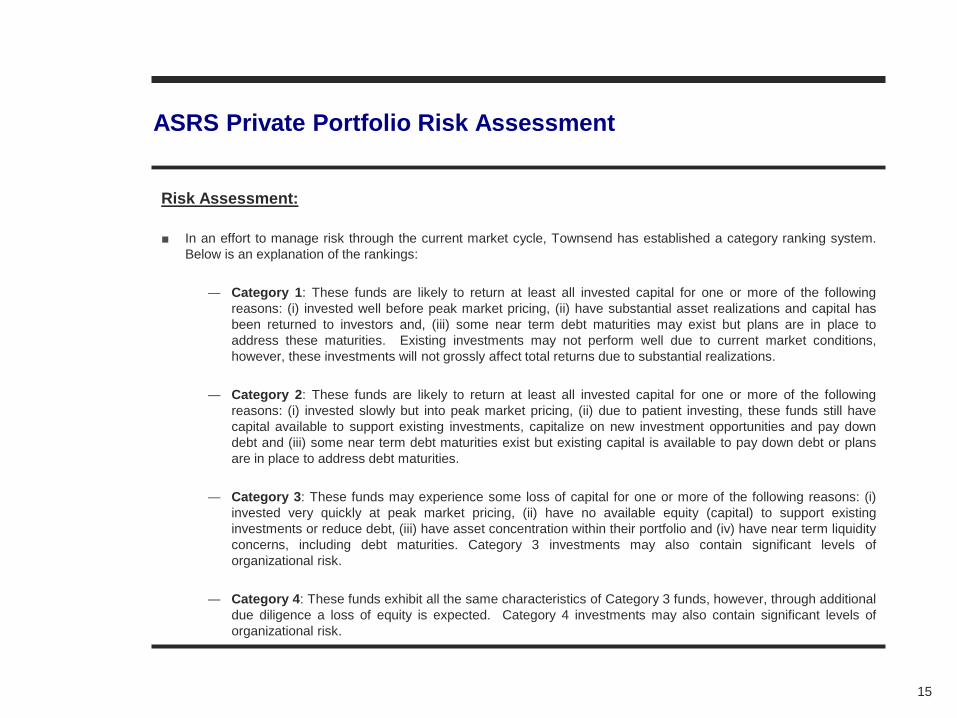
Risk Assessment:
■ In an effort to manage risk through the current market cycle, Townsend has established a category ranking system.
Below is an explanation of the rankings:
― Category 1: These funds are likely to return at least all invested capital for one or more of the following
reasons: (i) invested well before peak market pricing, (ii) have substantial asset realizations and capital has
been returned to investors and, (iii) some near term debt maturities may exist but plans are in place to
address these maturities. Existing investments may not perform well due to current market conditions,
however, these investments will not grossly affect total returns due to substantial realizations.
― Category 2: These funds are likely to return at least all invested capital for one or more of the following
reasons: (i) invested slowly but into peak market pricing, (ii) due to patient investing, these funds still have
capital available to support existing investments, capitalize on new investment opportunities and pay down
debt and (iii) some near term debt maturities exist but existing capital is available to pay down debt or plans
are in place to address debt maturities.
― Category 3: These funds may experience some loss of capital for one or more of the following reasons: (i)
invested very quickly at peak market pricing, (ii) have no available equity (capital) to support existing
investments or reduce debt, (iii) have asset concentration within their portfolio and (iv) have near term liquidity
concerns, including debt maturities. Category 3 investments may also contain significant levels of
organizational risk.
― Category 4: These funds exhibit all the same characteristics of Category 3 funds, however, through additional
due diligence a loss of equity is expected. Category 4 investments may also contain significant levels of
organizational risk.
15
ASRS Private Portfolio Risk Assessment
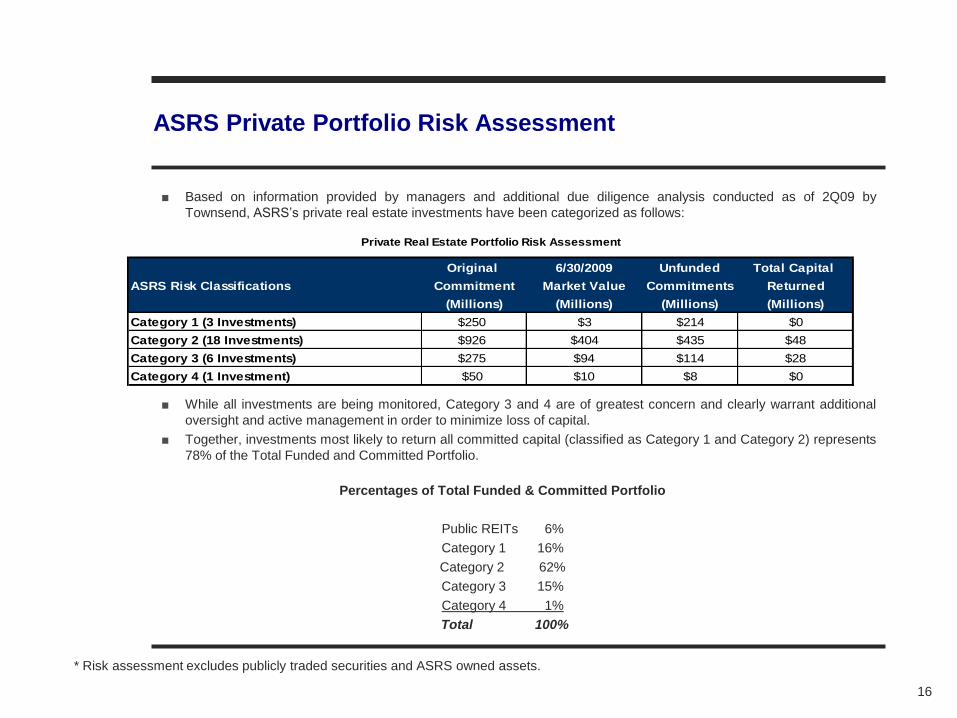
■ Based on information provided by managers and additional due diligence analysis conducted as of 2Q09 by
Townsend, ASRS‟s private real estate investments have been categorized as follows:
■ While all investments are being monitored, Category 3 and 4 are of greatest concern and clearly warrant additional
oversight and active management in order to minimize loss of capital.
■ Together, investments most likely to return all committed capital (classified as Category 1 and Category 2) represents
78% of the Total Funded and Committed Portfolio.
16
ASRS Private Portfolio Risk Assessment
Percentages of Total Funded & Committed Portfolio
Public REITs 6%
Category 1 16%
Category 2 62%
Category 3 15%
Category 4 1%
Total 100%
* Risk assessment excludes publicly traded securities and ASRS owned assets.
Original 6/30/2009 Unfunded Total Capital
ASRS Risk Classifications Commitment Market Value Commitments Returned
(Millions) (Millions) (Millions) (Millions)
Category 1 (3 Investments) $250 $3 $214 $0
Category 2 (18 Investments) $926 $404 $435 $48
Category 3 (6 Investments) $275 $94 $114 $28
Category 4 (1 Investment) $50 $10 $8 $0
Private Real Estate Portfolio Risk Assessment

View of the World
Global Real Estate Investment Opportunities

The Townsend Group
Overview of Global Real Estate Markets
■ Two primary forces shape the world‟s real estate markets:
― The credit crisis
― Questionable economic growth
■ Other forces, such as undersupply in emerging markets, continue to influence
long-term strategic planning but are not central to constructing a global real
estate portfolio today.
18
(8.0)
(6.0)
(4.0)
(2.0)
0.0
2.0
4.0
6.0
8.0
10.0
2004 2005 2006 2007 2008 2009 2010 2011 2012 2013
Gross Domestic Product, Real Annual Growth Rate
World
G7
Transition Economies
Source: Thomson Reuters, Economist Intelligence Unit
The Townsend Group
75% D
ebt
55% D
ebt
Funding Gap
Equity
0
20
40
60
80
100
Initial '07 Capital Stack '09 Capital Stack
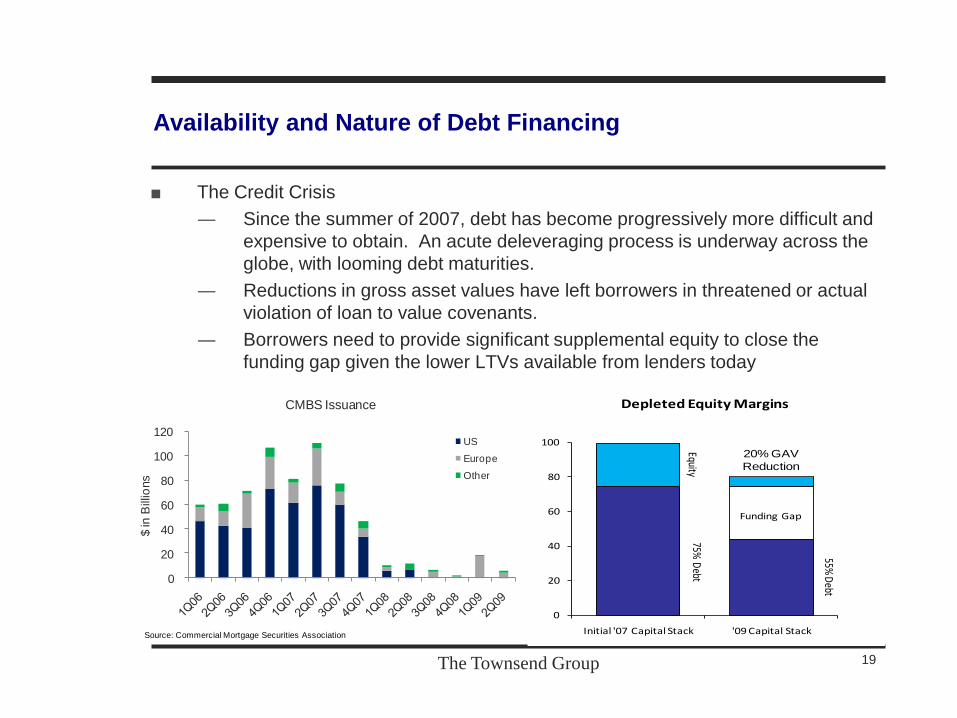
Depleted Equity Margins
20% GAV
Reduction
Availability and Nature of Debt Financing
■ The Credit Crisis
― Since the summer of 2007, debt has become progressively more difficult and
expensive to obtain. An acute deleveraging process is underway across the
globe, with looming debt maturities.
― Reductions in gross asset values have left borrowers in threatened or actual
violation of loan to value covenants.
― Borrowers need to provide significant supplemental equity to close the
funding gap given the lower LTVs available from lenders today
19
0
20
40
60
80
100
120
$ in
Bill
ions
CMBS Issuance
US
Europe
Other
Source: Commercial Mortgage Securities Association
The Townsend Group
-5.2%
-19.6%
1.0%
7.6% 8.5% 9.4%
31.9%
-45.6%
-19.9%
-3.4%
5.2%6.8%
1.8%
6.0% 6.4%5.0%
6.0% 6.6%
20.7%
-29.5%
-8.0%
0.0%
-0.8%
4.7%
15.9%
-26.2%
-8.2%
-2.2% -2.2%
6.9%
16.8%
-26.6%
-8.3%
-1.8%-1.5%
7.0%
-50%
-40%
-30%
-20%
-10%
0%
10%
20%
30%
40%
Quarter 1 year 3 Year 5 Year 10 Year 15 Year
NPI
Wilshire Real Estate Securities Index
Idx: Lehman Brothers Aggregate Bond
Idx: MSCI World Ndtr_D
Idx: Standard & Poor's 500
Idx: Russell 3000
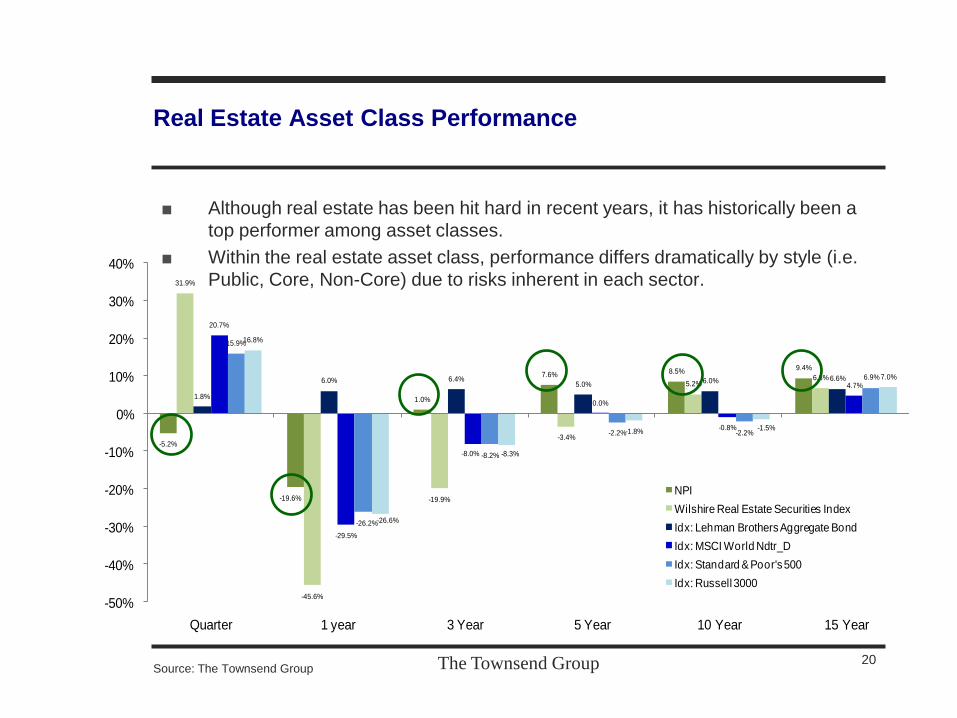
Real Estate Asset Class Performance
■ Although real estate has been hit hard in recent years, it has historically been a
top performer among asset classes.
■ Within the real estate asset class, performance differs dramatically by style (i.e.
Public, Core, Non-Core) due to risks inherent in each sector.
20Source: The Townsend Group
The Townsend Group
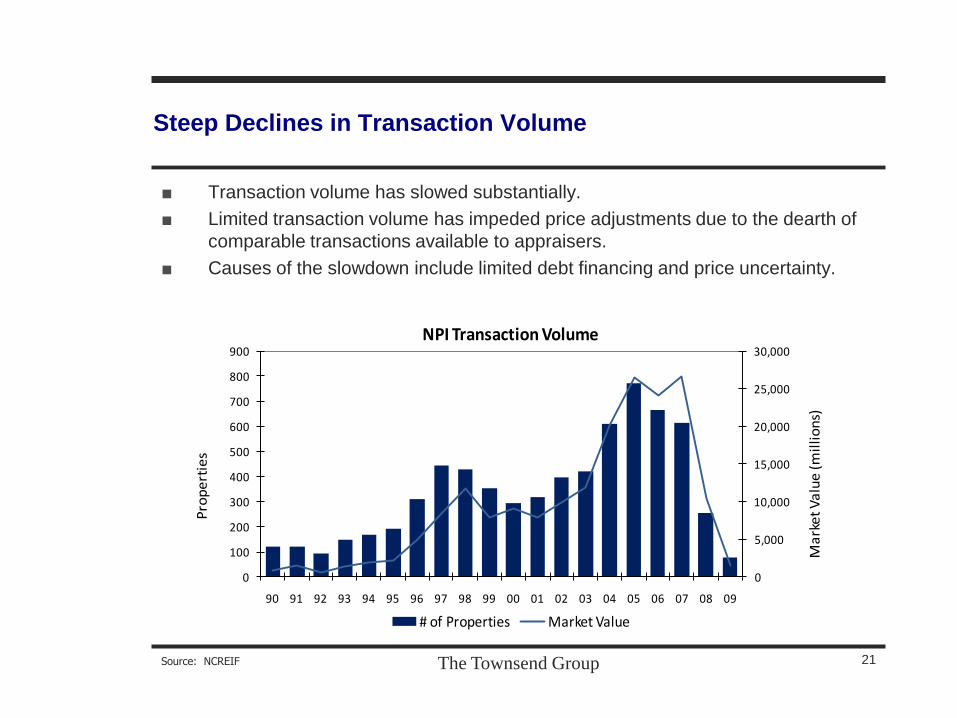
Steep Declines in Transaction Volume
■ Transaction volume has slowed substantially.
■ Limited transaction volume has impeded price adjustments due to the dearth of
comparable transactions available to appraisers.
■ Causes of the slowdown include limited debt financing and price uncertainty.
21Source: NCREIF
0
5,000
10,000
15,000
20,000
25,000
30,000
0
100
200
300
400
500
600
700
800
900
90 91 92 93 94 95 96 97 98 99 00 01 02 03 04 05 06 07 08 09
Ma
rke
t V
alu
e (
mil
lio
ns)
Pro
pe
rtie
s
NPI Transaction Volume
# of Properties Market Value

The Townsend Group
Real Estate Performance
Current Downturn vs. Previous Downturn
■ Although relatively few transactions have occurred, values have adjusted at a
historic rate.
■ Use of high levels of leverage greatly accelerated the pace of write downs.
22
55
60
65
70
75
80
85
90
95
100
0 1 2 3 4 5 6 7 8 9 10 11 12 13 14 15 16 17 18 19 20 21
Cap
ital V
alu
e f
rom
Peak
Quarters f rom Peak
Peak to Trough Capital Return for US ODCE IndexPrevious Major Correction vs. Current through 3rd Qtr Prelim
1990-1994 Correction
Current Correction
Source: The Townsend Group
The Townsend Group
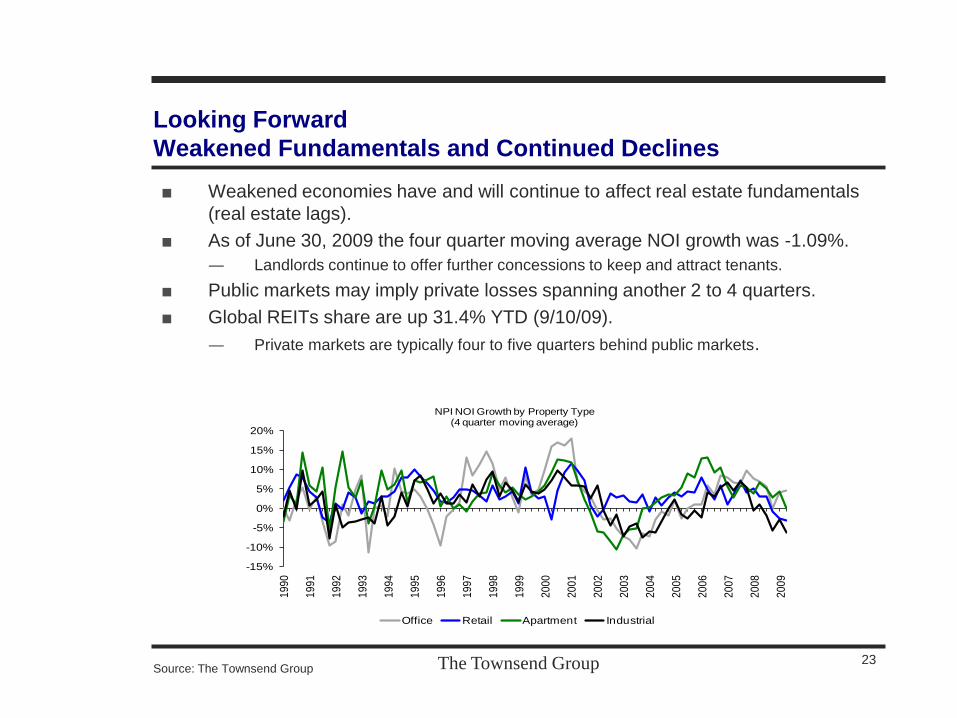
Looking Forward
Weakened Fundamentals and Continued Declines
■ Weakened economies have and will continue to affect real estate fundamentals
(real estate lags).
■ As of June 30, 2009 the four quarter moving average NOI growth was -1.09%.
― Landlords continue to offer further concessions to keep and attract tenants.
■ Public markets may imply private losses spanning another 2 to 4 quarters.
■ Global REITs share are up 31.4% YTD (9/10/09).
― Private markets are typically four to five quarters behind public markets.
23
-15%
-10%
-5%
0%
5%
10%
15%
20%
19
90
19
91
19
92
19
93
19
94
19
95
19
96
19
97
19
98
19
99
20
00
20
01
20
02
20
03
20
04
20
05
20
06
20
07
20
08
20
09
NPI NOI Growth by Property Type(4 quarter moving average)
Office Retail Apartment Industrial
Source: The Townsend Group
The Townsend Group
Looking Forward
Overall Global Themes and Future Opportunities
■ US and Japan offer sharply discounted pricing, with looming debt maturities, as rents continue to roll down. Need to watch for deflation in Japan; a jobless recovery in the US. Little transaction volume to date.
■ Be prepared to capitalize on distress in the market. ASRS‟ capital projections indicate that future capital is available for new commitments to real estate in 2010.
■ Expect U.K to be first economy in Eurozone to return to growth; rents will continue to fall; sharp correction in property values coupled with weak currency is attracting foreign investors.
■ Fewer opportunities in France and Germany until 2011-2014 when assets need restructuring, debt maturities require recapitalization.
■ China and Singapore offer comparatively outsized growth; need to avoid inflation and bubble pricing; Residential leads recovery; Logistics lags.
■ Latin American offers growth, stability and relatively low unemployment. Development is key, with consequent risk of oversupply.
24
The Townsend Group
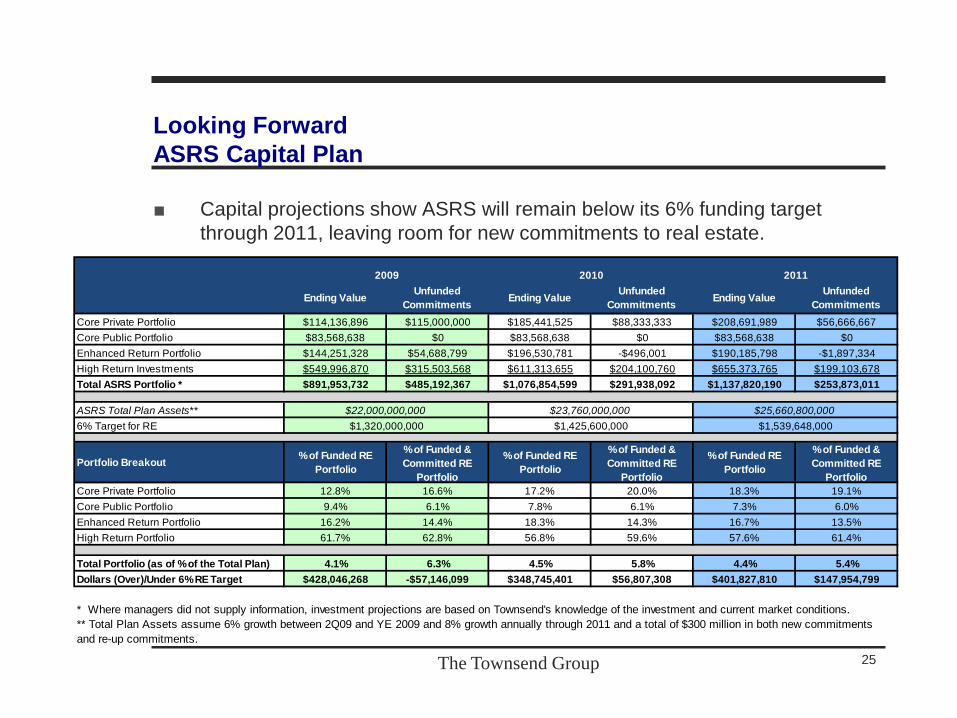
Looking Forward
ASRS Capital Plan
■ Capital projections show ASRS will remain below its 6% funding target
through 2011, leaving room for new commitments to real estate.
25
Ending ValueUnfunded
CommitmentsEnding Value
Unfunded
CommitmentsEnding Value
Unfunded
Commitments
Core Private Portfolio $114,136,896 $115,000,000 $185,441,525 $88,333,333 $208,691,989 $56,666,667
Core Public Portfolio $83,568,638 $0 $83,568,638 $0 $83,568,638 $0
Enhanced Return Portfolio $144,251,328 $54,688,799 $196,530,781 -$496,001 $190,185,798 -$1,897,334
High Return Investments $549,996,870 $315,503,568 $611,313,655 $204,100,760 $655,373,765 $199,103,678
Total ASRS Portfolio * $891,953,732 $485,192,367 $1,076,854,599 $291,938,092 $1,137,820,190 $253,873,011
ASRS Total Plan Assets**
6% Target for RE
Portfolio Breakout% of Funded RE
Portfolio
% of Funded &
Committed RE
Portfolio
% of Funded RE
Portfolio
% of Funded &
Committed RE
Portfolio
% of Funded RE
Portfolio
% of Funded &
Committed RE
Portfolio
Core Private Portfolio 12.8% 16.6% 17.2% 20.0% 18.3% 19.1%
Core Public Portfolio 9.4% 6.1% 7.8% 6.1% 7.3% 6.0%
Enhanced Return Portfolio 16.2% 14.4% 18.3% 14.3% 16.7% 13.5%
High Return Portfolio 61.7% 62.8% 56.8% 59.6% 57.6% 61.4%
Total Portfolio (as of % of the Total Plan) 4.1% 6.3% 4.5% 5.8% 4.4% 5.4%
Dollars (Over)/Under 6% RE Target $428,046,268 -$57,146,099 $348,745,401 $56,807,308 $401,827,810 $147,954,799
* Where managers did not supply information, investment projections are based on Townsend's knowledge of the investment and current market conditions.
** Total Plan Assets assume 6% growth between 2Q09 and YE 2009 and 8% growth annually through 2011 and a total of $300 million in both new commitments
and re-up commitments.
$22,000,000,000
$1,320,000,000
$23,760,000,000
$1,425,600,000
$25,660,800,000
$1,539,648,000
2010 20112009