2009 _ tom green county _ san angelo isd _ 2009 texas school survey of drug and alcohol use _...
Upload: texas-school-survey-of-drug-and-alcohol-use-elementary-reports
Post on 14-Apr-2018
214 views
TRANSCRIPT
7/30/2019 2009 _ tom green county _ san angelo isd _ 2009 texas school survey of drug and alcohol use _ elementary report
http://slidepdf.com/reader/full/2009-tom-green-county-san-angelo-isd-2009-texas-school-survey-of-drug 1/137
Texas School Surveyof Drug and Alcohol Use
2009
San Angelo ISD
Elementary Complete Report
• Introduction
• Elementary District Level Executive Summary with Graphics
• Elementary District Level Report
• Statewide Report with Comparative Tables

7/30/2019 2009 _ tom green county _ san angelo isd _ 2009 texas school survey of drug and alcohol use _ elementary report
http://slidepdf.com/reader/full/2009-tom-green-county-san-angelo-isd-2009-texas-school-survey-of-drug 2/137
©Copyright 2009, Texas A&M University
All rights reserved.
2009 Texas School Survey of Drug and Alcohol Use
Introduction
The Texas School Survey of Drug and Alcohol Use is sponsored by the Texas Commission on
Alcohol and Drug Abuse (TCADA) and implemented by the Public Policy Research Institute (PPRI)
at Texas A&M University. The Texas School Survey project is conducted in two parts. First, a
statewide survey is administered every two years in a sample of districts throughout the state. The
statewide survey helps inform policymakers about the extent and nature of the substance use
problem in Texas schools. It also gives districts conducting local surveys a standard of comparison
for interpreting their own drug and alcohol survey findings.
The second component of the Texas School Survey makes drug and alcohol surveys available for
administration in individual school districts. The Texas School Survey is offered annually to every
school district in the state. TCADA partially supports these district-level administrations byabsorbing the cost of instrument development, funding the preparation of an executive summary of
the local results, and providing state survey data as a basis for interpreting local findings. A local
administration of the Texas School Survey of Drug and Alcohol Use was conducted in your school
district during the Spring of 2009. Your local survey results are presented in this report. Findings
from the statewide assessment, which was conducted in the Spring of 2008, will be presented once
all the data are available.
Organization of the Report
The report is divided into three major sections. Part I, District Results, contains a set of tables and
margins summarizing the secondary and (if applicable) elementary survey data for your district. PartII, State Results, is bound as a companion volume. It will contain a complete set of tables and
margins presenting state results in a format similar to your local report. Part III, Executive
Summary, will contain a customized written synopsis of the local survey results and a complete set
of corresponding figures comparing those local results to the state survey data.
Prior to presenting the results, there are a number of important points that should be considered with
regard to the data cited in this report. These issues relate both to the 2008 statewide survey as well
as to the district-level data from this year. This section briefly presents some basic information
about the development of the report and the limitations of the data.
Background on Local Survey Administration
The Texas School Survey is offered for students in grades four through twelve. Two versions of the
survey instrument have been developed to accommodate both older and younger students. Districts
were asked to limit survey administration to one of a fixed set of grade combinations. Below are

7/30/2019 2009 _ tom green county _ san angelo isd _ 2009 texas school survey of drug and alcohol use _ elementary report
http://slidepdf.com/reader/full/2009-tom-green-county-san-angelo-isd-2009-texas-school-survey-of-drug 3/137
2
©Copyright 2009, Texas A&M UniversityAll rights reserved.
brief descriptions of the elementary and secondary survey instruments and a review of acceptable
grade combinations.
The Texas School Survey Instrument
Two versions of the Texas School Survey are available. The first, a six-page questionnaire, is
designed for secondary students in grades seven through twelve. The secondary survey instrumentexplores usage patterns of twelve drugs including tobacco and alcohol products, inhalants,
marijuana, powdered cocaine, crack, hallucinogens, uppers, downers, Rohypnol, steroids, ecstasy,
and heroin. Other questions pertain to behavioral and demographic correlates of substance use,
problems associated with substance use, and sources of information about help for substance-related
problems.
The secondary survey instrument was revised as part of the 1998 assessment. This revision was
largely a rewording and/or a reformatting of the existing questions in such a manner as to not disrupt
local or statewide over-time analyses. There were, however, a number of additions that were made
as part of this overhaul: Rohypnol and heroin were added to the matrix of illicit substances students
were asked about; a new question was added dealing with parental attitudes toward cigarette; a newquestion was added to ascertain the delivery-system methods most commonly used by those students
who smoke marijuana; and several brief questions were added to gauge the gambling habits of the
student population.
A streamlined, three-page instrument is available for students in grades four through six. The
questions in the elementary survey are similar to those found in the secondary version, but they have
been adapted to be more easily understood by younger respondents (i.e., the language has been
simplified wherever possible, students have been asked about fewer drug alternatives, and some
complex questions have been omitted).
Standard Grade Combinations
In order to make state and local comparisons of substance use across all grades, both the state and
local aggregate percentages must be based upon the same combinations of grades. Otherwise, state
and local data is comparable by individual grade, but overall scores can not be compared directly.
Because the 2008 state survey data was run in only a limited number of grade combinations, districts
were encouraged to administer their local surveys in the following grade groupings:
Elementary Secondary
4 through 6 7 through 12
4 through 5 9 through 128, 10, and 12
If your district did not survey one of the above grade combinations, be aware that you can only
compare your district results to the state data by individual grade. Where districts chose to do other
combinations of grades, no comparable overall percentages for the state data are available. This will
be an especially critical issue for small districts who only receive aggregate data.

7/30/2019 2009 _ tom green county _ san angelo isd _ 2009 texas school survey of drug and alcohol use _ elementary report
http://slidepdf.com/reader/full/2009-tom-green-county-san-angelo-isd-2009-texas-school-survey-of-drug 4/137
3
©Copyright 2009, Texas A&M UniversityAll rights reserved.
Limitations of the Data
A number of subtle factors, such as sampling error and the limitations of self-reported data, can have
a major bearing on the meaning and/or conclusions of the data. In addition, an awareness of the
precise population to which findings can be generalized is also valuable because knowing who was
not included in the survey can be as important as knowing who was included. In the following paragraphs, some of the most significant caveats relating to both the statewide and local findings are
discussed.
Survey Population
In generalizing the results of the state and local surveys, it should be remembered that the data were
collected in public schools. Neither private school students nor drop-outs were sampled though both
represent significant components of the youthful population of Texas. These limitations should be
kept in mind when considering the implications of the data. The findings do, however, represent
reasonable estimates of drug use among the public school population of Texas and offer a suitable
basis of comparison for public school districts.
Self-Reported Data
The drug and alcohol use data are entirely based on self-reported information. While a number of
studies have established the usefulness of self-reported information for estimating the incidence and
prevalence of drug use, the validity of these data ultimately depends on the truthfulness, recall, and
comprehension of respondents. This study is carefully designed to minimize the impact of these
potential sources of error. For example, students who report impossibly high levels of substance use
or use of non-existent drugs are eliminated from the analysis. Further, differences in recall or
comprehension are assumed to be constant across both the state and local survey samples. Any
reporting bias in the data should therefore be approximately equal in both assessments, and comparisons between district and state data should be valid. Nonetheless, the limitations of self-
reported information should be considered when drawing conclusions about the data.
Sampling Error
The 2008 statewide survey data that will be presented at a later date will be based on a sample of
Texas secondary and elementary students. Because a sample rather than the entire population of
students was surveyed, a certain amount of error is introduced when generalizing findings from the
sample to the population. To gauge the size of this error, confidence intervals for all estimates are
ascertained. In general, however, small differences of a few percentage points are usually not
statistically meaningful. Attention should be focused on large differences of five percentage pointsor more.
Survey Protocols and Administration
Finally, the accuracy of the data is dependent upon whether school staff followed Texas School
Survey protocols for the sampling of students.

7/30/2019 2009 _ tom green county _ san angelo isd _ 2009 texas school survey of drug and alcohol use _ elementary report
http://slidepdf.com/reader/full/2009-tom-green-county-san-angelo-isd-2009-texas-school-survey-of-drug 5/137
4
©Copyright 2009, Texas A&M UniversityAll rights reserved.
Analytic Guidelines
In processing the drug and alcohol survey data, there are a number of analytic issues that should be
addressed. These include questions such as how to identify students who are exaggerating their drug
or alcohol use, how best to calculate average substance use figures, how to handle surveys from
students in grades that are not technically being surveyed, and how to classify data for students whofail to report their grade level. This section will review some rules established to deal with these
matters.
Handling of Exaggerators
As discussed above, the survey data presented herein is based entirely upon a respondent’s
description of his or her own behavior. It is inevitable that some students will under- or over-report
their use of drugs or alcohol. To the extent possible, an attempt is made to identify and eliminate
data from those respondents. Two checks have been incorporated into the data analysis program to
identify exaggerators. First, data from students claiming to have used "Oxaril," a non-existent drug,
is considered suspect and dropped from the analyses. Second, students claiming impossibly highlevels of drug or alcohol use are also dropped from the analyses. Unbelievably high substance use
among secondary students is based on the following criteria: (1) students report in that they have
consumed two or more alcoholic beverages every day five or more times; (2) students report hat they
have consumed three or more alcoholic beverages every day; or (3) students report that they have
used three or more illicit drugs (other than tobacco, alcohol, inhalants, marijuana, or steroids) on a
daily basis. Elementary students are considered exaggerators, and are excluded, if they indicated
that they have used five or more substances 11 or more times in either their lifetimes or during the
past school year.
Weighted Aggregate Data
In many districts, the percentage of all enrolled students that actually take the survey varies
substantially by grade. Though patterns are different for each district, typically a larger proportion
of younger students complete the survey compared to their older peers. If a simple average is taken
when calculating overall levels of use, older students may not be represented in proportion to their
numbers. Since these are the very students most likely to use drugs or alcohol, their under-
representation in the aggregate scores results in artificially lower overall levels of substance use.
To achieve more representative percentages when calculating overall or aggregate levels of
substance use, a "weighted average" procedure is used. Prior to calculating the averages, scores for
each grade surveyed are weighted by the total enrollment for that grade. By weighting averages by
actual enrollment, over- or under-sampling in aggregate scores is partially alleviated.
Surveys From "Out-of-Range" Grades
Occasionally, students from a grade that is not technically being surveyed are included in the district
sample. This is primarily a problem where the survey is administered in a non-contiguous grade
combination (e.g., 8, 10, and 12). In these instances, the final sample often contains a few students
who are in "out of range" grade levels. Generally, data for these students is not thrown out. Rather,

7/30/2019 2009 _ tom green county _ san angelo isd _ 2009 texas school survey of drug and alcohol use _ elementary report
http://slidepdf.com/reader/full/2009-tom-green-county-san-angelo-isd-2009-texas-school-survey-of-drug 6/137
5
©Copyright 2009, Texas A&M UniversityAll rights reserved.
it is re-coded and included with the next contiguous grade level. A conservative approach is used
whereby younger students can be grouped with their older peers, but older students can not be re-
coded to a lower grade. This prevents artificially high levels of reported substance use in lower
grades.
There are two cases in which the "out-of-range" data is dropped from the analyses rather than being
re-coded: (1) if there is no contiguous higher grade with which to combine the data; and (2) if thenumber of respondents in "out-of-range" students is greater than ten percent of the grade with which
they are being grouped. This latter measure is designed to prevent a large number of "out of range"
grades from obscuring the true grade-level values.
Surveys In Which No Grade Level Was Reported
When students failed to report their grade level, it is not possible to determine unequivocally with
what grade these students' data should be analyzed. Where grade level is missing, students' data are
retained in the sample and an estimate of grade is made based on his or her age. Students that are at
age level for beginning a grade are included with that grade. If both grade and age are missing, thedata is dropped from the analyses.
Overview of the Data
The Texas School Survey findings for your school district are summarized in this section. Survey
findings are presented in three formats: figures, tables, and margins. Figures portray both state and
local survey results in a "side-by-side" format, allowing for direct comparisons to be made. There
are a total of seven elementary and seventeen secondary figures, although not all of these can be
produced for every school district. All of the figures that can be generated for your district have
been produced.
Two sets of primary and/or secondary tables are available. The first set, the General Substance
Tables, have been reformatted this year in an effort to make them more accessible. These tables have
been divided into five groupings---tobacco, alcohol, illicit drugs, inhalants, and miscellaneous. In
each of these groupings are tables that illustrate general information about substance use patterns in
the district and include prevalence of use, frequency of use, and age of first use. In addition, these
tables highlight certain perceptions, attitudes and, behaviors from the data such as perceived
availability and peer use of various substances, parental attitudes, attending class or operating a
motor vehicle while under the influence of drugs or alcohol, and the use of intoxicants at parties.
The second set, Prevalence Tables, contains fourteen tables showing the percentage of students whohave used specific drugs or alcohol in the past month, past school year, and during their lifetimes.
All tables are available for each participating district. Tables showing the same data for the state are
provided in a companion volume. The only change to these tables made as part of the reformatting,
and applicable only with regard to the secondary reports, was to the percentages listed under the
“School Year” heading. Previously, the percentages in this category excluded those found under the
“Past Month” heading. As reformatted, these “School Year” percentages include the “Past Month”
percentages as well.

7/30/2019 2009 _ tom green county _ san angelo isd _ 2009 texas school survey of drug and alcohol use _ elementary report
http://slidepdf.com/reader/full/2009-tom-green-county-san-angelo-isd-2009-texas-school-survey-of-drug 7/137
6
©Copyright 2009, Texas A&M UniversityAll rights reserved.
Additional data are presented in the margins, which contain the raw percentages of students who
gave each response option for all questions. Keep in mind that if your district under-sampled a
particular grade(s), your overall percentages will represent "weighted averages." As a result, the raw
percentages presented in your margins may reflect weighted counts rather than actual raw counts.
Standards of Data Presentation
A wide variety of school districts took part in the Texas School Survey of Drug and Alcohol Use. In
order to accommodate the diversity of participants, guidelines for organizing and presenting the data
were established. These include standards for handling data from small and mid-sized districts and
for determining which tables and figures should be produced for each. These guidelines are
reviewed below.
Data Aggregation
In some districts, too few students are surveyed to allow for reliable grade-level analyses to be
performed. Where this occurs, data from several grades are grouped together. Grade groupings are
established so as to (1) maximize the number of valid between-group comparisons possible and (2)
protect students' confidentiality. One of three possible data presentation formats is selected for each
district, depending on the number of students per grade. In districts where the number of students
per grade varies widely, a format is selected based on the size of the majority of grades surveyed.
However, if one or more grades fall below a total of thirty students, the next lower level of
aggregation is automatically selected.
The guidelines used for data aggregation are as follows:
Secondary
Small: When there are fewer than thirty students per grade, a single
percentage is shown representing all students.
Medium: When there are thirty to ninety students per grade, percentages are
aggregated into grade groupings (e.g., combining grades 7 and 8 and
grades 9 - 12).
Large: When there are more than ninety students per grade, separate
percentages are shown for each grade level surveyed.
Elementary
Small: When there are fewer than sixty students per grade, a single
percentage is shown for all students.
Large: When there are more than sixty students per grade, separate
percentages are shown for each grade level surveyed.

7/30/2019 2009 _ tom green county _ san angelo isd _ 2009 texas school survey of drug and alcohol use _ elementary report
http://slidepdf.com/reader/full/2009-tom-green-county-san-angelo-isd-2009-texas-school-survey-of-drug 8/137
7
©Copyright 2009, Texas A&M UniversityAll rights reserved.
Availability of Graphics
According to the data aggregation rules outlined above, graphics illustrating data by grade can not be
produced for districts surveying fewer than thirty students per grade. As a consequence, figures that
show grade-level breakdowns are omitted from both the elementary and secondary versions of reports for small districts. With these exceptions, all other figures and tables are produced for every
district regardless of size.
Conventions Used in Data Presentation
Throughout the report, a number of conventions were adopted to maintain consistency in reporting.
A common terminology is employed and a standard set of symbols is used in each table and figure.
These terms and symbols are described in the following paragraphs, beginning with a set of general
definitions and followed by a discussion of specific conventions used in tables and margins.
Definitions
There are several terms used throughout the report that, though seemingly straightforward, may have
some bearing on how the data is understood and interpreted. These definitions are outlined below.
Alcohol. When the category "Alcohol" appears in a figure or table, it represents the combined use of
beer, wine, wine coolers, and liquor. Each of these alcoholic substances may be referenced
individually, as well.
Cocaine or Crack. This reference is found only in the prevalence tables (Tables B1-B14). It refersto students that report using either cocaine or crack, or both cocaine and crack. Since there is some
overlap between students who have used cocaine and those who have used crack, the percentages of
respondents in the "Cocaine or Crack" category should not be a simple sum of percentages in the
individual "Cocaine" and "Crack" categories. It should, however, be at least as great as the larger of
the two individual categories.
Illicit Drugs. These are defined as controlled substances and include marijuana, powdered cocaine,
crack, uppers, downers, Rohypnol, hallucinogens, ecstasy, and heroin.
Inhalants. The overall inhalant use percentages presented in the prevalence tables have been
adjusted to reflect reported use of both specific inhalants and inhalant use generally. Suchadjustments are necessary because some students respond in the positive to specific use (i.e., spray
paint, correction fluid, gasoline, freon, poppers, shoe shine, glue, paint thinner, other sprays, or other
inhalants) without responding in the positive to generic use (i.e., "How many times have you used
inhalants?"), while others respond in the positive to generic use but not to the use of specific
inhalants.

7/30/2019 2009 _ tom green county _ san angelo isd _ 2009 texas school survey of drug and alcohol use _ elementary report
http://slidepdf.com/reader/full/2009-tom-green-county-san-angelo-isd-2009-texas-school-survey-of-drug 9/137
8
©Copyright 2009, Texas A&M UniversityAll rights reserved.
Marijuana Only. This reference is found only in the prevalence tables (Tables B1-B14). It refers to
students who report using marijuana but no other illicit substances. The reference to "Marijuana," in
contrast, includes all students using that substance regardless of whether they used other substances
or not.
Prevalence. The percentage of students who report having used a substance or substances.
Tobacco. The category "tobacco" includes the combined use of cigarettes and smokeless tobacco.
Conventional Symbols and Format
In addition to figures, there are three types of tables in which data may be presented. These include
general substance use tables (Tables 1-24), alcohol tables (Tables A1-A4) and prevalence tables
(Tables B1-B14). Data is also available in its raw form in the margins. What follows are several
conventions of data presentation that apply chiefly to tables and margins.
The Meaning of an Asterisk (*) in Tables. When an asterisk appears in a table, not in the ExecutiveSummary (See Below), in place of a percentage, it typically means that fewer than ten students
responded to that item. Asterisks may also appear if data is not available for a district. This would
be the case, for instance, if a district does not survey all the grades in one of the standard acceptable
grade combinations (see "Standard Grade Combinations" in the previous section).
The Meaning of an Asterisk (*) in The Executive Summary (Part III). When an asterisk appears
alongside a percentage in the Executive Summary component of the report, it means that the data so
marked are estimated to be statistically significant at the .01 level from the comparable data for the
state as a whole. This means that in only one of a hundred samples would a difference this large
have occurred when there was no difference between the district and state data. Differences in very
small districts will seldom be statistically significant due to the small number of cases. Differencesthat are not marked may be important, but should be treated with more caution than those that are so
marked.
Never Used/Ever Used Notations. In all prevalence tables, a standard approach is used for
presenting incidence and prevalence information. An "Ever Used" category shows the total
percentage of students who say they have used a substance at all, regardless of when or how many
times. A "Never Used" category shows the total percentage of students who have never used a
substance. The percentages shown in the "Ever Used" and "Never Used" categories always sum to
one hundred percent.
Additional columns then provide further information about those students who say they have "Ever Used" the substance. This includes information such as when or how often use occurred. These
additional columns, when considered together, do not sum to the total percentage of students in the
"Ever Used" category in the secondary reports due to the inclusion of the “Past Month” percentage
within the “School Year” percentage (See Discussion Above).
Margins. The raw percentage of students who responded to each survey item as found in the tables
that comprise the final section of each report. Frequency and percent are shown for each individual

7/30/2019 2009 _ tom green county _ san angelo isd _ 2009 texas school survey of drug and alcohol use _ elementary report
http://slidepdf.com/reader/full/2009-tom-green-county-san-angelo-isd-2009-texas-school-survey-of-drug 10/137
9
©Copyright 2009, Texas A&M UniversityAll rights reserved.
response option. The frequency shows the absolute number of students who gave the indicated
response. The percent is the frequency converted into a percentage of all students who answered the
question. Again, bear in mind that if your district under-sampled a particular grade(s), your overall
percentages will represent "weighted averages." As a result, the raw percentages presented in your
margins may reflect weighted counts rather than actual raw counts.
Surveys excluded from analyses as exaggerators are not included in the margins.

7/30/2019 2009 _ tom green county _ san angelo isd _ 2009 texas school survey of drug and alcohol use _ elementary report
http://slidepdf.com/reader/full/2009-tom-green-county-san-angelo-isd-2009-texas-school-survey-of-drug 11/137
Texas School Survey
of Drug and Alcohol Use
2009
San Angelo ISD
Part III: Executive Summary
Elementary
Executive Summary
Graphics

7/30/2019 2009 _ tom green county _ san angelo isd _ 2009 texas school survey of drug and alcohol use _ elementary report
http://slidepdf.com/reader/full/2009-tom-green-county-san-angelo-isd-2009-texas-school-survey-of-drug 12/137
©Copyright 2009, Texas A&M University
All rights reserved.
Texas School Survey of Drug and Alcohol Use
San Angelo ISD
Elementary Executive Summary
Introduction The Texas School Survey is an annual collection of self-reported tobacco, alcohol, inhalant, and substance use data from among elementary and/or secondary students in individual districts
throughout the state of Texas. The survey, conducted by the Public Policy Research Institute
(PPRI) in conjunction with the Texas Department of State Health Services (DSHS), is also
administered every other year to a representative sample of Texas students in grades 4 through 6and grades 7 through 12.
Data from the statewide sampling, administered in the Spring of 2008 are incorporated into anover-time database maintained by DSHS to track trends in substance use so that policymakers at
the state level have up-to-date information upon which to base decisions and plot prevention
strategies. These data also serve as an overall standard of comparison for use by those at thedistrict level to interpret, and act upon, local survey findings in a similar way.
The executive summary begins with a section containing a general demographic overview of
those who took the survey in the participating district. This is followed by sections dealing withthe various substances covered by the survey---tobacco, alcohol, inhalants, and marijuana. This
is followed by a section that explores selected characteristics associated with substance use in thedistrict. The summary concludes with a section dealing with where students come by what they
know about drugs and alcohol and to whom they might turn if they thought they were having a
problem.
For context, each section dealing with substance use will begin with a brief, over-time glimpse of
the statewide trends over the last decade and a half with regard to that substance. This isfollowed by a subsection containing items that are generally recognized as contributing to the
environment in which substance use is most likely to occur---such as availability, peer use, and
parental attitudes. Finally, the use data are then detailed.
As for the actual, self-reported use of each substance, it is important to note the frequency of
such use. Is it experimental, a once-in-a-lifetime thing? Or is it a more casual use, a once-in-a-
while behavior? Further, use data are used to differentiate between those who smoke cigarettesfrom those who use a smokeless tobacco product, those who drink beer from those who drink
wine coolers, and those who sniff correction fluid from those who sniff glue.
Two final points should be noted about the data. First, due to the differences in rounding
procedures, there may be slight discrepancies between the percentages referred to in the tables
and those reflected in the executive summary and in the corresponding figures. Second, some
data in this report are marked with an asterisk. Data so marked are estimated to be
7/30/2019 2009 _ tom green county _ san angelo isd _ 2009 texas school survey of drug and alcohol use _ elementary report
http://slidepdf.com/reader/full/2009-tom-green-county-san-angelo-isd-2009-texas-school-survey-of-drug 13/137
©Copyright 2009, Texas A&M University
All rights reserved.
2
statistically significant at the .01 level from the comparable data for the state as a whole.
This means that in only one of a hundred samples would a difference this large have
occurred when there was no difference between the district and state data. Differences in
very small districts will seldom be statistically significant due to the small number of cases.
Differences that are not marked may be important, but should be treated with more
caution than those that are statistically significant.
The percentages referred to in the executive summary that follows were taken from the tables
found in "Part I: District Survey Results." Figures referenced throughout this report are included in "Part III: Executive Summary."

7/30/2019 2009 _ tom green county _ san angelo isd _ 2009 texas school survey of drug and alcohol use _ elementary report
http://slidepdf.com/reader/full/2009-tom-green-county-san-angelo-isd-2009-texas-school-survey-of-drug 14/137
©Copyright 2009, Texas A&M University
All rights reserved.
3
Demographic Overview In the Spring of 2009, The Texas School Survey was administered to students in grades 4
through 6 in the San Angelo Independent School District (SAISD). Texas School Survey protocols, formulated to ensure that the data used in this analysis has an acceptable probability of
error, called for the district to administer the survey to a predetermined sampling of the elementarystudents. The accuracy of the data requires that school staff administering the survey followed the protocols.
A total of 1974 students completed the questionnaire. Of that number, 15 surveys were excluded
from analysis because students did not indicate their grade or age, or because they wereidentified as exaggerators (i.e., claimed to have used a non-existent drug or reported overly
excessive drug use). The final number of surveys included in the overall district analysis was
1959, consisting of:
• Thirty-three percent who are 4th graders, 33 percent who are 5th graders, and 33 percent who
are 6th graders;
• A fairly even split of male (48 percent) and female (52 percent) students;
• An ethnic breakdown that is 50 percent Mexican-American, 38 percent white, 5 percentAfrican-American, 1 percent Asian-American, 1 percent Native American, and 4 percent
other;
• Sixty-one percent who say they live in a two-parent home, and 82 percent who report theyhave lived in the district for three or more years; and
• Forty-four percent who say their parent(s) are college graduates, and 35 percent who indicatethey qualify for free/reduced lunches at school.
7/30/2019 2009 _ tom green county _ san angelo isd _ 2009 texas school survey of drug and alcohol use _ elementary report
http://slidepdf.com/reader/full/2009-tom-green-county-san-angelo-isd-2009-texas-school-survey-of-drug 15/137
©Copyright 2009, Texas A&M University
All rights reserved.
4

7/30/2019 2009 _ tom green county _ san angelo isd _ 2009 texas school survey of drug and alcohol use _ elementary report
http://slidepdf.com/reader/full/2009-tom-green-county-san-angelo-isd-2009-texas-school-survey-of-drug 16/137
©Copyright 2009, Texas A&M University
All rights reserved.
5
Tobacco
General tobacco use includes both cigarettes and smokeless tobacco products.
Statewide Overview. In 1990, a fifth of Texas elementary students reported having
experimented with a tobacco product at least once during their lifetimes, while 13 percent said they had used such a product during the past school year. These percentages inched downward
over the next eight years and then dropped dramatically in the 2000 assessment (13 percent in
their lifetimes and 7 percent in the past year). These downward trend in tobacco use continued in2002 (9 percent in their lifetimes and 5 percent in the past year), 2004 (8 percent in their
lifetimes and 4 percent in the past year), and 2006 (6 percent in their lifetimes and 3 percentduring the past year). According to the 2008 statewide assessment, this downward trend
continues among those who reported lifetime tobacco use (5 percent), while past year tobacco
use held steady at 3 percent. These overall numbers reflect decreases in the use of both the useof cigarettes and smokeless tobacco products; although it appears the more significant movement
is in regard to cigarette use.
District Overview. Overall, the general use of tobacco products among San Angelo ISDelementary students in 2009 was higher than that reported by their counterparts statewide
including statistically significant differences with regard to friends smoking cigarettes, belief that
tobacco use is “very dangerous”, lifetime general tobacco use, past year tobacco use, lifetime
cigarette use, and past month cigarette use.
Environment. Sixteen* percent of district elementary students said some or most of their close
friends smoke cigarettes (12 percent statewide), while 16* percent reported they had been
offered cigarettes (12 percent statewide). Five percent of San Angelo ISD elementary students
reported some or most of their close friends use snuff or chewing tobacco (5 percent statewide),and 7* percent said they had been offered a smokeless tobacco product (5 percent statewide).
The influence of drug education programs may be reflected in students' attitudes toward the useof specific substances. 75* percent of district elementary students believe tobacco use is "very
dangerous" (78 percent statewide) (Fig. 6).
Use. In San Angelo ISD, 7* percent of elementary students reported general tobacco use at least
once during their lifetimes (5 percent statewide) (Fig. 1). Four percent of San Angelo ISD 4th
graders (3 percent statewide), 6 percent of 5th graders (5 percent statewide) and 12* percent of San Angelo6th graders (9 percent statewide) said they had used cigarettes, snuff, or chewing
tobacco at least once during their lifetimes (Figs. 3a and 3b).
Use of a tobacco product during the past school year was reported by 5* percent of San AngeloISD elementary students (3 percent statewide) (Fig. 2). 2 percent of San Angelo ISD 4th graders
(2 percent statewide), 4 percent of San Angelo 5th graders (3 percent statewide), and 8* percent
of 6th graders (5 percent statewide) said they had used cigarettes, snuff, or chewing tobaccoduring the past school year (Figs. 4a and 4b).

7/30/2019 2009 _ tom green county _ san angelo isd _ 2009 texas school survey of drug and alcohol use _ elementary report
http://slidepdf.com/reader/full/2009-tom-green-county-san-angelo-isd-2009-texas-school-survey-of-drug 17/137
©Copyright 2009, Texas A&M University
All rights reserved.
6
Six* percent of San Angelo ISD elementary students reported smoking cigarettes at least onceduring their lifetimes (5 percent statewide), and 4* percent said they had smoked cigarettes
during the past school year (3 percent statewide). Lifetime use of smokeless tobacco products
was reported by 2 percent of San Angelo ISD elementary students (1 percent statewide), while 1
percent said they had used snuff or chewing tobacco during the past school year (1 percentstatewide).

7/30/2019 2009 _ tom green county _ san angelo isd _ 2009 texas school survey of drug and alcohol use _ elementary report
http://slidepdf.com/reader/full/2009-tom-green-county-san-angelo-isd-2009-texas-school-survey-of-drug 18/137
©Copyright 2009, Texas A&M University
All rights reserved.
7
Alcohol Alcohol is the most widely used substance among elementary students statewide and in the San
Angelo ISD.
Statewide Overview. In 1990, 40 percent of Texas elementary students said they had experimented with an alcohol product at some point in their lives and just over a quarter (28 percent) reported having consumed alcohol during the past school year. Over the next two years,
lifetime prevalence dropped dramatically to 33 percent of elementary students statewide, while
past-year use showed a similar decline to 21 percent. This downward trend with regard to
alcohol use has continued through the next three statewide assessments, stalling in 2002 at 25 percent who said they had consumed alcohol at least once in their lifetimes and 16 percent who
reported consuming alcohol during the previous year. These numbers remained flat through the
statewide survey in 2004, but inched downward again in 2006, lifetime prevalence of alcohol usedropped to 22 percent and past-year use dipped to 14 percent. In the most recent statewide
assessment in 2008, those elementary students reporting lifetime alcohol use and past-year
alcohol use rose by a percentage point each, to 23 percent and 15 percent respectively.
Please note that the slight increase in alcohol use in the 2008 statewide assessment is most likely
the result of a change in the definition of “wine coolers” than had been used in all previous
assessments.
District Overview. Overall, San Angelo ISD elementary students were drinking alcohol in 2009
at rates higher than those reported by their counterparts statewide including statistically
significant differences with regard to friends using alcohol, where students obtain alcohol,lifetime alcohol use, past year alcohol use, and students having “two or more drinks” in a row in
the past school year.
Environment. Twenty-seven* percent of San Angelo elementary students said some or most of their close friends drink beer, wine coolers, wine, or liquor (24 percent statewide), and 30*
percent reported they had been offered alcohol (24 percent statewide).
San Angelo ISD elementary students who said they drink alcohol were asked where they obtainthese beverages. Ten percent of district elementary students said they get alcohol from home (9
percent statewide), 5* percent reported obtaining alcohol from friends (3 percent statewide), and
9 percent said they get alcohol from "somewhere else" (8 percent statewide).
Parental attitudes can be a major factor in whether or not a student uses alcohol or drugs. Whenasked how their parents feel about kids their age drinking beer, 84 percent of San Angelo ISDelementary students said their parents "don't like it" (82 percent statewide). Twelve percent of
district elementary students said they "don't know" how their parents feel about kids their age
drinking beer (13 percent statewide), and 3 percent said their parents "don't care" (3 percentstatewide) (Fig. 7).

7/30/2019 2009 _ tom green county _ san angelo isd _ 2009 texas school survey of drug and alcohol use _ elementary report
http://slidepdf.com/reader/full/2009-tom-green-county-san-angelo-isd-2009-texas-school-survey-of-drug 19/137
©Copyright 2009, Texas A&M University
All rights reserved.
8
Seventy-two percent of San Angelo elementary students believe alcohol use is "very dangerous"
(72 percent statewide) (Fig. 6).
Use. Twenty-six* percent of San Angelo ISD elementary students reported using alcohol at least
once during their lifetimes (23 percent statewide) (Fig. 1). Eighteen percent of San Angelo ISD
4th graders (17 percent statewide), 22 percent of 5th graders (22 percent statewide) and 39* percent of 6th graders said they had consumed alcohol at least once during their lifetimes (31
percent statewide) (Figs. 3a and 3b).
Alcohol use during the past school year was reported by 18 percent of San Angelo ISDelementary students (15 percent statewide) (Fig. 2). Twelve percent of San Angelo ISD 4th
graders (11 percent statewide), 14 percent of 5th graders (14 percent statewide) and 26* percent
of 6th graders (21 percent statewide) said they had consumed alcohol during the past school year (Figs. 4a and 4b).
Thirteen percent of San Angelo ISD elementary students said they "had two or more drinks" of
beer in a row at least once during the past year (12 percent statewide), 7 percent said they "had two or more drinks" of wine cooler in a row at least once during the past year (8 percent
statewide), 12* percent said they "had two or more drinks" of wine in a row (9 percent statewide)
and 6 percent San Angelo said they "had two or more drinks" of liquor in a row at least once inthe past year (5 percent statewide).
7/30/2019 2009 _ tom green county _ san angelo isd _ 2009 texas school survey of drug and alcohol use _ elementary report
http://slidepdf.com/reader/full/2009-tom-green-county-san-angelo-isd-2009-texas-school-survey-of-drug 20/137
©Copyright 2009, Texas A&M University
All rights reserved.
9
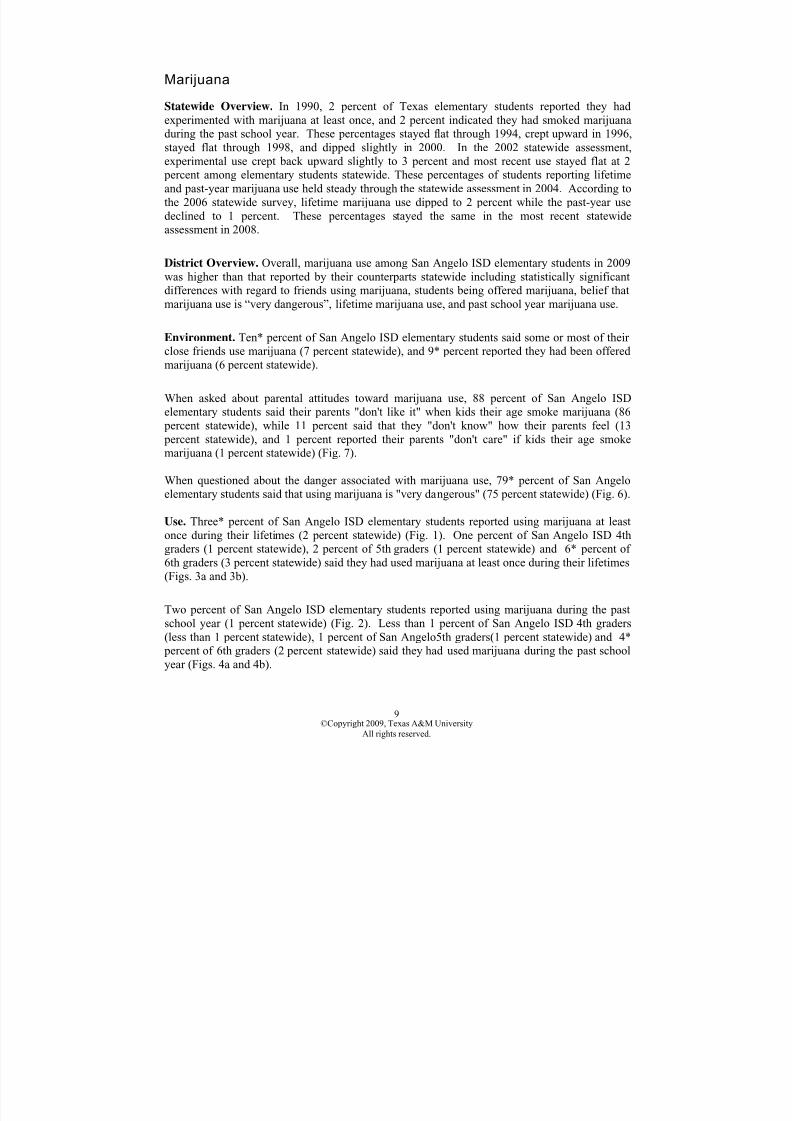
Marijuana Statewide Overview. In 1990, 2 percent of Texas elementary students reported they had
experimented with marijuana at least once, and 2 percent indicated they had smoked marijuanaduring the past school year. These percentages stayed flat through 1994, crept upward in 1996,
stayed flat through 1998, and dipped slightly in 2000. In the 2002 statewide assessment,experimental use crept back upward slightly to 3 percent and most recent use stayed flat at 2 percent among elementary students statewide. These percentages of students reporting lifetime
and past-year marijuana use held steady through the statewide assessment in 2004. According to
the 2006 statewide survey, lifetime marijuana use dipped to 2 percent while the past-year use
declined to 1 percent. These percentages stayed the same in the most recent statewideassessment in 2008.
District Overview. Overall, marijuana use among San Angelo ISD elementary students in 2009
was higher than that reported by their counterparts statewide including statistically significantdifferences with regard to friends using marijuana, students being offered marijuana, belief that
marijuana use is “very dangerous”, lifetime marijuana use, and past school year marijuana use.
Environment. Ten* percent of San Angelo ISD elementary students said some or most of their close friends use marijuana (7 percent statewide), and 9* percent reported they had been offered
marijuana (6 percent statewide).
When asked about parental attitudes toward marijuana use, 88 percent of San Angelo ISDelementary students said their parents "don't like it" when kids their age smoke marijuana (86
percent statewide), while 11 percent said that they "don't know" how their parents feel (13
percent statewide), and 1 percent reported their parents "don't care" if kids their age smoke
marijuana (1 percent statewide) (Fig. 7).
When questioned about the danger associated with marijuana use, 79* percent of San Angeloelementary students said that using marijuana is "very dangerous" (75 percent statewide) (Fig. 6).
Use. Three* percent of San Angelo ISD elementary students reported using marijuana at least
once during their lifetimes (2 percent statewide) (Fig. 1). One percent of San Angelo ISD 4thgraders (1 percent statewide), 2 percent of 5th
graders (1 percent statewide) and 6* percent of
6th graders (3 percent statewide) said they had used marijuana at least once during their lifetimes
(Figs. 3a and 3b).
Two percent of San Angelo ISD elementary students reported using marijuana during the pastschool year (1 percent statewide) (Fig. 2). Less than 1 percent of San Angelo ISD 4th graders
(less than 1 percent statewide), 1 percent of San Angelo5th graders(1 percent statewide) and 4* percent of 6th graders (2 percent statewide) said they had used marijuana during the past school
year (Figs. 4a and 4b).

7/30/2019 2009 _ tom green county _ san angelo isd _ 2009 texas school survey of drug and alcohol use _ elementary report
http://slidepdf.com/reader/full/2009-tom-green-county-san-angelo-isd-2009-texas-school-survey-of-drug 21/137
©Copyright 2009, Texas A&M University
All rights reserved.
10
7/30/2019 2009 _ tom green county _ san angelo isd _ 2009 texas school survey of drug and alcohol use _ elementary report
http://slidepdf.com/reader/full/2009-tom-green-county-san-angelo-isd-2009-texas-school-survey-of-drug 22/137
©Copyright 2009, Texas A&M University
All rights reserved.
11
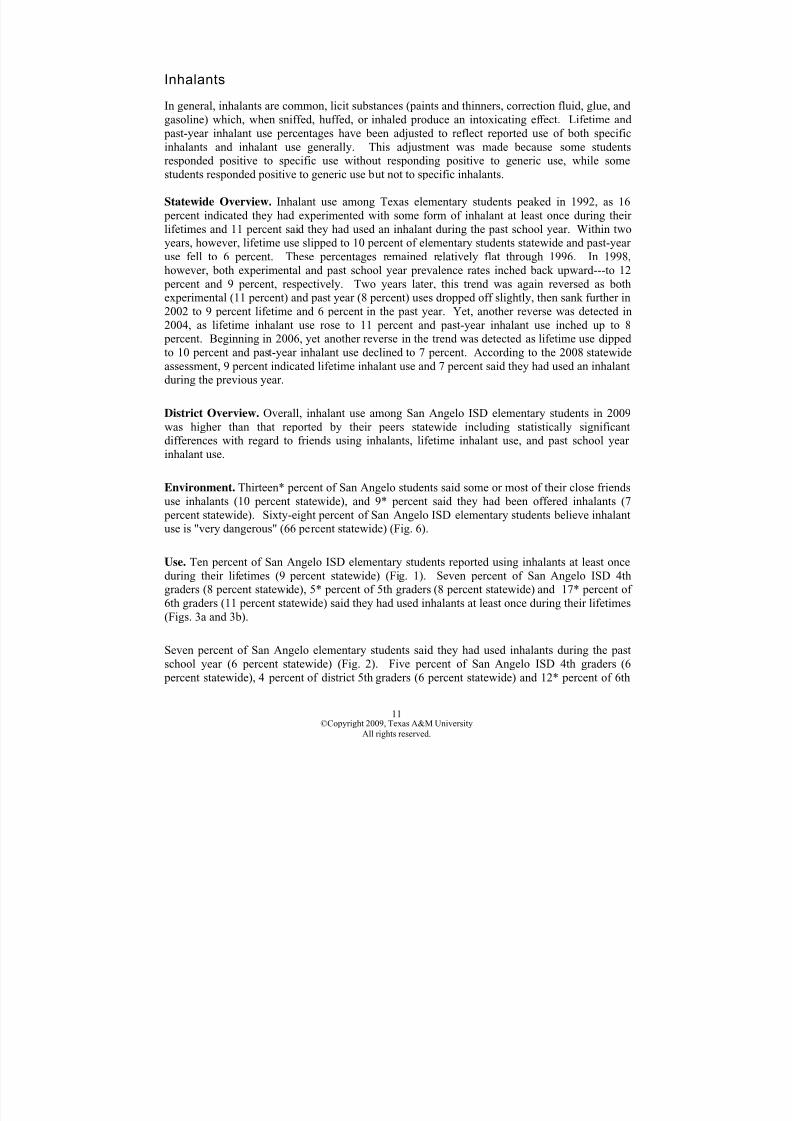
Inhalants
In general, inhalants are common, licit substances (paints and thinners, correction fluid, glue, and
gasoline) which, when sniffed, huffed, or inhaled produce an intoxicating effect. Lifetime and
past-year inhalant use percentages have been adjusted to reflect reported use of both specific
inhalants and inhalant use generally. This adjustment was made because some studentsresponded positive to specific use without responding positive to generic use, while some
students responded positive to generic use but not to specific inhalants.
Statewide Overview. Inhalant use among Texas elementary students peaked in 1992, as 16
percent indicated they had experimented with some form of inhalant at least once during their
lifetimes and 11 percent said they had used an inhalant during the past school year. Within twoyears, however, lifetime use slipped to 10 percent of elementary students statewide and past-year
use fell to 6 percent. These percentages remained relatively flat through 1996. In 1998,
however, both experimental and past school year prevalence rates inched back upward---to 12
percent and 9 percent, respectively. Two years later, this trend was again reversed as both
experimental (11 percent) and past year (8 percent) uses dropped off slightly, then sank further in2002 to 9 percent lifetime and 6 percent in the past year. Yet, another reverse was detected in
2004, as lifetime inhalant use rose to 11 percent and past-year inhalant use inched up to 8 percent. Beginning in 2006, yet another reverse in the trend was detected as lifetime use dipped
to 10 percent and past-year inhalant use declined to 7 percent. According to the 2008 statewide
assessment, 9 percent indicated lifetime inhalant use and 7 percent said they had used an inhalantduring the previous year.
District Overview. Overall, inhalant use among San Angelo ISD elementary students in 2009
was higher than that reported by their peers statewide including statistically significantdifferences with regard to friends using inhalants, lifetime inhalant use, and past school year
inhalant use.
Environment. Thirteen* percent of San Angelo students said some or most of their close friends
use inhalants (10 percent statewide), and 9* percent said they had been offered inhalants (7
percent statewide). Sixty-eight percent of San Angelo ISD elementary students believe inhalantuse is "very dangerous" (66 percent statewide) (Fig. 6).
Use. Ten percent of San Angelo ISD elementary students reported using inhalants at least once
during their lifetimes (9 percent statewide) (Fig. 1). Seven percent of San Angelo ISD 4thgraders (8 percent statewide), 5* percent of 5th graders (8 percent statewide) and 17* percent of
6th graders (11 percent statewide) said they had used inhalants at least once during their lifetimes(Figs. 3a and 3b).
Seven percent of San Angelo elementary students said they had used inhalants during the past
school year (6 percent statewide) (Fig. 2). Five percent of San Angelo ISD 4th graders (6
percent statewide), 4 percent of district 5th graders (6 percent statewide) and 12* percent of 6th

7/30/2019 2009 _ tom green county _ san angelo isd _ 2009 texas school survey of drug and alcohol use _ elementary report
http://slidepdf.com/reader/full/2009-tom-green-county-san-angelo-isd-2009-texas-school-survey-of-drug 23/137
©Copyright 2009, Texas A&M University
All rights reserved.
12
graders (8 percent statewide) said they had used inhalants during the past school year (Figs. 4a
and 4b).
Four percent of San Angelo elementary students reported using two or more inhalant substances
at least once during their lifetimes (4 percent statewide). Two percent of district elementary
students reported inhaling whiteout/correction fluid (2 percent statewide), 2 percent reported inhaling glue (3 percent statewide), 3 percent reported inhaling spray paint (3 percent statewide),
2 percent reported inhaling gasoline (3 percent statewide), 2 percent reported inhaling paint
thinner (2 percent statewide) and 6* percent reported inhaling substances in the "other inhalants"category (4 percent statewide) at least once during their lifetimes (Figs. 5a and 5b).

7/30/2019 2009 _ tom green county _ san angelo isd _ 2009 texas school survey of drug and alcohol use _ elementary report
http://slidepdf.com/reader/full/2009-tom-green-county-san-angelo-isd-2009-texas-school-survey-of-drug 24/137
©Copyright 2009, Texas A&M University
All rights reserved.
13
Drug and Alcohol Information The influence of drug education programs may be reflected in students’ attitudes toward the use
of the specific substances reported above.
Eighty-seven percent of San Angelo ISD elementary students said they had gotten informationabout drugs and alcohol from a school source since classes began in the Fall (86 percentstatewide). Sixty-one percent of San Angelo ISD elementary students said their teacher was a
source for information about drugs and alcohol (58 percent statewide), while 59* percent said a
visitor to class was a source for this information (46 percent statewide) and 52* percent reported
getting information about drugs and alcohol from a school assembly program (58 percentstatewide).
7/30/2019 2009 _ tom green county _ san angelo isd _ 2009 texas school survey of drug and alcohol use _ elementary report
http://slidepdf.com/reader/full/2009-tom-green-county-san-angelo-isd-2009-texas-school-survey-of-drug 25/137
Texas School Survey
of Drug and Alcohol Use
2009
Part III: Executive Summary
Elementary Graphics
Figure 1 Prevalence of Lifetime Substance Use
Figure 2 Prevalence of Past School Year Use
Figure 3 Lifetime Prevalence of Specific Inhalants by Grade
Figure 4 Prevalence of Past School Year Substance Use
Figure 5 Lifetime Prevalence of Specific Inhalants
Figure 6 Students Who Think Substances are Very Dangerous
Figure 7 Parental Attitudes toward Beer and Marijuana Use

7/30/2019 2009 _ tom green county _ san angelo isd _ 2009 texas school survey of drug and alcohol use _ elementary report
http://slidepdf.com/reader/full/2009-tom-green-county-san-angelo-isd-2009-texas-school-survey-of-drug 26/137
Figure 1Prevalence of Li fetime Substance Use Among Elementary St
5%
23
9%
7%
10%
Tobacco
Alcohol
Inhalants
2%
3%
0% 5% 10% 15% 20%
Marijuana
State San Angelo

7/30/2019 2009 _ tom green county _ san angelo isd _ 2009 texas school survey of drug and alcohol use _ elementary report
http://slidepdf.com/reader/full/2009-tom-green-county-san-angelo-isd-2009-texas-school-survey-of-drug 27/137
Figure 2Prevalence of Past School Year Substance Use Among Elementa
3%
15%
6%
5%
7%
Tobacco
Alcohol
Inhalants
1%
2%
0% 2% 4% 6% 8% 10% 12% 14% 16
Marijuana
State San Angelo

7/30/2019 2009 _ tom green county _ san angelo isd _ 2009 texas school survey of drug and alcohol use _ elementary report
http://slidepdf.com/reader/full/2009-tom-green-county-san-angelo-isd-2009-texas-school-survey-of-drug 28/137
Figure 3aPrevalence of Lifetime Substance Use By Grade
San Angelo
18%
22%
12%
39%
17%
15%
20%
25%
30%
35%
40%
4%
7%6%
5%
0%
5%
10%
Tobacco Alcohol Inhalants
Grade 4 Grade 5 Grade 6

7/30/2019 2009 _ tom green county _ san angelo isd _ 2009 texas school survey of drug and alcohol use _ elementary report
http://slidepdf.com/reader/full/2009-tom-green-county-san-angelo-isd-2009-texas-school-survey-of-drug 29/137
Figure 3bPrevalence of Lifetime Substance Use By Grade
State
17%
22%
31%
15%
20%
25%
30%
35%
40%
3%
8%
5%
8%9%
0%
5%
10%
Tobacco Alcohol Inhalants
Grade 4 Grade 5 Grade 6
7/30/2019 2009 _ tom green county _ san angelo isd _ 2009 texas school survey of drug and alcohol use _ elementary report
http://slidepdf.com/reader/full/2009-tom-green-county-san-angelo-isd-2009-texas-school-survey-of-drug 30/137
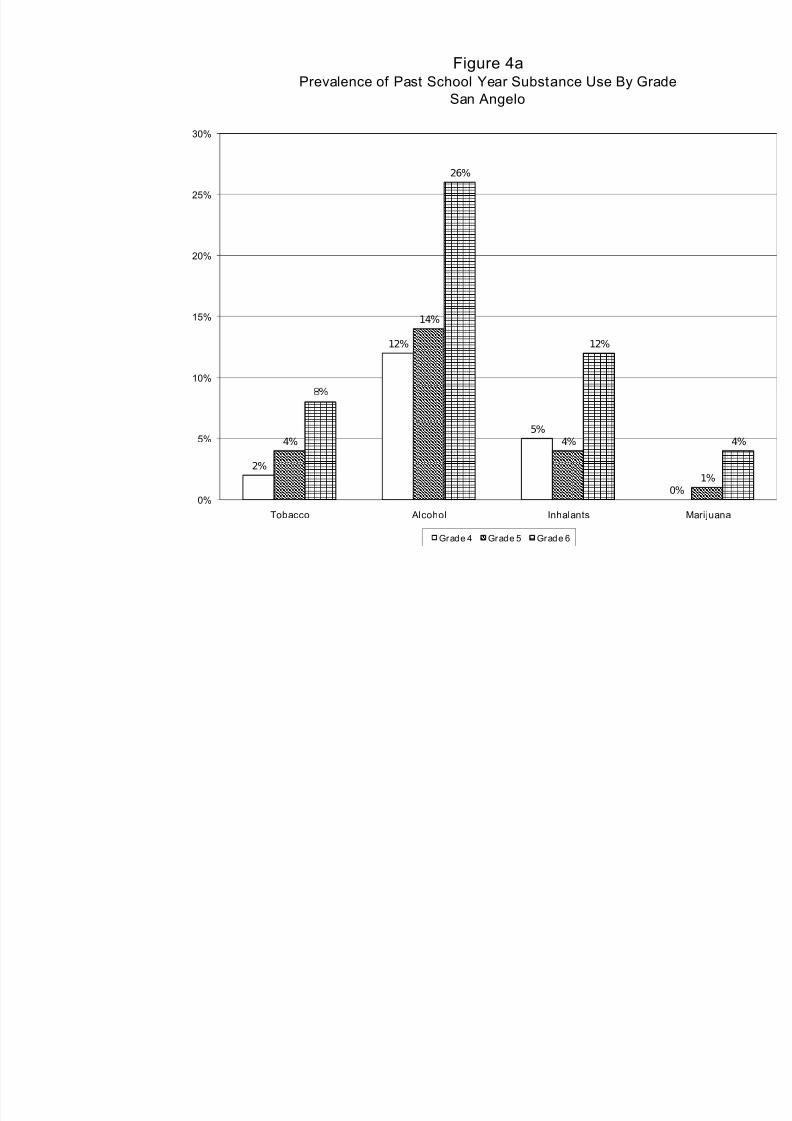
Figure 4aPrevalence of Past School Year Substance Use By Grad
San Angelo
12%
14%
26%
12%
10%
15%
20%
25%
30%
2%
5%
4% 4%
0%
5%
Tobacco Alcohol Inhalants
Grade 4 Grade 5 Grade 6

7/30/2019 2009 _ tom green county _ san angelo isd _ 2009 texas school survey of drug and alcohol use _ elementary report
http://slidepdf.com/reader/full/2009-tom-green-county-san-angelo-isd-2009-texas-school-survey-of-drug 31/137
Figure 4bPrevalence of Past School Year Substance Use By Grad
State
11%
14%
21%
10%
15%
20%
25%
30%
2%
6%
3%
6%
5%
0%
5%
Tobacco Alcohol Inhalants
Grade 4 Grade 5 Grade 6

7/30/2019 2009 _ tom green county _ san angelo isd _ 2009 texas school survey of drug and alcohol use _ elementary report
http://slidepdf.com/reader/full/2009-tom-green-county-san-angelo-isd-2009-texas-school-survey-of-drug 32/137
Figure 5aLifetime Prevalence of Specif ic Inhalants By Grade
San Angelo
2%
1%
2%
1%
2%
1%
1%
1%
3%
3%
4%
3%
Gasoline
Paint Thinner
Glue
Correction Fluid
3%
2%
2%
6%
12%
0% 2% 4% 6% 8% 10% 12% 14% 1
Spray Paint
Other
Grade 4 Grade 5 Grade 6

7/30/2019 2009 _ tom green county _ san angelo isd _ 2009 texas school survey of drug and alcohol use _ elementary report
http://slidepdf.com/reader/full/2009-tom-green-county-san-angelo-isd-2009-texas-school-survey-of-drug 33/137
Figure 5bLifetime Prevalence of Specif ic Inhalants By Grade
State
3%
2%
4%
2%
2%
2%
3%
2%
3%
2%
2%
4%
Gasoline
Paint Thinner
Glue
Correction Fluid
3%
2%
4%
3%
6%
0% 1% 2% 3% 4% 5% 6% 7%
Spray Paint
Other
Grade 4 Grade 5 Grade 6

7/30/2019 2009 _ tom green county _ san angelo isd _ 2009 texas school survey of drug and alcohol use _ elementary report
http://slidepdf.com/reader/full/2009-tom-green-county-san-angelo-isd-2009-texas-school-survey-of-drug 34/137
Figure 6Percentage of Elementary Students Who Think Various Substances Are Ve
Tobacco
Alcohol
Inhalants
0% 10% 20% 30% 40% 50% 60%
Marijuana
State San Angelo

7/30/2019 2009 _ tom green county _ san angelo isd _ 2009 texas school survey of drug and alcohol use _ elementary report
http://slidepdf.com/reader/full/2009-tom-green-county-san-angelo-isd-2009-texas-school-survey-of-drug 35/137
Figure 7Attitudes of Parents Toward Pre-Adolescent Beer And Mariju
3%
1%
13%
3%
1%
12%
Beer
Don't Like It
Don't Care
Think It's OK
Don't Know
Marijuana
Don't Like It
1%
0%
13%
1%
0%
11%
0% 10% 20% 30% 40% 50% 60% 70%
Don't Care
Think It's OK
Don't Know
State San Angelo

7/30/2019 2009 _ tom green county _ san angelo isd _ 2009 texas school survey of drug and alcohol use _ elementary report
http://slidepdf.com/reader/full/2009-tom-green-county-san-angelo-isd-2009-texas-school-survey-of-drug 36/137
San Angelo
Spring 2009
©Copyright 2009, Texas A&M University
All rights reserved.
Elementary Report-Page 1 of 51
Texas School Survey
of Drug and Alcohol Use
2009
San Angelo ISD
Part I: District Results

7/30/2019 2009 _ tom green county _ san angelo isd _ 2009 texas school survey of drug and alcohol use _ elementary report
http://slidepdf.com/reader/full/2009-tom-green-county-san-angelo-isd-2009-texas-school-survey-of-drug 37/137
San Angelo
Spring 2009
©Copyright 2009, Texas A&M University
All rights reserved.
Elementary Report-Page 2 of 51

7/30/2019 2009 _ tom green county _ san angelo isd _ 2009 texas school survey of drug and alcohol use _ elementary report
http://slidepdf.com/reader/full/2009-tom-green-county-san-angelo-isd-2009-texas-school-survey-of-drug 38/137
San Angelo
Spring 2009
©Copyright 2009, Texas A&M University
All rights reserved.
Elementary Report-Page 3 of 51
Part I: Distric t ResultsElementary (4-6 Large)
Table of Contents
General Substance Tables 5-28
TobaccoAlcoholDrugsInhalantsMiscellaneous
Prevalence Tables 29-42
Selected Substances by Grade:
Table B1: All Students Table B2: Male Students Table B3: Female Students Table B4: White Students Table B5: African/American Students Table B6: Mexican/American Students Table B7: Students Reporting A Grades Table B8: Students Reporting Grades Lower Than an A Table B9: Students Living With 2 Parents Table B10: Students Not Living With 2 Parents Table B11: Students Living in Town More Than 3 Years Table B12: Students Living in Town 3 Years or Less
Margin Tables 43-51

7/30/2019 2009 _ tom green county _ san angelo isd _ 2009 texas school survey of drug and alcohol use _ elementary report
http://slidepdf.com/reader/full/2009-tom-green-county-san-angelo-isd-2009-texas-school-survey-of-drug 39/137
San Angelo
Spring 2009
©Copyright 2009, Texas A&M University
All rights reserved.
Elementary Report-Page 4 of 51

7/30/2019 2009 _ tom green county _ san angelo isd _ 2009 texas school survey of drug and alcohol use _ elementary report
http://slidepdf.com/reader/full/2009-tom-green-county-san-angelo-isd-2009-texas-school-survey-of-drug 40/137
San Angelo
Spring 2009
©Copyright 2009, Texas A&M University
All rights reserved.
Elementary Report-Page 5 of 51
1. General Substance Tables

7/30/2019 2009 _ tom green county _ san angelo isd _ 2009 texas school survey of drug and alcohol use _ elementary report
http://slidepdf.com/reader/full/2009-tom-green-county-san-angelo-isd-2009-texas-school-survey-of-drug 41/137
San Angelo
Spring 2009
©Copyright 2009, Texas A&M University
All rights reserved.
Elementary Report-Page 6 of 51

7/30/2019 2009 _ tom green county _ san angelo isd _ 2009 texas school survey of drug and alcohol use _ elementary report
http://slidepdf.com/reader/full/2009-tom-green-county-san-angelo-isd-2009-texas-school-survey-of-drug 42/137
San Angelo
Spring 2009
©Copyright 2009, Texas A&M University
All rights reserved.
Elementary Report-Page 7 of 51
Table T-1: How recently, if ever, have you used...
Ever
Used
School
Year
Not Past
Year
Never
Used
Any tobacco product
All 7.4% 4.7% 2.6% 92.6%
Grade 4 3.8% 2.4% 1.4% 96.2%
Grade 5 6.2% 4.1% 2.1% 93.8%
Grade 6 12.2% 7.7% 4.4% 87.8%
Cigarettes
All 6.3% 4.1% 2.3% 93.7%
Grade 4 2.6% 1.9% 0.7% 97.4%
Grade 5 5.7% 3.8% 2.0% 94.3%
Grade 6 10.7% 6.5% 4.2% 89.3%
Smokeless tobacco
All 2.1% 1.2% 0.9% 97.9%
Grade 4 1.6% 0.9% 0.7% 98.4%
Grade 5 1.2% 0.3% 0.9% 98.8%Grade 6 3.5% 2.3% 1.2% 96.5%
Table T-2: Average number of times selected tobacco products were used by thosewho reported use of ..
School
Year Lifetime
All 3.5 3.3
Grade 4 2.0 1.9
Grade 5 2.7 3.4
Grade 6 4.4 3.6
7/30/2019 2009 _ tom green county _ san angelo isd _ 2009 texas school survey of drug and alcohol use _ elementary report
http://slidepdf.com/reader/full/2009-tom-green-county-san-angelo-isd-2009-texas-school-survey-of-drug 43/137
San Angelo
Spring 2009
©Copyright 2009, Texas A&M University
All rights reserved.Elementary Report-Page 8 of 51
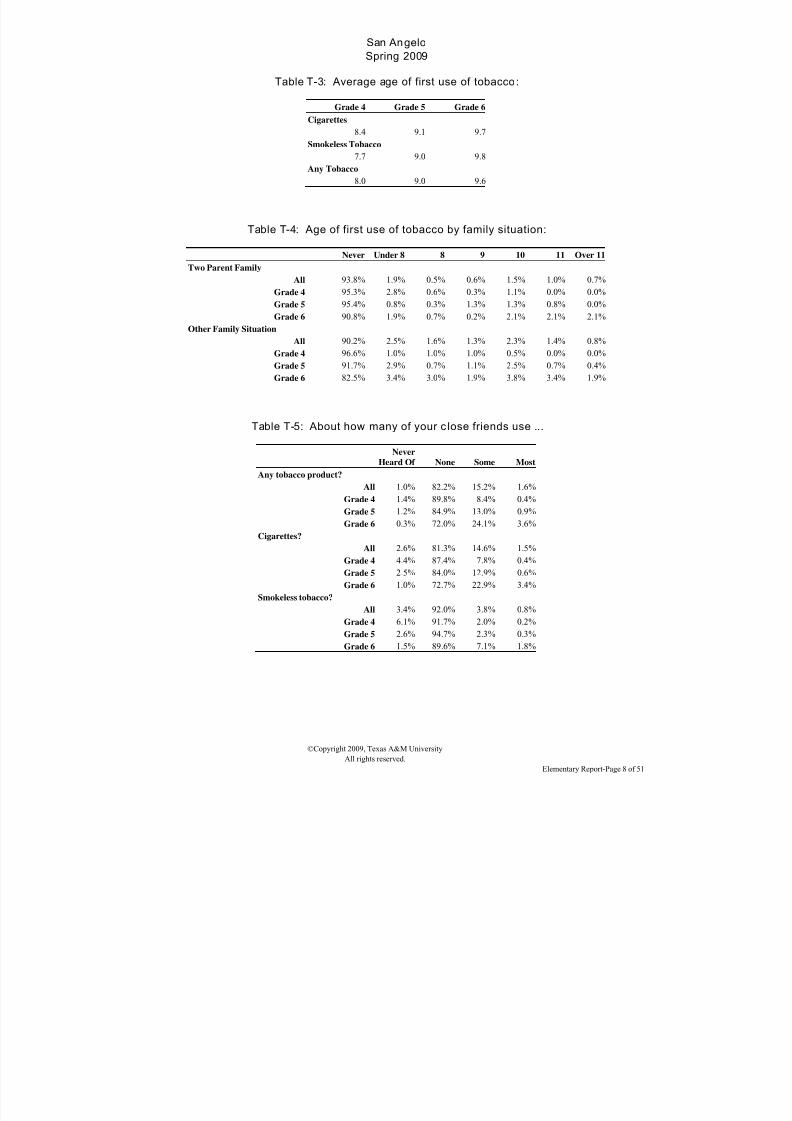
Table T-3: Average age of first use of tobacco:
Grade 4 Grade 5 Grade 6
Cigarettes
8.4 9.1 9.7
Smokeless Tobacco
7.7 9.0 9.8
Any Tobacco
8.0 9.0 9.6
Table T-4: Age of first use of tobacco by family situation:
Never Under 8 8 9 10 11 Over 11
Two Parent Family
All 93.8% 1.9% 0.5% 0.6% 1.5% 1.0% 0.7%
Grade 4 95.3% 2.8% 0.6% 0.3% 1.1% 0.0% 0.0%
Grade 5 95.4% 0.8% 0.3% 1.3% 1.3% 0.8% 0.0%Grade 6 90.8% 1.9% 0.7% 0.2% 2.1% 2.1% 2.1%
Other Family Situation
All 90.2% 2.5% 1.6% 1.3% 2.3% 1.4% 0.8%
Grade 4 96.6% 1.0% 1.0% 1.0% 0.5% 0.0% 0.0%
Grade 5 91.7% 2.9% 0.7% 1.1% 2.5% 0.7% 0.4%
Grade 6 82.5% 3.4% 3.0% 1.9% 3.8% 3.4% 1.9%
Table T-5: About how many of your c lose friends use ...
NeverHeard Of None Some Most
Any tobacco product?
All 1.0% 82.2% 15.2% 1.6%
Grade 4 1.4% 89.8% 8.4% 0.4%
Grade 5 1.2% 84.9% 13.0% 0.9%
Grade 6 0.3% 72.0% 24.1% 3.6%
Cigarettes?
All 2.6% 81.3% 14.6% 1.5%
Grade 4 4.4% 87.4% 7.8% 0.4%
Grade 5 2.5% 84.0% 12.9% 0.6%
Grade 6 1.0% 72.7% 22.9% 3.4%
Smokeless tobacco?
All 3.4% 92.0% 3.8% 0.8%
Grade 4 6.1% 91.7% 2.0% 0.2%
Grade 5 2.6% 94.7% 2.3% 0.3%
Grade 6 1.5% 89.6% 7.1% 1.8%

7/30/2019 2009 _ tom green county _ san angelo isd _ 2009 texas school survey of drug and alcohol use _ elementary report
http://slidepdf.com/reader/full/2009-tom-green-county-san-angelo-isd-2009-texas-school-survey-of-drug 44/137
San Angelo
Spring 2009
©Copyright 2009, Texas A&M University
All rights reserved.Elementary Report-Page 9 of 51
Table T-6: Have you ever been offered ...
Never
Heard Of Yes No
Any tobacco product?
All 1.5% 18.2% 80.3%
Grade 4 1.9% 11.0% 87.1%
Grade 5 1.5% 17.1% 81.4%
Grade 6 1.0% 26.5% 72.4%
Cigarettes?
All 2.8% 16.1% 81.2%
Grade 4 4.4% 8.9% 86.7%
Grade 5 2.3% 14.8% 82.8%
Grade 6 1.6% 24.3% 74.1%
Smokeless tobacco?
All 4.3% 6.6% 89.0%
Grade 4 6.9% 3.8% 89.3%
Grade 5 3.0% 5.4% 91.6%
Grade 6 3.2% 10.6% 86.2%
Table T-7: How dangerous do you think it is for kids your age to use ...
Never
Heard Of
Very
Dangerous Dangerous
Not at All
Dangerous Do Not Know
Any tobacco product?
All 0.3% 74.9% 20.9% 0.7% 3.2%
Grade 4 0.7% 73.9% 20.9% 0.7% 3.8%
Grade 5 0.0% 81.5% 16.2% 0.3% 2.0%
Grade 6 0.1% 69.3% 25.7% 1.0% 3.8%
Cigarettes?
All 1.9% 65.4% 27.4% 0.9% 4.3%
Grade 4 4.0% 66.0% 24.4% 0.7% 4.9%
Grade 5 1.1% 72.1% 23.5% 0.2% 3.1%
Grade 6 0.7% 58.0% 34.3% 1.9% 5.0%
Smokeless tobacco?
All 2.4% 66.5% 24.4% 1.2% 5.6%
Grade 4 5.0% 64.2% 23.0% 0.9% 7.0%
Grade 5 1.1% 74.4% 19.2% 0.6% 4.6%
Grade 6 1.0% 61.0% 30.8% 1.9% 5.2%

7/30/2019 2009 _ tom green county _ san angelo isd _ 2009 texas school survey of drug and alcohol use _ elementary report
http://slidepdf.com/reader/full/2009-tom-green-county-san-angelo-isd-2009-texas-school-survey-of-drug 45/137
San Angelo
Spring 2009
©Copyright 2009, Texas A&M University
All rights reserved.Elementary Report-Page 10 of 51
Table T-8: How do your parents feel about kids your age smoking cigarettes?
Don't Like Don't Care Think It's OK Don't know
All 88.1% 1.6% 0.4% 10.0%
Grade 4 88.7% 0.9% 0.3% 10.1%
Grade 5 89.6% 0.8% 0.3% 9.3%
Grade 6 85.9% 3.2% 0.4% 10.4%

7/30/2019 2009 _ tom green county _ san angelo isd _ 2009 texas school survey of drug and alcohol use _ elementary report
http://slidepdf.com/reader/full/2009-tom-green-county-san-angelo-isd-2009-texas-school-survey-of-drug 46/137
San Angelo
Spring 2009
©Copyright 2009, Texas A&M University
All rights reserved.Elementary Report-Page 11 of 51
Table A-1: How recently, if ever, have you used..
Ever
Used
School
Year
Not Past
Year
Never
Used
Any alcohol product
All 26.4% 17.6% 8.9% 73.6%
Grade 4 18.2% 12.0% 6.2% 81.8%
Grade 5 21.6% 14.2% 7.4% 78.4%
Grade 6 39.3% 26.4% 13.0% 60.7%
Beer
All 18.3% 10.6% 7.7% 81.7%
Grade 4 11.9% 6.4% 5.5% 88.1%
Grade 5 15.6% 8.9% 6.7% 84.4%
Grade 6 27.2% 16.5% 10.7% 72.8%
Wine coolers
All 10.8% 6.7% 4.1% 89.2%
Grade 4 4.4% 3.3% 1.0% 95.6%
Grade 5 6.4% 4.1% 2.3% 93.6%
Grade 6 21.4% 12.6% 8.8% 78.6%Wine
All 14.8% 9.5% 5.3% 85.2%
Grade 4 9.2% 6.4% 2.8% 90.8%
Grade 5 10.2% 6.5% 3.7% 89.8%
Grade 6 24.7% 15.4% 9.3% 75.3%
Liquor
All 7.8% 4.9% 2.9% 92.2%
Grade 4 2.3% 1.6% 0.7% 97.7%
Grade 5 5.0% 2.6% 2.4% 95.0%
Grade 6 15.9% 10.5% 5.4% 84.1%
7/30/2019 2009 _ tom green county _ san angelo isd _ 2009 texas school survey of drug and alcohol use _ elementary report
http://slidepdf.com/reader/full/2009-tom-green-county-san-angelo-isd-2009-texas-school-survey-of-drug 47/137
San Angelo
Spring 2009
©Copyright 2009, Texas A&M University
All rights reserved.Elementary Report-Page 12 of 51
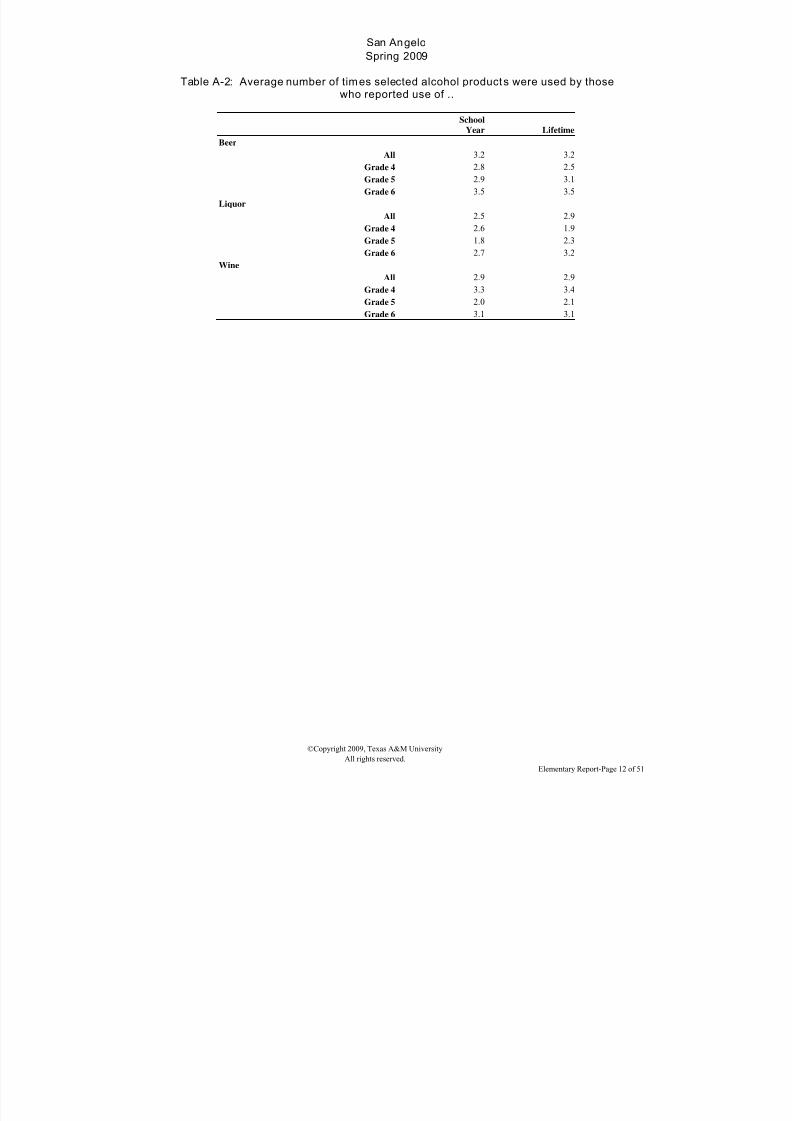
Table A-2: Average number of times selected alcohol products were used by thosewho reported use of ..
School
Year Lifetime
Beer
All 3.2 3.2
Grade 4 2.8 2.5
Grade 5 2.9 3.1
Grade 6 3.5 3.5
Liquor
All 2.5 2.9
Grade 4 2.6 1.9
Grade 5 1.8 2.3
Grade 6 2.7 3.2
Wine
All 2.9 2.9
Grade 4 3.3 3.4
Grade 5 2.0 2.1Grade 6 3.1 3.1

7/30/2019 2009 _ tom green county _ san angelo isd _ 2009 texas school survey of drug and alcohol use _ elementary report
http://slidepdf.com/reader/full/2009-tom-green-county-san-angelo-isd-2009-texas-school-survey-of-drug 48/137
San Angelo
Spring 2009
©Copyright 2009, Texas A&M University
All rights reserved.Elementary Report-Page 13 of 51
Table A-3: In the past year, how many times have you had two or more drinks at one time of ..
Never 1 Time 2 Times 3+ Times Ever
Beer?
All 86.7% 7.7% 2.6% 3.0% 13.3%
Grade 4 91.2% 5.4% 2.1% 1.4% 8.8%
Grade 5 89.6% 6.7% 1.2% 2.5% 10.4%
Grade 6 79.4% 11.0% 4.4% 5.2% 20.6%
Wine Coolers?
All 92.8% 4.5% 1.3% 1.4% 7.2%
Grade 4 97.7% 1.6% 0.4% 0.4% 2.3%
Grade 5 94.2% 3.9% 1.4% 0.5% 5.8%
Grade 6 86.6% 7.8% 2.3% 3.3% 13.4%
Wine?
All 87.5% 8.1% 2.5% 1.9% 12.5%
Grade 4 91.8% 4.7% 2.0% 1.5% 8.2%
Grade 5 90.0% 7.6% 1.6% 0.8% 10.0%
Grade 6 80.8% 11.9% 3.9% 3.5% 19.2%
Liquor?All 94.0% 3.2% 1.3% 1.5% 6.0%
Grade 4 98.2% 1.1% 0.7% 0.0% 1.8%
Grade 5 96.5% 1.9% 0.6% 1.0% 3.5%
Grade 6 87.3% 6.6% 2.6% 3.5% 12.7%

7/30/2019 2009 _ tom green county _ san angelo isd _ 2009 texas school survey of drug and alcohol use _ elementary report
http://slidepdf.com/reader/full/2009-tom-green-county-san-angelo-isd-2009-texas-school-survey-of-drug 49/137
San Angelo
Spring 2009
©Copyright 2009, Texas A&M University
All rights reserved.Elementary Report-Page 14 of 51
Table A-4: Average age of first use of alcohol:
Grade 4 Grade 5 Grade 6
Beer
8.2 8.8 9.3
Wine Coolers
8.4 9.4 9.9
Wine
8.7 9.3 9.7
Liquor
9.1 9.6 10.6
Any Alcohol
8.2 8.9 9.3
Table A-5: Age of first use of alcohol by family situation:
Never Under 8 8 9 10 11 Over 11
Two Parent Family
All 77.8% 5.6% 3.6% 4.0% 4.0% 3.3% 1.6%
Grade 4 82.5% 5.5% 4.7% 4.4% 2.5% 0.3% 0.0%
Grade 5 85.0% 3.7% 1.6% 4.0% 3.7% 1.3% 0.5%
Grade 6 66.4% 7.3% 4.5% 3.5% 5.9% 8.2% 4.2%
Other Family Situation
All 68.5% 11.0% 4.4% 4.0% 5.8% 5.3% 1.1%
Grade 4 81.2% 9.2% 3.9% 3.4% 1.9% 0.5% 0.0%
Grade 5 71.1% 9.7% 4.0% 2.9% 6.5% 5.8% 0.0%
Grade 6 53.8% 14.0% 5.3% 5.7% 8.7% 9.1% 3.4%
Table A-6 : Lifetime prevalence of use of alcohol by reported conduct problemsthis school year:
No Absences
or Conduct
Problems Cut School
Sent to
Principal Both
20.9% 69.7% 41.0% 68.5%
7/30/2019 2009 _ tom green county _ san angelo isd _ 2009 texas school survey of drug and alcohol use _ elementary report
http://slidepdf.com/reader/full/2009-tom-green-county-san-angelo-isd-2009-texas-school-survey-of-drug 50/137
San Angelo
Spring 2009
©Copyright 2009, Texas A&M University
All rights reserved.Elementary Report-Page 15 of 51
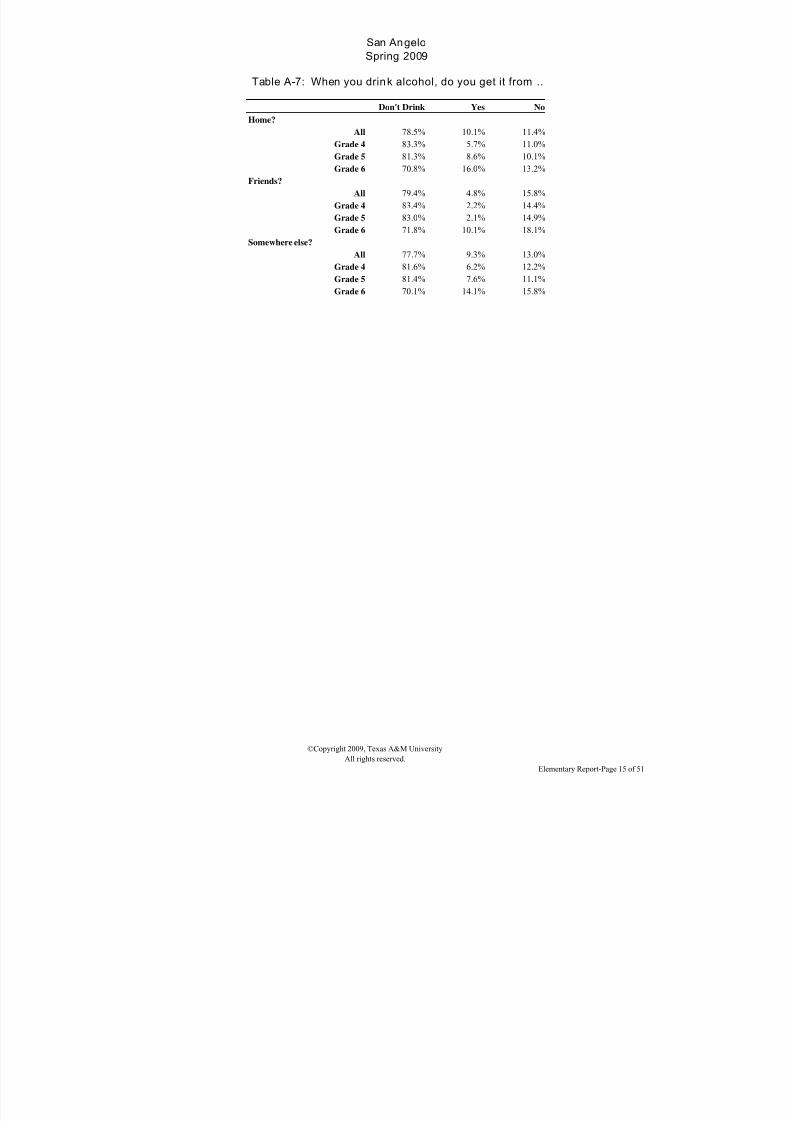
Table A-7: When you drink alcohol, do you get it from ..
Don't Drink Yes No
Home?
All 78.5% 10.1% 11.4%
Grade 4 83.3% 5.7% 11.0%
Grade 5 81.3% 8.6% 10.1%
Grade 6 70.8% 16.0% 13.2%
Friends?
All 79.4% 4.8% 15.8%
Grade 4 83.4% 2.2% 14.4%
Grade 5 83.0% 2.1% 14.9%
Grade 6 71.8% 10.1% 18.1%
Somewhere else?
All 77.7% 9.3% 13.0%
Grade 4 81.6% 6.2% 12.2%
Grade 5 81.4% 7.6% 11.1%
Grade 6 70.1% 14.1% 15.8%

7/30/2019 2009 _ tom green county _ san angelo isd _ 2009 texas school survey of drug and alcohol use _ elementary report
http://slidepdf.com/reader/full/2009-tom-green-county-san-angelo-isd-2009-texas-school-survey-of-drug 51/137
San Angelo
Spring 2009
©Copyright 2009, Texas A&M University
All rights reserved.Elementary Report-Page 16 of 51
Table A-8: About how many of your close friends use ..
Never
Heard Of None Some Most
Any alcohol product?
All 0.8% 72.5% 21.5% 5.3%
Grade 4 1.2% 81.5% 15.0% 2.3%
Grade 5 0.9% 78.3% 18.4% 2.5%
Grade 6 0.1% 58.1% 30.9% 10.9%
Beer?
All 0.8% 78.0% 17.8% 3.4%
Grade 4 0.9% 86.1% 11.4% 1.5%
Grade 5 1.3% 82.0% 15.2% 1.6%
Grade 6 0.3% 66.1% 26.6% 7.0%
Wine coolers?
All 12.4% 75.8% 9.8% 2.0%
Grade 4 15.9% 78.9% 4.6% 0.6%
Grade 5 14.1% 79.5% 5.9% 0.5%
Grade 6 7.2% 69.2% 18.6% 5.0%Wine?
All 1.2% 85.1% 11.8% 1.9%
Grade 4 1.9% 89.3% 8.3% 0.6%
Grade 5 1.5% 91.6% 6.0% 1.0%
Grade 6 0.3% 74.6% 20.9% 4.1%
Liquor?
All 5.9% 83.2% 9.1% 1.9%
Grade 4 9.5% 86.8% 3.5% 0.2%
Grade 5 6.4% 87.2% 5.9% 0.5%
Grade 6 1.8% 75.7% 17.5% 5.0%

7/30/2019 2009 _ tom green county _ san angelo isd _ 2009 texas school survey of drug and alcohol use _ elementary report
http://slidepdf.com/reader/full/2009-tom-green-county-san-angelo-isd-2009-texas-school-survey-of-drug 52/137
San Angelo
Spring 2009
©Copyright 2009, Texas A&M University
All rights reserved.Elementary Report-Page 17 of 51
Table A-9: Have you ever been offered ..
Never
Heard Of Yes No
Any alcohol product?
All 0.7% 30.0% 69.2%
Grade 4 0.9% 21.6% 77.5%
Grade 5 0.9% 27.2% 71.9%
Grade 6 0.4% 41.1% 58.5%
Beer?
All 1.1% 25.0% 73.9%
Grade 4 1.3% 19.2% 79.5%
Grade 5 1.1% 22.4% 76.4%
Grade 6 0.8% 33.5% 65.7%
Wine coolers?
All 13.2% 10.6% 76.3%
Grade 4 16.0% 4.8% 79.2%
Grade 5 15.0% 7.7% 77.3%
Grade 6 8.5% 19.1% 72.4%Wine?
All 1.9% 15.2% 83.0%
Grade 4 2.8% 7.4% 89.8%
Grade 5 2.0% 11.5% 86.5%
Grade 6 0.8% 26.5% 72.7%
Liquor?
All 6.4% 9.9% 83.8%
Grade 4 10.1% 3.4% 86.5%
Grade 5 6.5% 7.2% 86.3%
Grade 6 2.6% 18.9% 78.5%

7/30/2019 2009 _ tom green county _ san angelo isd _ 2009 texas school survey of drug and alcohol use _ elementary report
http://slidepdf.com/reader/full/2009-tom-green-county-san-angelo-isd-2009-texas-school-survey-of-drug 53/137
San Angelo
Spring 2009
©Copyright 2009, Texas A&M University
All rights reserved.Elementary Report-Page 18 of 51
Table A-10: How do your parents feel about kids your age drinking beer?
Don't Like Don't Care Think It's OK Don't know
All 83.8% 3.1% 1.1% 12.0%
Grade 4 84.8% 2.4% 0.5% 12.3%
Grade 5 87.3% 0.9% 1.4% 10.4%
Grade 6 79.4% 6.0% 1.3% 13.3%
Table A-11: How dangerous do you think it is fo r kids your age to use ..
Never
Heard Of
Very
Dangerous Dangerous
Not at All
Dangerous Do Not Know
Any alcohol product?
All 0.2% 72.4% 21.8% 2.2% 3.4%
Grade 4 0.4% 76.1% 18.1% 1.6% 3.9%
Grade 5 0.2% 79.2% 16.6% 1.8% 2.2%
Grade 6 0.1% 61.8% 30.6% 3.2% 4.2%Beer?
All 0.2% 56.3% 32.7% 5.0% 5.8%
Grade 4 0.4% 61.3% 26.3% 4.0% 8.0%
Grade 5 0.2% 63.9% 28.7% 2.9% 4.3%
Grade 6 0.2% 43.7% 42.9% 8.1% 5.1%
Wine coolers?
All 10.6% 50.0% 25.8% 4.4% 9.2%
Grade 4 12.9% 54.9% 19.4% 2.2% 10.5%
Grade 5 11.4% 56.3% 21.2% 3.4% 7.6%
Grade 6 7.7% 38.9% 36.5% 7.4% 9.5%
Wine?
All 0.6% 50.3% 32.9% 7.6% 8.6%
Grade 4 0.9% 55.6% 27.8% 5.6% 10.0%
Grade 5 0.8% 56.6% 30.8% 4.9% 7.0%
Grade 6 0.2% 38.9% 40.0% 12.2% 8.8%
Liquor?
All 4.6% 65.0% 23.3% 1.8% 5.4%
Grade 4 9.3% 65.5% 18.8% 0.5% 5.8%
Grade 5 3.2% 72.1% 19.3% 1.4% 4.0%
Grade 6 1.4% 57.2% 31.7% 3.3% 6.4%

7/30/2019 2009 _ tom green county _ san angelo isd _ 2009 texas school survey of drug and alcohol use _ elementary report
http://slidepdf.com/reader/full/2009-tom-green-county-san-angelo-isd-2009-texas-school-survey-of-drug 54/137
San Angelo
Spring 2009
©Copyright 2009, Texas A&M University
All rights reserved.Elementary Report-Page 19 of 51
Table D-1: How recently, if ever, have you used Marijuana..
Ever
Used
School
Year
Not Past
Year
Never
Used
All 2.8% 1.9% 1.0% 97.2%
Grade 4 0.7% 0.3% 0.3% 99.3%
Grade 5 1.7% 0.8% 0.9% 98.3%
Grade 6 6.1% 4.5% 1.6% 93.9%
Table D-2: Average number of times marijuana was used by those reporting usage:
School
Year Lifetime
All 4.4 4.5
Grade 4 * *
Grade 5 2.5 2.0
Grade 6 5.0 5.1

7/30/2019 2009 _ tom green county _ san angelo isd _ 2009 texas school survey of drug and alcohol use _ elementary report
http://slidepdf.com/reader/full/2009-tom-green-county-san-angelo-isd-2009-texas-school-survey-of-drug 55/137
San Angelo
Spring 2009
©Copyright 2009, Texas A&M University
All rights reserved.Elementary Report-Page 20 of 51
Table D-3: Average age of first use of marijuana:
Grade 4 Grade 5 Grade 6
8.4 9.4 10.0
Table D-4: Age of first use of marijuana by family situation:
Never Under 8 8 9 10 11 Over 11
Two Parent Family
All 98.2% 0.5% 0.0% 0.0% 0.3% 0.5% 0.4%
Grade 4 99.7% 0.3% 0.0% 0.0% 0.0% 0.0% 0.0%
Grade 5 99.2% 0.3% 0.0% 0.0% 0.3% 0.3% 0.0%
Grade 6 95.9% 1.0% 0.0% 0.0% 0.7% 1.2% 1.2%
Other Family Situation
All 95.2% 1.1% 0.7% 0.1% 1.1% 1.2% 0.7%
Grade 4 97.9% 0.5% 0.5% 0.0% 1.0% 0.0% 0.0%
Grade 5 97.0% 1.1% 0.0% 0.0% 0.7% 0.7% 0.4%Grade 6 90.6% 1.6% 1.6% 0.4% 1.6% 2.7% 1.6%

7/30/2019 2009 _ tom green county _ san angelo isd _ 2009 texas school survey of drug and alcohol use _ elementary report
http://slidepdf.com/reader/full/2009-tom-green-county-san-angelo-isd-2009-texas-school-survey-of-drug 56/137
San Angelo
Spring 2009
©Copyright 2009, Texas A&M University
All rights reserved.Elementary Report-Page 21 of 51
Table D-5 : Lifetime prevalence of use of marijuana by reported conductproblems this school year:
No Absences
or Conduct
Problems Cut School
Sent to
Principal Both
1.2% 28.3% 7.5% 34.0%
Table D-6: About how many of your c lose friends use marijuana?
Never
Heard Of None Some Most
All 8.3% 81.7% 7.9% 2.2%
Grade 4 16.4% 80.4% 2.8% 0.4%
Grade 5 7.1% 87.8% 4.2% 0.9%
Grade 6 1.8% 76.7% 16.4% 5.1%
Table D-7: Have you ever been offered marijuana?
Never
Heard Of Yes No
All 8.9% 8.7% 82.3%
Grade 4 16.6% 4.1% 79.3%
Grade 5 7.0% 5.7% 87.3%
Grade 6 3.4% 16.4% 80.2%
Table D-8: How do your parents feel about kids your age smoking marijuana?
Don't Like Don't Care Think It's OK Don't know
All 87.7% 1.0% 0.2% 11.1%
Grade 4 85.4% 0.5% 0.0% 14.1%
Grade 5 89.7% 0.2% 0.2% 10.0%
Grade 6 88.1% 2.2% 0.4% 9.3%
Table D-9: How dangerous do you think it is for kids your age to use marijuana?
Never
Heard Of
Very
Dangerous Dangerous
Not at All
Dangerous Do Not Know
All 7.4% 79.3% 8.1% 1.1% 4.2%
Grade 4 15.2% 70.6% 8.1% 0.2% 6.0%
Grade 5 5.3% 85.7% 5.8% 0.5% 2.7%
Grade 6 1.8% 81.5% 10.3% 2.5% 3.9%

7/30/2019 2009 _ tom green county _ san angelo isd _ 2009 texas school survey of drug and alcohol use _ elementary report
http://slidepdf.com/reader/full/2009-tom-green-county-san-angelo-isd-2009-texas-school-survey-of-drug 57/137
San Angelo
Spring 2009
©Copyright 2009, Texas A&M University
All rights reserved.Elementary Report-Page 22 of 51
Table I-1: How recently, if ever, have you used Inhalants..
Ever
Used
School
Year
Not Past
Year
Never
Used
All 9.7% 6.9% 2.7% 90.3%
Grade 4 7.1% 4.7% 2.4% 92.9%
Grade 5 4.9% 4.0% 0.9% 95.1%
Grade 6 16.9% 12.0% 4.9% 83.1%
Table I-2: Have you ever sniffed any of the following inhalants to get high?
Not Used Used
Correction Fluid/Whiteout
All 98.3% 1.7%
Grade 4 99.5% 0.5%
Grade 5 98.7% 1.3%
Grade 6 96.7% 3.3%Gasoline
All 97.9% 2.1%
Grade 4 98.2% 1.8%
Grade 5 98.0% 2.0%
Grade 6 97.3% 2.7%
Glue
All 97.6% 2.4%
Grade 4 97.7% 2.3%
Grade 5 98.7% 1.3%
Grade 6 96.4% 3.6%
Paint Thinner
All 98.3% 1.7%
Grade 4 99.1% 0.9%
Grade 5 99.2% 0.8%
Grade 6 96.7% 3.3%
Spray Paint
All 97.0% 3.0%
Grade 4 98.7% 1.3%
Grade 5 98.0% 2.0%
Grade 6 94.3% 5.7%
Other Inhalants
All 94.2% 5.8%
Grade 4 96.8% 3.2%
Grade 5 98.1% 1.9%
Grade 6 87.7% 12.3%

7/30/2019 2009 _ tom green county _ san angelo isd _ 2009 texas school survey of drug and alcohol use _ elementary report
http://slidepdf.com/reader/full/2009-tom-green-county-san-angelo-isd-2009-texas-school-survey-of-drug 58/137
San Angelo
Spring 2009
©Copyright 2009, Texas A&M University
All rights reserved.Elementary Report-Page 23 of 51
Table I-3: Average number of times inhalants were used by those reporting usage:
School
Year Lifetime
All 3.3 3.2
Grade 4 3.6 3.8
Grade 5 3.1 3.0
Grade 6 3.2 3.1
Table I-4: Number of different kinds of inhalants used:
None One Two to Three Four Plus
All 90.9% 4.9% 3.5% 0.6%
Grade 4 93.6% 3.9% 2.4% 0.2%
Grade 5 95.5% 2.6% 1.4% 0.6%
Grade 6 83.8% 8.3% 6.8% 1.1%

7/30/2019 2009 _ tom green county _ san angelo isd _ 2009 texas school survey of drug and alcohol use _ elementary report
http://slidepdf.com/reader/full/2009-tom-green-county-san-angelo-isd-2009-texas-school-survey-of-drug 59/137
San Angelo
Spring 2009
©Copyright 2009, Texas A&M University
All rights reserved.Elementary Report-Page 24 of 51
Table I-5: Average age of first use of inhalants:
Grade 4 Grade 5 Grade 6
7.9 9.1 10.3
Table I-6: Age of first use of inhalants by family situation:
Never Under 8 8 9 10 11 Over 11
Two Parent Family
All 94.1% 1.6% 0.3% 1.0% 1.0% 0.8% 1.2%
Grade 4 95.4% 2.9% 0.3% 1.2% 0.3% 0.0% 0.0%
Grade 5 97.0% 1.1% 0.0% 0.5% 1.1% 0.3% 0.0%
Grade 6 90.0% 0.7% 0.7% 1.2% 1.7% 2.2% 3.4%
Other Family Situation
All 92.6% 1.5% 0.6% 0.7% 1.5% 2.1% 1.0%
Grade 4 96.4% 1.0% 1.5% 1.0% 0.0% 0.0% 0.0%
Grade 5 95.9% 1.1% 0.0% 0.4% 1.5% 0.7% 0.4%Grade 6 85.4% 2.4% 0.4% 0.8% 2.8% 5.5% 2.8%

7/30/2019 2009 _ tom green county _ san angelo isd _ 2009 texas school survey of drug and alcohol use _ elementary report
http://slidepdf.com/reader/full/2009-tom-green-county-san-angelo-isd-2009-texas-school-survey-of-drug 60/137
San Angelo
Spring 2009
©Copyright 2009, Texas A&M University
All rights reserved.Elementary Report-Page 25 of 51
Table I-7: Lifetime prevalence of use of inhalants by reported conductproblems this school year:
No Absences
or Conduct
Problems Cut School
Sent to
Principal Both
4.6% 39.4% 12.7% 37.4%
Table I-8: About how many of your close friends use inhalants?
Never
Heard Of None Some Most
All 5.2% 81.5% 10.6% 2.7%
Grade 4 9.0% 85.9% 3.8% 1.3%
Grade 5 4.6% 87.2% 7.3% 1.0%
Grade 6 2.2% 71.7% 20.2% 5.8%

7/30/2019 2009 _ tom green county _ san angelo isd _ 2009 texas school survey of drug and alcohol use _ elementary report
http://slidepdf.com/reader/full/2009-tom-green-county-san-angelo-isd-2009-texas-school-survey-of-drug 61/137
San Angelo
Spring 2009
©Copyright 2009, Texas A&M University
All rights reserved.Elementary Report-Page 26 of 51
Table I-9: Have you ever been offered inhalants?
Never
Heard Of Yes No
All 6.4% 9.1% 84.5%
Grade 4 11.1% 5.0% 83.9%
Grade 5 5.1% 4.9% 90.0%
Grade 6 3.1% 17.5% 79.4%
Table I-10: How dangerous do you think i t is for kids your age to use inhalants?
Never
Heard Of
Very
Dangerous Dangerous
Not at All
Dangerous Do Not Know
All 4.1% 68.5% 18.3% 2.6% 6.5%
Grade 4 7.7% 63.9% 16.5% 3.1% 8.8%
Grade 5 2.9% 73.6% 17.3% 1.8% 4.5%
Grade 6 2.0% 67.7% 21.2% 3.0% 6.2%
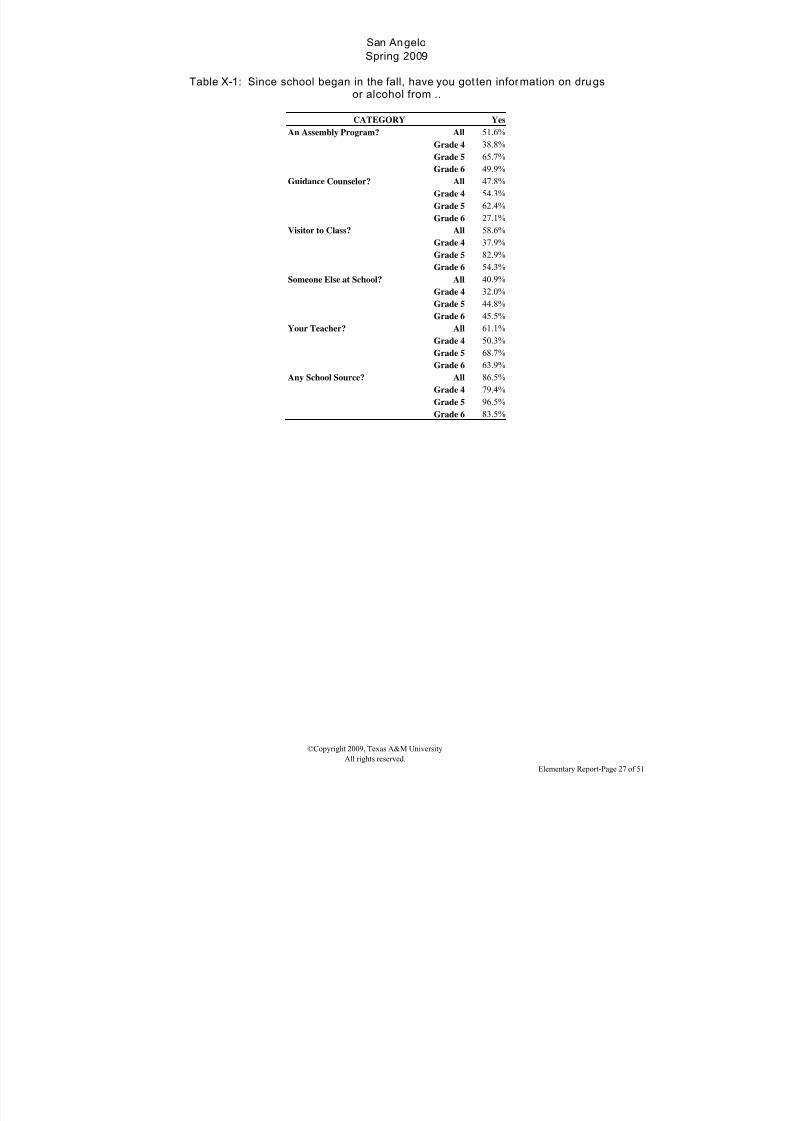
7/30/2019 2009 _ tom green county _ san angelo isd _ 2009 texas school survey of drug and alcohol use _ elementary report
http://slidepdf.com/reader/full/2009-tom-green-county-san-angelo-isd-2009-texas-school-survey-of-drug 62/137
San Angelo
Spring 2009
©Copyright 2009, Texas A&M University
All rights reserved.Elementary Report-Page 27 of 51
Table X-1: Since school began in the fall, have you got ten information on drugsor alcohol from ..
CATEGORY Yes
An Assembly Program? All 51.6%
Grade 4 38.8%
Grade 5 65.7%
Grade 6 49.9%
Guidance Counselor? All 47.8%
Grade 4 54.3%
Grade 5 62.4%
Grade 6 27.1%
Visitor to Class? All 58.6%
Grade 4 37.9%
Grade 5 82.9%
Grade 6 54.3%
Someone Else at School? All 40.9%
Grade 4 32.0%
Grade 5 44.8%Grade 6 45.5%
Your Teacher? All 61.1%
Grade 4 50.3%
Grade 5 68.7%
Grade 6 63.9%
Any School Source? All 86.5%
Grade 4 79.4%
Grade 5 96.5%
Grade 6 83.5%
7/30/2019 2009 _ tom green county _ san angelo isd _ 2009 texas school survey of drug and alcohol use _ elementary report
http://slidepdf.com/reader/full/2009-tom-green-county-san-angelo-isd-2009-texas-school-survey-of-drug 63/137
San Angelo
Spring 2009
©Copyright 2009, Texas A&M University
All rights reserved.Elementary Report-Page 28 of 51
7/30/2019 2009 _ tom green county _ san angelo isd _ 2009 texas school survey of drug and alcohol use _ elementary report
http://slidepdf.com/reader/full/2009-tom-green-county-san-angelo-isd-2009-texas-school-survey-of-drug 64/137
San Angelo
Spring 2009
©Copyright 2009, Texas A&M University
All rights reserved.Elementary Report-Page 29 of 51
2. Prevalence Tables

7/30/2019 2009 _ tom green county _ san angelo isd _ 2009 texas school survey of drug and alcohol use _ elementary report
http://slidepdf.com/reader/full/2009-tom-green-county-san-angelo-isd-2009-texas-school-survey-of-drug 65/137
San Angelo
Spring 2009
©Copyright 2009, Texas A&M University
All rights reserved.Elementary Report-Page 30 of 51

7/30/2019 2009 _ tom green county _ san angelo isd _ 2009 texas school survey of drug and alcohol use _ elementary report
http://slidepdf.com/reader/full/2009-tom-green-county-san-angelo-isd-2009-texas-school-survey-of-drug 66/137
San Angelo
Spring 2009
©Copyright 2009, Texas A&M University
All rights reserved.Elementary Report-Page 31 of 51
Table B1: Prevalence and recency of use of selected subs tances by grade Al l Students
Ever
Used
School
Year
Not Past
Year
Never
Used
Tobacco
All 7.4% 4.7% 2.6% 92.6%
Grade 4 3.8% 2.4% 1.4% 96.2%
Grade 5 6.2% 4.1% 2.1% 93.8%
Grade 6 12.2% 7.7% 4.4% 87.8%
Alcohol
All 26.4% 17.6% 8.9% 73.6%
Grade 4 18.2% 12.0% 6.2% 81.8%
Grade 5 21.6% 14.2% 7.4% 78.4%
Grade 6 39.3% 26.4% 13.0% 60.7%
Inhalants
All 9.7% 6.9% 2.7% 90.3%
Grade 4 7.1% 4.7% 2.4% 92.9%
Grade 5 4.9% 4.0% 0.9% 95.1%Grade 6 16.9% 12.0% 4.9% 83.1%
Marijuana
All 2.8% 1.9% 1.0% 97.2%
Grade 4 0.7% 0.3% 0.3% 99.3%
Grade 5 1.7% 0.8% 0.9% 98.3%
Grade 6 6.1% 4.5% 1.6% 93.9%

7/30/2019 2009 _ tom green county _ san angelo isd _ 2009 texas school survey of drug and alcohol use _ elementary report
http://slidepdf.com/reader/full/2009-tom-green-county-san-angelo-isd-2009-texas-school-survey-of-drug 67/137
San Angelo
Spring 2009
©Copyright 2009, Texas A&M University
All rights reserved.Elementary Report-Page 32 of 51
Table B2: Prevalence and recency of use of selected subs tances by gradeMale Students
Ever
Used
School
Year
Not Past
Year
Never
Used
Tobacco
All 8.6% 5.8% 2.8% 91.4%
Grade 4 3.6% 2.9% 0.7% 96.4%
Grade 5 8.7% 5.4% 3.3% 91.3%
Grade 6 13.5% 9.1% 4.4% 86.5%
Alcohol
All 29.4% 19.4% 10.1% 70.6%
Grade 4 23.9% 15.9% 8.0% 76.1%
Grade 5 25.1% 15.9% 9.3% 74.9%
Grade 6 39.8% 26.7% 13.0% 60.2%
Inhalants
All 8.6% 5.8% 2.8% 91.4%
Grade 4 7.7% 4.8% 3.0% 92.3%
Grade 5 5.1% 3.6% 1.5% 94.9%Grade 6 13.2% 9.1% 4.1% 86.8%
Marijuana
All 4.0% 2.6% 1.4% 96.0%
Grade 4 1.1% 0.4% 0.7% 98.9%
Grade 5 2.4% 1.2% 1.2% 97.6%
Grade 6 8.5% 6.3% 2.2% 91.5%

7/30/2019 2009 _ tom green county _ san angelo isd _ 2009 texas school survey of drug and alcohol use _ elementary report
http://slidepdf.com/reader/full/2009-tom-green-county-san-angelo-isd-2009-texas-school-survey-of-drug 68/137
San Angelo
Spring 2009
©Copyright 2009, Texas A&M University
All rights reserved.Elementary Report-Page 33 of 51
Table B3: Prevalence and recency of use of selected subs tances by gradeFemale Students
Ever
Used
School
Year
Not Past
Year
Never
Used
Tobacco
All 6.3% 3.8% 2.5% 93.7%
Grade 4 3.9% 1.9% 1.9% 96.1%
Grade 5 3.7% 2.8% 0.9% 96.3%
Grade 6 11.2% 6.7% 4.5% 88.8%
Alcohol
All 23.6% 15.9% 7.7% 76.4%
Grade 4 13.1% 8.5% 4.6% 86.9%
Grade 5 18.0% 12.5% 5.5% 82.0%
Grade 6 38.8% 26.1% 12.8% 61.2%
Inhalants
All 10.6% 7.9% 2.7% 89.4%
Grade 4 6.6% 4.6% 2.0% 93.4%
Grade 5 4.6% 4.3% 0.3% 95.4%Grade 6 19.9% 14.4% 5.6% 80.1%
Marijuana
All 1.8% 1.2% 0.6% 98.2%
Grade 4 0.3% 0.3% 0.0% 99.7%
Grade 5 0.9% 0.3% 0.6% 99.1%
Grade 6 4.0% 3.0% 1.1% 96.0%

7/30/2019 2009 _ tom green county _ san angelo isd _ 2009 texas school survey of drug and alcohol use _ elementary report
http://slidepdf.com/reader/full/2009-tom-green-county-san-angelo-isd-2009-texas-school-survey-of-drug 69/137
San Angelo
Spring 2009
©Copyright 2009, Texas A&M University
All rights reserved.Elementary Report-Page 34 of 51
Table B4: Prevalence and recency of use of selected subs tances by gradeWhite Students
Ever
Used
School
Year
Not Past
Year
Never
Used
Tobacco
All 5.3% 3.0% 2.3% 94.7%
Grade 4 5.5% 3.7% 1.8% 94.5%
Grade 5 2.9% 1.2% 1.7% 97.1%
Grade 6 7.5% 4.1% 3.4% 92.5%
Alcohol
All 21.8% 12.2% 9.5% 78.2%
Grade 4 17.9% 11.5% 6.4% 82.1%
Grade 5 17.8% 9.5% 8.3% 82.2%
Grade 6 29.4% 15.6% 13.8% 70.6%
Inhalants
All 8.0% 5.9% 2.1% 92.0%
Grade 4 9.3% 5.6% 3.7% 90.7%
Grade 5 5.0% 3.3% 1.7% 95.0%Grade 6 9.7% 8.6% 1.1% 90.3%
Marijuana
All 1.6% 0.9% 0.7% 98.4%
Grade 4 0.5% 0.0% 0.5% 99.5%
Grade 5 1.2% 0.4% 0.8% 98.8%
Grade 6 3.0% 2.3% 0.8% 97.0%

7/30/2019 2009 _ tom green county _ san angelo isd _ 2009 texas school survey of drug and alcohol use _ elementary report
http://slidepdf.com/reader/full/2009-tom-green-county-san-angelo-isd-2009-texas-school-survey-of-drug 70/137
San Angelo
Spring 2009
©Copyright 2009, Texas A&M University
All rights reserved.Elementary Report-Page 35 of 51
Table B5: Prevalence and recency of use of selected subs tances by grade Af rican/American Students
Ever
Used
School
Year
Not Past
Year
Never
Used
Tobacco
All 9.8% 5.8% 4.0% 90.2%
Grade 4 3.7% 0.0% 3.7% 96.3%
Grade 5 15.9% 9.1% 6.8% 84.1%
Grade 6 6.7% 6.7% 0.0% 93.3%
Alcohol
All 27.0% 15.4% 11.6% 73.0%
Grade 4 14.8% 7.4% 7.4% 85.2%
Grade 5 22.7% 13.6% 9.1% 77.3%
Grade 6 46.7% 26.7% 20.0% 53.3%
Inhalants
All 8.6% 8.6% 0.0% 91.4%
Grade 4 3.7% 3.7% 0.0% 96.3%
Grade 5 6.8% 6.8% 0.0% 93.2%Grade 6 16.7% 16.7% 0.0% 83.3%
Marijuana
All 1.9% 0.9% 1.0% 98.1%
Grade 4 0.0% 0.0% 0.0% 100.0%
Grade 5 2.3% 0.0% 2.3% 97.7%
Grade 6 3.3% 3.3% 0.0% 96.7%

7/30/2019 2009 _ tom green county _ san angelo isd _ 2009 texas school survey of drug and alcohol use _ elementary report
http://slidepdf.com/reader/full/2009-tom-green-county-san-angelo-isd-2009-texas-school-survey-of-drug 71/137
San Angelo
Spring 2009
©Copyright 2009, Texas A&M University
All rights reserved.Elementary Report-Page 36 of 51
Table B6: Prevalence and recency of use of selected subs tances by gradeMexican/American Students
Ever
Used
School
Year
Not Past
Year
Never
Used
Tobacco
All 9.1% 6.6% 2.5% 90.9%
Grade 4 2.9% 2.2% 0.7% 97.1%
Grade 5 7.5% 5.7% 1.8% 92.5%
Grade 6 16.3% 11.5% 4.9% 83.7%
Alcohol
All 30.5% 22.5% 8.1% 69.5%
Grade 4 20.7% 14.0% 6.6% 79.3%
Grade 5 24.6% 17.7% 6.9% 75.4%
Grade 6 45.5% 34.9% 10.5% 54.5%
Inhalants
All 10.7% 7.3% 3.4% 89.3%
Grade 4 4.9% 3.4% 1.5% 95.1%
Grade 5 4.5% 3.9% 0.6% 95.5%Grade 6 22.2% 14.2% 8.0% 77.8%
Marijuana
All 3.9% 2.6% 1.3% 96.1%
Grade 4 0.8% 0.4% 0.4% 99.2%
Grade 5 1.8% 0.9% 0.9% 98.2%
Grade 6 8.9% 6.3% 2.6% 91.1%

7/30/2019 2009 _ tom green county _ san angelo isd _ 2009 texas school survey of drug and alcohol use _ elementary report
http://slidepdf.com/reader/full/2009-tom-green-county-san-angelo-isd-2009-texas-school-survey-of-drug 72/137
San Angelo
Spring 2009
©Copyright 2009, Texas A&M University
All rights reserved.Elementary Report-Page 37 of 51
Table B7: Prevalence and recency of use of selected subs tances by gradeStudents Reporting A Grades
Ever
Used
School
Year
Not Past
Year
Never
Used
Tobacco
All 4.2% 2.5% 1.8% 95.8%
Grade 4 3.2% 2.2% 1.1% 96.8%
Grade 5 3.0% 1.3% 1.7% 97.0%
Grade 6 7.0% 4.3% 2.7% 93.0%
Alcohol
All 21.2% 12.3% 8.9% 78.8%
Grade 4 15.8% 10.4% 5.4% 84.2%
Grade 5 19.3% 11.3% 8.0% 80.7%
Grade 6 30.2% 15.9% 14.3% 69.8%
Inhalants
All 5.8% 4.0% 1.9% 94.2%
Grade 4 5.5% 4.0% 1.5% 94.5%
Grade 5 4.3% 3.0% 1.3% 95.7%Grade 6 8.2% 5.1% 3.1% 91.8%
Marijuana
All 1.2% 0.7% 0.5% 98.8%
Grade 4 0.7% 0.4% 0.4% 99.3%
Grade 5 0.7% 0.0% 0.7% 99.3%
Grade 6 2.4% 2.0% 0.4% 97.6%

7/30/2019 2009 _ tom green county _ san angelo isd _ 2009 texas school survey of drug and alcohol use _ elementary report
http://slidepdf.com/reader/full/2009-tom-green-county-san-angelo-isd-2009-texas-school-survey-of-drug 73/137
San Angelo
Spring 2009
©Copyright 2009, Texas A&M University
All rights reserved.Elementary Report-Page 38 of 51
Table B8: Prevalence and recency of use of selected subs tances by gradeStudents Reporting grades lower than A
Ever
Used
School
Year
Not Past
Year
Never
Used
Tobacco
All 10.0% 6.6% 3.4% 90.0%
Grade 4 4.4% 2.7% 1.7% 95.6%
Grade 5 8.7% 6.2% 2.5% 91.3%
Grade 6 15.5% 10.0% 5.6% 84.5%
Alcohol
All 30.9% 21.9% 9.0% 69.1%
Grade 4 20.7% 13.6% 7.1% 79.3%
Grade 5 23.7% 16.6% 7.0% 76.3%
Grade 6 45.3% 33.0% 12.2% 54.7%
Inhalants
All 12.5% 9.2% 3.3% 87.5%
Grade 4 8.3% 5.2% 3.1% 91.7%
Grade 5 5.4% 4.8% 0.6% 94.6%Grade 6 22.0% 16.2% 5.8% 78.0%
Marijuana
All 4.1% 2.8% 1.3% 95.9%
Grade 4 0.7% 0.3% 0.3% 99.3%
Grade 5 2.5% 1.4% 1.1% 97.5%
Grade 6 8.1% 6.0% 2.1% 91.9%
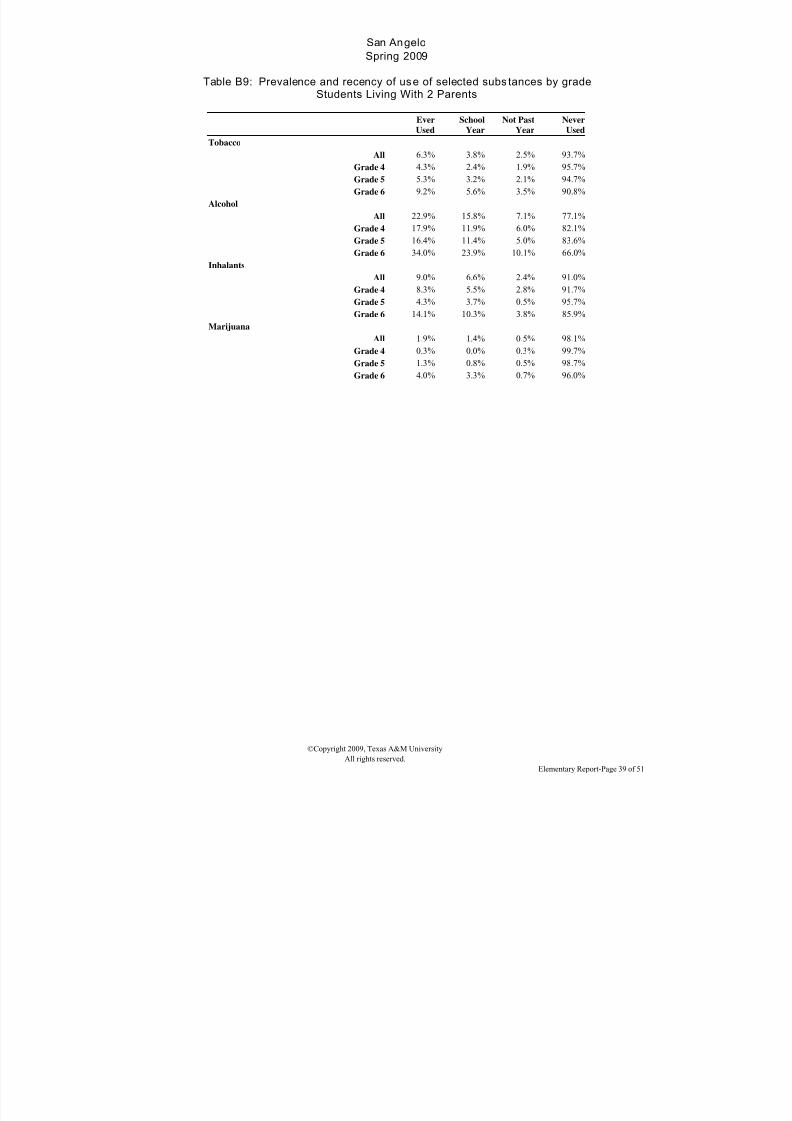
7/30/2019 2009 _ tom green county _ san angelo isd _ 2009 texas school survey of drug and alcohol use _ elementary report
http://slidepdf.com/reader/full/2009-tom-green-county-san-angelo-isd-2009-texas-school-survey-of-drug 74/137
San Angelo
Spring 2009
©Copyright 2009, Texas A&M University
All rights reserved.Elementary Report-Page 39 of 51
Table B9: Prevalence and recency of use of selected subs tances by gradeStudents Living With 2 Parents
Ever
Used
School
Year
Not Past
Year
Never
Used
Tobacco
All 6.3% 3.8% 2.5% 93.7%
Grade 4 4.3% 2.4% 1.9% 95.7%
Grade 5 5.3% 3.2% 2.1% 94.7%
Grade 6 9.2% 5.6% 3.5% 90.8%
Alcohol
All 22.9% 15.8% 7.1% 77.1%
Grade 4 17.9% 11.9% 6.0% 82.1%
Grade 5 16.4% 11.4% 5.0% 83.6%
Grade 6 34.0% 23.9% 10.1% 66.0%
Inhalants
All 9.0% 6.6% 2.4% 91.0%
Grade 4 8.3% 5.5% 2.8% 91.7%
Grade 5 4.3% 3.7% 0.5% 95.7%Grade 6 14.1% 10.3% 3.8% 85.9%
Marijuana
All 1.9% 1.4% 0.5% 98.1%
Grade 4 0.3% 0.0% 0.3% 99.7%
Grade 5 1.3% 0.8% 0.5% 98.7%
Grade 6 4.0% 3.3% 0.7% 96.0%

7/30/2019 2009 _ tom green county _ san angelo isd _ 2009 texas school survey of drug and alcohol use _ elementary report
http://slidepdf.com/reader/full/2009-tom-green-county-san-angelo-isd-2009-texas-school-survey-of-drug 75/137
San Angelo
Spring 2009
©Copyright 2009, Texas A&M University
All rights reserved.Elementary Report-Page 40 of 51
Table B10: Prevalence and recency of use of selected substances by gradeStudents Not Living With 2 Parents
Ever
Used
School
Year
Not Past
Year
Never
Used
Tobacco
All 9.3% 6.4% 2.9% 90.7%
Grade 4 2.8% 2.4% 0.5% 97.2%
Grade 5 7.5% 5.4% 2.2% 92.5%
Grade 6 17.3% 11.3% 6.0% 82.7%
Alcohol
All 31.9% 20.2% 11.8% 68.1%
Grade 4 18.1% 11.4% 6.7% 81.9%
Grade 5 28.8% 18.3% 10.4% 71.2%
Grade 6 48.1% 30.2% 17.9% 51.9%
Inhalants
All 10.5% 7.2% 3.3% 89.5%
Grade 4 4.8% 2.9% 1.9% 95.2%
Grade 5 5.8% 4.3% 1.4% 94.2%Grade 6 21.1% 14.3% 6.8% 78.9%
Marijuana
All 4.2% 2.5% 1.7% 95.8%
Grade 4 1.4% 1.0% 0.5% 98.6%
Grade 5 2.2% 0.7% 1.4% 97.8%
Grade 6 9.1% 6.0% 3.0% 90.9%

7/30/2019 2009 _ tom green county _ san angelo isd _ 2009 texas school survey of drug and alcohol use _ elementary report
http://slidepdf.com/reader/full/2009-tom-green-county-san-angelo-isd-2009-texas-school-survey-of-drug 76/137
San Angelo
Spring 2009
©Copyright 2009, Texas A&M University
All rights reserved.Elementary Report-Page 41 of 51
Table B11: Prevalence and recency of use of selected substances by gradeStudents L iving in Town More Than 3 Years
Ever
Used
School
Year
Not Past
Year
Never
Used
Tobacco
All 7.7% 4.8% 2.9% 92.3%
Grade 4 3.9% 2.4% 1.5% 96.1%
Grade 5 6.7% 4.2% 2.5% 93.3%
Grade 6 12.3% 7.7% 4.6% 87.7%
Alcohol
All 27.0% 18.1% 8.9% 73.0%
Grade 4 18.7% 12.3% 6.4% 81.3%
Grade 5 22.1% 14.1% 8.0% 77.9%
Grade 6 39.9% 27.7% 12.2% 60.1%
Inhalants
All 9.5% 6.8% 2.7% 90.5%
Grade 4 7.6% 5.1% 2.5% 92.4%
Grade 5 4.4% 3.6% 0.9% 95.6%Grade 6 16.4% 11.7% 4.7% 83.6%
Marijuana
All 3.1% 2.1% 1.0% 96.9%
Grade 4 0.9% 0.4% 0.4% 99.1%
Grade 5 1.8% 0.7% 1.1% 98.2%
Grade 6 6.5% 5.1% 1.4% 93.5%

7/30/2019 2009 _ tom green county _ san angelo isd _ 2009 texas school survey of drug and alcohol use _ elementary report
http://slidepdf.com/reader/full/2009-tom-green-county-san-angelo-isd-2009-texas-school-survey-of-drug 77/137
San Angelo
Spring 2009
©Copyright 2009, Texas A&M University
All rights reserved.Elementary Report-Page 42 of 51
Table B12: Prevalence and recency of use of selected substances by gradeStudents L iving in Town 3 Years or Less
Ever
Used
School
Year
Not Past
Year
Never
Used
Tobacco
All 5.8% 4.5% 1.3% 94.2%
Grade 4 2.5% 1.3% 1.3% 97.5%
Grade 5 4.5% 4.5% 0.0% 95.5%
Grade 6 10.3% 8.0% 2.3% 89.7%
Alcohol
All 25.1% 14.7% 10.4% 74.9%
Grade 4 15.0% 8.8% 6.3% 85.0%
Grade 5 22.7% 18.2% 4.5% 77.3%
Grade 6 37.9% 18.4% 19.5% 62.1%
Inhalants
All 8.9% 6.3% 2.6% 91.1%
Grade 4 6.3% 3.8% 2.5% 93.8%
Grade 5 7.6% 6.1% 1.5% 92.4%Grade 6 12.8% 9.3% 3.5% 87.2%
Marijuana
All 2.4% 1.2% 1.2% 97.6%
Grade 4 0.0% 0.0% 0.0% 100.0%
Grade 5 1.5% 1.5% 0.0% 98.5%
Grade 6 5.8% 2.3% 3.5% 94.2%

7/30/2019 2009 _ tom green county _ san angelo isd _ 2009 texas school survey of drug and alcohol use _ elementary report
http://slidepdf.com/reader/full/2009-tom-green-county-san-angelo-isd-2009-texas-school-survey-of-drug 78/137
San Angelo
Spring 2009
©Copyright 2009, Texas A&M University
All rights reserved.Elementary Report-Page 43 of 51
3. Margin Tables

7/30/2019 2009 _ tom green county _ san angelo isd _ 2009 texas school survey of drug and alcohol use _ elementary report
http://slidepdf.com/reader/full/2009-tom-green-county-san-angelo-isd-2009-texas-school-survey-of-drug 79/137
San Angelo
Spring 2009
©Copyright 2009, Texas A&M University
All rights reserved.Elementary Report-Page 44 of 51

7/30/2019 2009 _ tom green county _ san angelo isd _ 2009 texas school survey of drug and alcohol use _ elementary report
http://slidepdf.com/reader/full/2009-tom-green-county-san-angelo-isd-2009-texas-school-survey-of-drug 80/137
San Angelo
Spring 2009
The frequencies have been weighted so that the analysis reflects
the distribution of students by grade level in the district
©Copyright 2009, Texas A&M University
All rights reserved.
Page 45 of 51
The FREQ Procedure
GENDER
Q1 Frequency Percent
Female 1015 51.96
Male 938 48.04
Frequency Missing =5.915966251
GRADE LEVEL
Q2 Frequency Percent
Grade 4 653 33.35
Grade 5 653 33.32
Grade 6 653 33.32
DO YOU LIVE WITH
BOTH PARENTS?Q3 Frequency Percent
No 759 39.14
Yes 1181 60.86
Frequency Missing =19.014931791
AGE
Q4 Frequency Percent
9 199 10.21
10 579 29.77
11 643 33.0412 476 24.45
13 or older 49 2.53
Frequency Missing =12.81802695
ETHNICITY
Q5 Frequency Percent
African/American 101 5.28
Asian/American 23 1.19
Mexican/American 961 50.22
Native/American 23 1.22Other 75 3.91
White 730 38.18
Frequency Missing =45.861831011
WHAT GRADES DO YOU
USUALLY GET
Q6 Frequency Percent
Mostly A's 844 43.83
Mostly B's 863 44.78
Mostly C's 179 9.30
Mostly D's 27 1.38
Mostly F's 14 0.72
Frequency Missing =32.618085692
LIVED IN THIS TOWN FOR
MORE THAN 3 YEARS
Q7 Frequency Percent
Don't Know 104 5.35
No 236 12.16
Yes 1601 82.49
Frequency Missing =17.804386691
EITHER PARENT
GRADUATE FROM
COLLEGE
Q8 Frequency Percent
Don't Know 609 31.36
No 488 25.10
Yes 846 43.54
Frequency Missing =15.776910735
QUALIFY FOR A
FREE/REDUCED PRICE
LUNCH?
Q9 Frequency Percent
Don't Know 702 36.47
No 558 28.98
Yes 665 34.55
Frequency Missing =33.123174713
PARENTS ATTEND
PTA MEETINGS?
Q10 Frequency Percent
No 1054 55.23
Yes 854 44.77
Frequency Missing =50.7031107
EVER INHALED
GASOLINE TO GET
HIGH?
Q11a Frequency Percent
Not Used 1849 97.85
Used 41 2.15
Frequency Missing =69.8860052
EVER INHALED PAINT
THINNER TO GET HIGH?
Q11b Frequency Percent
Not Used 1823 98.33
Used 31 1.67
Frequency Missing =105.126448
EVER INHALED GLUE TO
GET HIGH?
Q11c Frequency PercentNot Used 1813 97.61
Used 44 2.39
Frequency Missing =101.125883
EVER INHALED
WHITEOUT TO GET
HIGH?
Q11d Frequency Percent
Not Used 1816 98.29
Used 32 1.71
Frequency Missing =111.266565

7/30/2019 2009 _ tom green county _ san angelo isd _ 2009 texas school survey of drug and alcohol use _ elementary report
http://slidepdf.com/reader/full/2009-tom-green-county-san-angelo-isd-2009-texas-school-survey-of-drug 81/137
San Angelo
Spring 2009
The frequencies have been weighted so that the analysis reflects
the distribution of students by grade level in the district
©Copyright 2009, Texas A&M University
All rights reserved.
Page 46 of 51
EVER INHALED SPRAY
PAINT TO GET HIGH?
Q11e Frequency Percent
Not Used 1802 96.99
Used 56 3.01
Frequency Missing =101.03699107
EVER USED OTHER
INHALANTS TO GET
HIGH?
Q11f Frequency Percent
Not Used 1761 94.18
Used 109 5.82
Frequency Missing =89.518101284
CIGARETTE USE DURING
LIFETIME
Q12A Frequency Percent
Never heard of 90 4.67
Never used 1713 89.23
1-2 times 85 4.41
3-10 times 21 1.10
11+ times 11 0.59
Frequency Missing =39.688109105
SNUFF/CHEWING TOBACCO
USE IN LIFETIME
Q12B Frequency Percent
Never heard of 124 6.57
Never used 1730 91.60
1-2 times 28 1.47
3-10 times 3 0.15
11+ times 4 0.21
Frequency Missing =70.05396797
BEER USE DURING LIFETIME
Q12C Frequency Percent
Never heard of 24 1.30
Never used 1488 80.53
1-2 times 248 13.41
3-10 times 61 3.31
11+ times 27 1.45
Frequency Missing =111.69168348
WINE COOLER USE DURING
LIFETIME
Q12D Frequency Percent
Never heard of 401 21.47
Never used 1270 67.94
1-2 times 142 7.58
3-10 times 36 1.94
11+ times 20 1.07
Frequency Missing =89.48569694
WINE USE DURING LIFETIME
Q12E Frequency Percent
Never heard of 35 1.95
Never used 1516 83.48
1-2 times 209 11.52
3-10 times 33 1.80
11+ times 23 1.25
Frequency Missing =142.45085637
LIQUOR USE DURING
LIFETIME
Q12F Frequency Percent
Never heard of 179 9.53
Never used 1555 82.75
1-2 times 116 6.17
3-10 times 18 0.95
11+ times 11 0.60
Frequency Missing =79.737728331
SHIMERON USE DURIN
LIFETIM
Q12G Frequency Perce
Never heard of 1296 69.
Never used 561 30.2
Frequency Missing =101.350634
INHALANT USE DURIN
LIFETIM
Q12H Frequency Perce
Never heard of 154 8.2
Never used 1600 85.
1-2 times 93 4.
3-10 times 24 1.2
11+ times 10 0.
Frequency Missing =77.9100189
MARIJUANA USE DURIN
LIFETIM
Q12I Frequency Perce
Never heard of 243 12.
Never used 1593 84.
1-2 times 30 1.
3-10 times 12 0.
11+ times 10 0.
Frequency Missing =70.5028692
CIGARETTE USE IN PAS
SCHOOL YEA
Q13A Frequency Perce
Never heard of 78 4.
Never used 1759 91.
1-2 times 55 2.
3-10 times 15 0.
11+ times 8 0.4
Frequency Missing =43.3194441

7/30/2019 2009 _ tom green county _ san angelo isd _ 2009 texas school survey of drug and alcohol use _ elementary report
http://slidepdf.com/reader/full/2009-tom-green-county-san-angelo-isd-2009-texas-school-survey-of-drug 82/137
San Angelo
Spring 2009
The frequencies have been weighted so that the analysis reflects
the distribution of students by grade level in the district
©Copyright 2009, Texas A&M University
All rights reserved.
Page 47 of 51
SNUFF/CHEWING TOBACCO
USE IN PAST YEAR
Q13B Frequency Percent
Never heard of 97 5.12
Never used 1775 93.71
1-2 times 15 0.77
3-10 times 4 0.21
11+ times 4 0.21
Frequency Missing =64.498310961
BEER USE IN PAST SCHOOL
YEAR
Q13C Frequency Percent
Never heard of 22 1.16
Never used 1628 87.79
1-2 times 148 7.96
3-10 times 43 2.3111+ times 14 0.77
Frequency Missing =105.0937443
WINE COOLER USE IN PAST
SCHOOL YEAR
Q13D Frequency Percent
Never heard of 344 18.27
Never used 1411 74.87
1-2 times 89 4.72
3-10 times 24 1.2711+ times 16 0.87
Frequency Missing =74.52661772
WINE USE IN PAST SCHOOL
YEAR
Q13E Frequency Percent
Never heard of 29 1.57
Never used 1626 88.49
1-2 times 143 7.81
3-10 times 26 1.4311+ times 13 0.70
Frequency Missing =121.93581992
LIQUOR USE IN PAST SCHOOL
YEAR
Q13F Frequency Percent
Never heard of 158 8.40
Never used 1626 86.57
1-2 times 79 4.23
3-10 times 10 0.55
11+ times 5 0.26
Frequency Missing =80.161645381
SHIMERON USE IN PAST
SCHOOL YEAR
Q13G Frequency Percent
Never heard of 1191 63.72
Never used 678 36.28
Frequency Missing =89.517500845
INHALANT USE IN PAST
SCHOOL YEAR
Q13H Frequency Percent
Never heard of 135 7.15
Never used 1656 87.88
1-2 times 67 3.55
3-10 times 20 1.05
11+ times 7 0.38
Frequency Missing =74.895848151
MARIJUANA USE IN PAST
SCHOOL YEAR
Q13I Frequency Percent
Never heard of 217 11.59
Never used 1624 86.50
1-2 times 20 1.07
3-10 times 10 0.55
11+ times 6 0.30
Frequency Missing =81.965571344
AGE WHEN FIRST US
CIGARETT
Q14A Frequency Perc
7 or younger 30 1
8 years old 13 0
9 years old 18 0
10 years old 31 1
11 years old 23 1
12 or older 11 0
Never heard/used 1774 93
Frequency Missing =60.0253609
AGE WHEN FIRST US
SNUFF/CHEW TOBAC
Q14B Frequency Perc
7 or younger 12 0
8 years old 6 09 years old 4 0
10 years old 9 0
11 years old 6 0
12 or older 6 0
Never heard/used 1836 97
Frequency Missing =80.9473727
AGE WHEN FIRST USED BE
Q14C Frequency Perc
7 or younger 107 58 years old 46 2
9 years old 57 3
10 years old 59 3
11 years old 46 2
12 or older 27 1
Never heard/used 1496 81
Frequency Missing =120.557612

7/30/2019 2009 _ tom green county _ san angelo isd _ 2009 texas school survey of drug and alcohol use _ elementary report
http://slidepdf.com/reader/full/2009-tom-green-county-san-angelo-isd-2009-texas-school-survey-of-drug 83/137
San Angelo
Spring 2009
The frequencies have been weighted so that the analysis reflects
the distribution of students by grade level in the district
©Copyright 2009, Texas A&M University
All rights reserved.
Page 48 of 51
AGE WHEN FIRST USED WINE
COOLERS
Q14D Frequency Percent
7 or younger 29 1.56
8 years old 18 0.95
9 years old 27 1.44
10 years old 44 2.35
11 years old 28 1.51
12 or older 26 1.39
Never heard/used 1700 90.79
Frequency Missing =87.008419022
AGE WHEN FIRST USED WINE
Q14E Frequency Percent
7 or younger 41 2.22
8 years old 35 1.93
9 years old 51 2.76
10 years old 61 3.30
11 years old 51 2.78
12 or older 22 1.17
Never heard/used 1575 85.83
Frequency Missing =123.71506185
AGE WHEN FIRST USED LIQUOR
Q14F Frequency Percent
7 or younger 10 0.52
8 years old 11 0.57
9 years old 11 0.57
10 years old 28 1.52
11 years old 45 2.44
12 or older 29 1.56
Never heard/used 1719 92.82
Frequency Missing =107.34537069
AGE WHEN FIRST USED
SHIMERON
Q14G Frequency Percent
Never heard/used 1838 100.00
Frequency Missing =121.48631818
AGE WHEN FIRST USED
INHALANTS
Q14H Frequency Percent
7 or younger 28 1.53
8 years old 8 0.44
9 years old 16 0.87
10 years old 23 1.25
11 years old 24 1.31
12 or older 21 1.11
Never heard/used 1734 93.50
Frequency Missing =104.44327506
AGE WHEN FIRST USED
MARIJUANA
Q14I Frequency Percent
7 or younger 14 0.73
8 years old 5 0.269 years old 1 0.05
10 years old 12 0.63
11 years old 14 0.76
12 or older 10 0.55
Never heard/used 1801 97.02
Frequency Missing =102.63964932
CLOSE FRIENDS USE
CIGARETTES
Q15A Frequency PercentNever heard of 50 2.63
None 1541 81.34
Some 276 14.58
Most 28 1.45
Frequency Missing =64.418339869
CLOSE FRIENDS USE
SNUFF/CHEWING TOBACCO
Q15B Frequency Percent
Never heard of 62 3.35None 1711 92.04
Some 72 3.85
Most 14 0.77
Frequency Missing =99.681666193
CLOSE FRIENDS USE BEE
Q15C Frequency Perce
Never heard of 15 0.
None 1414 77.
Some 322 17.
Most 61 3.
Frequency Missing =146.137178
CLOSE FRIENDS USE WIN
COOLER
Q15D Frequency Perce
Never heard of 227 12.
None 1389 75.
Some 179 9.
Most 37 2.
Frequency Missing =127.346997
CLOSE FRIENDS USE WIN
Q15E Frequency Perce
Never heard of 22 1.2
None 1535 85.
Some 212 11.
Most 34 1.
Frequency Missing =156.22227
CLOSE FRIENDS USE LIQUO
Q15F Frequency Perce
Never heard of 107 5.
None 1513 83.
Some 165 9.
Most 35 1.
Frequency Missing =139.459868
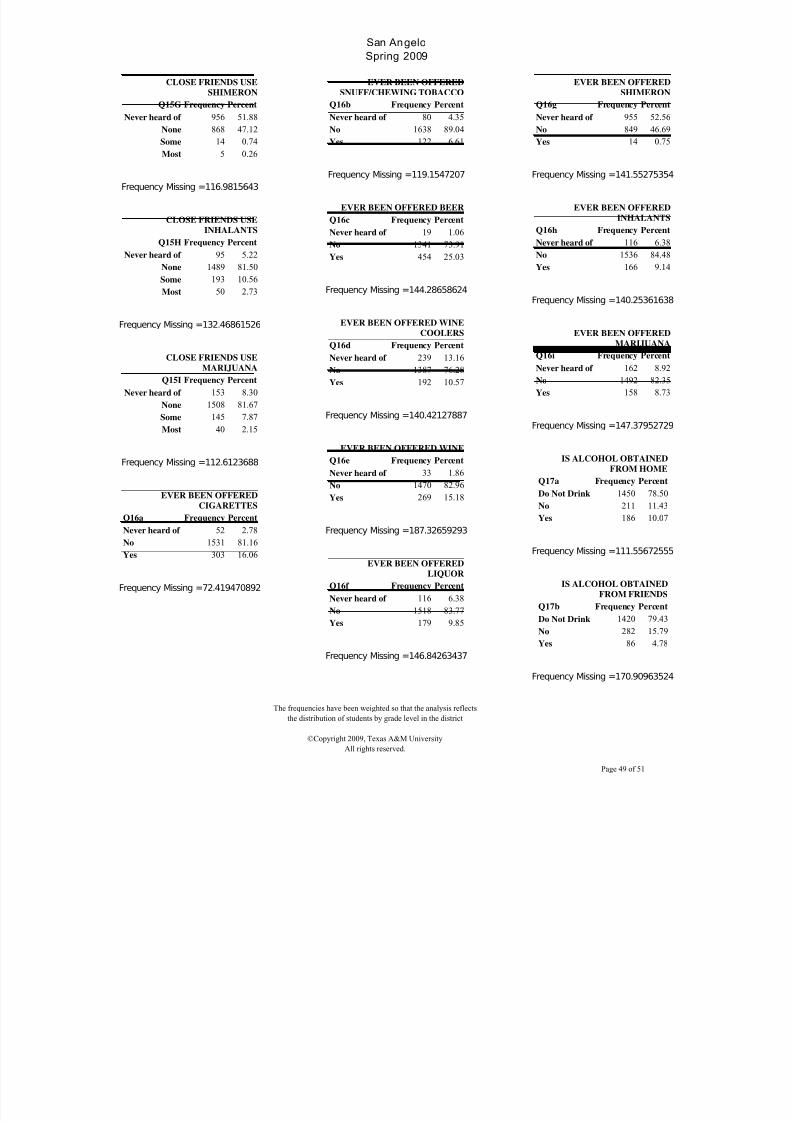
7/30/2019 2009 _ tom green county _ san angelo isd _ 2009 texas school survey of drug and alcohol use _ elementary report
http://slidepdf.com/reader/full/2009-tom-green-county-san-angelo-isd-2009-texas-school-survey-of-drug 84/137
San Angelo
Spring 2009
The frequencies have been weighted so that the analysis reflects
the distribution of students by grade level in the district
©Copyright 2009, Texas A&M University
All rights reserved.
Page 49 of 51
CLOSE FRIENDS USE
SHIMERON
Q15G Frequency Percent
Never heard of 956 51.88
None 868 47.12
Some 14 0.74
Most 5 0.26
Frequency Missing =116.9815643
CLOSE FRIENDS USE
INHALANTS
Q15H Frequency Percent
Never heard of 95 5.22
None 1489 81.50
Some 193 10.56
Most 50 2.73
Frequency Missing =132.46861526
CLOSE FRIENDS USE
MARIJUANA
Q15I Frequency Percent
Never heard of 153 8.30
None 1508 81.67
Some 145 7.87
Most 40 2.15
Frequency Missing =112.6123688
EVER BEEN OFFERED
CIGARETTES
Q16a Frequency Percent
Never heard of 52 2.78
No 1531 81.16
Yes 303 16.06
Frequency Missing =72.419470892
EVER BEEN OFFERED
SNUFF/CHEWING TOBACCO
Q16b Frequency Percent
Never heard of 80 4.35
No 1638 89.04
Yes 122 6.61
Frequency Missing =119.1547207
EVER BEEN OFFERED BEER
Q16c Frequency Percent
Never heard of 19 1.06
No 1341 73.91
Yes 454 25.03
Frequency Missing =144.28658624
EVER BEEN OFFERED WINE
COOLERS
Q16d Frequency Percent
Never heard of 239 13.16
No 1387 76.28
Yes 192 10.57
Frequency Missing =140.42127887
EVER BEEN OFFERED WINE
Q16e Frequency Percent
Never heard of 33 1.86
No 1470 82.96
Yes 269 15.18
Frequency Missing =187.32659293
EVER BEEN OFFERED
LIQUOR
Q16f Frequency Percent
Never heard of 116 6.38
No 1518 83.77
Yes 179 9.85
Frequency Missing =146.84263437
EVER BEEN OFFERE
SHIMERO
Q16g Frequency Perce
Never heard of 955 52.
No 849 46.
Yes 14 0.
Frequency Missing =141.552753
EVER BEEN OFFERE
INHALANT
Q16h Frequency Perce
Never heard of 116 6.
No 1536 84.4
Yes 166 9.
Frequency Missing =140.253616
EVER BEEN OFFERE
MARIJUAN
Q16i Frequency Perce
Never heard of 162 8.
No 1492 82.
Yes 158 8.
Frequency Missing =147.379527
IS ALCOHOL OBTAINED
FROM HOM
Q17a Frequency Percen
Do Not Drink 1450 78.5
No 211 11.4
Yes 186 10.0
Frequency Missing =111.556725
IS ALCOHOL OBTAINED
FROM FRIEND
Q17b Frequency PercenDo Not Drink 1420 79.4
No 282 15.7
Yes 86 4.7
Frequency Missing =170.909635

7/30/2019 2009 _ tom green county _ san angelo isd _ 2009 texas school survey of drug and alcohol use _ elementary report
http://slidepdf.com/reader/full/2009-tom-green-county-san-angelo-isd-2009-texas-school-survey-of-drug 85/137
San Angelo
Spring 2009
The frequencies have been weighted so that the analysis reflects
the distribution of students by grade level in the district
©Copyright 2009, Texas A&M University
All rights reserved.
Page 50 of 51
IS ALCOHOL OBTAINED
SOMEWHERE ELSE
Q17c Frequency Percent
Do Not Drink 1411 77.71
No 236 13.02Yes 168 9.27
Frequency Missing =143.13252907
DANGEROUS FOR KIDS TO USE
CIGARETTES
Q18A Frequency Percent
Very dangerous 1238 65.38
Dangerous 519 27.42
Not at all 17 0.92
Don't know 82 4.33Never heard of 37 1.94
Frequency Missing =65.269476387
DANGEROUS TO USE
SNUFF/CHEWING TOBACCO
Q18B Frequency Percent
Very dangerous 1239 66.54
Dangerous 453 24.35
Not at all 22 1.16
Don't know 104 5.58
Never heard of 44 2.37
Frequency Missing =96.789992854
DANGEROUS FOR KIDS TO USE
BEER
Q18C Frequency Percent
Very dangerous 1032 56.26
Dangerous 600 32.69
Not at all 92 5.02
Don't know 107 5.81
Never heard of 4 0.22
Frequency Missing =124.42201903
DANGEROUS FOR KIDS TO USE
WINE COOLERS
Q18D Frequency Percent
Very dangerous 923 50.04
Dangerous 475 25.77
Not at all 80 4.36
Don't know 169 9.19
Never heard of 196 10.64
Frequency Missing =114.41569432
DANGEROUS FOR KIDS TO USE
WINE
Q18E Frequency Percent
Very dangerous 918 50.33
Dangerous 600 32.89
Not at all 138 7.57
Don't know 157 8.59Never heard of 11 0.62
Frequency Missing =134.70778122
DANGEROUS FOR KIDS TO USE
LIQUOR
Q18F Frequency Percent
Very dangerous 1191 64.95
Dangerous 427 23.28
Not at all 33 1.78
Don't know 99 5.39Never heard of 84 4.59
Frequency Missing =126.11326933
DANGEROUS FOR KIDS TO USE
SHIMERON
Q18G Frequency Percent
Very dangerous 671 36.54
Dangerous 104 5.69
Not at all 7 0.37
Don't know 119 6.48Never heard of 935 50.92
Frequency Missing =123.73944566
DANGEROUS FOR KIDS TO US
INHALANT
Q18H Frequency Perce
Very dangerous 1256 68.
Dangerous 336 18.
Not at all 48 2.
Don't know 118 6.
Never heard of 76 4.
Frequency Missing =123.772450
DANGEROUS FOR KIDS TO US
MARIJUAN
Q18I Frequency Perce
Very dangerous 1476 79.
Dangerous 150 8.
Not at all 20 1.
Don't know 77 4.Never heard of 137 7.
Frequency Missing =99.4343328
DRUG/ALCOHOL INFO
FROM TEACHER
Q19a Frequency Percent
No 703 38.92
Yes 1103 61.08
Frequency Missing =153.040740
DRUG/ALC INFO
FROM VISITOR TO
CLASS
Q19b Frequency Percent
No 744 41.43
Yes 1052 58.57
Frequency Missing =162.900483
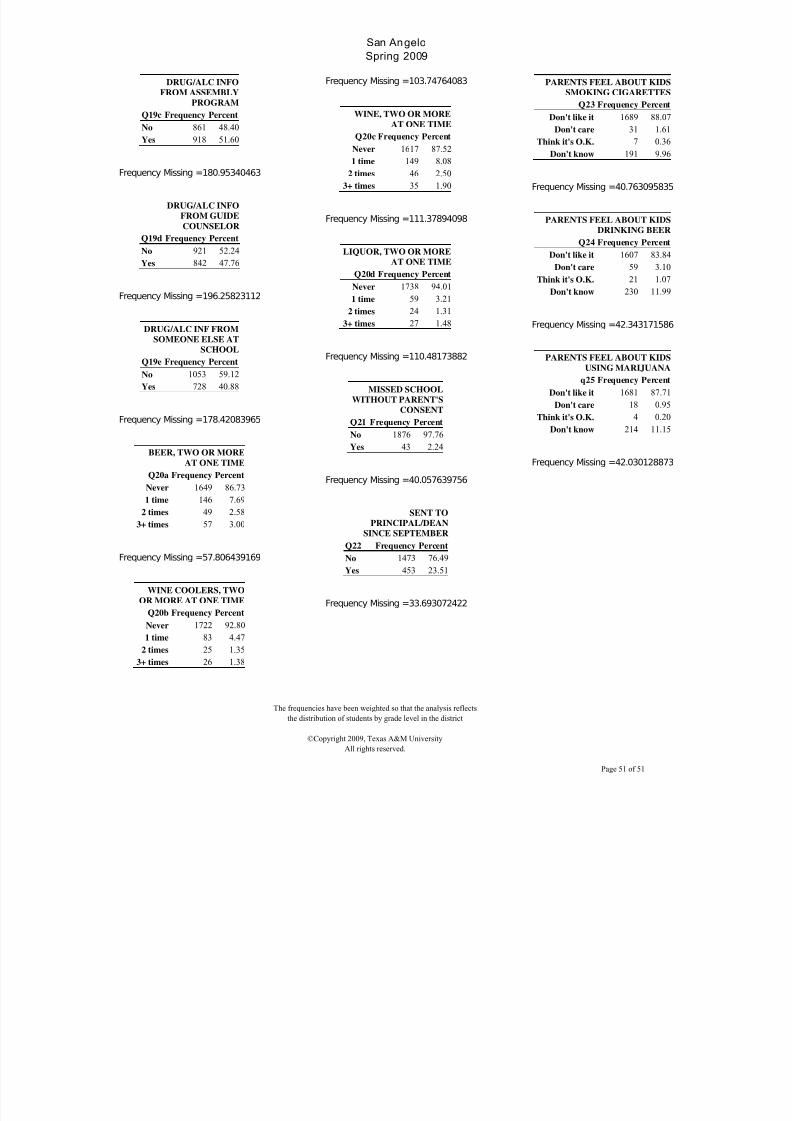
7/30/2019 2009 _ tom green county _ san angelo isd _ 2009 texas school survey of drug and alcohol use _ elementary report
http://slidepdf.com/reader/full/2009-tom-green-county-san-angelo-isd-2009-texas-school-survey-of-drug 86/137
San Angelo
Spring 2009
The frequencies have been weighted so that the analysis reflects
the distribution of students by grade level in the district
©Copyright 2009, Texas A&M University
All rights reserved.
Page 51 of 51
DRUG/ALC INFO
FROM ASSEMBLY
PROGRAM
Q19c Frequency Percent
No 861 48.40
Yes 918 51.60
Frequency Missing =180.95340463
DRUG/ALC INFO
FROM GUIDE
COUNSELOR
Q19d Frequency Percent
No 921 52.24
Yes 842 47.76
Frequency Missing =196.25823112
DRUG/ALC INF FROM
SOMEONE ELSE AT
SCHOOL
Q19e Frequency Percent
No 1053 59.12
Yes 728 40.88
Frequency Missing =178.42083965
BEER, TWO OR MOREAT ONE TIME
Q20a Frequency Percent
Never 1649 86.73
1 time 146 7.69
2 times 49 2.58
3+ times 57 3.00
Frequency Missing =57.806439169
WINE COOLERS, TWO
OR MORE AT ONE TIME
Q20b Frequency Percent
Never 1722 92.80
1 time 83 4.47
2 times 25 1.35
3+ times 26 1.38
Frequency Missing =103.74764083
WINE, TWO OR MORE
AT ONE TIME
Q20c Frequency Percent
Never 1617 87.521 time 149 8.08
2 times 46 2.50
3+ times 35 1.90
Frequency Missing =111.37894098
LIQUOR, TWO OR MORE
AT ONE TIME
Q20d Frequency Percent
Never 1738 94.01
1 time 59 3.212 times 24 1.31
3+ times 27 1.48
Frequency Missing =110.48173882
MISSED SCHOOL
WITHOUT PARENT'S
CONSENT
Q21 Frequency Percent
No 1876 97.76
Yes 43 2.24
Frequency Missing =40.057639756
SENT TO
PRINCIPAL/DEAN
SINCE SEPTEMBER
Q22 Frequency Percent
No 1473 76.49
Yes 453 23.51
Frequency Missing =33.693072422
PARENTS FEEL ABOUT KID
SMOKING CIGARETTE
Q23 Frequency Perce
Don't like it 1689 88.
Don't care 31 1.
Think it's O.K. 7 0.
Don't know 191 9.
Frequency Missing =40.7630958
PARENTS FEEL ABOUT KID
DRINKING BEE
Q24 Frequency Perce
Don't like it 1607 83.
Don't care 59 3.
Think it's O.K. 21 1.
Don't know 230 11.
Frequency Missing =42.3431715
PARENTS FEEL ABOUT KID
USING MARIJUAN
q25 Frequency Perce
Don't like it 1681 87.
Don't care 18 0.
Think it's O.K. 4 0.
Don't know 214 11.
Frequency Missing =42.0301288

7/30/2019 2009 _ tom green county _ san angelo isd _ 2009 texas school survey of drug and alcohol use _ elementary report
http://slidepdf.com/reader/full/2009-tom-green-county-san-angelo-isd-2009-texas-school-survey-of-drug 87/137
State : Grades 4-6
Spring 2009
Elementary Report-Page 1 of 51
Texas School Survey
of Drug and Alcohol Use
2009
Part II: State Results
7/30/2019 2009 _ tom green county _ san angelo isd _ 2009 texas school survey of drug and alcohol use _ elementary report
http://slidepdf.com/reader/full/2009-tom-green-county-san-angelo-isd-2009-texas-school-survey-of-drug 88/137
State : Grades 4-6
Spring 2009
Elementary Report-Page 2 of 51

7/30/2019 2009 _ tom green county _ san angelo isd _ 2009 texas school survey of drug and alcohol use _ elementary report
http://slidepdf.com/reader/full/2009-tom-green-county-san-angelo-isd-2009-texas-school-survey-of-drug 89/137
State : Grades 4-6
Spring 2009
Elementary Report-Page 3 of 51
Part II: State ResultsElementary (Grades 4-6)
Table of Contents
General Substance Tables 5-28
TobaccoAlcoholDrugsInhalantsMiscellaneous
Prevalence Tables 29-42
Selected Substances by Grade:
Table B1: All Students Table B2: Male Students Table B3: Female Students Table B4: White Students Table B5: African/American Students Table B6: Mexican/American Students Table B7: Students Reporting A Grades Table B8: Students Reporting Grades Lower Than an A Table B9: Students Living With 2 Parents Table B10: Students Not Living With 2 Parents Table B11: Students Living in Town More Than 3 Years Table B12: Students Living in Town 3 Years or Less
Margin Tables 43-51

7/30/2019 2009 _ tom green county _ san angelo isd _ 2009 texas school survey of drug and alcohol use _ elementary report
http://slidepdf.com/reader/full/2009-tom-green-county-san-angelo-isd-2009-texas-school-survey-of-drug 90/137
State : Grades 4-6
Spring 2009
Elementary Report-Page 4 of 51

7/30/2019 2009 _ tom green county _ san angelo isd _ 2009 texas school survey of drug and alcohol use _ elementary report
http://slidepdf.com/reader/full/2009-tom-green-county-san-angelo-isd-2009-texas-school-survey-of-drug 91/137
State : Grades 4-6
Spring 2009
Elementary Report-Page 5 of 51
1. General Substance Tables

7/30/2019 2009 _ tom green county _ san angelo isd _ 2009 texas school survey of drug and alcohol use _ elementary report
http://slidepdf.com/reader/full/2009-tom-green-county-san-angelo-isd-2009-texas-school-survey-of-drug 92/137
State : Grades 4-6
Spring 2009
Elementary Report-Page 6 of 51

7/30/2019 2009 _ tom green county _ san angelo isd _ 2009 texas school survey of drug and alcohol use _ elementary report
http://slidepdf.com/reader/full/2009-tom-green-county-san-angelo-isd-2009-texas-school-survey-of-drug 93/137
State : Grades 4-6
Spring 2009
Elementary Report-Page 7 of 51
Table T-1: How recently, if ever, have you used...
Ever
Used
School
Year
Not Past
Year
Never
Used
Any tobacco product
All 5.4% 3.0% 2.4% 94.6%
Grade 4 3.0% 1.6% 1.4% 97.0%
Grade 5 4.8% 2.7% 2.1% 95.2%
Grade 6 8.7% 4.9% 3.8% 91.3%
Cigarettes
All 4.7% 2.6% 2.1% 95.3%
Grade 4 2.3% 1.2% 1.1% 97.7%
Grade 5 3.9% 2.2% 1.7% 96.1%
Grade 6 7.9% 4.3% 3.6% 92.1%
Smokeless tobacco
All 1.4% 0.8% 0.7% 98.6%
Grade 4 1.0% 0.5% 0.5% 99.0%
Grade 5 1.4% 0.6% 0.7% 98.6%
Grade 6 1.9% 1.2% 0.8% 98.1%
Table T-2: Average number of times selected tobacco products were used by thosewho reported use of ..
School
Year Lifetime
All 3.1 3.0
Grade 4 2.8 2.8
Grade 5 2.5 2.6Grade 6 3.5 3.2

7/30/2019 2009 _ tom green county _ san angelo isd _ 2009 texas school survey of drug and alcohol use _ elementary report
http://slidepdf.com/reader/full/2009-tom-green-county-san-angelo-isd-2009-texas-school-survey-of-drug 94/137
State : Grades 4-6
Spring 2009
Elementary Report-Page 8 of 51
Table T-3: Average age of first use of tobacco:
Grade 4 Grade 5 Grade 6
Cigarettes
8.4 9.2 9.9
Smokeless Tobacco
8.5 9.1 10.2
Any Tobacco
8.4 9.1 9.9
Table T-4: Age of first use of tobacco by family situation:
Never Under 8 8 9 10 11 Over 11
Two Parent Family
All 96.3% 0.8% 0.5% 0.5% 0.7% 0.7% 0.5%
Grade 4 97.8% 0.8% 0.6% 0.5% 0.3% 0.0% 0.0%
Grade 5 96.9% 0.6% 0.4% 0.5% 0.8% 0.5% 0.2%Grade 6 94.1% 1.0% 0.5% 0.5% 1.0% 1.5% 1.4%
Other Family Situation
All 90.1% 2.2% 1.1% 1.6% 2.0% 1.8% 1.2%
Grade 4 94.7% 1.9% 0.6% 1.5% 0.9% 0.4% 0.0%
Grade 5 91.0% 2.5% 0.9% 1.4% 2.6% 1.3% 0.3%
Grade 6 84.9% 2.2% 1.7% 2.1% 2.3% 3.6% 3.2%
Table T-5: About how many of your c lose friends use ...
NeverHeard Of None Some Most
Any tobacco product?
All 2.2% 83.9% 12.8% 1.1%
Grade 4 3.3% 88.4% 7.6% 0.7%
Grade 5 1.8% 86.0% 11.3% 0.8%
Grade 6 1.6% 77.0% 19.5% 1.9%
Cigarettes?
All 3.7% 83.9% 11.5% 0.9%
Grade 4 5.3% 87.5% 6.6% 0.5%
Grade 5 3.3% 86.1% 9.9% 0.7%
Grade 6 2.4% 78.0% 18.0% 1.6%
Smokeless tobacco?
All 6.3% 89.0% 4.3% 0.4%
Grade 4 10.1% 87.2% 2.5% 0.3%
Grade 5 5.3% 90.4% 4.0% 0.3%
Grade 6 3.5% 89.4% 6.4% 0.7%

7/30/2019 2009 _ tom green county _ san angelo isd _ 2009 texas school survey of drug and alcohol use _ elementary report
http://slidepdf.com/reader/full/2009-tom-green-county-san-angelo-isd-2009-texas-school-survey-of-drug 95/137
State : Grades 4-6
Spring 2009
Elementary Report-Page 9 of 51
Table T-6: Have you ever been offered ...
Never
Heard Of Yes No
Any tobacco product?
All 2.7% 13.2% 84.1%
Grade 4 3.8% 9.1% 87.1%
Grade 5 2.4% 12.1% 85.5%
Grade 6 1.8% 18.5% 79.7%
Cigarettes?
All 4.0% 11.6% 84.5%
Grade 4 5.8% 7.7% 86.5%
Grade 5 3.5% 10.4% 86.1%
Grade 6 2.6% 16.7% 80.7%
Smokeless tobacco?
All 6.7% 4.6% 88.7%
Grade 4 10.7% 3.2% 86.1%
Grade 5 5.6% 4.2% 90.2%
Grade 6 3.8% 6.4% 89.8%
Table T-7: How dangerous do you think it is for kids your age to use ...
Never
Heard Of
Very
Dangerous Dangerous
Not at All
Dangerous Do Not Know
Any tobacco product?
All 1.5% 78.0% 15.6% 0.8% 4.2%
Grade 4 2.4% 81.8% 11.5% 0.4% 3.9%
Grade 5 1.1% 80.3% 14.2% 0.7% 3.7%
Grade 6 0.8% 71.7% 21.2% 1.2% 5.0%
Cigarettes?
All 2.7% 67.8% 23.2% 0.9% 5.3%
Grade 4 4.4% 73.0% 17.3% 0.5% 4.8%
Grade 5 2.3% 70.1% 22.3% 0.7% 4.7%
Grade 6 1.6% 60.3% 30.3% 1.5% 6.4%
Smokeless tobacco?
All 4.7% 69.3% 18.5% 1.2% 6.3%
Grade 4 8.0% 71.5% 13.8% 0.7% 6.0%
Grade 5 3.9% 72.1% 17.8% 0.9% 5.3%
Grade 6 2.3% 64.3% 23.9% 2.0% 7.5%
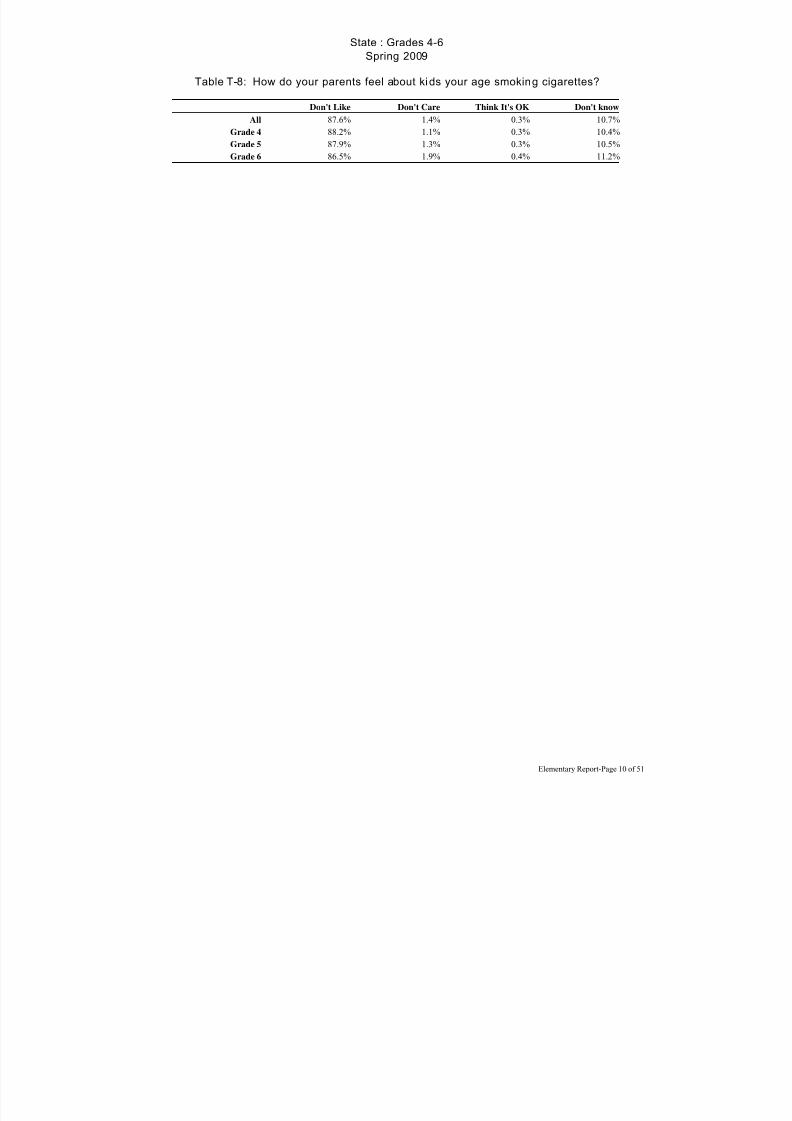
7/30/2019 2009 _ tom green county _ san angelo isd _ 2009 texas school survey of drug and alcohol use _ elementary report
http://slidepdf.com/reader/full/2009-tom-green-county-san-angelo-isd-2009-texas-school-survey-of-drug 96/137
State : Grades 4-6
Spring 2009
Elementary Report-Page 10 of 51
Table T-8: How do your parents feel about kids your age smoking cigarettes?
Don't Like Don't Care Think It's OK Don't know
All 87.6% 1.4% 0.3% 10.7%
Grade 4 88.2% 1.1% 0.3% 10.4%
Grade 5 87.9% 1.3% 0.3% 10.5%
Grade 6 86.5% 1.9% 0.4% 11.2%
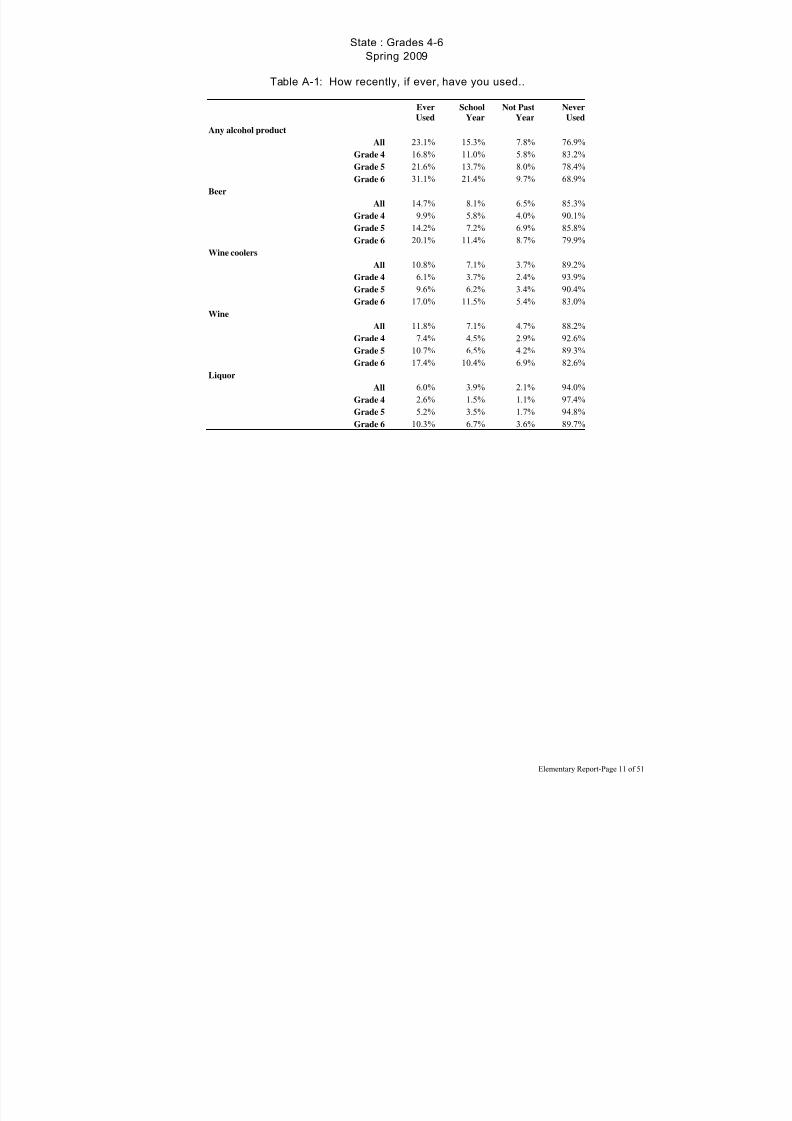
7/30/2019 2009 _ tom green county _ san angelo isd _ 2009 texas school survey of drug and alcohol use _ elementary report
http://slidepdf.com/reader/full/2009-tom-green-county-san-angelo-isd-2009-texas-school-survey-of-drug 97/137
State : Grades 4-6
Spring 2009
Elementary Report-Page 11 of 51
Table A-1: How recently, if ever, have you used..
Ever
Used
School
Year
Not Past
Year
Never
Used
Any alcohol product
All 23.1% 15.3% 7.8% 76.9%
Grade 4 16.8% 11.0% 5.8% 83.2%
Grade 5 21.6% 13.7% 8.0% 78.4%
Grade 6 31.1% 21.4% 9.7% 68.9%
Beer
All 14.7% 8.1% 6.5% 85.3%
Grade 4 9.9% 5.8% 4.0% 90.1%
Grade 5 14.2% 7.2% 6.9% 85.8%
Grade 6 20.1% 11.4% 8.7% 79.9%
Wine coolers
All 10.8% 7.1% 3.7% 89.2%
Grade 4 6.1% 3.7% 2.4% 93.9%
Grade 5 9.6% 6.2% 3.4% 90.4%
Grade 6 17.0% 11.5% 5.4% 83.0%Wine
All 11.8% 7.1% 4.7% 88.2%
Grade 4 7.4% 4.5% 2.9% 92.6%
Grade 5 10.7% 6.5% 4.2% 89.3%
Grade 6 17.4% 10.4% 6.9% 82.6%
Liquor
All 6.0% 3.9% 2.1% 94.0%
Grade 4 2.6% 1.5% 1.1% 97.4%
Grade 5 5.2% 3.5% 1.7% 94.8%
Grade 6 10.3% 6.7% 3.6% 89.7%

7/30/2019 2009 _ tom green county _ san angelo isd _ 2009 texas school survey of drug and alcohol use _ elementary report
http://slidepdf.com/reader/full/2009-tom-green-county-san-angelo-isd-2009-texas-school-survey-of-drug 98/137
State : Grades 4-6
Spring 2009
Elementary Report-Page 12 of 51
Table A-2: Average number of times selected alcohol products were used by thosewho reported use of ..
School
Year Lifetime
Beer
All 2.7 2.7
Grade 4 2.2 2.4
Grade 5 2.7 2.6
Grade 6 3.0 3.0
Liquor
All 2.7 2.8
Grade 4 2.5 2.3
Grade 5 2.4 2.5
Grade 6 2.9 3.0
Wine
All 2.7 2.7
Grade 4 2.7 2.6
Grade 5 2.5 2.6Grade 6 2.9 2.8

7/30/2019 2009 _ tom green county _ san angelo isd _ 2009 texas school survey of drug and alcohol use _ elementary report
http://slidepdf.com/reader/full/2009-tom-green-county-san-angelo-isd-2009-texas-school-survey-of-drug 99/137
State : Grades 4-6
Spring 2009
Elementary Report-Page 13 of 51
Table A-3: In the past year, how many times have you had two or more drinks at one time of ..
Never 1 Time 2 Times 3+ Times Ever
Beer?
All 88.5% 6.5% 2.6% 2.3% 11.5%
Grade 4 91.1% 5.7% 1.7% 1.5% 8.9%
Grade 5 89.6% 5.8% 2.8% 1.8% 10.4%
Grade 6 84.7% 8.2% 3.4% 3.7% 15.3%
Wine Coolers?
All 92.2% 4.3% 1.8% 1.7% 7.8%
Grade 4 96.0% 2.5% 0.9% 0.6% 4.0%
Grade 5 93.3% 3.8% 1.4% 1.5% 6.7%
Grade 6 87.2% 6.6% 3.3% 2.8% 12.8%
Wine?
All 90.5% 5.9% 2.0% 1.6% 9.5%
Grade 4 93.5% 4.5% 1.0% 1.0% 6.5%
Grade 5 91.4% 5.2% 2.2% 1.2% 8.6%
Grade 6 86.8% 7.9% 2.7% 2.6% 13.2%
Liquor?All 94.9% 2.8% 1.2% 1.1% 5.1%
Grade 4 97.3% 1.7% 0.6% 0.4% 2.7%
Grade 5 96.0% 2.3% 1.0% 0.7% 4.0%
Grade 6 91.4% 4.3% 2.0% 2.3% 8.6%

7/30/2019 2009 _ tom green county _ san angelo isd _ 2009 texas school survey of drug and alcohol use _ elementary report
http://slidepdf.com/reader/full/2009-tom-green-county-san-angelo-isd-2009-texas-school-survey-of-drug 100/137
State : Grades 4-6
Spring 2009
Elementary Report-Page 14 of 51
Table A-4: Average age of first use of alcohol:
Grade 4 Grade 5 Grade 6
Beer
8.1 8.8 9.6
Wine Coolers
8.6 9.3 10.1
Wine
8.6 9.4 10.2
Liquor
9.0 9.7 10.6
Any Alcohol
8.3 8.9 9.7
Table A-5: Age of first use of alcohol by family situation:
Never Under 8 8 9 10 11 Over 11
Two Parent Family
All 80.8% 5.3% 2.3% 3.2% 4.0% 2.8% 1.7%
Grade 4 85.9% 5.2% 2.6% 3.9% 2.0% 0.3% 0.1%
Grade 5 82.2% 5.5% 2.1% 2.6% 4.8% 2.3% 0.4%
Grade 6 73.7% 5.2% 2.3% 3.1% 5.2% 5.8% 4.7%
Other Family Situation
All 71.6% 7.8% 3.9% 4.0% 5.4% 4.5% 2.8%
Grade 4 80.5% 7.5% 4.4% 4.4% 2.5% 0.6% 0.1%
Grade 5 73.7% 7.6% 3.5% 3.9% 7.0% 3.7% 0.6%
Grade 6 61.2% 8.3% 3.7% 3.9% 6.6% 8.9% 7.4%
Table A-6 : Lifetime prevalence of use of alcohol by reported conduct problemsthis school year:
No Absences
or Conduct
Problems Cut School
Sent to
Principal Both
16.6% 60.0% 38.2% 65.3%

7/30/2019 2009 _ tom green county _ san angelo isd _ 2009 texas school survey of drug and alcohol use _ elementary report
http://slidepdf.com/reader/full/2009-tom-green-county-san-angelo-isd-2009-texas-school-survey-of-drug 101/137
State : Grades 4-6
Spring 2009
Elementary Report-Page 15 of 51
Table A-7: When you drink alcohol, do you get it from ..
Don't Drink Yes No
Home?
All 79.3% 9.5% 11.2%
Grade 4 82.8% 6.7% 10.5%
Grade 5 80.5% 8.8% 10.7%
Grade 6 74.5% 13.0% 12.6%
Friends?
All 80.0% 3.2% 16.7%
Grade 4 83.1% 1.3% 15.6%
Grade 5 81.7% 2.3% 16.1%
Grade 6 75.2% 6.2% 18.6%
Somewhere else?
All 78.5% 7.6% 13.9%
Grade 4 81.7% 5.0% 13.3%
Grade 5 79.9% 6.9% 13.2%
Grade 6 73.8% 10.9% 15.3%

7/30/2019 2009 _ tom green county _ san angelo isd _ 2009 texas school survey of drug and alcohol use _ elementary report
http://slidepdf.com/reader/full/2009-tom-green-county-san-angelo-isd-2009-texas-school-survey-of-drug 102/137
State : Grades 4-6
Spring 2009
Elementary Report-Page 16 of 51
Table A-8: About how many of your close friends use ..
Never
Heard Of None Some Most
Any alcohol product?
All 1.7% 74.4% 19.3% 4.6%
Grade 4 2.2% 80.4% 14.6% 2.8%
Grade 5 1.6% 77.4% 17.4% 3.5%
Grade 6 1.2% 65.3% 25.9% 7.6%
Beer?
All 1.9% 79.8% 15.6% 2.7%
Grade 4 2.5% 84.3% 11.5% 1.6%
Grade 5 1.7% 82.3% 13.9% 2.1%
Grade 6 1.4% 72.7% 21.4% 4.5%
Wine coolers?
All 13.0% 75.9% 8.9% 2.2%
Grade 4 16.2% 77.7% 4.9% 1.1%
Grade 5 13.5% 77.7% 7.4% 1.5%
Grade 6 9.4% 72.1% 14.4% 4.1%Wine?
All 3.2% 84.9% 10.2% 1.6%
Grade 4 4.7% 87.7% 6.7% 1.0%
Grade 5 3.1% 87.0% 8.8% 1.2%
Grade 6 2.0% 80.1% 15.3% 2.7%
Liquor?
All 7.8% 83.7% 7.1% 1.4%
Grade 4 12.8% 83.7% 3.1% 0.4%
Grade 5 6.9% 86.5% 5.7% 0.9%
Grade 6 3.8% 80.8% 12.6% 2.8%

7/30/2019 2009 _ tom green county _ san angelo isd _ 2009 texas school survey of drug and alcohol use _ elementary report
http://slidepdf.com/reader/full/2009-tom-green-county-san-angelo-isd-2009-texas-school-survey-of-drug 103/137
State : Grades 4-6
Spring 2009
Elementary Report-Page 17 of 51
Table A-9: Have you ever been offered ..
Never
Heard Of Yes No
Any alcohol product?
All 1.9% 23.9% 74.3%
Grade 4 2.3% 20.1% 77.6%
Grade 5 1.8% 21.4% 76.8%
Grade 6 1.4% 30.2% 68.3%
Beer?
All 2.0% 18.6% 79.4%
Grade 4 2.6% 15.4% 82.0%
Grade 5 1.9% 17.0% 81.2%
Grade 6 1.6% 23.5% 74.9%
Wine coolers?
All 12.9% 9.2% 78.0%
Grade 4 16.3% 5.3% 78.4%
Grade 5 13.2% 7.7% 79.1%
Grade 6 9.2% 14.5% 76.3%Wine?
All 3.3% 11.1% 85.5%
Grade 4 4.7% 8.0% 87.3%
Grade 5 3.0% 9.8% 87.2%
Grade 6 2.2% 15.8% 82.0%
Liquor?
All 7.7% 7.2% 85.1%
Grade 4 12.7% 3.8% 83.5%
Grade 5 6.7% 6.0% 87.3%
Grade 6 3.7% 12.0% 84.3%

7/30/2019 2009 _ tom green county _ san angelo isd _ 2009 texas school survey of drug and alcohol use _ elementary report
http://slidepdf.com/reader/full/2009-tom-green-county-san-angelo-isd-2009-texas-school-survey-of-drug 104/137
State : Grades 4-6
Spring 2009
Elementary Report-Page 18 of 51
Table A-10: How do your parents feel about kids your age drinking beer?
Don't Like Don't Care Think It's OK Don't know
All 82.4% 3.1% 1.1% 13.5%
Grade 4 84.1% 2.1% 1.0% 12.8%
Grade 5 82.9% 3.0% 1.0% 13.2%
Grade 6 80.2% 4.2% 1.3% 14.4%
Table A-11: How dangerous do you think it is fo r kids your age to use ..
Never
Heard Of
Very
Dangerous Dangerous
Not at All
Dangerous Do Not Know
Any alcohol product?
All 1.1% 72.1% 19.8% 2.3% 4.8%
Grade 4 1.5% 78.5% 14.4% 1.3% 4.2%
Grade 5 0.9% 73.6% 19.2% 1.8% 4.5%
Grade 6 0.7% 63.9% 25.9% 3.8% 5.7%Beer?
All 1.1% 53.4% 32.0% 5.4% 8.1%
Grade 4 1.7% 59.6% 27.3% 3.5% 7.9%
Grade 5 1.0% 54.7% 31.9% 4.7% 7.6%
Grade 6 0.7% 45.6% 36.7% 8.1% 8.8%
Wine coolers?
All 11.1% 50.6% 22.6% 5.3% 10.4%
Grade 4 14.1% 57.7% 16.4% 2.4% 9.5%
Grade 5 11.2% 52.0% 22.4% 4.8% 9.6%
Grade 6 8.1% 41.9% 29.0% 8.8% 12.2%
Wine?
All 2.1% 51.9% 29.5% 7.0% 9.6%
Grade 4 3.2% 59.1% 25.1% 4.0% 8.6%
Grade 5 1.9% 53.8% 29.1% 6.3% 8.9%
Grade 6 1.1% 42.5% 34.4% 10.7% 11.3%
Liquor?
All 6.0% 64.9% 19.6% 2.1% 7.5%
Grade 4 10.4% 68.2% 13.9% 0.9% 6.6%
Grade 5 5.2% 66.9% 18.9% 1.7% 7.3%
Grade 6 2.3% 59.5% 25.9% 3.8% 8.4%

7/30/2019 2009 _ tom green county _ san angelo isd _ 2009 texas school survey of drug and alcohol use _ elementary report
http://slidepdf.com/reader/full/2009-tom-green-county-san-angelo-isd-2009-texas-school-survey-of-drug 105/137
State : Grades 4-6
Spring 2009
Elementary Report-Page 19 of 51
Table D-1: How recently, if ever, have you used Marijuana..
Ever
Used
School
Year
Not Past
Year
Never
Used
All 1.7% 1.2% 0.5% 98.3%
Grade 4 0.7% 0.4% 0.3% 99.3%
Grade 5 1.1% 0.7% 0.4% 98.9%
Grade 6 3.4% 2.4% 0.9% 96.6%
Table D-2: Average number of times marijuana was used by those reporting usage:
School
Year Lifetime
All 4.2 4.3
Grade 4 3.8 3.9
Grade 5 3.7 3.5
Grade 6 4.4 4.6

7/30/2019 2009 _ tom green county _ san angelo isd _ 2009 texas school survey of drug and alcohol use _ elementary report
http://slidepdf.com/reader/full/2009-tom-green-county-san-angelo-isd-2009-texas-school-survey-of-drug 106/137
State : Grades 4-6
Spring 2009
Elementary Report-Page 20 of 51
Table D-3: Average age of first use of marijuana:
Grade 4 Grade 5 Grade 6
8.2 9.5 10.7
Table D-4: Age of first use of marijuana by family situation:
Never Under 8 8 9 10 11 Over 11
Two Parent Family
All 98.9% 0.2% 0.1% 0.1% 0.2% 0.2% 0.4%
Grade 4 99.5% 0.2% 0.2% 0.1% 0.0% 0.0% 0.0%
Grade 5 99.2% 0.2% 0.0% 0.1% 0.2% 0.1% 0.1%
Grade 6 97.9% 0.1% 0.1% 0.1% 0.3% 0.6% 1.0%
Other Family Situation
All 97.1% 0.4% 0.2% 0.3% 0.5% 0.6% 0.8%
Grade 4 98.9% 0.5% 0.1% 0.1% 0.4% 0.1% 0.0%
Grade 5 98.4% 0.3% 0.1% 0.3% 0.3% 0.4% 0.2%Grade 6 94.2% 0.5% 0.4% 0.6% 0.8% 1.2% 2.3%

7/30/2019 2009 _ tom green county _ san angelo isd _ 2009 texas school survey of drug and alcohol use _ elementary report
http://slidepdf.com/reader/full/2009-tom-green-county-san-angelo-isd-2009-texas-school-survey-of-drug 107/137
State : Grades 4-6
Spring 2009
Elementary Report-Page 21 of 51
Table D-5 : Lifetime prevalence of use of marijuana by reported conductproblems this school year:
No Absences
or Conduct
Problems Cut School
Sent to
Principal Both
0.5% 16.2% 4.7% 20.8%
Table D-6: About how many of your c lose friends use marijuana?
Never
Heard Of None Some Most
All 12.6% 80.4% 5.5% 1.5%
Grade 4 20.6% 76.4% 2.5% 0.6%
Grade 5 11.7% 83.1% 4.3% 0.9%
Grade 6 5.7% 81.9% 9.6% 2.9%
Table D-7: Have you ever been offered marijuana?
Never
Heard Of Yes No
All 12.4% 5.5% 82.1%
Grade 4 20.5% 3.2% 76.3%
Grade 5 11.2% 4.2% 84.6%
Grade 6 5.3% 9.1% 85.5%
Table D-8: How do your parents feel about kids your age smoking marijuana?
Don't Like Don't Care Think It's OK Don't know
All 85.8% 1.0% 0.3% 12.9%
Grade 4 83.4% 0.7% 0.3% 15.5%
Grade 5 86.4% 1.1% 0.3% 12.2%
Grade 6 87.5% 1.3% 0.3% 10.9%
Table D-9: How dangerous do you think it is for kids your age to use marijuana?
Never
Heard Of
Very
Dangerous Dangerous
Not at All
Dangerous Do Not Know
All 10.4% 75.3% 7.7% 1.2% 5.4%
Grade 4 17.3% 69.7% 6.7% 0.6% 5.7%
Grade 5 9.8% 77.9% 6.6% 0.9% 4.7%
Grade 6 4.0% 78.4% 9.8% 2.0% 5.8%
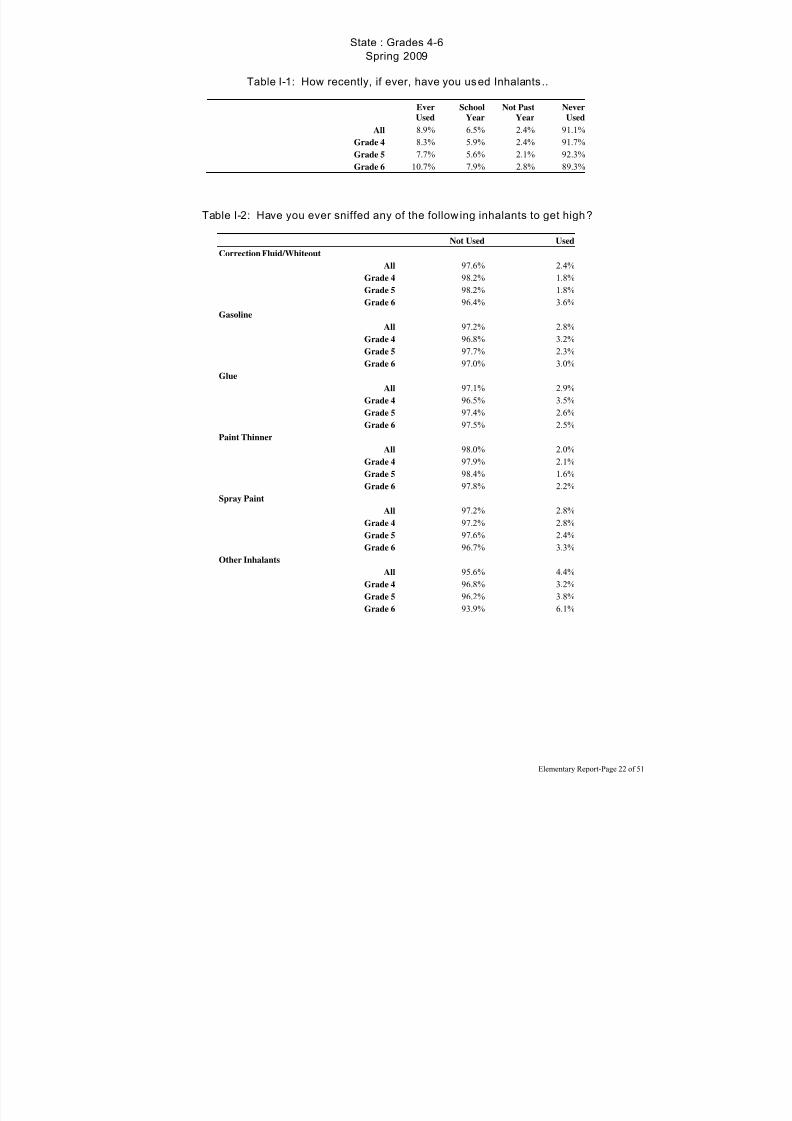
7/30/2019 2009 _ tom green county _ san angelo isd _ 2009 texas school survey of drug and alcohol use _ elementary report
http://slidepdf.com/reader/full/2009-tom-green-county-san-angelo-isd-2009-texas-school-survey-of-drug 108/137
State : Grades 4-6
Spring 2009
Elementary Report-Page 22 of 51
Table I-1: How recently, if ever, have you used Inhalants..
Ever
Used
School
Year
Not Past
Year
Never
Used
All 8.9% 6.5% 2.4% 91.1%
Grade 4 8.3% 5.9% 2.4% 91.7%
Grade 5 7.7% 5.6% 2.1% 92.3%
Grade 6 10.7% 7.9% 2.8% 89.3%
Table I-2: Have you ever sniffed any of the following inhalants to get high?
Not Used Used
Correction Fluid/Whiteout
All 97.6% 2.4%
Grade 4 98.2% 1.8%
Grade 5 98.2% 1.8%
Grade 6 96.4% 3.6%Gasoline
All 97.2% 2.8%
Grade 4 96.8% 3.2%
Grade 5 97.7% 2.3%
Grade 6 97.0% 3.0%
Glue
All 97.1% 2.9%
Grade 4 96.5% 3.5%
Grade 5 97.4% 2.6%
Grade 6 97.5% 2.5%
Paint Thinner
All 98.0% 2.0%
Grade 4 97.9% 2.1%
Grade 5 98.4% 1.6%
Grade 6 97.8% 2.2%
Spray Paint
All 97.2% 2.8%
Grade 4 97.2% 2.8%
Grade 5 97.6% 2.4%
Grade 6 96.7% 3.3%
Other Inhalants
All 95.6% 4.4%
Grade 4 96.8% 3.2%
Grade 5 96.2% 3.8%
Grade 6 93.9% 6.1%

7/30/2019 2009 _ tom green county _ san angelo isd _ 2009 texas school survey of drug and alcohol use _ elementary report
http://slidepdf.com/reader/full/2009-tom-green-county-san-angelo-isd-2009-texas-school-survey-of-drug 109/137
State : Grades 4-6
Spring 2009
Elementary Report-Page 23 of 51
Table I-3: Average number of times inhalants were used by those reporting usage:
School
Year Lifetime
All 3.5 3.5
Grade 4 3.4 3.2
Grade 5 3.5 3.4
Grade 6 3.5 3.6
Table I-4: Number of different kinds of inhalants used:
None One Two to Three Four Plus
All 91.8% 4.1% 3.2% 1.0%
Grade 4 92.4% 3.6% 3.0% 1.0%
Grade 5 92.8% 3.9% 2.5% 0.8%
Grade 6 90.0% 4.9% 4.1% 1.0%

7/30/2019 2009 _ tom green county _ san angelo isd _ 2009 texas school survey of drug and alcohol use _ elementary report
http://slidepdf.com/reader/full/2009-tom-green-county-san-angelo-isd-2009-texas-school-survey-of-drug 110/137
State : Grades 4-6
Spring 2009
Elementary Report-Page 24 of 51
Table I-5: Average age of first use of inhalants:
Grade 4 Grade 5 Grade 6
8.2 9.3 10.3
Table I-6: Age of first use of inhalants by family situation:
Never Under 8 8 9 10 11 Over 11
Two Parent Family
All 95.6% 0.9% 0.5% 0.6% 0.8% 1.0% 0.6%
Grade 4 97.1% 1.4% 0.5% 0.6% 0.4% 0.0% 0.0%
Grade 5 96.1% 0.7% 0.5% 0.7% 0.8% 1.0% 0.1%
Grade 6 93.5% 0.7% 0.6% 0.6% 1.1% 1.8% 1.7%
Other Family Situation
All 93.6% 1.1% 0.7% 0.8% 1.4% 1.4% 0.9%
Grade 4 95.9% 1.4% 0.8% 0.9% 0.9% 0.1% 0.0%
Grade 5 94.7% 0.9% 0.9% 0.5% 1.5% 1.2% 0.2%Grade 6 90.4% 0.9% 0.5% 1.1% 1.7% 2.9% 2.5%

7/30/2019 2009 _ tom green county _ san angelo isd _ 2009 texas school survey of drug and alcohol use _ elementary report
http://slidepdf.com/reader/full/2009-tom-green-county-san-angelo-isd-2009-texas-school-survey-of-drug 111/137
State : Grades 4-6
Spring 2009
Elementary Report-Page 25 of 51
Table I-7: Lifetime prevalence of use of inhalants by reported conductproblems this school year:
No Absences
or Conduct
Problems Cut School
Sent to
Principal Both
3.1% 28.2% 10.6% 34.4%
Table I-8: About how many of your close friends use inhalants?
Never
Heard Of None Some Most
All 7.2% 82.7% 8.0% 2.1%
Grade 4 11.2% 83.3% 4.5% 1.0%
Grade 5 6.8% 85.1% 6.7% 1.4%
Grade 6 3.8% 79.6% 12.7% 3.9%

7/30/2019 2009 _ tom green county _ san angelo isd _ 2009 texas school survey of drug and alcohol use _ elementary report
http://slidepdf.com/reader/full/2009-tom-green-county-san-angelo-isd-2009-texas-school-survey-of-drug 112/137
State : Grades 4-6
Spring 2009
Elementary Report-Page 26 of 51
Table I-9: Have you ever been offered inhalants?
Never
Heard Of Yes No
All 7.2% 6.9% 85.9%
Grade 4 11.1% 4.1% 84.8%
Grade 5 6.5% 5.7% 87.8%
Grade 6 4.0% 11.1% 84.9%
Table I-10: How dangerous do you think i t is for kids your age to use inhalants?
Never
Heard Of
Very
Dangerous Dangerous
Not at All
Dangerous Do Not Know
All 5.5% 66.3% 17.5% 2.8% 7.9%
Grade 4 8.9% 66.9% 14.1% 1.7% 8.3%
Grade 5 5.3% 68.3% 17.2% 2.3% 7.0%
Grade 6 2.4% 63.6% 21.3% 4.3% 8.4%

7/30/2019 2009 _ tom green county _ san angelo isd _ 2009 texas school survey of drug and alcohol use _ elementary report
http://slidepdf.com/reader/full/2009-tom-green-county-san-angelo-isd-2009-texas-school-survey-of-drug 113/137
State : Grades 4-6
Spring 2009
Elementary Report-Page 27 of 51
Table X-1: Since school began in the fall, have you got ten information on drugsor alcohol from ..
CATEGORY Yes
An Assembly Program? All 57.9%
Grade 4 56.4%
Grade 5 60.7%
Grade 6 56.6%
Guidance Counselor? All 52.1%
Grade 4 56.2%
Grade 5 54.4%
Grade 6 45.6%
Visitor to Class? All 46.0%
Grade 4 40.9%
Grade 5 48.6%
Grade 6 48.4%
Someone Else at School? All 38.8%
Grade 4 35.2%
Grade 5 38.4%Grade 6 42.7%
Your Teacher? All 58.3%
Grade 4 53.4%
Grade 5 56.7%
Grade 6 64.7%
Any School Source? All 85.6%
Grade 4 83.1%
Grade 5 86.1%
Grade 6 87.6%

7/30/2019 2009 _ tom green county _ san angelo isd _ 2009 texas school survey of drug and alcohol use _ elementary report
http://slidepdf.com/reader/full/2009-tom-green-county-san-angelo-isd-2009-texas-school-survey-of-drug 114/137
State : Grades 4-6
Spring 2008
Elementary Report-Page 28 of 51

7/30/2019 2009 _ tom green county _ san angelo isd _ 2009 texas school survey of drug and alcohol use _ elementary report
http://slidepdf.com/reader/full/2009-tom-green-county-san-angelo-isd-2009-texas-school-survey-of-drug 115/137
State : Grades 4-6
Spring 2009
Elementary Report-Page 29 of 51
2. Prevalence Tables

7/30/2019 2009 _ tom green county _ san angelo isd _ 2009 texas school survey of drug and alcohol use _ elementary report
http://slidepdf.com/reader/full/2009-tom-green-county-san-angelo-isd-2009-texas-school-survey-of-drug 116/137
State : Grades 4-6
Spring 2009
Elementary Report-Page 30 of 51

7/30/2019 2009 _ tom green county _ san angelo isd _ 2009 texas school survey of drug and alcohol use _ elementary report
http://slidepdf.com/reader/full/2009-tom-green-county-san-angelo-isd-2009-texas-school-survey-of-drug 117/137
State : Grades 4-6
Spring 2009
Elementary Report-Page 31 of 51
Table B1: Prevalence and recency of use of selected subs tances by grade Al l Students
Ever
Used
School
Year
Not Past
Year
Never
Used
Tobacco
All 5.4% 3.0% 2.4% 94.6%
Grade 4 3.0% 1.6% 1.4% 97.0%
Grade 5 4.8% 2.7% 2.1% 95.2%
Grade 6 8.7% 4.9% 3.8% 91.3%
Alcohol
All 23.1% 15.3% 7.8% 76.9%
Grade 4 16.8% 11.0% 5.8% 83.2%
Grade 5 21.6% 13.7% 8.0% 78.4%
Grade 6 31.1% 21.4% 9.7% 68.9%
Inhalants
All 8.9% 6.5% 2.4% 91.1%
Grade 4 8.3% 5.9% 2.4% 91.7%
Grade 5 7.7% 5.6% 2.1% 92.3%Grade 6 10.7% 7.9% 2.8% 89.3%
Marijuana
All 1.7% 1.2% 0.5% 98.3%
Grade 4 0.7% 0.4% 0.3% 99.3%
Grade 5 1.1% 0.7% 0.4% 98.9%
Grade 6 3.4% 2.4% 0.9% 96.6%

7/30/2019 2009 _ tom green county _ san angelo isd _ 2009 texas school survey of drug and alcohol use _ elementary report
http://slidepdf.com/reader/full/2009-tom-green-county-san-angelo-isd-2009-texas-school-survey-of-drug 118/137
State : Grades 4-6
Spring 2009
Elementary Report-Page 32 of 51
Table B2: Prevalence and recency of use of selected subs tances by gradeMale Students
Ever
Used
School
Year
Not Past
Year
Never
Used
Tobacco
All 6.6% 3.6% 3.0% 93.4%
Grade 4 4.0% 2.1% 1.9% 96.0%
Grade 5 5.7% 3.0% 2.8% 94.3%
Grade 6 10.3% 5.9% 4.3% 89.7%
Alcohol
All 26.1% 16.6% 9.6% 73.9%
Grade 4 20.4% 12.8% 7.5% 79.6%
Grade 5 24.9% 15.1% 9.9% 75.1%
Grade 6 33.3% 21.9% 11.4% 66.7%
Inhalants
All 9.8% 6.9% 2.9% 90.2%
Grade 4 9.6% 6.8% 2.8% 90.4%
Grade 5 8.5% 6.0% 2.5% 91.5%Grade 6 11.2% 8.0% 3.2% 88.8%
Marijuana
All 2.2% 1.5% 0.7% 97.8%
Grade 4 0.8% 0.5% 0.2% 99.2%
Grade 5 1.6% 0.9% 0.7% 98.4%
Grade 6 4.3% 3.1% 1.2% 95.7%

7/30/2019 2009 _ tom green county _ san angelo isd _ 2009 texas school survey of drug and alcohol use _ elementary report
http://slidepdf.com/reader/full/2009-tom-green-county-san-angelo-isd-2009-texas-school-survey-of-drug 119/137
State : Grades 4-6
Spring 2009
Elementary Report-Page 33 of 51
Table B3: Prevalence and recency of use of selected subs tances by gradeFemale Students
Ever
Used
School
Year
Not Past
Year
Never
Used
Tobacco
All 4.3% 2.4% 1.9% 95.7%
Grade 4 2.0% 1.1% 0.9% 98.0%
Grade 5 3.8% 2.3% 1.5% 96.2%
Grade 6 7.2% 3.8% 3.3% 92.8%
Alcohol
All 20.2% 14.1% 6.1% 79.8%
Grade 4 13.4% 9.3% 4.1% 86.6%
Grade 5 18.3% 12.2% 6.1% 81.7%
Grade 6 29.2% 21.1% 8.1% 70.8%
Inhalants
All 8.0% 6.0% 2.0% 92.0%
Grade 4 7.0% 5.0% 1.9% 93.0%
Grade 5 6.8% 5.0% 1.8% 93.2%Grade 6 10.3% 7.9% 2.3% 89.7%
Marijuana
All 1.3% 0.9% 0.4% 98.7%
Grade 4 0.7% 0.3% 0.3% 99.3%
Grade 5 0.7% 0.5% 0.2% 99.3%
Grade 6 2.5% 1.9% 0.7% 97.5%
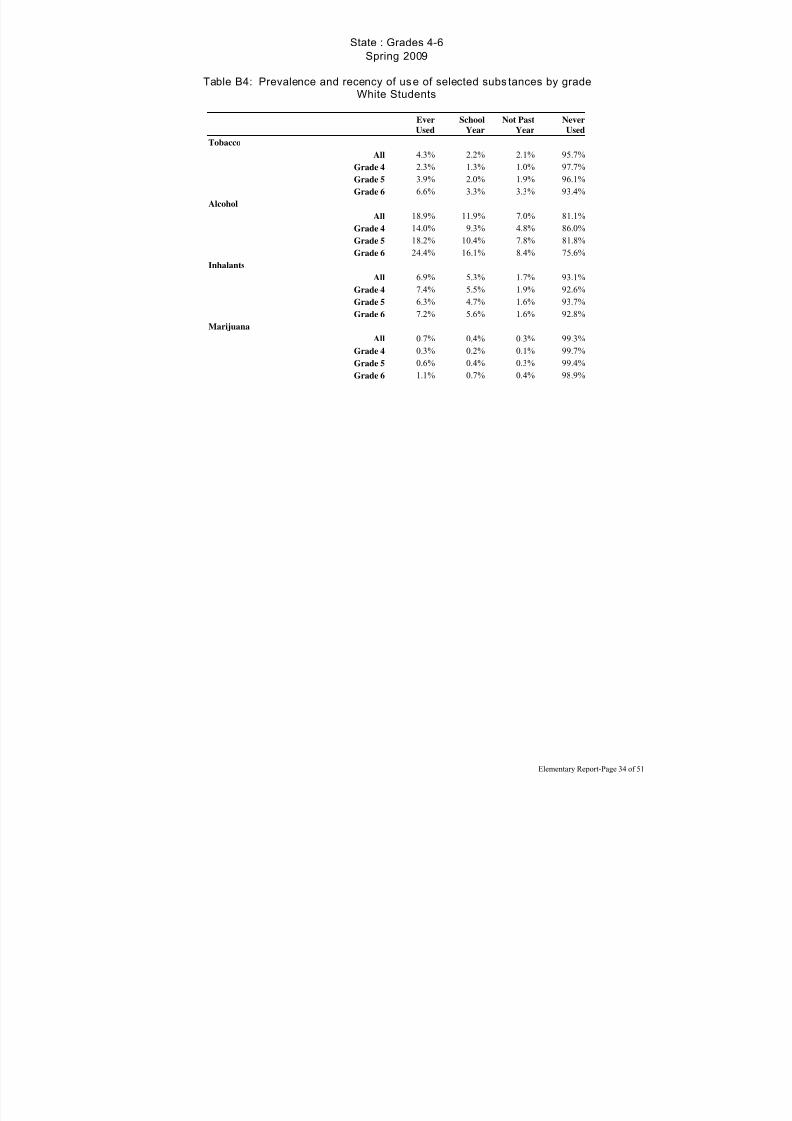
7/30/2019 2009 _ tom green county _ san angelo isd _ 2009 texas school survey of drug and alcohol use _ elementary report
http://slidepdf.com/reader/full/2009-tom-green-county-san-angelo-isd-2009-texas-school-survey-of-drug 120/137
State : Grades 4-6
Spring 2009
Elementary Report-Page 34 of 51
Table B4: Prevalence and recency of use of selected subs tances by gradeWhite Students
Ever
Used
School
Year
Not Past
Year
Never
Used
Tobacco
All 4.3% 2.2% 2.1% 95.7%
Grade 4 2.3% 1.3% 1.0% 97.7%
Grade 5 3.9% 2.0% 1.9% 96.1%
Grade 6 6.6% 3.3% 3.3% 93.4%
Alcohol
All 18.9% 11.9% 7.0% 81.1%
Grade 4 14.0% 9.3% 4.8% 86.0%
Grade 5 18.2% 10.4% 7.8% 81.8%
Grade 6 24.4% 16.1% 8.4% 75.6%
Inhalants
All 6.9% 5.3% 1.7% 93.1%
Grade 4 7.4% 5.5% 1.9% 92.6%
Grade 5 6.3% 4.7% 1.6% 93.7%Grade 6 7.2% 5.6% 1.6% 92.8%
Marijuana
All 0.7% 0.4% 0.3% 99.3%
Grade 4 0.3% 0.2% 0.1% 99.7%
Grade 5 0.6% 0.4% 0.3% 99.4%
Grade 6 1.1% 0.7% 0.4% 98.9%

7/30/2019 2009 _ tom green county _ san angelo isd _ 2009 texas school survey of drug and alcohol use _ elementary report
http://slidepdf.com/reader/full/2009-tom-green-county-san-angelo-isd-2009-texas-school-survey-of-drug 121/137
State : Grades 4-6
Spring 2009
Elementary Report-Page 35 of 51
Table B5: Prevalence and recency of use of selected subs tances by grade Af rican/American Students
Ever
Used
School
Year
Not Past
Year
Never
Used
Tobacco
All 5.6% 3.1% 2.6% 94.4%
Grade 4 4.1% 1.9% 2.2% 95.9%
Grade 5 4.7% 2.8% 1.9% 95.3%
Grade 6 8.1% 4.5% 3.6% 91.9%
Alcohol
All 28.2% 18.7% 9.5% 71.8%
Grade 4 25.0% 15.7% 9.3% 75.0%
Grade 5 27.6% 18.3% 9.2% 72.4%
Grade 6 32.0% 22.1% 9.9% 68.0%
Inhalants
All 7.8% 5.5% 2.2% 92.2%
Grade 4 6.2% 3.8% 2.4% 93.8%
Grade 5 8.9% 6.3% 2.5% 91.1%Grade 6 8.2% 6.4% 1.8% 91.8%
Marijuana
All 1.3% 0.9% 0.4% 98.7%
Grade 4 0.6% 0.3% 0.3% 99.4%
Grade 5 0.9% 0.6% 0.4% 99.1%
Grade 6 2.3% 1.8% 0.5% 97.7%

7/30/2019 2009 _ tom green county _ san angelo isd _ 2009 texas school survey of drug and alcohol use _ elementary report
http://slidepdf.com/reader/full/2009-tom-green-county-san-angelo-isd-2009-texas-school-survey-of-drug 122/137
State : Grades 4-6
Spring 2009
Elementary Report-Page 36 of 51
Table B6: Prevalence and recency of use of selected subs tances by gradeMexican/American Students
Ever
Used
School
Year
Not Past
Year
Never
Used
Tobacco
All 6.2% 3.6% 2.6% 93.8%
Grade 4 3.0% 1.6% 1.4% 97.0%
Grade 5 5.4% 3.1% 2.3% 94.6%
Grade 6 10.3% 6.2% 4.2% 89.7%
Alcohol
All 25.1% 17.1% 8.0% 74.9%
Grade 4 16.9% 11.3% 5.5% 83.1%
Grade 5 22.7% 14.8% 7.9% 77.3%
Grade 6 36.2% 25.5% 10.7% 63.8%
Inhalants
All 10.5% 7.6% 3.0% 89.5%
Grade 4 9.1% 6.6% 2.6% 90.9%
Grade 5 8.3% 5.9% 2.4% 91.7%Grade 6 14.3% 10.4% 4.0% 85.7%
Marijuana
All 2.7% 1.8% 0.8% 97.3%
Grade 4 1.0% 0.6% 0.4% 99.0%
Grade 5 1.6% 1.0% 0.5% 98.4%
Grade 6 5.5% 4.0% 1.5% 94.5%

7/30/2019 2009 _ tom green county _ san angelo isd _ 2009 texas school survey of drug and alcohol use _ elementary report
http://slidepdf.com/reader/full/2009-tom-green-county-san-angelo-isd-2009-texas-school-survey-of-drug 123/137
State : Grades 4-6
Spring 2009
Elementary Report-Page 37 of 51
Table B7: Prevalence and recency of use of selected subs tances by gradeStudents Reporting A Grades
Ever
Used
School
Year
Not Past
Year
Never
Used
Tobacco
All 2.4% 1.2% 1.3% 97.6%
Grade 4 1.4% 0.6% 0.8% 98.6%
Grade 5 2.5% 1.0% 1.4% 97.5%
Grade 6 3.5% 1.9% 1.6% 96.5%
Alcohol
All 17.7% 11.2% 6.4% 82.3%
Grade 4 13.2% 8.5% 4.8% 86.8%
Grade 5 17.2% 10.1% 7.2% 82.8%
Grade 6 23.0% 15.6% 7.5% 77.0%
Inhalants
All 5.6% 4.0% 1.6% 94.4%
Grade 4 6.1% 4.4% 1.7% 93.9%
Grade 5 5.1% 3.6% 1.5% 94.9%Grade 6 5.8% 4.1% 1.7% 94.2%
Marijuana
All 0.6% 0.4% 0.3% 99.4%
Grade 4 0.3% 0.1% 0.1% 99.7%
Grade 5 0.5% 0.3% 0.2% 99.5%
Grade 6 1.1% 0.7% 0.4% 98.9%

7/30/2019 2009 _ tom green county _ san angelo isd _ 2009 texas school survey of drug and alcohol use _ elementary report
http://slidepdf.com/reader/full/2009-tom-green-county-san-angelo-isd-2009-texas-school-survey-of-drug 124/137
State : Grades 4-6
Spring 2009
Elementary Report-Page 38 of 51
Table B8: Prevalence and recency of use of selected subs tances by gradeStudents Reporting grades lower than A
Ever
Used
School
Year
Not Past
Year
Never
Used
Tobacco
All 7.3% 4.1% 3.1% 92.7%
Grade 4 4.0% 2.2% 1.8% 96.0%
Grade 5 6.2% 3.6% 2.6% 93.8%
Grade 6 11.5% 6.5% 5.0% 88.5%
Alcohol
All 26.6% 17.9% 8.7% 73.4%
Grade 4 19.1% 12.6% 6.5% 80.9%
Grade 5 24.6% 16.0% 8.6% 75.4%
Grade 6 35.8% 24.8% 10.9% 64.2%
Inhalants
All 10.8% 7.9% 2.9% 89.2%
Grade 4 9.7% 6.9% 2.8% 90.3%
Grade 5 9.2% 6.8% 2.4% 90.8%Grade 6 13.4% 10.0% 3.4% 86.6%
Marijuana
All 2.4% 1.7% 0.7% 97.6%
Grade 4 1.0% 0.6% 0.4% 99.0%
Grade 5 1.5% 1.0% 0.5% 98.5%
Grade 6 4.6% 3.4% 1.2% 95.4%

7/30/2019 2009 _ tom green county _ san angelo isd _ 2009 texas school survey of drug and alcohol use _ elementary report
http://slidepdf.com/reader/full/2009-tom-green-county-san-angelo-isd-2009-texas-school-survey-of-drug 125/137
State : Grades 4-6
Spring 2009
Elementary Report-Page 39 of 51
Table B9: Prevalence and recency of use of selected subs tances by gradeStudents Living With 2 Parents
Ever
Used
School
Year
Not Past
Year
Never
Used
Tobacco
All 3.6% 1.9% 1.7% 96.4%
Grade 4 2.0% 1.1% 1.0% 98.0%
Grade 5 3.0% 1.6% 1.4% 97.0%
Grade 6 5.8% 3.1% 2.7% 94.2%
Alcohol
All 20.3% 13.3% 7.1% 79.7%
Grade 4 15.2% 10.2% 5.0% 84.8%
Grade 5 18.9% 11.6% 7.3% 81.1%
Grade 6 27.2% 18.2% 8.9% 72.8%
Inhalants
All 8.2% 5.9% 2.3% 91.8%
Grade 4 7.8% 5.6% 2.1% 92.2%
Grade 5 7.2% 5.1% 2.1% 92.8%Grade 6 9.7% 7.0% 2.7% 90.3%
Marijuana
All 1.2% 0.8% 0.4% 98.8%
Grade 4 0.6% 0.3% 0.2% 99.4%
Grade 5 0.9% 0.4% 0.4% 99.1%
Grade 6 2.3% 1.7% 0.6% 97.7%

7/30/2019 2009 _ tom green county _ san angelo isd _ 2009 texas school survey of drug and alcohol use _ elementary report
http://slidepdf.com/reader/full/2009-tom-green-county-san-angelo-isd-2009-texas-school-survey-of-drug 126/137
State : Grades 4-6
Spring 2009
Elementary Report-Page 40 of 51
Table B10: Prevalence and recency of use of selected substances by gradeStudents Not Living With 2 Parents
Ever
Used
School
Year
Not Past
Year
Never
Used
Tobacco
All 9.5% 5.4% 4.1% 90.5%
Grade 4 4.9% 2.7% 2.2% 95.1%
Grade 5 8.6% 4.8% 3.8% 91.4%
Grade 6 14.7% 8.5% 6.2% 85.3%
Alcohol
All 29.6% 20.0% 9.6% 70.4%
Grade 4 20.7% 13.2% 7.6% 79.3%
Grade 5 27.7% 18.2% 9.5% 72.3%
Grade 6 39.6% 28.2% 11.4% 60.4%
Inhalants
All 10.5% 7.7% 2.8% 89.5%
Grade 4 9.6% 6.7% 3.0% 90.4%
Grade 5 8.8% 6.4% 2.4% 91.2%Grade 6 13.0% 10.0% 3.0% 87.0%
Marijuana
All 2.9% 2.0% 0.8% 97.1%
Grade 4 1.1% 0.7% 0.4% 98.9%
Grade 5 1.7% 1.3% 0.4% 98.3%
Grade 6 5.7% 4.0% 1.7% 94.3%

7/30/2019 2009 _ tom green county _ san angelo isd _ 2009 texas school survey of drug and alcohol use _ elementary report
http://slidepdf.com/reader/full/2009-tom-green-county-san-angelo-isd-2009-texas-school-survey-of-drug 127/137
State : Grades 4-6
Spring 2009
Elementary Report-Page 41 of 51
Table B11: Prevalence and recency of use of selected substances by gradeStudents L iving in Town More Than 3 Years
Ever
Used
School
Year
Not Past
Year
Never
Used
Tobacco
All 5.3% 3.1% 2.3% 94.7%
Grade 4 2.9% 1.6% 1.4% 97.1%
Grade 5 4.6% 2.8% 1.8% 95.4%
Grade 6 8.4% 4.7% 3.6% 91.6%
Alcohol
All 23.1% 15.4% 7.7% 76.9%
Grade 4 17.1% 11.1% 6.0% 82.9%
Grade 5 21.1% 13.3% 7.8% 78.9%
Grade 6 30.8% 21.5% 9.3% 69.2%
Inhalants
All 8.5% 6.2% 2.3% 91.5%
Grade 4 7.8% 5.6% 2.3% 92.2%
Grade 5 7.3% 5.2% 2.1% 92.7%Grade 6 10.4% 7.7% 2.7% 89.6%
Marijuana
All 1.7% 1.2% 0.5% 98.3%
Grade 4 0.7% 0.5% 0.2% 99.3%
Grade 5 1.0% 0.7% 0.3% 99.0%
Grade 6 3.4% 2.5% 0.9% 96.6%

7/30/2019 2009 _ tom green county _ san angelo isd _ 2009 texas school survey of drug and alcohol use _ elementary report
http://slidepdf.com/reader/full/2009-tom-green-county-san-angelo-isd-2009-texas-school-survey-of-drug 128/137
State : Grades 4-6
Spring 2009
Elementary Report-Page 42 of 51
Table B12: Prevalence and recency of use of selected substances by gradeStudents L iving in Town 3 Years or Less
Ever
Used
School
Year
Not Past
Year
Never
Used
Tobacco
All 6.6% 3.3% 3.3% 93.4%
Grade 4 3.8% 2.1% 1.7% 96.2%
Grade 5 5.8% 2.0% 3.8% 94.2%
Grade 6 10.7% 6.1% 4.6% 89.3%
Alcohol
All 25.0% 16.0% 9.0% 75.0%
Grade 4 16.5% 10.7% 5.8% 83.5%
Grade 5 25.7% 15.9% 9.8% 74.3%
Grade 6 33.6% 21.9% 11.7% 66.4%
Inhalants
All 10.6% 8.0% 2.6% 89.4%
Grade 4 9.8% 7.6% 2.2% 90.2%
Grade 5 10.3% 7.4% 2.8% 89.7%Grade 6 11.8% 9.2% 2.6% 88.2%
Marijuana
All 1.9% 1.2% 0.7% 98.1%
Grade 4 0.9% 0.4% 0.5% 99.1%
Grade 5 1.8% 1.0% 0.8% 98.2%
Grade 6 3.0% 2.2% 0.8% 97.0%

7/30/2019 2009 _ tom green county _ san angelo isd _ 2009 texas school survey of drug and alcohol use _ elementary report
http://slidepdf.com/reader/full/2009-tom-green-county-san-angelo-isd-2009-texas-school-survey-of-drug 129/137
State : Grades 4-6
Spring 2009
Elementary Report-Page 43 of 51
3. Margin Tables

7/30/2019 2009 _ tom green county _ san angelo isd _ 2009 texas school survey of drug and alcohol use _ elementary report
http://slidepdf.com/reader/full/2009-tom-green-county-san-angelo-isd-2009-texas-school-survey-of-drug 130/137
State : Grades 4-6
Spring 2009
Elementary Report-Page 44 of 51

7/30/2019 2009 _ tom green county _ san angelo isd _ 2009 texas school survey of drug and alcohol use _ elementary report
http://slidepdf.com/reader/full/2009-tom-green-county-san-angelo-isd-2009-texas-school-survey-of-drug 131/137
State : Grades 4-6
Spring 2009
The frequencies have been weighted so that the
analysis reflects the distribution of students by grade
level in the districtPage 45 of 51
The FREQ Procedure
GENDER
Q1 Frequency Percent
Female 513E3 50.15
Male 51E4 49.85
Frequency Missing =5371.2975689
GRADE LEVEL
Q2 Frequency Percent
Grade 4 346E3 33.67
Grade 5 346E3 33.64
Grade 6 336E3 32.69
DO YOU LIVE WITH
BOTH PARENTS?Q3 Frequency Percent
No 32E4 31.52
Yes 695E3 68.48
Frequency Missing =14553.454933
AGE
Q4 Frequency Percent
8 or younger 536 0.05
9 77445 7.57
10 305E3 29.8211 339E3 33.12
12 258E3 25.24
13 or older 42872 4.19
Frequency Missing =6079.762905
ETHNICITY
Q5 Frequency Percent
African/American 14E4 14.08
Asian/American 11897 1.19
Mexican/American 471E3 47.17Native/American 5079 0.51
Other 21209 2.13
White 349E3 34.93
Frequency Missing =30804.064166
WHAT GRADES DO YOU
USUALLY GET
Q6 Frequency Percent
Mostly A's 37E4 36.81
Mostly B's 47E4 46.77
Mostly C's 132E3 13.15
Mostly D's 21747 2.16
Mostly F's 11116 1.11
Frequency Missing =23455.91014
LIVED IN THIS TOWN FOR
MORE THAN 3 YEARS
Q7 Frequency Percent
Don't Know 79324 7.79
No 145E3 14.27
Yes 794E3 77.94
Frequency Missing =10428.487872
EITHER PARENT
GRADUATE FROM
COLLEGE
Q8 Frequency Percent
Don't Know 343E3 33.87
No 209E3 20.64
Yes 461E3 45.49
Frequency Missing =15064.622738
QUALIFY FOR A
FREE/REDUCED PRICE
LUNCH?
Q9 Frequency Percent
Don't Know 343E3 34.26
No 289E3 28.83
Yes 37E4 36.91
Frequency Missing =26364.715759
PARENTS ATTEND
PTA MEETINGS?
Q10 Frequency Percent
No 516E3 51.62
Yes 483E3 48.38
Frequency Missing =29513.081543
EVER INHALED
GASOLINE TO GET
HIGH?
Q11a Frequency Percent
Not Used 936E3 97.16Used 27358 2.84
Frequency Missing =65264.7334
EVER INHALED PAINT
THINNER TO GET HIGH?
Q11b Frequency Percent
Not Used 933E3 98.02
Used 18797 1.98
Frequency Missing =77261.5135
EVER INHALED GLUE TO
GET HIGH?
Q11c Frequency Percent
Not Used 925E3 97.12
Used 27476 2.88
Frequency Missing =76233.5953
EVER INHALEDWHITEOUT TO GET
HIGH?
Q11d Frequency Percent
Not Used 936E3 97.63
Used 22701 2.37
Frequency Missing =69562.0701
EVER INHALED SPRAY
PAINT TO GET HIGH?
Q11e Frequency Percent
Not Used 941E3 97.20
Used 27078 2.80
Frequency Missing =61108.5830

7/30/2019 2009 _ tom green county _ san angelo isd _ 2009 texas school survey of drug and alcohol use _ elementary report
http://slidepdf.com/reader/full/2009-tom-green-county-san-angelo-isd-2009-texas-school-survey-of-drug 132/137
State : Grades 4-6
Spring 2009
The frequencies have been weighted so that the
analysis reflects the distribution of students by grade
level in the districtPage 46 of 51
EVER USED OTHER
INHALANTS TO GET
HIGH?
Q11f Frequency Percent
Not Used 933E3 95.63
Used 42653 4.37
Frequency Missing =53213.743774
CIGARETTE USE DURING
LIFETIME
Q12A Frequency Percent
Never heard of 51673 5.15
Never used 906E3 90.36
1-2 times 34548 3.44
3-10 times 7263 0.72
11+ times 3184 0.32
Frequency Missing =25876.665657
SNUFF/CHEWING TOBACCO
USE IN LIFETIME
Q12B Frequency Percent
Never heard of 108E3 10.89
Never used 868E3 87.79
1-2 times 10490 1.06
3-10 times 1392 0.14
11+ times 1198 0.12
Frequency Missing =39581.427889
BEER USE DURING LIFETIME
Q12C Frequency Percent
Never heard of 19853 2.05
Never used 809E3 83.61
1-2 times 112E3 11.53
3-10 times 20031 2.07
11+ times 7121 0.74
Frequency Missing =60827.287273
WINE COOLER USE DURING
LIFETIME
Q12D Frequency Percent
Never heard of 21E4 21.56
Never used 662E3 68.01
1-2 times 71442 7.34
3-10 times 18713 1.92
11+ times 11391 1.17
Frequency Missing =54909.300773
WINE USE DURING LIFETIME
Q12E Frequency Percent
Never heard of 39099 4.13
Never used 797E3 84.25
1-2 times 89630 9.47
3-10 times 13602 1.44
11+ times 6750 0.71
Frequency Missing =82438.041378
LIQUOR USE DURING
LIFETIME
Q12F Frequency Percent
Never heard of 113E3 11.64
Never used 805E3 82.65
1-2 times 44210 4.54
3-10 times 8401 0.86
11+ times 3067 0.31
Frequency Missing =54625.115583
SHIMERON USE DURING
LIFETIME
Q12G Frequency Percent
Never heard of 65E4 67.65
Never used 311E3 32.35
Frequency Missing =68173.960361
INHALANT USE DURIN
LIFETIM
Q12H Frequency Perce
Never heard of 96831 9.
Never used 83E4 84.
1-2 times 34874 3.
3-10 times 10295 1.
11+ times 4851 0.
Frequency Missing =51974.8057
MARIJUANA USE DURIN
LIFETIM
Q12I Frequency Perce
Never heard of 178E3 18.
Never used 794E3 80.
1-2 times 9906 1.
3-10 times 2861 0.211+ times 3095 0.
Frequency Missing =41136.4630
CIGARETTE USE IN PAS
SCHOOL YEA
Q13A Frequency Perce
Never heard of 46104 4.
Never used 933E3 92.
1-2 times 19664 1.
3-10 times 4600 0.411+ times 1917 0.
Frequency Missing =23945.4411
SNUFF/CHEWING TOBACC
USE IN PAST YEA
Q13B Frequency Perce
Never heard of 93302 9.4
Never used 89E4 89.
1-2 times 5973 0.
3-10 times 770 0.11+ times 987 0.
Frequency Missing =37718.7309

7/30/2019 2009 _ tom green county _ san angelo isd _ 2009 texas school survey of drug and alcohol use _ elementary report
http://slidepdf.com/reader/full/2009-tom-green-county-san-angelo-isd-2009-texas-school-survey-of-drug 133/137
State : Grades 4-6
Spring 2009
The frequencies have been weighted so that the
analysis reflects the distribution of students by grade
level in the districtPage 47 of 51
BEER USE IN PAST SCHOOL
YEAR
Q13C Frequency Percent
Never heard of 18649 1.91
Never used 873E3 89.64
1-2 times 65736 6.75
3-10 times 12570 1.29
11+ times 3957 0.41
Frequency Missing =54887.127982
WINE COOLER USE IN PAST
SCHOOL YEAR
Q13D Frequency Percent
Never heard of 181E3 18.41
Never used 732E3 74.33
1-2 times 52036 5.28
3-10 times 12207 1.2411+ times 7320 0.74
Frequency Missing =43849.460014
WINE USE IN PAST SCHOOL
YEAR
Q13E Frequency Percent
Never heard of 37422 3.88
Never used 856E3 88.69
1-2 times 58678 6.08
3-10 times 7706 0.8011+ times 5347 0.55
Frequency Missing =64078.750757
LIQUOR USE IN PAST SCHOOL
YEAR
Q13F Frequency Percent
Never heard of 104E3 10.58
Never used 838E3 85.44
1-2 times 31707 3.23
3-10 times 5249 0.5411+ times 2112 0.22
Frequency Missing =47699.030393
SHIMERON USE IN PAST
SCHOOL YEAR
Q13G Frequency Percent
Never heard of 599E3 61.14
Never used 38E4 38.86
Frequency Missing =49740.187766
INHALANT USE IN PAST
SCHOOL YEAR
Q13H Frequency Percent
Never heard of 89696 9.13
Never used 853E3 86.82
1-2 times 27829 2.83
3-10 times 7683 0.78
11+ times 4254 0.43
Frequency Missing =46167.8146
MARIJUANA USE IN PAST
SCHOOL YEAR
Q13I Frequency Percent
Never heard of 167E3 16.91
Never used 807E3 81.87
1-2 times 7544 0.77
3-10 times 2200 0.22
11+ times 2261 0.23
Frequency Missing =43211.366064
AGE WHEN FIRST USED
CIGARETTES
Q14A Frequency Percent
7 or younger 10157 1.02
8 years old 6038 0.61
9 years old 7214 0.72
10 years old 9624 0.97
11 years old 9323 0.94
12 or older 6804 0.68
Never heard/used 948E3 95.07
Frequency Missing =32052.034181
AGE WHEN FIRST US
SNUFF/CHEW TOBAC
Q14B Frequency Perc
7 or younger 2828 0
8 years old 1636 0
9 years old 2539 0
10 years old 2828 0
11 years old 2623 0
12 or older 1746 0
Never heard/used 969E3 98
Frequency Missing =45864.0046
AGE WHEN FIRST USED BE
Q14C Frequency Perc
7 or younger 42451 4
8 years old 18078 1
9 years old 20891 2
10 years old 26106 2
11 years old 19314 1
12 or older 12725 1
Never heard/used 831E3 85
Frequency Missing =58461.8704
AGE WHEN FIRST USED WI
COOLE
Q14D Frequency Perc
7 or younger 14100 18 years old 10525 1
9 years old 14574 1
10 years old 21438 2
11 years old 20103 2
12 or older 12355 1
Never heard/used 883E3 90
Frequency Missing =52600.9556
AGE WHEN FIRST USED WI
Q14E Frequency Perc
7 or younger 14860 1
8 years old 12708 1
9 years old 18356 1
10 years old 25093 2
11 years old 20774 2
12 or older 14253 1
Never heard/used 852E3 88

7/30/2019 2009 _ tom green county _ san angelo isd _ 2009 texas school survey of drug and alcohol use _ elementary report
http://slidepdf.com/reader/full/2009-tom-green-county-san-angelo-isd-2009-texas-school-survey-of-drug 134/137
State : Grades 4-6
Spring 2009
The frequencies have been weighted so that the
analysis reflects the distribution of students by grade
level in the districtPage 48 of 51
Frequency Missing =70919.025548
AGE WHEN FIRST USED LIQUOR
Q14F Frequency Percent
7 or younger 5094 0.528 years old 4332 0.45
9 years old 5868 0.60
10 years old 11864 1.22
11 years old 13782 1.42
12 or older 11504 1.18
Never heard/used 921E3 94.61
Frequency Missing =55429.945378
AGE WHEN FIRST USED
SHIMERONQ14G Frequency Percent
Never heard/used 967E3 100.00
Frequency Missing =62167.428542
AGE WHEN FIRST USED
INHALANTS
Q14H Frequency Percent
7 or younger 9356 0.96
8 years old 5874 0.61
9 years old 6489 0.67
10 years old 9491 0.98
11 years old 10772 1.11
12 or older 6797 0.70
Never heard/used 921E3 94.97
Frequency Missing =58574.32236
AGE WHEN FIRST USED
MARIJUANA
Q14I Frequency Percent
7 or younger 2618 0.27
8 years old 1232 0.13
9 years old 1546 0.16
10 years old 2700 0.28
11 years old 3348 0.34
12 or older 4920 0.50
Never heard/used 961E3 98.32
Frequency Missing =51768.968081
CLOSE FRIENDS USE
CIGARETTES
Q15A Frequency Percent
Never heard of 36182 3.66
None 829E3 83.94Some 113E3 11.46
Most 9224 0.93
Frequency Missing =40970.292438
CLOSE FRIENDS USE
SNUFF/CHEWING TOBACCO
Q15B Frequency Percent
Never heard of 60984 6.27
None 866E3 89.01
Some 41871 4.31Most 4060 0.42
Frequency Missing =56234.621442
CLOSE FRIENDS USE BEER
Q15C Frequency Percent
Never heard of 17986 1.87
None 766E3 79.81
Some 15E4 15.59
Most 26146 2.72
Frequency Missing =68674.398676
CLOSE FRIENDS USE WINE
COOLERS
Q15D Frequency Percent
Never heard of 126E3 13.03
None 731E3 75.86
Some 85654 8.89
Most 21475 2.23
Frequency Missing =64845.767269
CLOSE FRIENDS USE WIN
Q15E Frequency Perce
Never heard of 30691 3.2
None 804E3 84.
Some 96707 10.2
Most 15272 1.
Frequency Missing =82150.4261
CLOSE FRIENDS USE LIQUO
Q15F Frequency Perce
Never heard of 75156 7.
None 804E3 83.
Some 68099 7.
Most 13150 1.
Frequency Missing =68737.0235
CLOSE FRIENDS US
SHIMERO
Q15G Frequency Perce
Never heard of 482E3 50.2
None 468E3 48.
Some 7174 0.
Most 2047 0.2
Frequency Missing =69579.3570
CLOSE FRIENDS US
INHALANT
Q15H Frequency Perce
Never heard of 69636 7.2
None 795E3 82.
Some 76758 7.
Most 19983 2.
Frequency Missing =67439.0832
CLOSE FRIENDS US
MARIJUAN
Q15I Frequency Perce
Never heard of 122E3 12.
None 777E3 80.4
Some 52642 5.4
Most 14186 1.4

7/30/2019 2009 _ tom green county _ san angelo isd _ 2009 texas school survey of drug and alcohol use _ elementary report
http://slidepdf.com/reader/full/2009-tom-green-county-san-angelo-isd-2009-texas-school-survey-of-drug 135/137
State : Grades 4-6
Spring 2009
The frequencies have been weighted so that the
analysis reflects the distribution of students by grade
level in the districtPage 49 of 51
Frequency Missing =63343.139677
EVER BEEN OFFERED
CIGARETTES
Q16a Frequency Percent
Never heard of 39048 3.95No 835E3 84.47
Yes 114E3 11.58
Frequency Missing =40201.594718
EVER BEEN OFFERED
SNUFF/CHEWING TOBACCO
Q16b Frequency Percent
Never heard of 64863 6.69
No 86E4 88.72
Yes 44479 4.59
Frequency Missing =59071.691877
EVER BEEN OFFERED BEER
Q16c Frequency Percent
Never heard of 19655 2.04
No 766E3 79.38
Yes 179E3 18.58
Frequency Missing =63439.632757
EVER BEEN OFFERED WINE
COOLERS
Q16d Frequency Percent
Never heard of 124E3 12.89
No 748E3 77.95
Yes 87917 9.16
Frequency Missing =68597.329025
EVER BEEN OFFERED WINEQ16e Frequency Percent
Never heard of 31898 3.34
No 816E3 85.51
Yes 106E3 11.15
Frequency Missing =74936.299109
EVER BEEN OFFERED
LIQUOR
Q16f Frequency Percent
Never heard of 73630 7.70
No 813E3 85.07
Yes 69166 7.23
Frequency Missing =72545.71998
EVER BEEN OFFERED
SHIMERON
Q16g Frequency Percent
Never heard of 465E3 48.72
No 481E3 50.36
Yes 8795 0.92
Frequency Missing =73992.295549
EVER BEEN OFFERED
INHALANTS
Q16h Frequency Percent
Never heard of 68829 7.19
No 822E3 85.87
Yes 66518 6.95
Frequency Missing =71058.973517
EVER BEEN OFFERED
MARIJUANA
Q16i Frequency Percent
Never heard of 119E3 12.36
No 793E3 82.13
Yes 53246 5.51
Frequency Missing =63092.554673
IS ALCOHOL OBTAINED
FROM HOME
Q17a Frequency PercentDo Not Drink 77E4 79.32
No 109E3 11.22
Yes 91789 9.46
Frequency Missing =58202.977159
IS ALCOHOL OBTAINED
FROM FRIEND
Q17b Frequency Percen
Do Not Drink 758E3 80.0
No 159E3 16.7
Yes 30723 3.2
Frequency Missing =80769.2300
IS ALCOHOL OBTAINED
SOMEWHERE ELS
Q17c Frequency Percen
Do Not Drink 752E3 78.4
No 133E3 13.9
Yes 72486 7.5
Frequency Missing =71091.5389
DANGEROUS FOR KIDS TO US
CIGARETTE
Q18A Frequency Perce
Very dangerous 666E3 67.
Dangerous 228E3 23.
Not at all 8768 0.
Don't know 51842 5.
Never heard of 27003 2.
Frequency Missing =46537.0694
DANGEROUS TO US
SNUFF/CHEWING TOBACC
Q18B Frequency Perce
Very dangerous 669E3 69.
Dangerous 179E3 18.
Not at all 11556 1.
Don't know 60537 6.
Never heard of 45676 4.
Frequency Missing =63133.0509

7/30/2019 2009 _ tom green county _ san angelo isd _ 2009 texas school survey of drug and alcohol use _ elementary report
http://slidepdf.com/reader/full/2009-tom-green-county-san-angelo-isd-2009-texas-school-survey-of-drug 136/137
State : Grades 4-6
Spring 2009
The frequencies have been weighted so that the
analysis reflects the distribution of students by grade
level in the districtPage 50 of 51
DANGEROUS FOR KIDS TO USE
BEER
Q18C Frequency Percent
Very dangerous 51E4 53.37
Dangerous 305E3 31.97
Not at all 51642 5.41
Don't know 77420 8.11
Never heard of 10954 1.15
Frequency Missing =74025.261991
DANGEROUS FOR KIDS TO USE
WINE COOLERS
Q18D Frequency Percent
Very dangerous 484E3 50.57
Dangerous 216E3 22.58
Not at all 50731 5.30
Don't know 99936 10.43Never heard of 107E3 11.13
Frequency Missing =70706.947359
DANGEROUS FOR KIDS TO USE
WINE
Q18E Frequency Percent
Very dangerous 492E3 51.87
Dangerous 28E4 29.52
Not at all 66160 6.97
Don't know 90860 9.57Never heard of 19638 2.07
Frequency Missing =79364.367651
DANGEROUS FOR KIDS TO USE
LIQUOR
Q18F Frequency Percent
Very dangerous 62E4 64.88
Dangerous 187E3 19.57
Not at all 20392 2.13
Don't know 71169 7.45Never heard of 56976 5.97
Frequency Missing =73632.497298
DANGEROUS FOR KIDS TO USE
SHIMERON
Q18G Frequency Percent
Very dangerous 363E3 38.11
Dangerous 52771 5.54
Not at all 4244 0.45
Don't know 74792 7.86
Never heard of 457E3 48.04
Frequency Missing =76697.635053
DANGEROUS FOR KIDS TO USE
INHALANTS
Q18H Frequency Percent
Very dangerous 633E3 66.29
Dangerous 167E3 17.51
Not at all 26436 2.77
Don't know 75491 7.91Never heard of 52780 5.53
Frequency Missing =73811.871061
DANGEROUS FOR KIDS TO USE
MARIJUANA
Q18I Frequency Percent
Very dangerous 726E3 75.33
Dangerous 73950 7.68
Not at all 11428 1.19
Don't know 52184 5.42Never heard of 1E5 10.39
Frequency Missing =65397.185312
DRUG/ALCOHOL INFO
FROM TEACHER
Q19a Frequency Percent
No 393E3 41.72
Yes 549E3 58.28
Frequency Missing =85994.409479
DRUG/ALC INFO
FROM VISITOR TO
CLASS
Q19b Frequency Percent
No 502E3 54.04
Yes 427E3 45.96
Frequency Missing =99942.9669
DRUG/ALC INFO
FROM ASSEMBLY
PROGRAM
Q19c Frequency Percent
No 391E3 42.08
Yes 538E3 57.92
Frequency Missing =99285.8138
DRUG/ALC INFO
FROM GUIDE
COUNSELOR
Q19d Frequency Percent
No 447E3 47.90
Yes 486E3 52.10
Frequency Missing =95380.0094
DRUG/ALC INF FROM
SOMEONE ELSE AT
SCHOOL
Q19e Frequency Percent
No 569E3 61.24
Yes 36E4 38.76
Frequency Missing =99546.8169
BEER, TWO OR MORE
AT ONE TIME
Q20a Frequency Percent
Never 856E3 88.50
1 time 63247 6.54
2 times 25527 2.64
3+ times 22517 2.33
Frequency Missing =61307.0785

7/30/2019 2009 _ tom green county _ san angelo isd _ 2009 texas school survey of drug and alcohol use _ elementary report
http://slidepdf.com/reader/full/2009-tom-green-county-san-angelo-isd-2009-texas-school-survey-of-drug 137/137
State : Grades 4-6
Spring 2009
WINE COOLERS, TWO
OR MORE AT ONE TIME
Q20b Frequency Percent
Never 874E3 92.16
1 time 41054 4.33
2 times 17525 1.85
3+ times 15770 1.66
Frequency Missing =80611.281893
WINE, TWO OR MORE
AT ONE TIME
Q20c Frequency Percent
Never 856E3 90.55
1 time 55492 5.87
2 times 18649 1.97
3+ times 15252 1.61
Frequency Missing =82950.018118
LIQUOR, TWO OR MORE
AT ONE TIME
Q20d Frequency Percent
Never 905E3 94.90
1 time 26560 2.79
2 times 11149 1.17
3+ times 10928 1.15
PARENTS FEEL ABOUT KIDS
SMOKING CIGARETTES
Q23 Frequency Percent
Don't like it 868E3 87.58
Don't care 14222 1.43Think it's O.K. 3040 0.31
Don't know 106E3 10.68
Frequency Missing =37183.620116
PARENTS FEEL ABOUT KIDS
DRINKING BEER
Q24 Frequency Percent
Don't like it 817E3 82.42
Don't care 30306 3.06
Think it's O.K. 10557 1.06Don't know 133E3 13.46
Frequency Missing =37509.762046
PARENTS FEEL ABOUT KIDS
USING MARIJUANA
q25 Frequency Percent
Don't like it 85E4 85.77
Don't care 10233 1.03
Think it's O.K. 3176 0.32
Don't know 128E3 12.88