2009 community survey presentation of final results january 21, 2010
DESCRIPTION
2009 COMMUNITY SURVEY Presentation of Final Results January 21, 2010. PROJECT SUMMARY. The WTA Strategic Plan recommended implementation of several major service and facilities projects, including a network of high frequency corridors and building a new northern transit hub. - PowerPoint PPT PresentationTRANSCRIPT

2009 COMMUNITY SURVEY
Presentation of Final ResultsJanuary 21, 2010

PROJECT SUMMARY
The WTA Strategic Plan recommended implementation of several major service and facilities projects, including a network of high frequency corridors and building a new northern transit hub.
WTA began implementing these recommendations in 2005 and all major recommended projects have been completed.
The primary purpose of this survey is to measure the satisfaction of the general public and riders with services since the implementation of major these service modifications.
1

METHODOLOGY- ResidentTelephone Survey
Telephone surveys conducted with Whatcom County residents between 11/4 and 11/18/2009.
Overall sample of 824 provides accuracy of + 3.4% at a 95% confidence level.
411 surveys were conducted with Bellingham residents.
413 surveys were conducted with County residents outside of the City limits.
The subsets provide accuracy at + 4.8% at a 95% confidence level.
2

SURVEYS BY GEOGRAPHIC AREA
CITY %
Bellingham 50%
Blaine 5%Everson, Nooksack &
Sumas6%
Ferndale 10%
Lynden 8%
Unincorporated 22%
3

AWARENESS
Just under half of residents have read or seen something in the
media about WTA in the past few months.
4
HAVE YOU HEARD OR SEEN INFORMATION ABOUT PUBLIC TRANSPORTATION ...?
No 57%Yes 43%
WHAT DO YOU RECALL SEEING OR HEARING?
11%
35%
22%
31%
0%
10%
20%
30%
40%
Revenues down Service may becut
Other Don't recall

FAMILIARITY WITH BUS SERVICE Sixty-one percent of residents say they are at least somewhat
familiar with WTA bus service.
5
HOW FAMILIAR ARE YOU WITH BUS SERVICE IN YOUR AREA?
22%
39%
19% 20%
0%
20%
40%
Very Familiar Somewhat Familiar Not Very Familiar Not At All Familiar
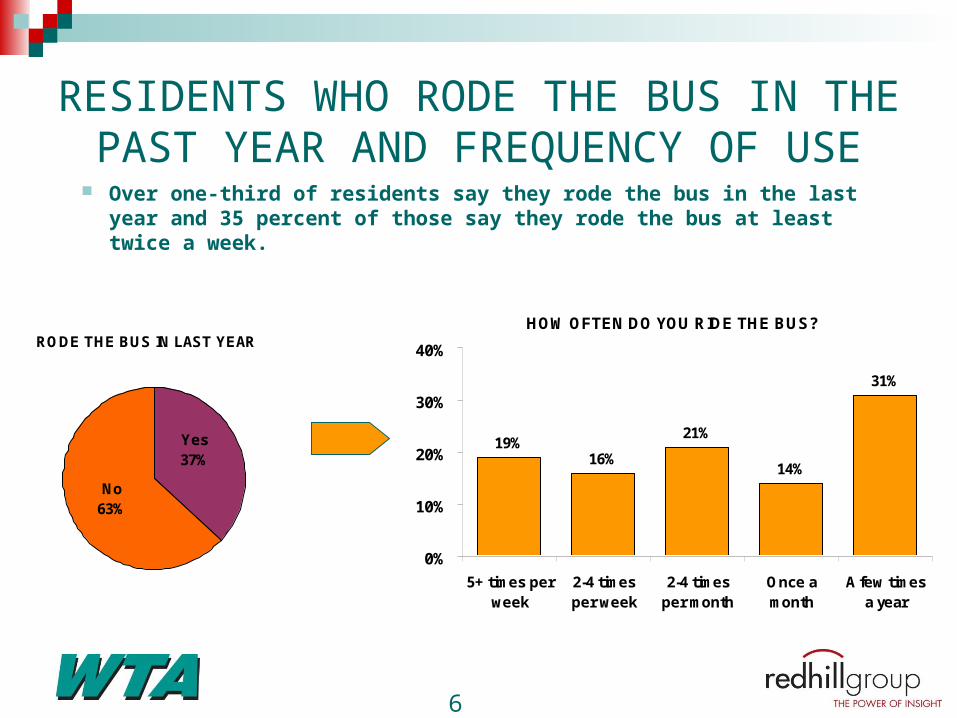
RESIDENTS WHO RODE THE BUS IN THE PAST YEAR AND FREQUENCY OF USE Over one-third of residents say they rode the bus in the last year and
35 percent of those say they rode the bus at least twice a week.
6
RODE THE BUS IN LAST YEAR
Yes37%
No63%
HOW OFTEN DO YOU RIDE THE BUS?
19%16%
21%
14%
31%
0%
10%
20%
30%
40%
5+ times perweek
2-4 timesper week
2-4 timesper month
Once amonth
A few timesa year

PERCEIVED CHANGE IN BUS SERVICE 2004-2009
More than half of residents think that bus service has improved from 2004-2009.
7
HOW HAS BUS SERVICE CHANGED IN THE PAST FIVE YEARS?
55%
20%
5%
21%
0%
20%
40%
60%
Improved About the same Worse Don't Know

EVALUATION OF CHANGES IN SERVICE Frequency of service (43%) followed by span of weekday service (35%)
were cited as having improved most over the past five years.
8
HOW HAS BUS SERVICE CHANGED IN THE PAST FIVE YEARS?
12% 12% 8%
31%23%
23%
20%23% 26%
32% 38% 39%
8%
20%
23%
3%4%4%
5%
1%1%1% 2%
42%
0%
20%
40%
60%
80%
100%
Frequency of service Weekday span ofservice
Length of time todestination
Availability of serviceon weekends
DK
Much Worse
Worse
Same
Better
Much Better

AWARENESS OF GO LINES Half of the residents have heard of the GO Lines and of those 43
percent say the GO Lines run more frequently than other routes.
9
HOW ARE THE GO LINES DIFFERENT?
43%
11%
46%
0%
20%
40%
60%
Run morefrequently
Other Don't Know
ARE YOU AWARE OF THE GO LINES?
No48%
Yes52%

ROLE OF BUS SERVICE WTA provides a needed service. WTA provides an option for “choice riders.” WTA is good for the economy and environment.
10
36% 34%26% 22%
6%
49% 49%57%
48%
23%
18%
13%
42%
7% 8% 9%
4% 6% 5%7% 10%
1% 1% 1%1%
6%5%2%2%3%
0%
20%
40%
60%
80%
100%
Is needed forresidents with noother way to get
around
Reduces airpollution
Is an alternativeto driving alone
Helps theeconomy
Providestransportation
only for residentswith no other
alternative
DK
Strongly Disgree
Disagree
Neutral
Agree
Strongly Agree

SATISFACTION WITH BUS SERVICE Fifty-seven percent of residents are satisfied or very satisfied with WTA services.
11
OVERALL HOW SATISFIED ARE YOU WITH BUS SERVICE?
17%26%
10%
41%
44%
39%
20%
16%
22%
15%9%
19%
6%8%
4%2%
2%
2%
0%
20%
40%
60%
80%
100%
All Residents Bellingham Outside Bellingham
DK
VeryDissatisfied
SomewhatDisatisfied
SomewhatSatisfied
Satisfied
VerySatisfied

LEVEL OF SERVICE Eighty-seven percent of residents think bus services should be maintained or increased.
12
HOW SERVICE SHOULD BE CHANGED?
43% 42% 43%
44% 47% 43%
4%3%
5%
9% 7% 10%
0%
20%
40%
60%
80%
100%
All Residents Bellingham Outside Bellingham
Don’t Know
Decrease
Maintain atcurrent level
Increase

AWARENESS OF REVENUE DOWNTURN Just over one quarter of Whatcom County residents knew there
was a funding shortfall prior to taking the survey.
13
AWARENESS OF FUNDING SHORTFALL
26%
34%
21%
79%
66%74%
0%
20%
40%
60%
80%
All Residents Bellingham Outside Bellingham
Yes
No

OPTIONS FOR ADDRESSING SHORTFALL
More than half of Whatcom County residents say that a sales tax increase should be used to maintain or expand WTA service.
14
HOW SHOULD REVENUES AND EXPENSES BE BALANCED?
38%
22%18%
4% 3% 5%10%
20% 20%
2% 2%5% 7%
23%
17%
5% 4% 5%
12%
44%
34%
0%
20%
40%
60%
Increase salestax to maintain
service
Reduceservice
Increase salestax to expand
service
Raise fares Don't raisetaxes
Other Don't know
Overall Bellingham Outside Bellingham

METHODOLOGY- Onboard Survey
Surveys conducted with onboard riders between November 30 and December 5, 2009.
Surveys were conducted throughout the service day to secure a representative sample of all riders.
596 surveys were completed, providing a margin of error of + 4.0% at a 95% confidence level.
Service improvements results reflect only non-student data.
15

ONBOARD RESPONDENT PROFILE
ARE YOU A WWU STUDENT?n=596
NO 51%YES 46%
NA 3%
16
The survey respondents approximate the ridership distribution of students and non-students.

HOW MANY BUSES WILL YOU BOARD TO COMPLETE THIS ONE-WAY TRIP?n=596
54%
41%
5%
0%
20%
40%
60%
1 2 3 or More
BUSES USED TO COMPLETE TRIP
17
More than half of the respondents completed their trip without a
transfer.

EVALUATION OF CHANGES IN SERVICE
18
HOW HAS BUS SERVICE CHANGED IN THE PAST FIVE YEARS?n=310
26% 32% 37% 31% 26%35%
31%31%
28%
16% 24%
24%
23%19% 19%
33% 32%22%
13% 15% 13%19%
13% 14%
4%4%4% 3% 3% 1%
1%1%2%
0%
20%
40%
60%
80%
100%
Buses on Time Hours of Service Frequency Safety Travel Time CustomerService
DK/NA
Much Worse
SomewhatWorse
Same
Better
Much Better
Frequency and hours of service were considered to be the most
improved by onboard respondents. Non-student responses only.

AWARENESS OF REVENUE DOWNTURN
AWARE THAT WTA'S FUNDING IS DOWN 10 PERCENT?n=596
No 49%
Don't Know/NA 6%
Yes 45%
19
Just under half of the onboard respondents know that WTA revenues
are down.

OPTIONS FOR ADDRESSING SHORTFALL
HOW SHOULD WTA ADDRESS THE SHORTFALL?n=596
25%
54%
16%
5%
0%
20%
40%
60%
Tax to Expand Tax to Maintain Reduce Service Don't Know
20
Over half of the onboard respondents supported a sales tax increase to maintain service levels.

SERVICE REDUCTIONS
IF WTA HAD TO REDUCE SERVICES, WHERE SHOULD THAT BE?n=596
21%
5%
21%
19%
6%
8%7%
14%
0%
5%
10%
15%
20%
25%
Fewer GOLines
LessSaturdayService
Less SundayService
Less Serviceto RuralAreas
LessEveningService
Later StartTimes onWeekdays
Other NA
21
Decreasing Sunday service, the GO lines and service to rural areas
were the top three considerations for service reductions.

SERVICE EXPANSION
IF WTA COULD EXPAND SERVICES, WHERE SHOULD THAT BE?n=596
14%
9%
22%
11%
27%
5%7% 7%
0%
20%
40%
More GOLines
MoreSaturdayService
MoreSundayService
MoreService to
RuralAreas
MoreEveningService
EarlierWeekdayService
Other NA
22
Increasing evening and Sunday service and the GO Lines were the top ranked choices for service expansion.