renewable energy discount rate survey results – 2017€¦ · renewable energy discount rate...
TRANSCRIPT
Renewable energy discount rate survey results – 2017
A Grant Thornton and Clean Energy Pipeline initiative
January 2018

Australia 06
Canada 08
France 10
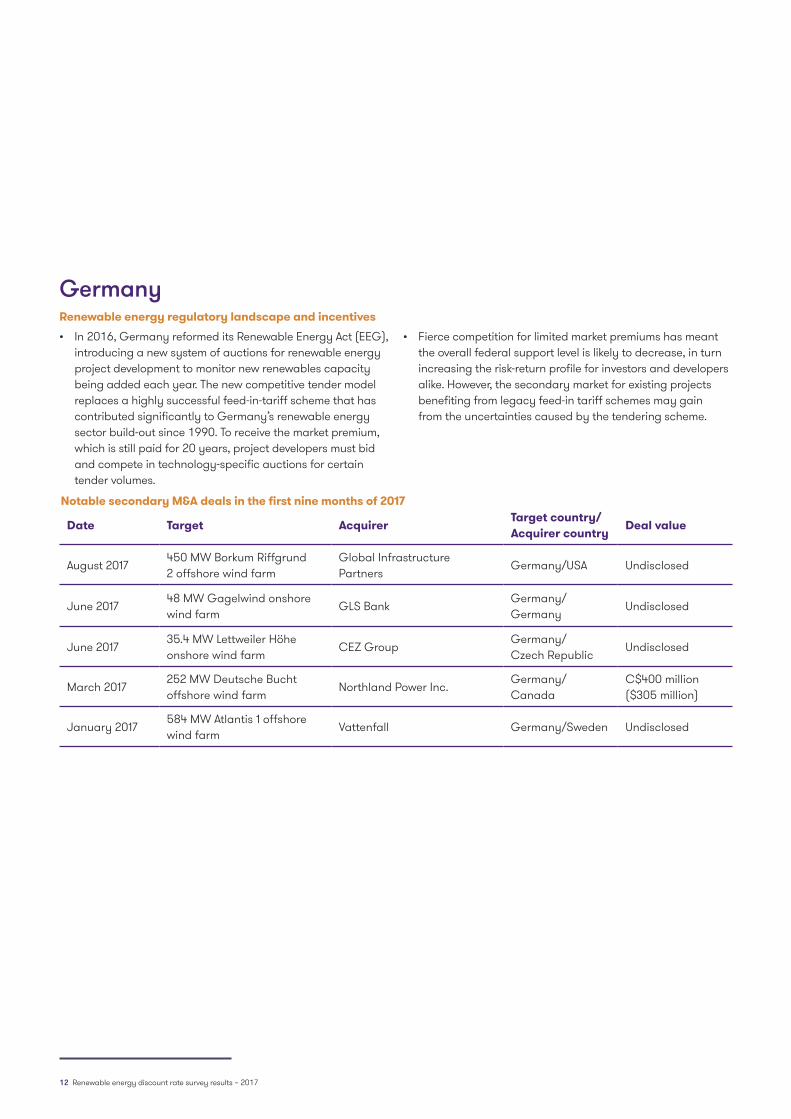
Germany 12
Ireland 14
Italy 16
Nordics 18
Spain 20
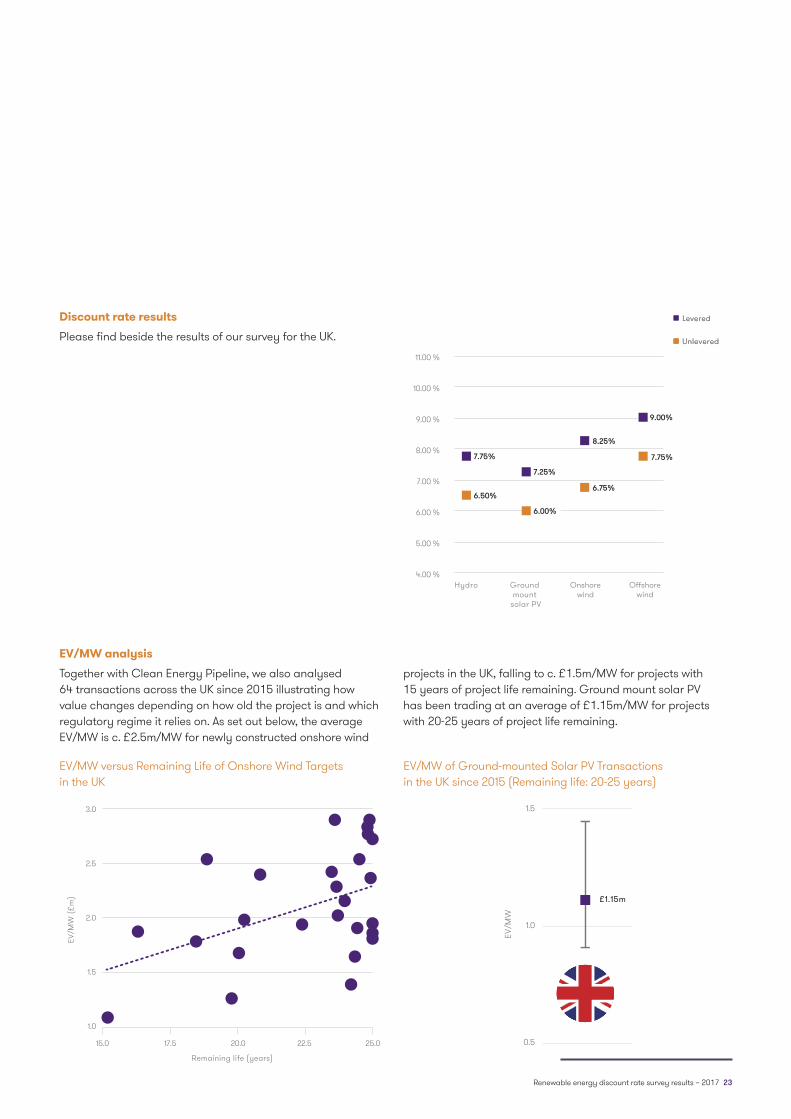
UK 22
USA 24
Contacts 26
About us 27
Contents

Renewable energy discount rate survey results – 2017 3
About this report
Grant Thornton, in collaboration with Clean Energy Pipeline, is pleased to present the Grant Thornton renewable energy discount rate survey report. The discount rate (a proxy of cost of capital) for secondary market renewable energy M&A deals is a vitally important piece of information for investors. It is a key driver in determining the fair value or market price for projects. However, this data is extremely hard to gather so investors often have to rely solely on their own experience and advice from valuation experts in evaluating the cost of capital.
In this spirit, Grant Thornton launched a survey to gauge investors’ perception of cost of capital. We asked one simple question: What most closely matches the discount rate you would expect to see for the following secondary market deals? We asked this with respect to levered and unlevered secondary market ground mount solar, onshore wind, offshore wind and
hydro projects. We have also observed enterprise value per megawatt (EV/MW), a widely used metric across the industry. The survey was distributed across ten geographies which have strong renewable markets: Australia, Canada, France, Germany, Ireland, Italy, Nordics, Spain, the UK and the USA.
In total, over 100 investors responded to the survey, representing billions of pounds of capital under management. The results are shown in the following pages. Please note that cost of capital needs to be considered in the context of the various underlying assumptions such as power curves, inflation and project lives (amongst others), which will vary for all of the respondents.
How to value renewable energy projectsRenewable energy represents a niche segment of the overall infrastructure asset class. These assets need to be approached slightly differently due to the varying risk return profile associated with long-term incentive schemes, financial leverage, construction/technology risks and input/output price volatility.
Typically, when valuing renewable energy projects, an income approach is utilised. Sometimes, valuers use the capital asset pricing model (‘CAPM’) in determining the appropriate cost of equity and in turn the weighted average cost of capital (‘WACC’). Because some of the risks associated with equities
are not present in renewable energy assets, the CAPM model may not always be the most appropriate method to rely on when deriving the appropriate discount rate.
As the pricing for renewable assets is competitive and unique to the specific aspects of the asset, the implied cost of capital (or IRR) from comparable transactions can be a strong indicator for valuing projects. This data is not readily available so Grant Thornton has surveyed investors in trying to obtain the latest view on where cost of capital is across various technologies globally.
We hope you find this report insightful. If you have any questions or feedback, please contact:
Tomas FreymanValuations Partner Grant Thornton UK LLP
T +44 (0) 20 7184 4336E [email protected]
Thai TranHead of Data Clean Energy Pipeline
T +44 (0) 207 943 8114E [email protected]

4 Renewable energy discount rate survey results – 2017

Renewable energy discount rate survey results – 2017 5
Renewable energy is at the forefront in the fight against climate change. This has translated into rapid renewable energy commercialisation and industry expansion, therefore leading to an increase in the number of deals in the sector. Some $201 billion has been invested in utility-scale renewable
Global renewable energy sector overview
energy projects alone in 20161, with wind and solar leading the industry in terms of MW deployment and deal value. The market is expected to see high growth in investments over the coming decades as project costs continue to decrease and grid parity is achieved in more and more geographies.
2016 utility-scale project finance volume
USADeal value $32.1 billionPercentage of total deal value 16%
Total of 10Deal value $91 billionPercentage of total deal value 45%
SpainDeal value $0.9 billionPercentage of total deal value 1%
ItalyDeal value $2.1 billionPercentage of total deal value 1%
UKDeal value $30 billionPercentage of total deal value 15%
IrelandDeal value $1.6 billionPercentage of total deal value 1%
FranceDeal value $2.6 billionPercentage of total deal value 1%
GermanyDeal value $7.7 billionPercentage of total deal value 4%
Nordics (Denmark, Finland, Norway and Sweden)
Deal value $7.7 billionPercentage of total deal value 4%
CanadaDeal value $3.9 billionPercentage of total deal value 2%
AustraliaDeal value $2.4 billionPercentage of total deal value 1%
World totalDeal value $200.6 billion
1 Clean Energy Market Review Q3.2017 – Clean Energy Pipeline (2017)

6 Renewable energy discount rate survey results – 2017
Country profiles
AustraliaRenewable energy regulatory landscape and incentives• Australia has set its federal policy to meet its Renewable
Energy Target (RET) for 33,000 GWh by 2020. Approximately 17,500 GWh of renewable energy was generated in 2016, rendering the target achievable2. In October 2017, the Australian Government announced intentions to develop a National Energy Guarantee, comprising a reliability guarantee and an emissions guarantee. As part of the National Energy Guarantee, the RET will not be extended beyond 2020.
• Federal support for large-scale projects is being delivered through the creation of large-scale generation certificates that are created based on the amount of eligible renewable electricity produced. They can be sold or traded to Renewable Energy Target liable entities (generally electricity retailers), which must source large-scale generation certificates to meet their renewable energy obligations.
• The Australian Government has also ratified the country’s commitment to reduce carbon emissions by 26-28% below the 2005 levels by 2030 as part of the Paris Agreement on climate change in 20163.
• While industry criticism has been levelled at Australia’s federal government over the lack of perceived support for renewables over two successive administrations, state support for clean technology has remained robust over the years with many state governments implementing ambitious individual renewables targets as well as holding competitive auctions for green capacity.

Renewable energy discount rate survey results – 2017 7
Discount ratesPlease find beside the results of our survey for Australia.
It should be noted that, in addition to cost of capital, the key driver for returns is ‘the proportion of contracted versus merchant revenue’, according to the survey responses.
Notable secondary M&A deals in the first nine months of 2017
Date Target AcquirerTarget country/Acquirer country
Deal value
August 2017150 MW Daydream and 50 MW Hayman Solar Plants
BlackRock Australia/USA Undisclosed
May 2017 125 MW Clare Solar PlantLighthouse Capital Partners and DIF BV
Australia/USA and Netherlands
Undisclosed
May 2017530 MW Stockyard Hill Wind Farm
Goldwind Science & Technology Co. Ltd
Australia/ChinaA$110 million ($82 million)
May 2017110 MW Darling Downs Solar Farm
APA Group Australia/AustraliaA$220 million ($164 million)
February 2017 107 MW Bald Hills Wind Farm Infrastructure Capital Group Australia/Australia Undisclosed
2 Renewable Energy Target – Clean Energy Council (2017)3 The Australian Government’s action on climate change – Australian Government (2017)
4.00 %
5.00 %
6.00 %
7.00 %
8.00 %
9.00 %
10.00 %
11.00 %
Hydro Ground mount
solar PV
Onshorewind
Levered
Unlevered
6.75%
9.50%
7.50%
10.00%
8.50%
11.00%

8 Renewable energy discount rate survey results – 2017
CanadaRenewable energy regulatory landscape and incentives• Regulatory Targets or Renewable Portfolio Standards
(RPS), being adopted in Canada mandate that a certain portion of electricity should be generated from renewables by a certain date. Revenue support and cost reduction policies in Canada aim to incentivise the investment in renewable energy.
• Power Purchase Agreements (PPAs) underpin the construction of most renewable projects in Canada. Contracts can be awarded to investors through different mechanisms which vary in terms of objectives, level of support and overall design, below are the four main mechanisms adopted by many Canadian jurisdictions:
– Requests for Proposals (RFPs) specifically for renewables power projects with specified capacity targets. RFPs often favour major developers in the market who can meet stringent requirements.
– Feed-In Tariffs (FITs) offer standardized long-term contracts and administratively set payments, often specific to a particular technology. Standard terms make it easier for small projects and new players in the market to qualify.
– Standing Offer Programs (SOPs) allow investors to apply at any time the program is in effect and provide guaranteed payments, however in contrast to FITs, these are typically the same for all renewable energy technologies.
– Contracts for differences contracts in which the sellers and buyers agree to a fixed price, but the producer sells electricity in an open market and receives whatever price the market is offering. Subsequently, payment is made by either party to the contract to compensate for differences between the fixed price and the market price.
• The government is supporting other mechanisms to support the growth of renewables from tradeable Renewable Energy Credits (RECs), to cost reduction policies. These include tax breaks and government loan guarantees aiming to reduce lender risk and lower project finance costs.
• This regulatory landscape has helped Canada rank fourth in the world in renewable power generation and second in the world in hydroelectric generation, which is the dominant source of electricity in the country, and accounts for nearly 60% of installed capacity and generation.
• Despite impressive growth in wind and solar capacity in the last decade, non-hydro renewables account for only 7% of total generation capacity in Canada. Also, new capacity additions in Canada have been limited as a result of low growth in electricity demand and the long operating life of existing facilities. Cost concerns and local opposition have also limited growth opportunities.

Renewable energy discount rate survey results – 2017 9
Discount rate resultsPlease find beside the results of our survey for Canada.
Hydro Ground mount
solar PV
Onshorewind
Levered
Unlevered
Offshorewind
4.00 %
5.00 %
6.00 %
7.00 %
8.00 %
9.00 %
10.00 %
11.00 %
7.00%
6.00% 6.00%
4.75%
5.25%
8.50%
6.25%
7.50%

10 Renewable energy discount rate survey results – 2017
FranceRenewable energy regulatory landscape and incentives• The French clean energy sector has largely been
characterised by its drive to hit its 23% EU renewables directive by 20204.
• Given the fact that France has historically leaned towards nuclear power, the French government has set aside billions of euros with the backing of public support to boost its renewables capacity by the end of the decade. The French government may grant state aid to help companies finance their research and development programs and to support their industrial and commercial developments.
• In terms of incentives for renewables, France is switching from the current 20-year (15-year for onshore wind) feed-in-tariff scheme to a market premium system through competitive bidding processes.
• The solar sector is expected to be the biggest beneficiary, with capacity estimated to hit 10.2 GW in 2018 and between 18 GW and 20 GW by 20235. Three tenders for solar PV have been launched since 2014, bringing in over €1 billion of investments.
• In May 2017, the French Government confirmed a tendering system for up to 3GW of onshore wind over the next three years. Six bidding rounds of 500MW capacity each will start from December 2017, and then every six months until June 20206.
• The tendering system is also being used to realise its target of 3 GW of free-standing offshore wind energy by 20237.
• Two completed tenders in 2012 and 2013 resulted in the award of six offshore wind farm projects with an aggregate capacity of 2.9 GW located across six sites along the Atlantic coastline to three consortia.
• At the time of this report publication, a third tender is being implemented for up to 750 MW of offshore wind capacity off the coast of Dunkirk in northern France and another project of up to 500 MW off the coast of Oleron island, near La Rochelle.
Notable secondary M&A deals in the first nine months of 2017
Date Target AcquirerTarget country/Acquirer country
Deal value
July 2017 DIF II renewables portfolio APG Asset Management NV
France and five other European countries/Netherlands
€125 million ($143 million)
May 2017 Futuren portfolio EDF Energies Nouvelles SA France/France Undisclosed
May 201724 MW Groix offshore wind farm
Meridiam and CDC GroupFrance/France and UK
€200 million ($219 million)
May 2017Rougemont-1, Rougemont-2, & Vaite wind farms (120 MW)
Innergex Renewable Energy Inc. and Desjardins
France/Canada€51.4 million ($52.1 million)
March 2017Haut-Dourdou & Croix de Bor wind farms (84MW)
EDF Energies Nouvelles SA, Arkolia Energies
France/France Undisclosed
4 State aid: Commission endorses three French initiatives to produce more than 2600 megawatts in renewable energy – European Commission (2017)
5 France to install 20 GW by 2023 – Solar Power Europe (2016)6 France launches 3GW onshore tender – Windpower Monthly (2017)
7 France Pre-Selects 10 Dunkerque Offshore Wind Bidders – Offshore Wind (2017)

Renewable energy discount rate survey results – 2017 11
Discount rate resultsPlease find beside the results of our survey for France.
EV/MW analysisWe analysed 14 transactions across France since 2015 illustrating how value changes depending on how old the project is and which regulatory regime it relies on. As set out below, EV/MW is c. €2.0m/MW for newly constructed
onshore wind projects, falling to €1.0m/MW for projects with 15 years of project life remaining. Ground mount solar PV assets have been trading at an average of €1.8m/MW for projects with 20-25 years of project life remaining.
6.25%
7.25%
Levered
Unlevered
5.50% 5.50%5.75%
9.75%
6.50%
8.25%
Hydro Ground mount
solar PV
Onshorewind
Offshorewind
4.00 %
5.00 %
6.00 %
7.00 %
8.00 %
9.00 %
10.00 %
11.00 %
1.0
EV/M
W (€
m)
15.0 17.5 20.0 22.5 25.0
Remaining life (years)
1.5
2.0
2.5
0.5
1.0
1.5
2.0
2.5
EV/M
W
€1.8m
EV/MW versus Remaining Life of Onshore Wind Targets in France
EV/MW of Ground-mounted Solar PV Transactions in France since 2015 (Remaining life: 20-25 years)
12 Renewable energy discount rate survey results – 2017
GermanyRenewable energy regulatory landscape and incentives• In 2016, Germany reformed its Renewable Energy Act (EEG),
introducing a new system of auctions for renewable energy project development to monitor new renewables capacity being added each year. The new competitive tender model replaces a highly successful feed-in-tariff scheme that has contributed significantly to Germany’s renewable energy sector build-out since 1990. To receive the market premium, which is still paid for 20 years, project developers must bid and compete in technology-specific auctions for certain tender volumes.
• Fierce competition for limited market premiums has meant the overall federal support level is likely to decrease, in turn increasing the risk-return profile for investors and developers alike. However, the secondary market for existing projects benefiting from legacy feed-in tariff schemes may gain from the uncertainties caused by the tendering scheme.
Notable secondary M&A deals in the first nine months of 2017
Date Target AcquirerTarget country/Acquirer country
Deal value
August 2017450 MW Borkum Riffgrund 2 offshore wind farm
Global Infrastructure Partners
Germany/USA Undisclosed
June 201748 MW Gagelwind onshore wind farm
GLS BankGermany/Germany
Undisclosed
June 201735.4 MW Lettweiler Höhe onshore wind farm
CEZ GroupGermany/ Czech Republic
Undisclosed
March 2017252 MW Deutsche Bucht offshore wind farm
Northland Power Inc.Germany/Canada
C$400 million ($305 million)
January 2017584 MW Atlantis 1 offshore wind farm
Vattenfall Germany/Sweden Undisclosed

Renewable energy discount rate survey results – 2017 13
Discount rate results• Please find beside the results of our survey for Germany.
EV/MW analysisWe analysed 10 transactions across Germany since 2015 illustrating how value changes depending on how old the project is and which regulatory regime it relies on. As set out below, the average EV/MW is c. €2.2m/MW for newly constructed onshore wind projects in Germany, falling
to €1.9m/MW for projects with less than 20 years but more than 15 years of project life remaining. Ground mount solar PV assets have been trading at an average of €2.6m/MW for projects with 20-25 years of project life remaining.
4.00 %
5.00 %
6.00 %
7.00 %
8.00 %
9.00 %
10.00 %
11.00 %
Ground mount
solar PV
Onshorewind
Levered
Unlevered
Offshorewind
8.00%
5.00%
5.50%
6.50%6.25%
4.25%
EV/MW versus Remaining Life of Onshore Wind Targets in Germany
EV/MW of Ground-mounted Solar PV Transactions in Germany since 2015 (Remaining life: 20-25 years)
1.5
2.0
2.5
3.0
EV/M
W (€
m)
17.5 20.0 22.5 25.0
Remaining life (years)
2.0
2.5
3.0
EV/M
W €2.57m

14 Renewable energy discount rate survey results – 2017
IrelandRenewable energy regulatory landscape and incentives• The next two years is set to be a defining year for Ireland’s
energy sector, given the fact the country is only half way towards reaching its binding target of generating 16% of energy from renewable sources by 2020 – only 22.7% of the 40% renewables target has been achieved thus far. Ireland will be liable for a fine between €65 million and €120 million from the EU for every 1% below the target8.
• It therefore comes as no surprise that the Irish government’s Renewable Energy Support Scheme (RESS) is now being designed to facilitate wider public and citizen participation in the development of utility-scale projects.
• Given Ireland’s abundant wind resources, renewables project finance and M&A activity has mainly focused on onshore wind projects. Only three disclosed onshore wind M&A deals have taken place in Ireland in the first three quarters of 2017.
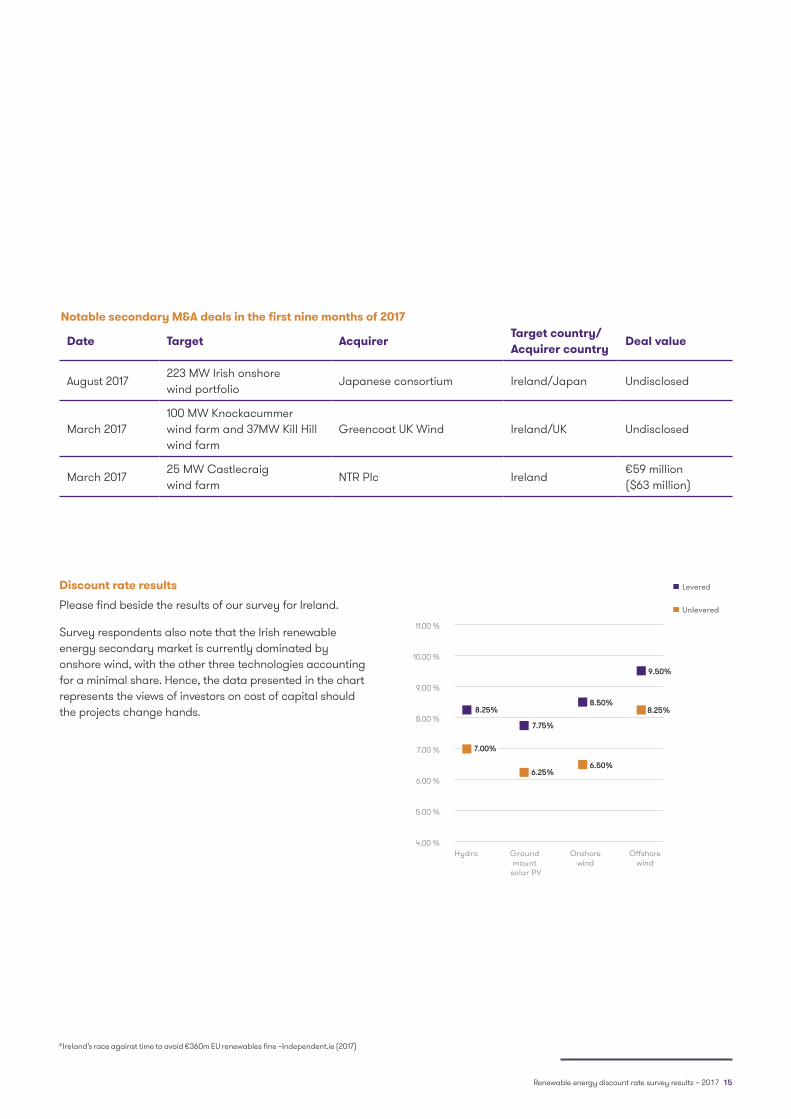
Renewable energy discount rate survey results – 2017 15
Discount rate resultsPlease find beside the results of our survey for Ireland.
Survey respondents also note that the Irish renewable energy secondary market is currently dominated by onshore wind, with the other three technologies accounting for a minimal share. Hence, the data presented in the chart represents the views of investors on cost of capital should the projects change hands.
Notable secondary M&A deals in the first nine months of 2017
Date Target AcquirerTarget country/Acquirer country
Deal value
August 2017223 MW Irish onshore wind portfolio
Japanese consortium Ireland/Japan Undisclosed
March 2017100 MW Knockacummer wind farm and 37MW Kill Hill wind farm
Greencoat UK Wind Ireland/UK Undisclosed
March 201725 MW Castlecraig wind farm
NTR Plc Ireland€59 million ($63 million)
8 Ireland’s race against time to avoid €360m EU renewables fine –Independent.ie (2017)
Hydro4.00 %
5.00 %
6.00 %
7.00 %
8.00 %
9.00 %
10.00 %
11.00 %
Levered
Unlevered
7.00%
8.25%
Levered
Unlevered
Ground mount
solar PV
Onshorewind
Offshorewind
6.25%
7.75%
6.50%
8.50%8.25%
9.50%

16 Renewable energy discount rate survey results – 2017
ItalyRenewable energy regulatory landscape and incentives• Renewables account for 39% of Italy’s 284 TWh of electricity
generation in 2016, enabling the country to reach in advance its EU objective of at least 20% final energy consumption from renewable sources by 20209.
• By 2005 Italy had introduced an incentives schemes for solar power. By 2011, Italy boasted one of the world’s largest solar power sectors which was promoted through a combination of premium tariffs, feed-in tariffs and tender schemes. However, subsequent cuts to the country’s renewables subsidy scheme almost ended its greenfield market.
• Italy’s renewables market, particularly for solar, now stands highly fragmented as many investors seek to consolidate their holdings in the country through project acquisitions. In fact, notable deals in Italy in the past three years involved significant portfolio consolidation. The consolidation process is still on-going but it is becoming more difficult for investors to find notable portfolios.

Renewable energy discount rate survey results – 2017 17
Discount rate resultsPlease find beside the results of our survey for Italy.
Notable secondary M&A deals in the first nine months of 2017
Date Target AcquirerTarget country/Acquirer country
Deal value
June 201730MW Matera 2 onshore wind farm
Macquarie Italy/Australia Undisclosed
June 2017Seven wind farms in Sicily and Calabria (282MW)
F2i Fondi Italiani per le Infrastrutture
Italy/Italy Undisclosed
April 2017106 MW solar portfolio in Apulia, Lazio and Sicily
Cubico Sustainable Investments
Italy/UK Undisclosed
March 2017 22 MW Grape solar portfolioSonnedix Management Services
Italy/Netherlands Undisclosed
February 201740 MW wind and solar portfolio in Puglia, Piedmont and Sardinia
EOS Investment Management Italy/UK€140 million ($151 million)
9 Italy – Energy System Overview – IEA (2017)
4.00 %
5.00 %
6.00 %
7.00 %
8.00 %
9.00 %
10.00 %
11.00 %
Hydro Ground mount
solar PV
Onshorewind
Levered
Unlevered
5.25%
6.25%
7.25%
9.00%
6.50%
8.00%

18 Renewable energy discount rate survey results – 2017
NordicsRenewable energy regulatory landscape and incentives• The Nordics – defined as Denmark, Finland, Norway and
Sweden – is at the frontier for renewable energy generation, having built up a reputation over recent years for harbouring market conditions favourable for new project development. As such, some 75% of the total primary energy supply in the Nordic region now comes from renewable sources, including hydro power. The share is expected to rise to nearly 80% by 2040, with hydro remaining the dominant source of energy10. In promoting the development of new renewable energy production, each country has differing approaches to greening their policies.
• Norway, where 99% of electricity production is from hydro power, promotes renewable energy through a quota system including a certificate trading scheme. Each megawatt-hour produced from approved sources receives a tradeable certificate. Utilities are obliged to buy permits every year to match sales of electricity.
• Similar to Norway, Sweden promotes renewable energy through the quota system which is based on a certificate trading system. Tax exemptions and subsidy schemes have also played a significant role in driving investors towards the renewables sector, especially onshore wind.
• In Denmark, electricity generation from renewable sources is primarily promoted through a premium tariff and net-metering. The premium tariff for offshore wind farms is awarded through tenders while renewable energy is given priority over conventional sources when brought to the grid.
• Compared with other countries in the region, Finland has witnessed significant policy changes for the past few years. In November 2016, the Finnish Government announced the National Energy and Climate Strategy for 2030, which aims to scrap the current premium tariff system for onshore wind in favour of a tendering system. The Strategy has also set a target of 50% renewable energy consumption by 2030 while the use of coal will be phased out11.

Renewable energy discount rate survey results – 2017 19
Discount rate resultsPlease find beside the results of our survey for the Nordics.
Notable secondary M&A deals in the first nine months of 2017
Date Target AcquirerTarget country/Acquirer country
Deal value
August 2017650 MW Markbygden 1 wind complex
General Electric Company and Macquarie
Sweden/USA and Australia
Undisclosed
July 201723 MW Haapajarvi II wind farm
ABO Wind Finland/Germany€60 million ($70 million)
June 2017 100 MW Svartnäs wind farm BlackRock Sweden/USA Undisclosed
May 2017263 MW wind portfolio in Southern Norway
Luxcara Norway/Germany Undisclosed
May 2017 79 MW Jenåsen wind farm Munich Re Sweden/Germany€106 million ($121 million)
10 Beyond the Tipping Point – Bloomberg (2017)11 Strategy outlines energy and climate actions to 2030 and beyond – Ministry of Economic Affairs and Employment of Finland (2017)
Levered
Unlevered
Hydro Ground mount
solar PV
Onshorewind
Offshorewind
4.00 %
5.00 %
6.00 %
7.00 %
8.00 %
9.00 %
10.00 %
11.00 %
7.00%
5.75%
5.00%
8.25%
6.25%
7.25%7.25%
5.75%

20 Renewable energy discount rate survey results – 2017
SpainRenewable energy regulatory landscape and incentives• Spain’s renewable energy market has seen very modest
growth for years following retroactive cuts made to its subsidy regime through Royal Decree-Act 1/2012.
• However, long-awaited competitive auctions in 2017 have since sparked a renaissance of interest in the market with developers and investors flocking to take a share of Spain’s future renewables capacity, though problems still persist.
• The results of the first auction in May 2017 was criticised after the Ministry of Energy, Tourism and the Digital Agenda awarded wind developers the entirety of the 3 GW tendered capacity; split between only four bidders12.
• In its most recent auction in July, however, over 3.9 GW of new solar PV and approx. 1.1 GW of onshore wind were allocated, well above the 3 GW capacity initially up for grabs. A total of 40 companies secured the capacity after putting forward bids at the ‘maximum discount’, which the Spanish government said would mean the new capacity would be secured ‘at no cost to the electric consumers’13.
• In both auctions, strong interest from local and international investors meant Spain was forced to allocate capacity beyond the 3 GW of renewable energy originally on offer.
• All-in-all, Spain has now awarded a total of 8 GW of renewable energy capacity, which comprises 3.9 GW for solar PV, 4.1 GW for wind power and 20 MW for other technologies.

Renewable energy discount rate survey results – 2017 21
Discount rate resultsPlease find beside the results of our survey for Spain.
Notable secondary M&A deals in the first nine months of 2017
Date Target AcquirerTarget country/Acquirer country
Deal value
August 201722 MW Extremadura and Castilla-la-Mancha solar portfolio
Sonnedix Management Services
Spain/Netherlands Undisclosed
July 2017 11 MW Badajoz solar plant Solaria Corp. Spain/Spain€62 million ($72 million)
July 2017100 MW Andasol 1-2 solar portfolio
Cubico Sustainable Investments
Spain/UK Undisclosed
January 2017Sierra de Aguas & Sierra de Baños wind farms (28MW)
Rive Private Investment and JB Capital Markets
Spain/Switzerland and Spain
Undisclosed
January 2017 136 MW Vela solar portfolioSonnedix Management Services
Spain/Netherlands Undisclosed
12 Spain awards 3 GW in competitive renewables auction – Clean Energy Pipeline (2017)13 Analysis: Fierce competition drives Spanish renewables auction – Clean Energy Pipeline (2017)
7.75%
7.25%
8.50%
Levered
Unlevered
Levered
Unlevered
Ground mount
solar PV
Onshorewind
4.00 %
5.00 %
6.00 %
7.00 %
8.00 %
9.00 %
10.00 %
11.00 %
7.00%

22 Renewable energy discount rate survey results – 2017
UKRenewable energy regulatory landscape and incentives• The Renewables Obligation (RO) was introduced by the UK
government in 2002 to encourage the uptake of renewable technologies as it encouraged licensed electricity suppliers to source a specific and annually increasing percentage of their electricity from renewable sources.
• Under the Energy Act 2013, the RO was phased out between 2014 and 2017 and replaced with Contracts for Difference (CfDs). Under this new support system for large-scale renewable energy, renewable generators will be guaranteed an agreed ‘strike price’ for the energy they produce. Each technology will have its own strike price. Technologies such as onshore wind and solar PV were both excluded from the most recent second round auction, and are highly unlikely to feature in any future rounds.
• In October 2017, the UK Government released its much anticipated Clean Growth Strategy which sets out how £2.5 billion will be spent on low carbon innovation from 2015 to 202114. The Clean Growth Strategy continues to support the offshore wind sector and the CfD mechanism. The next CfD allocation round, not due to take place until 2019 will also allow onshore wind projects to be built on Scottish Islands to compete.
• The UK government gave no indication that solar technology would benefit from its financial auspices as it has started to see investment into solar without any subsidy backing.
Notable secondary M&A deals in the first nine months of 2017
Date Target AcquirerTarget country/Acquirer country
Deal value
August 201769MW Corriegarth onshore wind farm
Greencoat UK Wind UK/UK£181 million ($233 million)
July 201790MW wind portfolio in Scotland, England and Wales
World Wind & Solar, Muirhall Energy
UK/UK Undisclosed
May 2017365 MW Terra Form UK solar portfolio
Tenaga Nasional Bhd, EFG Hermes
UK/Malaysia and Egypt
£470 million ($495 million)
January 2017270 MW Lincs offshore wind farm
UK Green Investment Bank (now Green Investment Group)
UK/UK£731 million ($894 million)
January 2017100 MW Baywa UK solar portfolio
Allianz Global Investors UK/Germany€350 million ($377 million)
14 UK’s Clean Growth Strategy finally published – Clean Energy Pipeline (2017)
Renewable energy discount rate survey results – 2017 23
Discount rate resultsPlease find beside the results of our survey for the UK.
EV/MW analysisTogether with Clean Energy Pipeline, we also analysed 64 transactions across the UK since 2015 illustrating how value changes depending on how old the project is and which regulatory regime it relies on. As set out below, the average EV/MW is c. £2.5m/MW for newly constructed onshore wind
projects in the UK, falling to c. £1.5m/MW for projects with 15 years of project life remaining. Ground mount solar PV has been trading at an average of £1.15m/MW for projects with 20-25 years of project life remaining.
Levered
Unlevered
Hydro Ground mount
solar PV
Onshorewind
7.75%
Offshorewind
4.00 %
5.00 %
6.00 %
7.00 %
8.00 %
9.00 %
10.00 %
11.00 %
Levered
Unlevered
7.75%
6.00%
6.50%
8.25%
7.25%
6.75%
9.00%
EV/MW versus Remaining Life of Onshore Wind Targets in the UK
EV/MW of Ground-mounted Solar PV Transactions in the UK since 2015 (Remaining life: 20-25 years)
1.0
1.5
2.0
2.5
3.0
EV/M
W (£
m)
15.0 17.5 20.0 22.5 25.0
Remaining life (years)
0.5
1.0
1.5
EV/M
W
£1.15m

24 Renewable energy discount rate survey results – 2017
USARenewable energy regulatory landscape and incentives• The US remains the second largest clean energy country
market for renewables thanks to strong demand for new solar PV and onshore wind capacity15. The combined effect of the federal tax credits, state-level policy incentives and corporate backing has provided investors certainty for clean energy, at least up until the end of the decade.
• Despite the Trump administration appearing to be unfriendly towards clean energy, the US still has a positive investment landscape.
• The main policy-driven incentives at the federal level are the Production Tax Credits (PTC) for onshore wind and the Investment Tax Credits (ITC) for solar PV, covering the equivalent of 30% of the project costs.
• The PTC will phase out and end in 2020, while the ITC for solar will drop gradually from the current 30% level through 2021 and remain at 10% permanently from 202216.
• However, as capital costs for onshore wind and solar PV have fallen significantly over the past five years, even faster
than the scheduled reductions in credit values, solar PV and onshore wind installations are forecasted to maintain their growth pace even with reduced tax credit backing.
• At the state level, there remains strong support for renewable energy. In 2016 and the first half of 2017, as many as 31 US states have passed new financial/regulatory incentives and renewables portfolio standards to support higher renewable energy penetration17.
• US companies are also playing an increasingly important role in driving renewables generation by increasing renewable energy use in their operations. To date, some 240 Fortune 500 companies have announced respective clean energy corporate initiatives, and many are transitioning to 100% renewable energy use to green their worldwide operations18.

Renewable energy discount rate survey results – 2017 25
Discount rate resultsPlease find beside the results of our survey for the USA.
Notable secondary M&A deals in the first nine months of 2017
Date Target AcquirerTarget country/Acquirer country
Deal value
August 2017 300 MW Red Dirt wind farm Allianz & MUFGUSA/Germany and Japan
$340 million
July 2017 200 MW Flat Top wind farmCitigroup & Berkshire Hathaway Energy
USA/USA $221 million
July 2017EDP Renováveis’ 297MW wind portfolio
Bank of New York Mellon USA/USA $370 million
March 2017250 MW Moapa Southern Paiute solar project
Capital Dynamics USA/Switzerland Undisclosed
March 20171,296MW ExGen renewables portfolio
John Hancock Life Insurance Company
USA/USA $400 million
15 Clean Energy Market Review Q3.2017 – Clean Energy Pipeline (2017)16 Production Tax Credit – 5 things To know about the extension of the ITC/PTC – Windpower Engineering & Development (2016)17 Power Forward 3.0 – Clapper, Lyngsby & Vlugt (2017)18 Trump’s ‘no friend’ of clean energy. Here are 3 reasons to invest anyway – CNBC (2017)
7.50%
9.25%
6.75%
8.50%
7.50%
5.75%
Levered
Unlevered
Hydro Ground mount
solar PV
Onshorewind
Offshorewind
4.00 %
5.00 %
6.00 %
7.00 %
8.00 %
9.00 %
10.00 %
11.00 %
8.50%
6.75%

26 Renewable energy discount rate survey results – 2017
Contacts
We hope you find this report insightful.
If you have any feedback please contact:
Tomas FreymanValuations Partner Grant Thornton UK LLP
T +44 (0) 20 7184 4336E [email protected]@tomasfreyman
Thai TranHead of Data Clean Energy Pipeline
T +44 (0) 207 943 8114E [email protected]

Renewable energy discount rate survey results – 2017 27
About us
Grant Thornton Grant Thornton UK LLP is part of one of the world’s leading organisations of independent advisory, tax and audit firms. We help dynamic organisations unlock their potential for growth by providing meaningful, forward looking advice.
Our underlying purpose is to build a vibrant economy, based on trust and integrity in markets, dynamic businesses, and communities where businesses and people thrive. We work with banks, regulators and government to rebuild trust through corporate renewal reviews, advice on corporate governance, and remediation in financial services. We work with dynamic organisations to help them grow. And we work with the public sector to build a business environment that supports growth, including national and local public services.
In the UK, we are led by more than 180 partners and employ 4,500 of the profession’s brightest minds. We provide assurance, tax and specialist advisory services to over 40,000 privately held businesses, public interest entities and individuals nationwide.
Clean Energy Pipeline Clean Energy Pipeline is the leading independent source of data, analytics and insight about the clean energy sector. We understand the global clean technology and renewable energy investment landscape and deliver real-time news, transaction data and analytics on this increasingly complex sector. Our in-house team identifies the latest investment, M&A, project finance, fund and regulatory announcements. In addition, we deliver proprietary content including interviews, analysis, insight reports and events.
Should you wish to share any comments or ideas for questions you would like included in subsequent surveys, please contact Tomas Freyman, Valuations Partner at Grant Thornton UK LLP at [email protected] or on +44 (0) 20 7184 4336 or any of our country sector leads below:
Australia
Jannaya James
+61 3 8663 6376
Canada
Troy MacDonald
+1 416 369 6401
France
Tristan Mourre
+33 1 41 25 89 36
Germany
Martin Festerling
+49 211 9524 8555
Ireland
Peter McArdle
+353 1 6805 683
Italy
Stefano Salvadeo
+39 02 006 339 28
Spain
Ramón Galcerán
+34 93 206 39 00
UK
Mike Read
+44 113 200 1528
USA
Bryan Benoit
+1 832 476 3620

grantthornton.co.uk
© 2017 Grant Thornton UK LLP. All rights reserved.
‘Grant Thornton’ refers to the brand under which the Grant Thornton member firms provide assurance, tax and advisory services to their clients and/or refers to one or more member firms, as the context requires. Grant Thornton UK LLP is a member firm of Grant Thornton International Ltd (GTIL). GTIL and the member firms are not a worldwide partnership. GTIL and each member firm is a separate legal entity. Services are delivered by the member firms. GTIL does not provide services to clients. GTIL and its member firms are not agents of, and do not obligate, one another and are not liable for one another’s acts or omissions. This publication has been prepared only as a guide. No responsibility can be accepted by us for loss occasioned to any person acting or refraining from acting as a result of any material in this publication.
GRT107459