2009 commitment to development index. david roodman research fellow commitment to development index
TRANSCRIPT

2009 Commitment to Development Index

Components
AidTradeInvestmentMigrationEnvironmentSecurityTechnology

Quantity, net of debt payments
Tying
Selectivity
Project proliferation
Tax breaks for charity
Aid
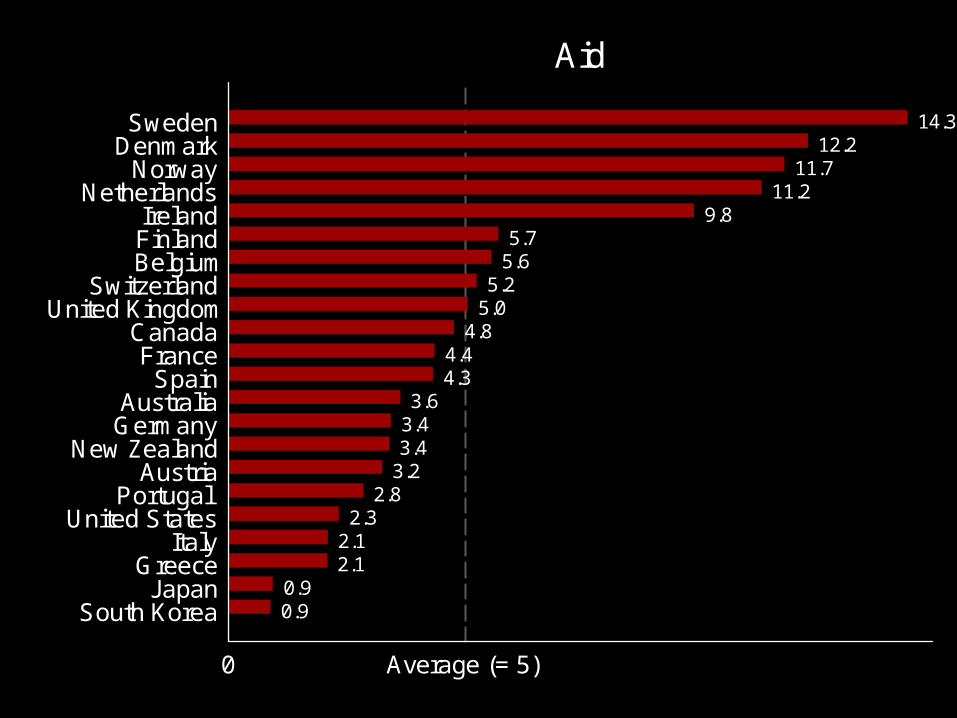
0.90.9
2.12.1
2.32.8
3.23.43.43.6
4.34.4
4.85.05.2
5.65.7
9.811.2
11.712.2
14.3
0 Average (= 5)
South KoreaJapan
GreeceItaly
United StatesPortugal
AustriaNew Zealand
GermanyAustralia
SpainFrance
CanadaUnited Kingdom
SwitzerlandBelgiumFinlandIreland
NetherlandsNorway
DenmarkSweden
Aid

Trade
Tariffs
Quotas
Farm subsidies
Actual imports
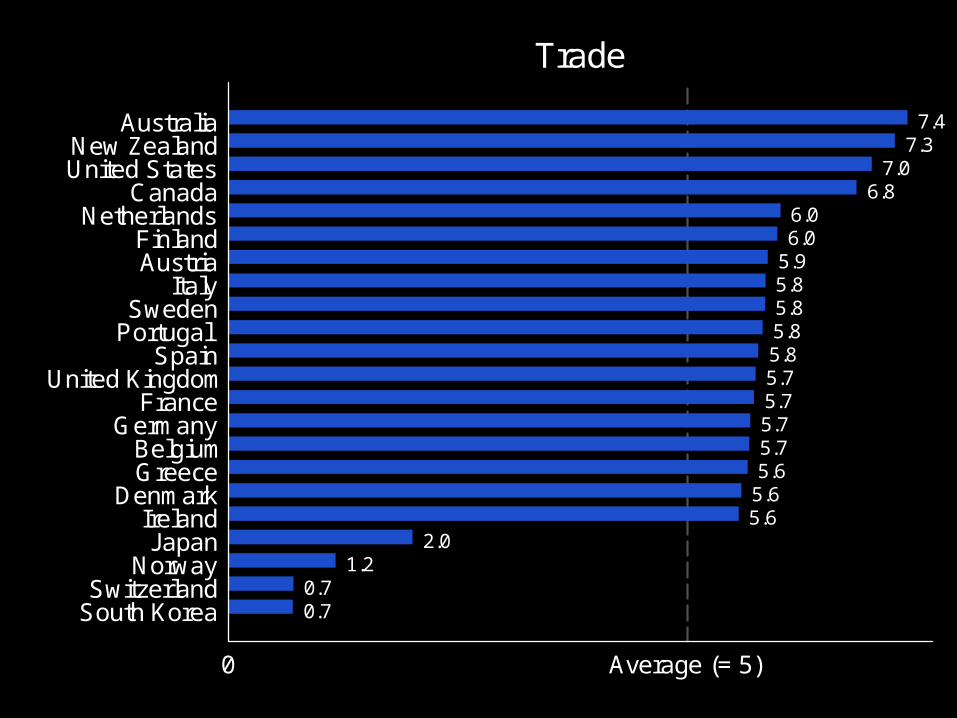
0.70.7
1.22.0
5.65.65.65.75.75.75.75.85.85.85.85.96.06.0
6.87.0
7.37.4
0 Average (= 5)
South KoreaSwitzerland
NorwayJapan
IrelandDenmark
GreeceBelgium
GermanyFrance
United KingdomSpain
PortugalSweden
ItalyAustriaFinland
NetherlandsCanada
United StatesNew Zealand
Australia
Trade

Investment
Political risk insurance
Environment and labor screens
Fighting international bribery
Double taxation
More

Investment ChecklistPolitical risk insurancePolitical risk insurance Multilateral Insurance?Multilateral Insurance? Official national agency?Official national agency? Agency monitors Agency monitors
environment/labor/human rights?environment/labor/human rights? Investors in all sectors eligible?Investors in all sectors eligible? No inappropriate national econ interest No inappropriate national econ interest
tests?tests? Restrict extending coverage to Restrict extending coverage to
inefficient import-substituting projects?inefficient import-substituting projects? International companies with a International companies with a
significant presence in this country significant presence in this country eligible?eligible?
Prevention of Bribery/Corrupt PracticesPrevention of Bribery/Corrupt Practices OECD convention -- participation OECD convention -- participation
level?level? EITI Conference participation?EITI Conference participation? Bribe Payers Index Score QuintileBribe Payers Index Score Quintile
Double TaxationDouble Taxation Avoids double taxation?Avoids double taxation? Lets investors enjoy developing country tax Lets investors enjoy developing country tax
incentives?incentives?
Other FDIOther FDI Official assistance in resolving investment Official assistance in resolving investment
disputes?disputes? Help businesses identify investment Help businesses identify investment
opportunities?opportunities? Help developing countries set up investment Help developing countries set up investment
promotion agencies?promotion agencies? Negative advocacy Negative advocacy
PortfolioPortfolio Official support for design of developing Official support for design of developing
country securities institutions and country securities institutions and regulations?regulations?
No restrictions on pension fund investment No restrictions on pension fund investment in emerging markets?in emerging markets?

2.83.0
3.64.34.3
4.74.7
4.94.94.9
5.15.3
5.55.6
5.86.16.16.26.26.26.36.3
0 Average (= 5)
AustriaIreland
SwitzerlandJapan
GreeceDenmark
New ZealandFinland
ItalyPortugalSweden
United StatesNorwayBelgium
South KoreaSpain
NetherlandsAustraliaCanadaFrance
United KingdomGermany
Investment

Migration
Immigration, especially unskilled
Foreign students from developing countries
Aid to refugees and asylum-seekers

0.91.8
3.03.03.13.2
3.53.6
3.84.6
5.25.35.35.4
5.85.95.9
6.26.7
7.98.3
11.5
0 Average (= 5)
South KoreaJapan
FranceUnited Kingdom
FinlandItaly
PortugalAustraliaBelgium
NetherlandsDenmark
GreeceUnited States
CanadaGermany
New ZealandIreland
SwitzerlandNorway
SpainSwedenAustria
Migration
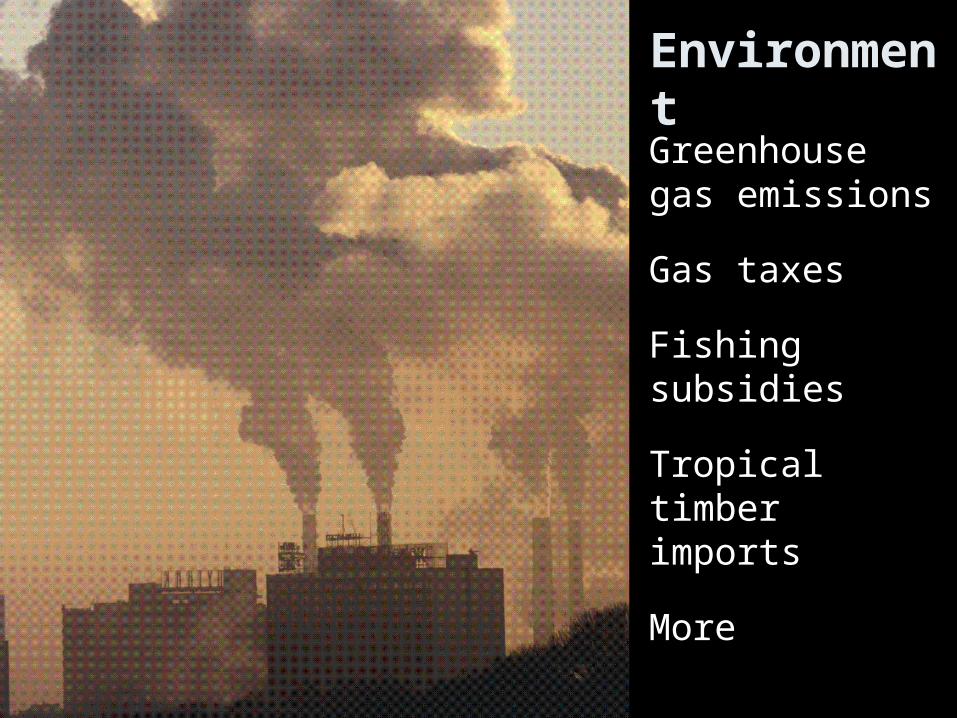
Environment
Greenhouse gas emissions
Gas taxes
Fishing subsidies
Tropical timber imports
More

2.53.0
3.14.2
4.75.25.3
5.55.9
6.16.16.2
6.66.6
6.96.97.07.07.0
7.27.3
8.7
0 Average (= 5)
South KoreaCanada
United StatesAustralia
JapanSpain
GreeceSwitzerland
AustriaPortugal
ItalyNew Zealand
SwedenIreland
GermanyNetherlands
BelgiumDenmark
FranceFinland
United KingdomNorway
Environment

Security$ + personnel to U.N. peacekeeping
Personnel to non-U.N.
Arms exports
Protecting sea lanes

1.92.1
3.03.1
3.43.43.5
4.34.44.5
5.15.3
5.75.8
6.06.2
6.56.5
6.87.3
8.28.9
0 Average (= 5)
South KoreaJapanSpain
BelgiumFrance
SwitzerlandGermany
United KingdomSwedenAustria
ItalyCanadaGreeceIrelandFinland
United StatesNetherlands
DenmarkPortugalNorway
New ZealandAustralia
Security

Technology
Public R&D spending
Tax breaks for R&D
Limiting intellectual property rights

2.63.5
3.84.24.34.4
4.64.74.7
5.05.05.05.05.15.1
5.45.5
5.75.8
6.06.6
7.0
0 Average (= 5)
GreeceIreland
ItalyGermany
United KingdomSwedenBelgium
SwitzerlandNew Zealand
AustriaPortugalAustralia
United StatesNetherlands
NorwayFinland
DenmarkFrance
CanadaJapan
South KoreaSpain
Technology

2.83.1
4.24.44.4
4.95.05.05.15.15.1
5.35.55.55.65.65.75.8
6.66.66.7
7.0
0 Average (= 5)
South KoreaJapan
SwitzerlandGreece
ItalyUnited States
PortugalBelgiumFrance
GermanyUnited Kingdom
CanadaFinlandAustria
AustraliaSpain
IrelandNew Zealand
NorwayNetherlands
DenmarkSweden
Overall
Aid Trade Investment Migration Environment Security Technology
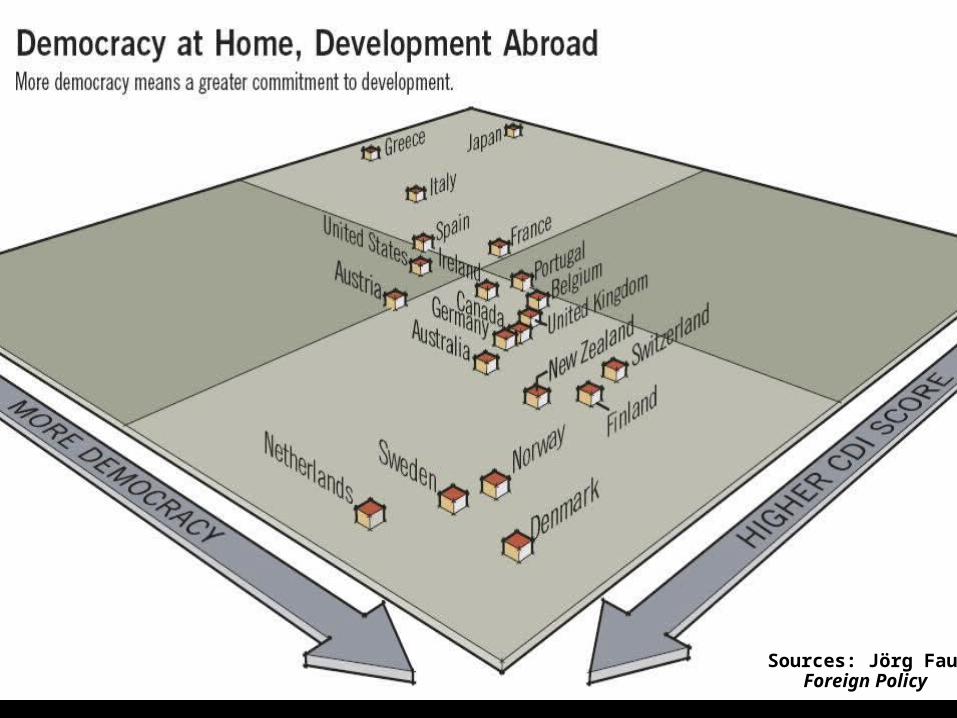
Sources: Jörg Faust,Foreign Policy

-0.3-0.2
0.10.2
0.20.30.30.3
0.40.4
0.50.60.60.60.60.70.7
0.81.0
1.11.4
-0.5 0.0 0.5 1.0
DenmarkSwitzerland
United KingdomNew Zealand
AustraliaNetherlands
ItalyGermany
AustriaNorwayCanadaFinland
PortugalFrance
United StatesJapan
BelgiumIreland
SwedenGreece
Spain
Change since 2003

2.23.1
3.84.1
4.44.54.64.74.95.05.05.1
5.45.5
5.96.36.46.4
6.76.76.8
8.1
0 Average (= 5)
South KoreaJapan
GreeceItaly
SwitzerlandAustria
AustraliaUnited States
SpainCanada
New ZealandGermany
FinlandBelgiumPortugal
NetherlandsUnited Kingdom
NorwayDenmark
FranceSwedenIreland
Sub-Saharan Africa
Aid Trade Investment Migration Environment Security Technology

3.03.3
3.63.7
3.94.0
4.44.54.6
4.95.25.25.4
5.55.65.85.95.9
6.47.0
7.27.2
0 Average (= 5)
JapanSouth KoreaSwitzerland
United KingdomGreece
PortugalUnited StatesNew Zealand
AustraliaGermany
FranceCanada
ItalyDenmarkBelgiumAustriaFinland
NetherlandsSpain
SwedenNorwayIreland
Middle East & North Africa
Aid Trade Investment Migration Environment Security Technology

2.62.7
4.04.24.2
4.54.85.05.05.1
5.35.35.35.45.4
5.75.85.9
6.16.16.2
7.6
0 Average (= 5)
South KoreaJapan
New ZealandAustralia
United StatesItaly
CanadaPortugal
FranceSwitzerland
SpainFinland
BelgiumUnited Kingdom
GermanyIreland
NetherlandsDenmark
GreeceNorwaySwedenAustria
Europe & Central Asia
Aid Trade Investment Migration Environment Security Technology

1.32.3
3.84.04.2
4.54.74.74.84.84.94.95.0
5.25.55.5
6.16.5
7.27.5
8.78.9
0 Average (= 5)
South KoreaJapan
GreecePortugal
AustriaSpain
BelgiumFinland
ItalyFrance
SwedenIreland
SwitzerlandAustralia
New ZealandGermanyDenmark
NorwayUnited States
NetherlandsCanada
United Kingdom
South Asia
Aid Trade Investment Migration Environment Security Technology
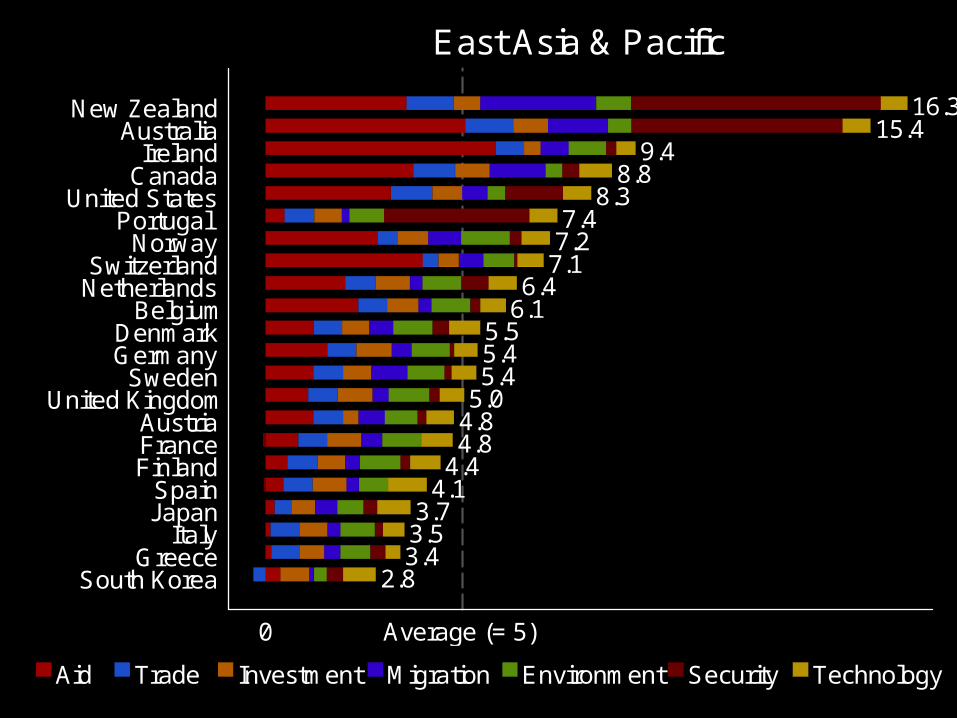
2.83.43.53.7
4.14.44.84.85.05.45.45.5
6.16.4
7.17.27.4
8.38.8
9.415.4
16.3
0 Average (= 5)
South KoreaGreece
ItalyJapanSpain
FinlandFranceAustria
United KingdomSweden
GermanyDenmarkBelgium
NetherlandsSwitzerland
NorwayPortugal
United StatesCanadaIreland
AustraliaNew Zealand
East Asia & Pacific
Aid Trade Investment Migration Environment Security Technology

3.03.73.94.04.1
4.34.34.54.54.54.64.74.84.9
5.35.55.55.5
6.48.1
8.510.7
0 Average (= 5)
South KoreaGreeceJapan
ItalyAustria
SwitzerlandNew Zealand
FinlandPortugalAustralia
United KingdomBelgium
IrelandGermany
FranceSweden
DenmarkNorway
NetherlandsCanada
SpainUnited States
Latin America & Caribbean
Aid Trade Investment Migration Environment Security Technology

cgdev.org/cdi


Overall
Rank Country Aid Trade Investment Migration Environment Security TechnologyOverall
(Average)
7 Australia 3.6 7.4 6.2 3.6 4.2 8.9 5.0 5.69 Austria 3.2 5.9 2.8 11.5 5.9 4.5 5.0 5.5
15 Belgium 5.6 5.7 5.6 3.8 7.0 3.1 4.6 5.011 Canada 4.8 6.8 6.2 5.4 3.0 5.3 5.8 5.32 Denmark 12.2 5.6 4.7 5.2 7.0 6.5 5.5 6.79 Finland 5.7 6.0 4.9 3.1 7.2 6.0 5.4 5.5
12 France 4.4 5.7 6.2 3.0 7.0 3.4 5.7 5.112 Germany 3.4 5.7 6.3 5.8 6.9 3.5 4.2 5.118 Greece 2.1 5.6 4.3 5.3 5.3 5.7 2.6 4.46 Ireland 9.8 5.6 3.0 5.9 6.6 5.8 3.5 5.7
18 Italy 2.1 5.8 4.9 3.2 6.1 5.1 3.8 4.421 Japan 0.9 2.0 4.3 1.8 4.7 2.1 6.0 3.13 Netherlands 11.2 6.0 6.1 4.6 6.9 6.5 5.1 6.65 New Zealand 3.4 7.3 4.7 5.9 6.2 8.2 4.7 5.83 Norway 11.7 1.2 5.5 6.7 8.7 7.3 5.1 6.6
15 Portugal 2.8 5.8 4.9 3.5 6.1 6.8 5.0 5.022 South Korea 0.9 0.7 5.8 0.9 2.5 1.9 6.6 2.87 Spain 4.3 5.8 6.1 7.9 5.2 3.0 7.0 5.61 Sweden 14.3 5.8 5.1 8.3 6.6 4.4 4.4 7.0
20 Switzerland 5.2 0.7 3.6 6.2 5.5 3.4 4.7 4.212 United Kingdom 5.0 5.7 6.3 3.0 7.3 4.3 4.3 5.117 United States 2.3 7.0 5.3 5.3 3.1 6.2 5.0 4.9
Commitment to Development Index 2009

Average rank change when one component weighted more