2009 - canada
TRANSCRIPT

Tax ExpEndiTurEs and EvaluaTions
2009
Department of FinanceCanada
Ministère des FinancesCanada
Department of FinanceCanada
Ministère des FinancesCanada

©Her Majesty the Queen in Right of Canada (2009) All rights reserved
All requests for permission to reproduce this document or any part thereofshall be addressed to Public Works and Government Services Canada.
Cette publication est également disponible en français.
Cat. No.: F1-27/2009E-PDF ISBN: 978-1-100-14307-1

Table of Contents
Preface ...................................................................................................................................................................................... 5
Part 1—Tax Expenditures: Estimates and Projections ..................................................................................... 7
Introduction ......................................................................................................................................................................... 9
Caveats .................................................................................................................................................................................... 10
What’s New in the 2009 Report ................................................................................................................................. 11
Personal Income Tax ................................................................................................................................................... 11
Corporate Income Tax ............................................................................................................................................... 13
The Tax Expenditures ...................................................................................................................................................... 14
Part 2—Research Report .................................................................................................................................................... 31
An International Comparison of Tax Assistance for Investment in Research and Development ................................................................................................... 33


5
PrefaceThe Department of Finance has published tax expenditures for personal and corporate income taxes as well as for the Goods and Services Tax since 1994. Beginning in 2000, the tax expenditure report has been separated into two documents. This document, Tax Expenditures and Evaluations, is published annually. It provides estimates and projections for broadly defined tax expenditures as well as evaluations and analytical papers addressing specific tax measures. This year’s edition includes an analytical paper entitled “An International Comparison of Tax Assistance for Investment in Research and Development.”
The companion document, Tax Expenditures: Notes to the Estimates/Projections, was last published in 2004. It is a reference document for readers who want descriptions of, or information on the objectives of, particular tax expenditures or who wish to know more about how the estimates and projections are calculated. New tax expenditures are described in the relevant section of Tax Expenditures and Evaluations.


parT 1Tax ExpEndiTurEs:
EsTimaTEs and projEcTions


9
IntroductionThe principal function of the tax system is to raise the revenues necessary to fund government expenditures that reflect society’s priorities. The tax system can also be used directly to achieve public policy objectives through the application of special tax rates, exemptions, deductions, rebates, deferrals and credits that affect the level and distribution of tax. These measures are often described as “tax expenditures” because they achieve policy objectives at the cost of lower tax revenue.
To identify and estimate tax expenditures, it is necessary to establish a “benchmark” tax structure that applies the relevant tax rates to a broadly defined tax base—e.g. personal income, business income or consumption. Tax expenditures are then defined as deviations from this benchmark. Reasonable differences of opinion exist about what should be considered a normal part of the tax system and hence about what should be considered a tax expenditure. For example, a deduction for expenses incurred in earning income is generally considered part of the benchmark and thus not as a tax expenditure. But in some cases the deduction may confer some personal benefit, making its classification ambiguous.
This report takes a broad approach and includes estimates and projections of the revenue loss associated with all but the most fundamental structural elements of the tax system, such as the progressive personal income tax rate structure. This includes not only measures that may reasonably be regarded as tax expenditures but also other measures that may be considered part of the benchmark tax system. The latter are listed separately under “memorandum items.” For instance, the Dividend Tax Credit is listed under this heading because its purpose is to reduce or eliminate the double taxation of income earned by corporations and distributed to individuals through dividends. Also included under this heading are measures for which there may be some debate over whether they should be considered tax expenditures, or where data limitations do not permit a separation of the tax expenditure and benchmark components of the measure. This approach provides information on a full range of measures.

Tax Expenditures and Evaluations 2009
10
CaveatsCare must be taken in interpreting the estimates and projections of tax expenditures in the tables for the following reasons.
• Theestimatesandprojectionsareintendedtoindicatethepotentialrevenuegainthatwouldberealized by removing individual tax measures. They are developed assuming that the underlying tax base would not be affected by removal of the measure. However, this is an assumption that is unlikely to be true in practice as the behaviour of beneficiaries of tax expenditures, overall economic activity and other government policies could change along with the specific tax provision.
• Thecostofeachtaxmeasureisdeterminedseparately,assumingthatallothertaxprovisionsremainunchanged. Many of the tax expenditures do, however, interact with each other such that the impact of several tax provisions at once cannot generally be calculated by adding up the estimates and projections for each provision.
• Thefederalandprovincialincometaxsystemsinteractwitheachothertovaryingdegrees. As a result, changes to tax expenditures in the federal system may have consequences for provincial tax revenues. In this publication, however, any such provincial effects are not taken into account—that is, the tax expenditure estimates and projections address strictly the federal tax system and federal tax revenue.
• Thetaxexpenditureestimatesandprojectionspresentedinthisdocumentaredevelopedusingthe latest available taxation data. Revisions to the underlying data as well as improvements to the methodology can result in substantial changes to the value of a given tax expenditure in successive publications. In addition, estimates and projections for some tax measures, such as the half inclusion rate on capital gains, are particularly sensitive to economic parameters and hence may also differ significantly from one publication to the next.

11
What’s New in the 2009 ReportNew tax measures were introduced and others modified in Budget 2009. The major changes are described below.
Personal Income Tax
Income Tax BracketsThe upper limit of the first personal income tax bracket was increased to $40,726 in 2009 from $37,885 in 2008, allowing more income to be taxed at the lowest 15-per-cent rate, rather than the 22-per-cent rate.
The upper limit of the second personal income tax bracket was increased to $81,452 in 2009 from $75,769 in 2008, allowing more income to be taxed at the 22-per-cent rate, rather than the 26-per-cent rate.
While the progressive rate structure is considered part of the benchmark personal income tax system, the increases in the upper limits of the first two brackets affect many of the tax expenditure projections in the report.
Basic Personal Amount and Related AmountsBudget 2009 increased the basic personal amount, the amount that all Canadians can earn without paying federal personal income tax, to $10,320 in 2009 from $9,600 in 2008, and made corresponding increases to the amount for a dependent spouse or common-law partner and the equivalent amount for an eligible dependant.
Working Income Tax BenefitBudget 2009 enhanced the tax relief provided by the Working Income Tax Benefit (WITB) by $580 million. This is expected to effectively double the total tax relief provided by the WITB. The enhanced relief will further strengthen work incentives for low-income Canadians already in the workforce, and encourage low-income Canadians to enter the workforce.
The enhanced WITB will provide up to $925 per year to single individuals and up to $1,680 per year to couples and single parents. In addition, a supplement of up to $463 per year will be available for low-income working Canadians with disabilities who are eligible for the Disability Tax Credit. To further reduce the welfare wall, the phase-in rate for single individuals, couples and single parents will be increased to 25 per cent in 2009 from 20 per cent in 2008. The phase-out threshold will be increased to $10,500 in 2009 from $9,681 for singles, and decreased to $14,500 from $14,776 for couples and single parents.
Age Credit Budget 2009 provided tax relief to seniors by increasing the Age Credit amount by $1,000 for 2009 and subsequent taxation years. With the $1,000 increase, the Age Credit amount for 2009 will be $6,408 and provide tax relief of up to $961 for eligible seniors.

Tax Expenditures and Evaluations 2009
12
First-Time Home Buyers’ Tax Credit
Objective: To assist first-time home buyers with costs associated with the purchase of a home.(Budget 2009)
To assist first-time home buyers with the costs associated with the purchase of a home, Budget 2009 introduced the First-Time Home Buyers’ Tax Credit. It is a non-refundable tax credit based on an amount of $5,000 for first-time home buyers who acquire a qualifying home after January 27, 2009. At a 15-per-cent credit rate, the tax credit provides up to $750 in tax relief. Any unused portion of the tax credit may be claimed by an individual’s spouse or common-law partner.
Home Buyers’ PlanTo provide first-time home buyers with additional access to their Registered Retirement Savings Plan (RRSP) savings to purchase or build a home, Budget 2009 announced an increase in the Home Buyers’ Plan withdrawal limit to $25,000 from $20,000 in respect of withdrawals made after January 27, 2009. The tax expenditure associated with the Home Buyers’ Plan is included in the overall RRSP tax expenditure estimates and projections.
Home Renovation Tax Credit
Objective: To provide a temporary incentive for homeowners to invest in improvementsto their homes and to stimulate economic growth. (Budget 2009)
The temporary Home Renovation Tax Credit will provide a 15-per-cent income tax credit on eligible home renovation expenditures for work performed, or goods acquired, after January 27, 2009 and before February 1, 2010, pursuant to agreements entered into after January 27, 2009. The credit may be claimed for the 2009 taxation year on the portion of eligible expenditures exceeding $1,000, but not more than $10,000, and will provide up to $1,350 in tax relief.
Mineral Exploration Tax Credit for Flow-Through Share InvestorsThe Mineral Exploration Tax Credit is a reduction in tax, available to individuals who invest in flow-through shares, equal to 15 per cent of specified mineral exploration expenses incurred in Canada and transferred to flow-through share investors. The credit was introduced on a temporary basis in 2000 and has been extended since then. Budget 2009 extended eligibility for the credit for an additional year to flow-through share agreements entered into on or before March 31, 2010. Under the one-year “look-back” rule, funds raised with the benefit of the credit in 2010, for example, can be spent on eligible exploration up to the end of 2011.

13
Deferral of Income From Sale of Livestock During Drought, Flood or Excessive Moisture YearsThis measure allows farmers who sell their breeding livestock in certain circumstances to defer, in computing their farming income for income tax purposes, a portion of the proceeds of disposition obtained from the sale of their breeding livestock, generally until the following year. This measure applies only where the farmer carries on business in a prescribed drought region; a proposed expansion would allow the measure to apply where the farmer carries on business in a region of flood or excessive moisture. The proposed expansion applies to 2008 and subsequent taxation years.
Corporate Income Tax
Small Business DeductionThe small business deduction provides Canadian-controlled private corporations (CCPCs) with an 11-per-cent federal corporate income tax rate on qualifying active business income. The annual amount of active business income eligible for the reduced rate (generally referred to as the small business limit) was increased to $500,000 from $400,000 as of January 1, 2009 as part of Budget 2009.
Expenditure Limits for the Enhanced Scientific Research and Experimental Development Investment Tax Credit CCPCs are eligible to earn investment tax credits at an enhanced rate of 35 per cent on up to $3 million of scientific research and experimental development (SR&ED) expenditures annually. This $3-million expenditure limit is reduced as a CCPC’s taxable income and taxable capital relating to the previous year increase beyond certain limits.
As a result of measures introduced in Budget 2009, the $3-million expenditure limit for SR&ED will begin to be reduced at the new small business limit of $500,000 (formerly $400,000) and will be fully eliminated where taxable income in the previous year is $800,000 (formerly $700,000) or more. This change will apply where the previous taxation year ends after 2008.

Tax Expenditures and Evaluations 2009
14
The Tax ExpendituresTables 1 to 3 provide tax expenditure values for personal income tax, corporate income tax and the Goods and Services Tax (GST) for the years 2004 to 2009. Values for the years 2004 to 2007 are based on tax data supplied by the Canada Revenue Agency, or are calculated from data supplied by Statistics Canada and other government departments and agencies, with a few exceptions. In these cases, and for all projections, the values shown are determined from the historical relationship between a tax expenditure and relevant economic variables. The economic variables used to develop the 2008 and 2009 projections1 are generally based on the forecast presented in the September 2009 Update of Economic and Fiscal Projections. See Chapter 1 of Tax Expenditures: Notes to the Estimates/Projections2 for additional details on the methodology.
The tax expenditures are grouped according to functional categories. This grouping is provided solely for presentational purposes and is not intended to reflect underlying policy considerations.
All estimates and projections are reported in millions of dollars. The letter “S” (“small”) indicates that the absolute value of the tax expenditure is less than $2.5 million, “n.a.” signifies that data is not available to support a meaningful estimate/projection, and a dash means that the tax expenditure is not in effect. The inclusion in the report of items for which estimates and projections are not available reflects the intention to provide information on measures included in the tax system even if it is not always possible to provide their revenue impacts. Work is continuing to obtain quantitative estimates and projections where possible. For example, in this year’s edition, revenue loss estimates have been prepared for eight measures for which estimates were previously not available.
1 In previous tax expenditure publications, projections were provided for the current year and two subsequent years. Starting this year, projections will be limited to the current year of publication.
2 Available on the Department of Finance website at www.fin.gc.ca.

15
Table 1Personal Income Tax Expenditures* Estimates1 Projections1
2004 2005 2006 2007 2008 2009
($ millions)
Charities, Gifts and ContributionsCharitable Donations Credit 2,000 2,260 2,480 2,495 2,380 2,380Reduced inclusion rate for capital gains arising
from donations of publicly listed securities2 8 9 26 50 34 34Reduced inclusion rate for capital gains arising
from donations of ecologically sensitive land3 S S S S 3 3Non-taxation of capital gains on gifts of cultural property4 18 10 4 6 7 7Non-taxation of gifts and bequests n.a. n.a. n.a. n.a. n.a. n.a.Political Contribution Tax Credit5 22 26 24 18 25 18
CultureAssistance for artists – S S S S SDeduction for artists and musicians – S S S S S
EducationAdult basic education—tax deduction for tuition assistance 5 5 5 5 5 5Apprentice vehicle mechanics’ tools deduction6 – 3 4 4 4 4Education Tax Credit7 240 220 240 220 225 215Tuition Tax Credit7 290 265 265 250 265 255Textbook Tax Credit7,8 – – 46 42 44 42Education, Tuition and Textbook Tax Credits
carried forward from prior years9 345 365 420 380 405 385Transfer of Education, Tuition and Textbook Tax Credits 460 445 475 470 480 480Exemption of scholarship, fellowship and bursary income10 11 11 37 38 38 38Registered Education Savings Plans 150 145 170 185 165 140Student Loan Interest Credit 58 55 66 64 67 68
EmploymentCanada Employment Credit11 – – 470 1,785 1,860 1,880Deduction for income earned by military
and police deployed to high-risk international missions 26 18 25 35 36 37Deduction of home relocation loans S S S S S SDeferral of salary through leave
of absence/sabbatical plans n.a. n.a. n.a. n.a. n.a. n.a.Employee benefit plans n.a. n.a. n.a. n.a. n.a. n.a.Employee stock options12 725 945 1,085 1,160 745 830Non-taxation of certain non-monetary
employment benefits n.a. n.a. n.a. n.a. n.a. n.a.Non-taxation of strike pay n.a. n.a. n.a. n.a. n.a. n.a.Northern residents deduction13 135 135 140 140 155 150Overseas Employment Credit 45 40 42 42 42 43Tax-free amount for emergency service volunteers 14 14 14 14 14 14Deduction for tradespeople’s tool expenses14 – – 15 15 15 15Working Income Tax Benefit15 – – – 455 480 1,075* The elimination of a tax expenditure would not necessarily yield the full tax revenues shown in the table. See the publication Tax Expenditures:
Notes to the Estimates/Projections (published in 2004 and available on the Department of Finance website at www.fin.gc.ca) for a discussion of the reasons for this.

Tax Expenditures and Evaluations 2009
16
Table 1Personal Income Tax Expenditures* (cont’d) Estimates1 Projections1
2004 2005 2006 2007 2008 2009
($ millions)
FamilyAdoption Expense Tax Credit16 – 3 S S S SCaregiver Credit 79 79 85 83 86 85Child Tax Credit17 – – – 1,385 1,420 1,430Deferral of capital gains through transfers to a spouse,
spousal trust or family trust n.a. n.a. n.a. n.a. n.a. n.a.Infirm Dependant Credit 6 5 5 5 5 5Spouse or Common-Law Partner Credit18 1,195 1,205 1,205 1,285 1,305 1,420Eligible Dependant Credit19 665 665 675 730 740 765
Farming and FishingLifetime capital gains exemption for farm/fishing property20 255 255 280 370 365 365Cash-basis accounting n.a. n.a. n.a. n.a. n.a. n.a.Deferral of capital gains through intergenerational
rollovers of family farms, family fishing businesses and commercial woodlots n.a. n.a. n.a. n.a. n.a. n.a.
Deferral of income from destruction of livestock21 9 -10 S S S SDeferral of income from sale of livestock during drought,
flood or excessive moisture years22 n.a. n.a. n.a. n.a. n.a. n.a.Deferral of income from grain sold through
cash purchase tickets23 S -20 10 30 40 -15Deferral through 10-year capital gain reserve S S S S S SExemption from making quarterly tax instalments n.a. n.a. n.a. n.a. n.a. n.a.Flexibility in inventory accounting n.a. n.a. n.a. n.a. n.a. n.a.Tax treatment of the Net Income Stabilization Account24
Deferral of tax on government contributions S S S S S SDeferral of tax on bonus and interest income 21 7 S S S STaxable withdrawals -180 -155 -8 S S S
AgriInvest (farm savings account)25 – – – – 20 20
Federal-Provincial Financing ArrangementsLogging Tax Credit S S S S S SQuebec abatement 3,345 3,405 3,495 3,520 3,695 3,660Transfers of income tax points to provinces 14,980 15,935 16,995 17,450 18,370 18,190
General Business and Investment$200 capital gains exemption on foreign exchange transactions n.a. n.a. n.a. n.a. n.a. n.a.$1,000 capital gains exemption on personal-use property n.a. n.a. n.a. n.a. n.a. n.a.Deduction of accelerated capital cost allowance n.a. n.a. n.a. n.a. n.a. n.a.Deferral through billed-basis accounting by professionals n.a. n.a. n.a. n.a. n.a. n.a.Deferral through capital gains rollovers n.a. n.a. n.a. n.a. n.a. n.a.Deferral through five-year capital gain reserve 23 21 25 25 25 25Investment tax credits26 20 15 20 15 15 15Flow-through share deductions 335 465 715 700 360 255Mineral Exploration Tax Credit for flow-through share investors27 46 46 92 150 47 24Reclassification of flow-through shares28 16 9 12 -4 -12 -10Partial inclusion of capital gains29 2,840 4,015 5,100 5,935 3,090 3,245Taxation of capital gains upon realization n.a. n.a. n.a. n.a. n.a. n.a.Tax-Free Savings Account30 – – – – – 45

17
Table 1Personal Income Tax Expenditures* (cont’d) Estimates1 Projections1
2004 2005 2006 2007 2008 2009
($ millions)
Small BusinessLifetime capital gains exemption for small business shares31 380 430 440 580 605 635Deduction of allowable business investment losses 30 24 25 30 35 40Deferral through 10-year capital gain reserve S S S S S SLabour-Sponsored Venture Capital Corporations Credit 150 125 125 120 120 120Non-taxation of provincial assistance
for venture investments in small businesses32 n.a. n.a. n.a. n.a. n.a. n.a.Rollovers of investments in small businesses 4 6 5 10 10 10
HealthChildren’s Fitness Tax Credit33 – – – 90 105 115Disability Tax Credit 390 395 430 410 435 415Medical Expense Tax Credit 800 805 875 915 990 955Non-taxation of business-paid health and dental benefits 2,155 2,170 2,310 2,490 2,620 2,710Refundable medical expense supplement34 77 92 115 115 125 135
Income Maintenance and RetirementAge Credit35 1,490 1,400 1,810 1,735 1,850 2,185Deferred Profit-Sharing Plans n.a. n.a. n.a. n.a. n.a. n.a.Non-taxation of certain amounts received as damages
in respect of personal injury or death 14 14 15 18 20 21Non-taxation of Guaranteed Income Supplement
and Allowance benefits36 295 245 180 150 170 85Non-taxation of investment income on life insurance policies37 n.a. n.a. n.a. n.a. n.a. n.a.Non-taxation of RCMP pensions/compensation
in respect of injury, disability or death n.a. n.a. n.a. n.a. n.a. n.a.Non-taxation of social assistance benefits38 205 180 185 120 140 115Non-taxation of up to $10,000 of death benefits n.a. n.a. n.a. n.a. n.a. n.a.Non-taxation of veterans’ allowances, income support benefits,
civilian war pensions and allowances, and other service pensions (including those from Allied countries)39 3 3 S S S S
Non-taxation of veterans’ disability pensions and support for dependants39 150 145 150 145 150 140
Non-taxation of veterans’ Disability Award40 – – 3 11 19 18Non-taxation of workers’ compensation benefits 630 620 630 655 700 675Registered Disability Savings Plans – – – – S SPension Income Credit41 440 420 840 945 980 945Pension income splitting42 – – – 665 700 730Registered Pension Plans43
Deduction for contributions 7,740 8,355 9,825 9,450 9,415 9,485Non-taxation of investment income 10,230 11,580 13,085 14,875 7,065 8,665Taxation of withdrawals -7,090 -7,335 -7,295 -6,730 -7,070 -6,820Net tax expenditure 10,880 12,600 15,615 17,595 9,410 11,330
Registered Retirement Savings Plans43
Deduction for contributions 6,410 6,820 7,320 7,585 7,440 7,850Non-taxation of investment income 5,660 6,920 7,990 9,090 4,000 5,270Taxation of withdrawals -4,005 -4,280 -4,620 -4,600 -4,405 -4,600Net tax expenditure 8,065 9,460 10,690 12,075 7,035 8,520
Supplementary information: present value of tax-assisted retirement savings plans44 7,450 8,120 8,850 9,395 9,280 9,840

Tax Expenditures and Evaluations 2009
18
Table 1Personal Income Tax Expenditures* (cont’d) Estimates1 Projections1
2004 2005 2006 2007 2008 2009
($ millions)
Saskatchewan Pension Plan S S S S S STreatment of alimony and maintenance payments 98 97 86 92 97 100
Other ItemsDeduction related to vows of perpetual poverty S S S S S SDeduction for clergy residence 67 70 75 74 76 75First-Time Home Buyers’ Tax Credit45 – – – – – 160Home Renovation Tax Credit46 – – – – – 3,000Non-taxation of capital gains on principal residences47
Partial inclusion rate 2,555 3,465 4,325 5,460 3,485 3,115Full inclusion rate 5,110 6,925 8,650 10,920 6,970 6,230
Non-taxation of income from the Office of the Governor General S S S S S SNon-taxation of income of Indians on reserves n.a. n.a. n.a. n.a. n.a. n.a.Special tax computation for certain
retroactive lump-sum payments S S S S S SPublic Transit Tax Credit48 – – 39 100 120 130
Memorandum ItemsAvoidance of Double TaxationDividend gross-up and Dividend Tax Credit49 1,480 1,730 2,330 2,745 3,055 3,055Foreign Tax Credit 615 655 705 715 730 720Non-taxation of capital dividends n.a. n.a. n.a. n.a. n.a. n.a.
Recognition of Expenses Incurred to Earn IncomeChild care expense deduction50 570 570 740 745 765 760Deduction of carrying charges incurred to earn income 775 895 1,105 1,270 1,240 1,240Deduction of union and professional dues 615 630 660 680 710 715Disability supports deduction (attendant care deduction) S S S S S SMoving expense deduction 88 100 115 115 120 125
Loss Offset ProvisionsCapital loss carry-overs51 250 305 340 335 135 250Farm and fishing loss carry-overs 14 15 15 15 15 15Non-capital loss carry-overs 62 50 50 60 45 50
Social and Employment Insurance ProgramsCanada Pension Plan and Québec Pension Plan
Employee-Paid Contribution Credit 2,570 2,510 2,665 2,735 2,860 2,920Non-taxation of employer-paid premiums52 3,835 3,960 4,145 4,395 4,610 4,655
Employment InsuranceEmployment Insurance Contribution Credit53 1,020 970 965 935 945 970Non-taxation of employer-paid premiums 1,990 1,995 1,835 1,840 1,855 1,870
Other Basic personal amount54 22,865 23,410 24,340 25,710 26,190 27,770Deduction of other employment expenses 870 890 905 935 975 990Non-taxation of lottery and gambling winnings55 n.a. n.a. n.a. n.a. n.a. n.a.Non-taxation of allowances for diplomats, military
and other government employees posted abroad 30 26 27 29 30 30Partial deduction of meals and entertainment expenses56 115 125 125 160 180 195

19
Notes:1 Unless otherwise indicated in the footnotes, changes in the estimates and projections from those in last year’s report, as well as
variations from year to year, result from changes in the explanatory economic variables upon which the estimates and projections are based. These changes and variations also reflect the availability of new data and improvements to the methodology used to derive the estimates and projections. In addition, the tax expenditure estimate or projection for a given measure is often affected by changes to other measures. In particular, the introduction or enhancement of broad-based non-refundable tax credits (e.g. the basic personal amount, Age Credit, Pension Income Credit and Child Tax Credit) along with reductions in the lowest personal income tax rate tend to reduce tax expenditure estimates and projections.
2 The total tax expenditure cost of this measure has two components: the revenue forgone as a result of the reduced inclusion rate (which is shown in the main table), and the increased cost of the Charitable Donations Credit from any increase in donations that results from the measure. If all of the donations of listed securities would have been made in the absence of this measure, then (as shown in the main table) the total cost ranges from $8 million to $50 million between 2004 and 2009. If, on the other hand, all donations of listed securities came about as a result of the reduced inclusion rate on capital gains, and if in the absence of the measure the shares would have been sold instead of donated, then the cost of the measure ranges from $67 million to $215 million between 2004 and 2009, as shown below (in millions of dollars):
2004 2005 2006 2007 2008 2009
68 67 115 215 150 150
The true costs fall somewhere between the lower and upper bounds set by the ranges indicated.3 The total tax expenditure cost of this measure has two components: the revenue forgone as a result of the reduced inclusion rate
(which is shown in the main table), and the increased cost of the Charitable Donations Credit from any increase in donations that results from the measure. If all of the donations of ecologically sensitive land would have been made in the absence of this measure, then (as shown in the main table) the total cost ranges from small to $3 million between 2004 and 2009. If, on the other hand, all donations of ecologically sensitive land came about as a result of the reduced inclusion rate on capital gains, and if in the absence of the measure the land would have been sold instead of donated, then the cost of the measure ranges from $4 million to $11 million between 2004 and 2009, as shown below (in millions of dollars):
2004 2005 2006 2007 2008 2009
8 4 5 8 11 11
The true cost falls somewhere between the lower and upper bounds set by the ranges indicated. 4 The total tax expenditure cost of this measure has two components: the revenue forgone as a result of the reduced inclusion rate
(which is shown in the main table), and the increased cost of the Charitable Donations Credit from any increase in donations that results from the measure. If all of the donations of cultural property would have been made in the absence of this measure, then (as shown in the main table) the total cost ranges from $4 million to $18 million between 2004 and 2009. If, on the other hand, all donations of cultural property came about as a result of this measure, and if the property would otherwise have been sold instead of donated, then the cost of the measure ranges from $15 million to $72 million between 2004 and 2009, as shown below (in millions of dollars):
2004 2005 2006 2007 2008 2009
72 40 15 26 30 28
The true cost falls somewhere between the lower and upper bounds set by the ranges indicated.5 The higher levels for this tax expenditure in 2005 and 2006 reflect the fact that contributions in respect of the 39th general election
were spread over two calendar years. The tax expenditure is expected to be higher in 2008 as a result of contributions in respect of the 40th general election. Since the date of the next general election is unknown, no projections are included in this regard.
6 The amount of the tax expenditure for this measure has been adjusted upward and reflects improvements to the previous methodology.
7 This tax expenditure relates to amounts earned in the year and claimed by the student (i.e. neither transferred nor carried forward).8 This measure was introduced in Budget 2006, effective January 1, 2006.9 For a given year, this tax expenditure represents the value of Education, Tuition and Textbook Tax Credits earned in past years and
used in that year. The tax expenditure does not include the pool of unused Education, Tuition and Textbook Tax Credits that have been accumulated but will be deferred for use in future years.

Tax Expenditures and Evaluations 2009
20
10 The tax expenditure equals the tax revenue forgone from exempting scholarship, fellowship and bursary income from tax. Budget 2006 introduced a measure that makes all amounts received for post-secondary scholarships, fellowships and bursaries exempt from tax, where these amounts are received in connection with enrolment in a program for which the student can claim the Education Tax Credit. The maximum exemption for tax years prior to 2006 was $3,000 for these students. Budget 2007 extended this treatment to elementary and secondary school students, effective 2007. All other scholarships, fellowships and bursaries receive a tax exemption on the first $500.
11 This measure was introduced in Budget 2006. Because it was effective in July 2006, the maximum amount on which the credit is calculated for the 2006 taxation year is $250. For 2007, the maximum amount on which the credit is calculated was increased to $1,000. This maximum amount has been indexed for years subsequent to 2007.
12 Projections of this tax expenditure for 2007 and 2008 are based on preliminary tax return data. The decline of this tax expenditure in 2008 reflects the general decline in Canadian stock values in 2008.
13 Budget 2008 increased the maximum daily residency deduction by 10 per cent from $15 to $16.50, effective 2008. 14 This measure was introduced in Budget 2006, effective May 2, 2006.15 This measure was announced in Budget 2007, effective 2007. Budget 2009 proposed to enhance this measure, effective 2009. 16 This measure was introduced in Budget 2005, effective 2005.17 This measure was introduced in Budget 2007, effective 2007.18 Budget 2007 and the 2007 Economic Statement enhanced this credit, effective 2007. Budget 2009 enhanced the credit,
effective 2009.19 Budget 2007 and the 2007 Economic Statement enhanced this credit, effective 2007. Budget 2009 enhanced the credit,
effective 2009.20 Budget 2006 extended the lifetime capital gains exemption (LCGE) to qualifying fishing property, effective May 2, 2006.
Budget 2007 announced an increase in the LCGE to $750,000 from $500,000, effective March 19, 2007.21 The estimate for 2004 is higher than in other years due to the effects of the outbreak of avian flu in British Columbia. The deferred
income from 2004 was reported in 2005, resulting in a negative tax expenditure for that year.22 The tax measure was expanded to include prescribed flood or excessive moisture regions. This proposed expansion applies to
the 2008 and subsequent taxation years. 23 Estimates are based on Statistics Canada data available up to 2008, which includes cash purchase tickets for wheat, barley,
oats, canola, flax and rye. Projections are calculated using a historical average growth rate.24 Amounts for 2004 are observed values. The Net Income Stabilization Account (NISA) and the Canadian Farm Income Program
were replaced by the Canadian Agricultural Income Stabilization Program, with the effect that government contributions under NISA ceased as of December 31, 2003. All funds in participant accounts are paid out as of March 31, 2009. Tax expenditure estimates and projections reflect the wind-down schedule.
25 This measure was introduced in Budget 2007. This tax expenditure represents the deferral of federal personal income taxes on government contributions to AgriInvest accounts. The smaller tax expenditure in 2008 than projected in prior years reflects the availability of new 2008 AgriInvest data from Agriculture and Agri-Food Canada and the ministère de l’Agriculture, des Pêcheries et de l’Alimentation du Québec on the levels of contributions and withdrawals in the accounts, and the higher than anticipated withdrawal rate from AgriInvest accounts.
26 This tax expenditure has been adjusted to exclude the component of investment tax credits attributed to the Mineral Exploration Tax Credit for flow-through share investors. The tax expenditure for the Mineral Exploration Tax Credit for flow-through share investors is presented separately in this report. Other adjustments, including the removal of the effect of the alternative minimum tax and the effect of tax credit carry-forwards, have been made to ensure consistency with the general methodology used to assess tax expenditures.
27 The credit was introduced on a temporary basis in 2000 and has been extended since. It is currently set to expire on March 31, 2010.
28 The negative tax expenditure for 2007 and subsequent years reflects a decline in the volume of reclassifications in respect of Canadian Development Expenses transferred to individuals investing in flow-through shares. As with any tax measure that accelerates the rate at which deductions can be claimed against income, the reclassification of Canadian Development Expenses (30 per cent/year deduction rate) as Canadian Exploration Expenses (100 per cent/year deduction rate) results in a relatively large positive tax expenditure in the first year(s) of an investment, followed by a period of relatively smaller negative tax expenditures. The overall tax expenditure is negative for 2007 and subsequent years because the positive tax expenditure associated with new spending in those years is more than offset by the negative tax expenditure resulting from reclassifications that occurred in previous years. For more information, see the entry for this measure in the “What’s New in the 2008 Report” section of the 2008 Tax Expenditures and Evaluations.

21
29 Projections for 2007 and 2008 are based on preliminary tax return information. The significant decline of this tax expenditure in 2008 and 2009 reflects poor market conditions in 2008. As in previous years, the approach does not take into account the ability of individuals to apply capital losses against previous-year capital gains.
30 The Tax-Free Savings Account was introduced in Budget 2008 and is effective January 1, 2009.31 Budget 2007 announced an increase in the lifetime capital gains exemption to $750,000 from $500,000, effective
March 19, 2007.32 This is a new item in the personal income tax table. Please refer to the corporate income tax section of the publication Tax
Expenditures: Notes to the Estimates/Projections (published in 2004 and available on the Department of Finance website at www.fin.gc.ca) for a description of the measure.
33 This measure was introduced in Budget 2006, effective 2007. Budget 2007 enhanced this measure for children with disabilities. 34 The increase in the tax expenditure reflects enhancements to the credit announced in the 2005 and 2006 budgets. Specifically,
Budget 2005 increased the maximum amount of the supplement from $571 to $750 per year, effective 2005, and Budget 2006 subsequently increased the maximum amount from $767 to $1,000, effective 2006.
35 The Age Credit amount was increased by $1,000, to $5,066 from $4,066, in the Tax Fairness Plan (announced October 31,˛2006 and confirmed in Budget 2007), effective January 1, 2006. Budget 2009 increased the amount by $1,000, to $6,408 from $5,408, effective 2009.
36 The decline in this tax expenditure in 2007 and 2009 is mainly explained by the increase in non-taxpaying seniors due to increases in the basic personal amount and other non-refundable credits relevant to seniors (such as the Age Credit).
37 Although this measure provides tax relief for individuals, it is implemented through the corporate tax system. See “investment income credited to life insurance policies” in the corporate income tax table for estimates and projections of this tax expenditure.
38 The decline in this tax expenditure in 2007 generally reflects the increase in non-taxpaying low-income earners due to increases in the basic personal amount and the spouse or common-law partner amount, as well as the introduction of the Child Tax Credit. The decline in 2009 generally reflects the Budget 2009 increase in the basic personal amount and related amounts.
39 This tax expenditure is based on data received from Veterans Affairs Canada. As part of the New Veterans Charter, in 2006 the Canadian Forces Income Support Benefit was established as a tax-free amount for eligible low-income veterans.
40 This tax expenditure is based on data received from Veterans Affairs Canada. As of 2006, the Disability Award has replaced the Veterans Disability Pension for eligible new applicants (current disability pensioners have been grandfathered).
41 Budget 2006 doubled the maximum amount that can be claimed under the Pension Income Credit to $2,000 from $1,000 for the 2006 and subsequent taxation years. The introduction of pension income splitting in 2007 increases the number of individuals claiming the Pension Income Credit and thus increases the value of this tax expenditure.
42 This measure, announced on October 31, 2006 in the Tax Fairness Plan and confirmed in Budget 2007, allows Canadian residents to allocate up to one-half of eligible pension income to their resident spouse or common-law partner, effective 2007.
43 Estimates and projections vary from those in last year’s report due to changes in tax rates and estimated levels of assets, contributions, investment income, capital gains/losses and withdrawals. In general, tax expenditure estimates and projections will be higher in years in which assets grow strongly, reflecting the tax forgone on that investment income, and lower in years in which assets grow slowly or decline. The estimates and projections also reflect methodological improvements relating to the carry-over of capital losses.
44 The present-value estimates reflect the lifetime cost of a given year’s contributions. This definition is different from that used for the cash-flow estimates and thus the two sets of estimates are not directly comparable. Further information on how these estimates are calculated is contained in the paper “Present-Value Tax Expenditure Estimates of Tax Assistance for Retirement Savings,” which was published in the 2001 edition of this report. The present-value estimates do not reflect the potential effect of Tax-Free Savings Accounts on the average tax rate used to calculate the present value of the forgone tax on investment income.
45 This measure was introduced in Budget 2009. See the “What’s New in the 2009 Report” section for details.46 This temporary measure was introduced in Budget 2009. See the “What’s New in the 2009 Report” section for details.47 The estimates and projections for this tax expenditure reflect the cyclicality of the housing market and its impact on the number
of residence resales and on the average price of residences. Estimates and projections are based on housing market data and resale forecasts provided by Canada Mortgage and Housing Corporation and the Canadian Real Estate Association. Data on major additions and renovations obtained from Statistics Canada are used to estimate the average amount of capital expenditures on principal residences, which reduces the estimated amount of capital gains. The decline in the 2008 tax expenditure reflects the decrease in residential resale activity and prices in 2008.
48 This measure was introduced in Budget 2006, effective July 1, 2006. Budget 2007 extended the credit to electronic fare cards and weekly passes used on an ongoing basis.
Tax Expenditures and Evaluations 2009
22
49 The estimates and projections include the revenue impact associated with both the enhanced Dividend Tax Credit introduced in 2006, mainly applicable to dividends from large businesses, and the basic Dividend Tax Credit applicable to other dividends, mostly from small businesses.
50 Prior to 2006, some families with young children who claimed little or no child care expenses were eligible to receive the Canada Child Tax Benefit (CCTB) under-7 supplement. Thus, the value of the tax expenditure was partially offset by the increase in the CCTB under-7 supplement that would follow any decrease in the amount of child care expenses claimed. The increase in the tax expenditure in 2006 and later years reflects the phase-out of the CCTB under-7 supplement as of June 30, 2006 for children under the age of 6, and June 30, 2007 for 6-year-old children.
51 This tax expenditure represents the revenue impact resulting from the application of previous-year capital losses against the net capital gains realized in the current year. The decline in this tax expenditure in 2008 reflects the reduced ability of taxpayers to use capital losses against capital gains in a period of declining capital markets.
52 Self-employed individuals may deduct the employer share of their Canada/Québec Pension Plan contributions paid for their own coverage. This is included in the tax expenditure for the non-taxation of employer-paid premiums.
53 Estimates and projections include contributions paid to the Québec Parental Insurance Plan (QPIP). The QPIP was effective as of January 1, 2006.
54 The basic personal amount has been increased by amounts over and above the inflation protection provided by full indexation (due to changes in Budget 2005, Budget 2006, the 2007 Economic Statement and Budget 2009).
55 Tax expenditure estimates and projections for this measure are not available, mainly because data on payouts/winnings are incomplete. Data on payouts at casinos, video lottery terminals, horseracing, and racetrack slot machines, which constitute a rising share of total spending on gaming, are fragmentary. In addition, no data are available on the payouts/winnings from activities sponsored by charities and other non-government organizations.
Under federal-provincial agreements negotiated in 1979 and 1985, the federal government, in exchange for an ongoing payment, undertook to refrain from re-entering the field of gaming and betting to ensure that the rights of the provinces in that field are not reduced or restricted.
56 The amount of the tax expenditure for this measure has been adjusted upward for all years, reflecting improvements in methodology.
23
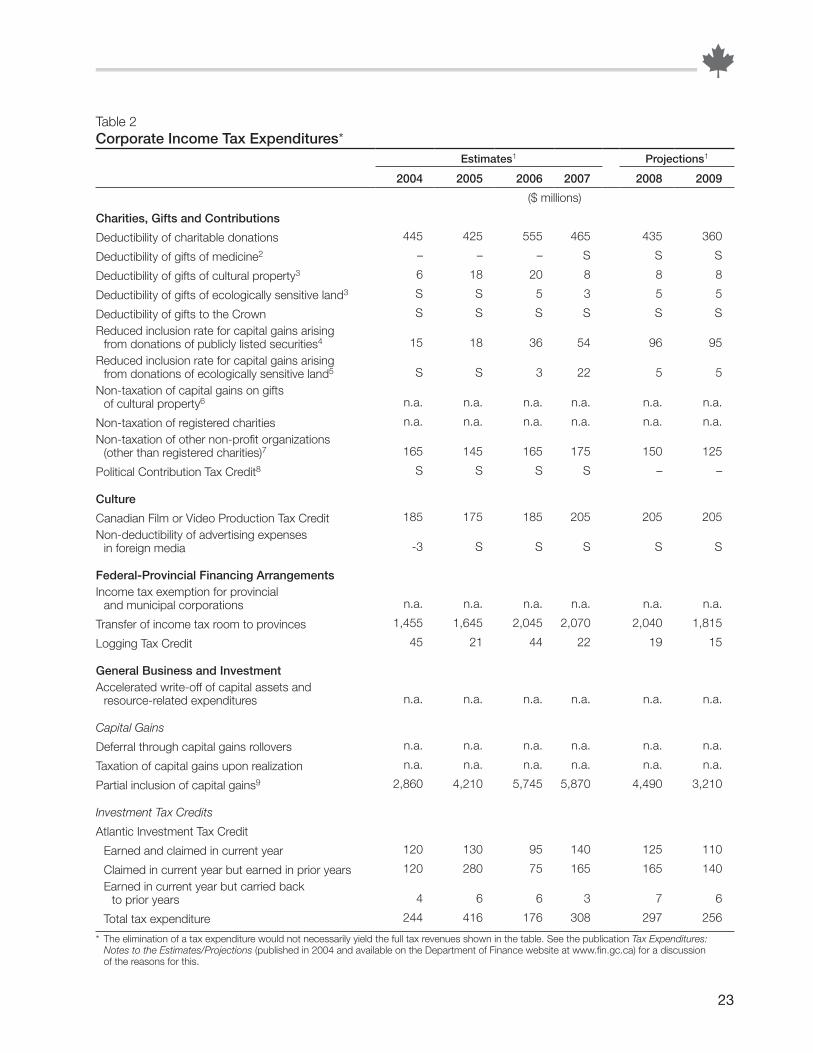
Table 2Corporate Income Tax Expenditures*
Estimates1 Projections1
2004 2005 2006 2007 2008 2009
($ millions)
Charities, Gifts and Contributions
Deductibility of charitable donations 445 425 555 465 435 360
Deductibility of gifts of medicine2 – – – S S S
Deductibility of gifts of cultural property3 6 18 20 8 8 8
Deductibility of gifts of ecologically sensitive land3 S S 5 3 5 5
Deductibility of gifts to the Crown S S S S S S
Reduced inclusion rate for capital gains arising from donations of publicly listed securities4 15 18 36 54 96 95
Reduced inclusion rate for capital gains arising from donations of ecologically sensitive land5 S S 3 22 5 5
Non-taxation of capital gains on gifts of cultural property6 n.a. n.a. n.a. n.a. n.a. n.a.
Non-taxation of registered charities n.a. n.a. n.a. n.a. n.a. n.a.
Non-taxation of other non-profit organizations (other than registered charities)7 165 145 165 175 150 125
Political Contribution Tax Credit8 S S S S – –
Culture
Canadian Film or Video Production Tax Credit 185 175 185 205 205 205
Non-deductibility of advertising expenses in foreign media -3 S S S S S
Federal-Provincial Financing ArrangementsIncome tax exemption for provincial
and municipal corporations n.a. n.a. n.a. n.a. n.a. n.a.
Transfer of income tax room to provinces 1,455 1,645 2,045 2,070 2,040 1,815
Logging Tax Credit 45 21 44 22 19 15
General Business and InvestmentAccelerated write-off of capital assets and
resource-related expenditures n.a. n.a. n.a. n.a. n.a. n.a.
Capital Gains
Deferral through capital gains rollovers n.a. n.a. n.a. n.a. n.a. n.a.
Taxation of capital gains upon realization n.a. n.a. n.a. n.a. n.a. n.a.
Partial inclusion of capital gains9 2,860 4,210 5,745 5,870 4,490 3,210
Investment Tax Credits
Atlantic Investment Tax Credit
Earned and claimed in current year 120 130 95 140 125 110
Claimed in current year but earned in prior years 120 280 75 165 165 140
Earned in current year but carried back to prior years 4 6 6 3 7 6
Total tax expenditure 244 416 176 308 297 256
* The elimination of a tax expenditure would not necessarily yield the full tax revenues shown in the table. See the publication Tax Expenditures: Notes to the Estimates/Projections (published in 2004 and available on the Department of Finance website at www.fin.gc.ca) for a discussion of the reasons for this.

Tax Expenditures and Evaluations 2009
24
Table 2Corporate Income Tax Expenditures* (cont’d)
Estimates1 Projections1
2004 2005 2006 2007 2008 2009
($ millions)
Scientific Research and Experimental Development Investment Tax Credit
Earned and claimed in current year 1,990 2,080 2,180 2,235 2,330 2,225
Claimed in current year but earned in prior years 920 585 605 980 1,025 975
Earned in current year but carried back to prior years 100 90 80 75 95 95
Total tax expenditure 3,010 2,755 2,865 3,290 3,450 3,295
Apprenticeship Job Creation Tax Credit10
Earned and claimed in current year – – 19 53 68 68
Claimed in current year but earned in prior years – – S 3 10 10
Earned in current year but carried back to prior years – – S S 3 3
Total tax expenditure – – 19 58 81 81
Investment Tax Credit for Child Care Spaces – – – S S S
Small Business
Deduction of allowable business investment losses11 20 17 16 14 17 16
Low tax rate for small businesses12 3,090 3,300 4,015 4,930 4,135 3,375
Non-taxation of provincial assistance for venture investments in small businesses n.a. n.a. n.a. n.a. n.a. n.a.
InternationalExemption from Canadian income tax of income
earned by non-residents from the operation of a ship or aircraft in international traffic n.a. n.a. n.a. n.a. n.a. n.a.
Exemption from tax for international banking centres n.a. n.a. n.a. n.a. n.a. n.a.
Exemptions from non-resident withholding tax13
Dividends14 605 1,000 965 1,385 1,445 1,380
Interest
On deposits 100 180 260 320 335 320
On corporate debt15 470 475 310 285 350 335
Other16 37 38 36 48 50 48
Rents and royalties
Copyright royalties 28 40 41 54 57 54
Rents and royalties for the use of, or right to use, other property 135 175 180 200 205 200
Research and development royalties 4 4 5 5 6 5
Natural resource royalties S S S S S S
Rents from real property S S S S S S
Management fees 72 85 97 105 110 105Non-taxation of life insurance companies’
world income n.a. n.a. n.a. n.a. n.a. n.a.Tax treatment of income of foreign affiliates
of Canadian corporations and deductibility of expenses incurred to invest in foreign affiliates n.a. n.a. n.a. n.a. n.a. n.a.

25
Table 2Corporate Income Tax Expenditures* (cont’d)
Estimates1 Projections1
2004 2005 2006 2007 2008 2009
($ millions)
Sectoral MeasuresFarmingCash-basis accounting n.a. n.a. n.a. n.a. n.a. n.a.Deferral of income from destruction of livestock17 4 S S S S SDeferral of income from sale of livestock during
drought, flood or excessive moisture years18 n.a. n.a. n.a. n.a. n.a. n.a.Deferral of income from grain sold through cash
purchase tickets19 S 14 -6 S S SFlexibility in inventory accounting n.a. n.a. n.a. n.a. n.a. n.a.Agricultural cooperatives—patronage dividends issued
as shares20 – – 3 3 3 3AgriInvest (farm savings account)21 – – – – 3 3Insurers of farmer and fisher risks22 6 7 7 4 4 4
ResourceCorporate Mineral Exploration Tax Credit23 13 19 3 18 9 11Deductibility of contributions to a qualifying
environmental trust S 7 3 S S SEarned depletion24 25 40 32 4 4 3Net impact of the resource allowance and the non-
deductibility of Crown royalties and mining taxes25 8 44 17 S – –Tax rate on resource income26 -520 -570 -425 -30 – –Transitional arrangement for the Alberta Royalty
Tax Credit27 S S S S – –Flow-through share deductions 205 275 195 205 125 100Reclassification of expenses under
flow-through shares28 S 3 -3 -3 -3 -3
Other SectorsExemption from branch tax for transportation,
communications, and iron ore mining corporations S 10 S 6 5 4Film or Video Production Services Tax Credit 85 105 110 90 90 90Low tax rate for credit unions 58 54 63 70 84 68Surtax on the profits of tobacco manufacturers29 -55 -50 n.a. n.a. n.a. n.a.
Other ItemsDeductibility of countervailing and
anti-dumping duties n.a. n.a. n.a. n.a. n.a. n.a.Deductibility of earthquake reserves 5 6 6 6 6 6Deferral through use of billed-basis accounting
by professional corporations n.a. n.a. n.a. n.a. n.a. n.a.Holdback on progress payments to contractors30 20 30 50 50 50 40Investment income credited to life
insurance policies31 280 280 295 280 280 280Non-taxation of certain federal Crown corporations n.a. n.a. n.a. n.a. n.a. n.a.

Tax Expenditures and Evaluations 2009
26
Table 2Corporate Income Tax Expenditures* (cont’d)
Estimates1 Projections1
2004 2005 2006 2007 2008 2009
($ millions)
Memorandum ItemsAvoidance of Double Taxation—Integration
of Personal and Corporate Income TaxInvestment corporation deduction S S S S S SRefundable capital gains for investment
and mutual fund corporations32 115 345 415 415 170 145Refundable taxes on investment income
of private corporations33
Additional Part I taxes34 -1,160 -1,515 -2,030 -2,355 -2,720 -2,320 Part IV tax -2,035 -2,175 -2,545 -3,260 -3,135 -2,735 Dividend refund 4,035 4,435 5,395 6,495 7,230 5,450 Net tax expenditure 840 745 820 880 1,375 395
Recognition of Expenses Incurred to Earn IncomeDeduction for intangible assets n.a. n.a. n.a. n.a. n.a. n.a.
Loss Offset ProvisionsCapital loss carry-overs Net capital losses carried back35 220 79 61 165 330 385 Net capital losses applied to current year 355 345 665 735 735 465Farm and fishing loss carry-overs Farm and fishing losses carried back 12 15 14 13 16 18 Farm and fishing losses applied to current year 41 42 62 46 36 33Non-capital loss carry-overs Non-capital losses carried back36 1,585 1,840 1,635 2,145 5,350 6,005 Non-capital losses applied to current year 5,075 5,015 4,575 4,565 4,705 4,885
OtherPartial deduction of meals and
entertainment expenses37 290 300 325 350 300 240
Patronage dividend deduction38 295 315 365 475 395 420Notes:
1 Unless otherwise indicated in the footnotes, changes in the estimates and projections from those in last year’s report, as well as variations from year to year, result from changes in the explanatory economic variables upon which the estimates and projections are based. These changes and variations also reflect the availability of new data and improvements to the methodology used to derive the estimates and projections. Estimates and projections reflect the impact of reductions in the general corporate income tax rate from 23 per cent to 21 per cent on January 1, 2004, 19.5 per cent on January 1, 2008 and 19.0 per cent on January 1, 2009. The 4-per-cent corporate surtax (equivalent to a 1.12-per-cent corporate income tax rate) was eliminated on January 1, 2008.
2 Available data now allows the additional deduction for donations of medicine to the developing world to be shown separately from charitable donations.
3 Available data now allows deductibility of gifts of cultural property and ecologically sensitive land to be shown separately.4 This is a new item in the corporate income tax table. Please refer to the personal income tax section of the publication
Tax Expenditures: Notes to the Estimates/Projections (published in 2004 and available on the Department of Finance website at www.fin.gc.ca) for a description of the measure. The increase in the tax expenditure in 2006 reflects the elimination in Budget 2006 of capital gains tax on donations to public charities of publicly listed securities. The further increase in 2007 reflects the extension of this measure to private foundations in Budget 2007. Finally, the increase in 2008 reflects the elimination of capital gains on donations of exchangeable shares in Budget 2008. The tax expenditure is the amount of revenue forgone resulting from the reduced inclusion rate for capital gains realized when listed securities are donated. It does not include the impact of increases in donations that result from this measure. These impacts are captured in the item “deductibility of charitable donations”. See footnote 2 in the personal income tax table for a further discussion of this issue.

27
5 This is a new item in the corporate income tax table. Please refer to the personal income tax section of the publication Tax Expenditures: Notes to the Estimates/Projections (published in 2004 and available on the Department of Finance website at www.fin.gc.ca) for a description of the measure. The increase in the tax expenditure in 2006 reflects the elimination in that year of capital gains tax on donations to public charities of ecologically sensitive land. The further increase in 2007 and the decline in 2008 and 2009 reflect expected variations in the annual levels of donations. The tax expenditure is the amount of revenue forgone resulting from the reduced inclusion rate for capital gains realized when ecologically sensitive land is donated. It does not include the impact of increases in donations that result from this measure. These impacts are captured in the item “deductibility of gifts of ecologically sensitive land”. See footnote 3 in the personal income tax table for a further discussion of this issue.
6 This is a new item in the corporate income tax table. Please refer to the personal income tax section of the publication Tax Expenditures: Notes to the Estimates/Projections (published in 2004 and available on the Department of Finance website at www.fin.gc.ca) for a description of the measure.
7 The 2007 estimate is based on information from 2006 corporate income tax data and the growth in gross domestic product between 2006 and 2007.
8 The Federal Accountability Act prohibits political contributions from corporations as of January 1, 2007. Some tax expenditure occurred in 2007, however, as many firms reporting income in the 2007 tax year earned a portion of that income in the 2006 calendar year.
9 The large declines in 2008 and 2009 reflect, for the most part, the projected reduction in realized capital gains in these years resulting from the economic downturn.
10 Available data now allows costs to be shown separately for the components of this tax expenditure. 11 The amount of this tax expenditure can fluctuate from year to year depending on the amount of current-year losses and the
availability of income against which to apply these losses.12 The amount of this tax expenditure reflects the impact of Budget 2003, Budget 2006 and Budget 2009, which increased the
amount of small business income eligible for the lower tax rate, and Budget 2004, which accelerated the Budget 2003 increase. In addition, Budget 2006 reduced the small business tax rate and the 2007 Economic Statement accelerated the rate reduction. Finally, the reduction in the tax expenditure between 2007 and 2009 reflects the reduction in the benchmark rate as well as the impact of the current economic climate (see footnote 1).
13 Estimates and projections were computed on the basis of an analysis of payments to non-residents and withholding tax collections available for 1997 to 2007.
14 This category includes the tax expenditure attributable to the exemption of estate and trust income distributions, including distributions by income trusts.
15 The Fifth Protocol to the Canada-U.S. Tax Treaty, which came into effect in 2008, includes an exemption from withholding tax for interest paid to U.S. residents. This exemption is phased in for interest paid to non-arm’s length U.S. residents and is fully effective in the year of ratification of the updated treaty for arm’s length U.S. residents. A statutory exemption from withholding tax for all interest payments to arm’s length foreign lenders also came into effect as of January 2008. Projections for this category therefore include the cost of the statutory exemption from withholding tax for interest payments to all arm’s length non-U.S. foreign lenders starting in 2008. The changes to withholding tax rates for interest payments to U.S. lenders (both arm’s length and non-arm’s length) that were announced in Budget 2007 are contained in the Canada-U.S. Tax Treaty; these changes alter the benchmark and therefore do not affect the tax expenditure for this category.
16 This category includes exemptions for interest paid to non-resident persons or organizations that would be exempt from income tax in Canada were they residents in Canada. Also included are exemptions on interest paid under certain securities-lending arrangements set out in subparagraph 212(1)(b)(xii) of the Income Tax Act, and interest exempt under certain other domestic and treaty provisions which, due to data limitations, cannot be specifically divided between benchmark items and tax expenditures.
17 Estimates and the 2008 projection are based on data obtained from Statistics Canada.18 This is a new item in the corporate income tax table. Please refer to the personal income tax section of the publication
Tax Expenditures: Notes to the Estimates/Projections (published in 2004 and available on the Department of Finance websiteat www.fin.gc.ca) for a description of the measure.
19 The 2009 projection is calculated using a historical average growth rate. Since this tax expenditure is calculated on a cash-flow basis, an increase in the balance of uncashed grain tickets represents additional income that is being deferred and results in a positive tax expenditure. A decrease in the balance of uncashed grain tickets indicates that less income is being deferred and results in a negative tax expenditure. The tax expenditure estimates and projections are volatile over time since a small number of corporations are affected in a narrowly defined sector. Estimates, which include 2008 for this item, and the projection are based on data obtained from Statistics Canada.
20 The estimates and projections published in prior publications were based on the estimate from Budget 2006. The current estimates and projections are based on actual tax return data for 2006 and 2007 and partial tax return data for 2008.

Tax Expenditures and Evaluations 2009
28
21 This is a new item in the corporate income tax table. This measure was announced in Budget 2007. The tax expenditure represents the deferral of federal income taxes on contributions to AgriInvest accounts.
22 This measure provides a tax exemption in respect of a portion of the taxable income of a mutual insurance company that insures property used in farming or fishing (including the principal residence of farmers and fishers). This is the first time this measure has been included in this document.
23 This credit was introduced in Budget 2003 and phased in at 5 per cent in 2003, 7 per cent in 2004 and 10 per cent in subsequent years.
24 Additions to earned depletion pools were eliminated as of January 1, 1990. The tax expenditure reflects use of the existing earned depletion pools.
25 The tax expenditure is the revenue cost of the resource allowance net of non-deductible Crown royalties and provincial mining taxes. Over a five-year period beginning in 2003, the resource allowance was phased out and a deduction for Crown royalties and mining taxes phased in, so that by 2007, this tax expenditure is eliminated. Costs for 2007 relate to companies that did not have a December 31 year-end for which the 2007 year included a portion of 2006. Year-to-year variation reflects volatility in the relationship between the resource allowance and Crown royalties. See the technical paper “Improving the Income Taxation of the Resource Sector in Canada” (Department of Finance, March 2003) for further details.
26 The general corporate income tax rate was extended to resource income over a five-year phase-in period beginning in 2003. Although the rate difference between the general and resource rates no longer existed as of 2007, there were still costs in that year associated with 2006 rates for companies with off-calendar taxation years, for which the 2007 tax year included some income earned in 2006.
27 The Alberta government announced on September 21, 2006 that the Alberta Royalty Tax Credit (ARTC) program would be discontinued effective January 1, 2007. Although the ARTC no longer existed as of 2007, there were still costs in that year associated with the measure for companies with off-calendar taxation years, for which the 2007 tax year included some royalty credits earned in 2006.
28 The negative tax expenditure for 2006 and subsequent years reflects a decline in the volume of reclassifications in respect of Canadian Development Expenses transferred to corporations investing in flow-through shares. For more information about this measure, please refer to the “What’s New in the 2008 Report” section of the 2008 Tax Expenditures and Evaluations publication (available on the Department of Finance website at www.fin.gc.ca).
29 For confidentiality reasons, estimates and projections for the 2006 to 2009 period are not published.30 The amount of this tax expenditure can fluctuate significantly from year to year depending primarily upon the level of
construction activity.31 Estimates and projections vary from those in prior reports due to a methodological change made to improve their accuracy.32 Variations from last year’s report reflect the availability of new data as well as the impact of the current economic climate.33 Refundable tax provisions of the corporate income tax system provide some integration of the corporate and personal income
tax regimes. For more information about these measures, see the publication Tax Expenditures: Notes to the Estimates/Projections (published in 2004 and available on the Department of Finance website at www.fin.gc.ca).
34 This item includes the additional 6 2⁄3 per cent refundable tax on investment income as well as the Part I tax paid on investment income in excess of the benchmark rate.
35 The large values in 2008 and 2009 reflect, for the most part, the capital losses projected in these years resulting from declines in the stock market.
36 The large values in 2008 and 2009 reflect, for the most part, the non-capital losses projected in these years resulting from the economic downturn.
37 Budget 2007 increased to 80 per cent from 50 per cent, over five years, the deductible portion of the cost of food and beverages consumed by long-haul truck drivers during certain long-haul trips. This measure also applies to employers that pay, or reimburse, such costs incurred by long-haul truck drivers that they employ. This measure applies to eligible expenses incurred on or after March 19, 2007.
38 Estimates and projections vary from those in prior reports due to a methodological change to improve their accuracy.

29
Table 3GST Tax Expenditures*
Estimates1,2 Projections2
2004 2005 20063 20073 20083 2009
($ millions)
Aboriginal Self-GovernmentRefunds for Aboriginal self-government4 S S S S S S
BusinessExemption for domestic financial services5 n.a. n.a. n.a. n.a. n.a. n.a.Exemption for ferry, road and bridge tolls6 15 15 10 15 10 10Exemption and rebate for legal aid services 25 25 30 30 25 25Non-taxability of certain importations7 n.a. n.a. n.a. n.a. n.a. n.a.Rebates for foreign visitors8 75 80 70 20 n.a. n.a.Foreign Convention and Tour Incentive Program8 n.a. n.a. n.a. 10 10 10Small suppliers’ threshold 185 200 195 190 165 170Zero-rating of high-cost agricultural and
fishing equipment9 S S S S S SZero-rating of certain purchases made
by exporters S S S S S S
Charities and Non-Profit OrganizationsExemption for certain supplies made by
non-profit organizations n.a. n.a. n.a. n.a. n.a. n.a.Rebates for registered charities 285 295 305 290 275 290Rebates for non-profit organizations 75 75 75 65 65 70
EducationExemption for education services (tuition)6 520 525 515 500 435 435Rebates for book purchases made by qualifying
public institutions 30 30 30 30 30 30Rebates for colleges 80 80 80 85 75 75Rebates for schools 400 425 430 415 385 405Rebates for universities 260 270 260 245 230 245
Health CareExemption for health care services6 520 660 660 665 580 600Rebates for hospitals 465 515 515 525 465 490Zero-rating of medical devices6 175 180 180 185 160 160Zero-rating of prescription drugs6 645 680 690 695 605 610
HouseholdsExemption for child care and personal services6 140 140 135 125 110 115GST/HST Credit10 3,330 3,450 3,510 3,575 3,615 3,680Zero-rating of basic groceries6 3,795 3,895 3,755 3,625 3,165 3,175
HousingExemption for sales of used residential housing
and other personal-use real property n.a. n.a. n.a. n.a. n.a. n.a.Exemption for residential rent (long-term)6 1,335 1,440 1,370 1,340 1,175 1,120Rebates for new housing 915 955 845 720 570 515Rebates for new residential rental property 55 55 50 55 55 50* The elimination of a tax expenditure would not necessarily yield the full tax revenues shown in the table. See the publication Tax Expenditures:
Notes to the Estimates/Projections (published in 2004 and available on the Department of Finance website at www.fin.gc.ca) for a discussion of the reasons for this.

Tax Expenditures and Evaluations 2009
30
Table 3GST Tax Expenditures* (cont’d)
Estimates1,2 Projections2
2004 2005 20063 20073 20083 2009
($ millions)
MunicipalitiesExemption for municipal transit6 160 165 160 160 140 140Exemption for water and basic garbage
collection services6 235 230 235 240 210 210Rebates for municipalities11 1,440 1,730 1,805 1,805 1,615 1,705
Memorandum ItemsRecognition of Expenses Incurred to
Earn IncomeRebates to employees and partners 115 115 100 90 80 80
OtherExemption for quick method accounting 230 245 240 235 205 195Partial input tax credits for meals and
entertainment expenses12 135 135 140 135 120 125
Notes: 1 Unless otherwise indicated in the footnotes, estimates are based on administrative data from the Canada Revenue Agency or
data from Statistics Canada. 2 Unless otherwise indicated in the footnotes, changes in the estimates and projections from those in last year’s report, as well as
variations from year to year, result from changes in the explanatory economic variables upon which the estimates and projections are based. These changes and variations also reflect the availability of new data and improvements to the methodology used to derive the estimates and projections.
3 The Goods and Services Tax rate was lowered from 7 per cent to 6 per cent effective July 1, 2006, and to 5 per cent effective January 1, 2008. The 2006 rate reduction lowers the tax expenditures for 2006 and 2007, and the 2008 rate reduction reduces them further for 2008 and 2009.
4 These refunds are paid to Aboriginal governments that have an agreement providing for a Goods and Services Tax/Harmonized Sales Tax (GST/HST) refund for goods and services acquired for self-government activities.
5 Vendors are not entitled to claim input tax credits to recover the GST/HST paid on inputs to exempt supplies. Final consumers and businesses do not pay the direct sales tax on exempt goods and services.
6 The National Sales Tax Model used to generate the estimates and projections is based on the 2005 national input-output tables from Statistics Canada and the latest release of the National Income and Expenditure Accounts.
7 Certain importations are tax-free including, for example, duty-free personal importations by Canadian travellers. 8 The Visitor Rebate Program (VRP) was replaced by the Foreign Convention and Tour Incentive Program effective April 1, 2007.
Estimates for the VRP do not include amounts credited by suppliers at the point of sale. 9 A large range of generally high-cost agricultural and fishing equipment is zero-rated to reduce cash-flow problems for farmers
and fishers.10 Estimates are based on personal income tax data. The GST rate reductions do not affect the credit.11 The rebate rate for municipalities increased from 57.14 per cent to 100 per cent effective February 1, 2004.12 Based on estimated expense claims reported for the personal and corporate income tax systems. The estimate for 2007
and projection include the increased deductibility of meal expenses on certain trips by long-haul truck drivers. See footnote 37 in the corporate income tax table for additional details.

Part 2 research rePort


an InternatIonal comParIson of tax assIstance for Investment In research and develoPment


35
Introduction Spending on research and development (R&D) is widely acknowledged as providing benefits not only to the firm undertaking the activity but also to the economy at large in the form of lower prices, improved products and access to new production technologies.1 In recognition of these spillover effects, it is common practice for governments to provide assistance to firms undertaking investment in R&D. This paper provides estimates of tax assistance for R&D investment by large and small firms, as measured by marginal effective tax rates (METRs), for the 30 member countries of the Organisation for Economic Co-operation and Development (OECD) and for 6 key emerging and transition economies. In order to provide a clear indication of how tax incentives affect the overall cost of R&D, this paper also presents estimates of the subsidy rate, defined as the percentage decline in the cost of R&D arising from tax incentives. The subsidy rates are developed through a straightforward transformation of the METRs. International rankings of tax support for R&D based on subsidy rates are therefore not substantially different from those based on METRs.
All countries in the comparison group provide tax assistance for investment in R&D in the form of generous tax depreciation allowances, which in many cases exceed the amount invested, and a third of the countries provide investment tax credits (ITCs). Eight countries in the comparison group, including Canada, provide special assistance to small firms for investment in R&D, primarily through higher ITC rates. Taking into consideration both large and small firms, Canada has the third most generous R&D tax regime in the comparison group, after France and Spain.
As discussed below, a number of simplifying assumptions are required in order to obtain quantitative estimates of tax assistance, and the estimates should therefore be interpreted with caution. For example, common assumptions about how the R&D is financed, the ability to claim credits and deductions as they are earned and the rate of return on the investment are made in order to focus attention on differences in tax parameters affecting R&D. In addition, tax provisions affecting R&D are in some cases highly complex, making it difficult to summarize them in terms of credit and tax depreciation rates that can be quantified in an economic model.
Finally, it is worth noting that governments provide support for R&D through a variety of channels, such as grants and loans as well as procurement and patent policies, not just through the tax system. As a result, the comparison made in this paper does not provide a complete picture of relative overall levels of support for investment in R&D.
1 For additional details on spillover effects, see Industry Canada, Mobilizing Science and Technology to Canada’s Advantage (2007), available at www.ic.gc.ca/eic/site/ic1.nsf/eng/h_00856.html.

Tax Expenditures and Evaluations 2009
36
Methodology, Assumptions and CaveatsA marginal effective tax rate is a comprehensive indicator of the tax burden on new investment. It combines in a single measure the statutory tax rate that applies to corporate income, factors that affect the corporate tax base (e.g. capital cost allowances and interest deductibility), along with ITCs and profit-insensitive levies such as capital taxes and sales taxes on investment goods.2 A METR measures the part of the return on an investment required to pay corporate-level taxes, expressed as a percentage of the total return to investors. For example, if the gross-of-tax return to shareholders is 6% and if the corporate tax system reduces this return to 4%, the METR would be 33%.3
In addition to tax parameters, calculation of METRs requires assumptions about the financial structure of firms, the rate of return on debt and equity, and the rate of inflation, all of which are used to calculate the financial cost of capital. The estimates are also sensitive to the capital assets—scientific equipment, buildings and inventories—used by firms to undertake R&D and how quickly they depreciate. In order to focus on differences in tax systems, these “economic” assumptions are generally held constant for all countries and types of firms included in the international comparison.4 As a result, the estimates presented in this paper indicate how the Canadian METR and subsidy rate would change if the tax systems of other countries were applied in Canada. The economic assumptions and parameters underlying the calculation of the R&D METRs are provided in Annex 1.
A central premise underlying the calculation of R&D METRs is that all spending on R&D, including salaries and the cost of materials, is undertaken to create an asset that is expected to generate a stream of revenue over time in the same way that investment in tangible capital generates future income.5 With this as a benchmark, all spending on R&D is capitalized, and immediate deductibility of current expenditures, which is permitted in almost all countries in the comparison group, constitutes tax assistance and therefore puts downward pressure on METRs.
2 A more complete review of the methodology is presented in Department of Finance Canada, Tax Expenditures and Evaluations (2005), available at www.fin.gc.ca/taxexp-depfisc/2005/taxexp05_4-eng.asp#Marginal.
3 Calculated as (6-4)/6. The return to investors is net of all expenses including depreciation.4 The most important exception is that the rates of return on debt and equity for large firms are determined using
data from Group of Seven (G7) countries and for small firms using country-specific tax parameters (see Annex 1 for additional details).
5 There is strong theoretical support for capitalizing R&D expenditure. See, for example, Corrado, Hulten and Sichel (2005).

37
As in the case of METR models generally, two working assumptions are made to keep the methodology tractable:
1. The METRs are calculated for profitable firms that can claim credits and deductions as they are earned.
To the extent that firms do not have sufficient income to immediately use all credits and deductions, this assumption overstates the amount of tax assistance (i.e. reduces the METRs) since any delay in claiming credits and deductions makes them less valuable to firms. While it would be possible to calculate METRs to reflect typical profit profiles and to calculate a weighted average METR for profitable and non-profitable firms, this approach would shift attention from general tax parameters to loss offset provisions. This shift could affect international comparisons, likely to Canada’s advantage given our generous carry-forward and carry-back provisions for losses and credits.6 In addition, startups, which are usually small-scale, are less likely to be able to make immediate use of credits and deductions than other firms. As a result, the methodology used could overstate the amount of tax support provided to small firms relative to large firms. Further, since tax assistance is refundable to some extent in four countries, including Canada, the overstatement will not be uniform across all countries.
2. Investments in R&D are assumed to earn the normal risk-adjusted rate of return.
Returns in excess of the normal rate are taxed at the statutory rate, so to the extent that investment in R&D earns economic rents, the METR methodology will understate the effective tax rate on R&D investment. Further, since statutory rates vary across countries, this assumption could affect the rankings of tax assistance for R&D: in the presence of rents, countries with relatively low statutory tax rates, such as Canada, would have a lower effective tax rate than countries with relatively high statutory tax rates.
6 Canada allows losses and R&D tax credits that cannot be used in the current year to be carried back 3 years and carried forward 20 years.

Tax Expenditures and Evaluations 2009
38
An Overview of Tax Support for R&DThis paper includes all legislated corporate income tax measures provided by national and subnational governments that will be in force in 2012.7 All countries in the comparison group provide tax assistance for investment in R&D through highly favourable tax depreciation allowances and 12 countries offer ITCs as well. These measures, along with corporate income tax rates, are the key tax parameters used to calculate METRs. This section provides an overview of these measures; additional details are provided in Annex 2. A detailed description of Canada’s tax incentives for investment in R&D is provided in Annex 3.
Tax Deductions for R&D ExpendituresAll countries except Korea and Russia allow current expenditures to be deducted in the year they are incurred and 10 countries provide “super” depreciation on current expenses ranging from 200% to 128%. In Greece and Austria, firms qualify for additional depreciation on expenses that exceed the average level of spending in the preceding two and three years, respectively. In addition to providing super depreciation on current spending, Australia provides a depreciation allowance on incremental spending. The United Kingdom stands out in providing a higher rate of tax depreciation for small firms than for large firms. Immediate deductibility of current expenditures is more valuable to small firms since this spending represents a higher share of their spending on R&D.
Fourteen countries, including Canada, allow immediate deductibility of spending on scientific equipment, while Hungary, Singapore, China, Austria and Australia allow super depreciation ranging from 200% to 118% for these expenses. In most of the remaining countries, tax depreciation for equipment equals or exceeds economic depreciation. In contrast, tax depreciation allowances for buildings fall below economic depreciation in 21 countries. Ireland and India are unusual in permitting immediate deductibility of investment in buildings. India also allows double deductibility of interest expenses.
7 There are, nevertheless, several special cases to consider. The ITC in the United States is included despite being a temporary measure since it has been renewed every year but one since its inception in 1981. In contrast, Portugal’s ITC, which is also temporary and currently scheduled to expire in 2010, is not included because it has been extended twice but allowed to lapse once since it was first introduced in 1997. In its 2009 budget, Australia announced its intention to replace its “super” depreciation on current expenses and its depreciation allowance on incremental expenses with a more generous ITC, but will undertake a consultation process before passing legislation to implement changes, so this measure has not been included.

39
Investment Tax CreditsThe amount of assistance provided to R&D investment by an ITC depends on the rate and the design features of the tax credit. All 128 countries offering credits impose eligibility restrictions that reduce the effective ITC rate below the statutory ITC rate. For example, all countries except Ireland exclude investment in buildings from the base for ITCs. In the Netherlands, only labour expenses are eligible for the credit, while in Hungary eligibility is restricted to investment in scientific equipment. Ireland is the only country that provides an ITC on all types of investment in R&D.
In addition, the amount of eligible spending may be capped or the ITC may apply only to spending above a threshold value, such as some past level of spending. Restrictions such as these determine how the ITC rate affects the marginal and the average cost of investing in R&D (Box 1). This is an important distinction, since changes in marginal cost, not average cost, affect the decision as to how much to invest. In what follows, the term “marginal effective ITC rate” refers to the ITC rate adjusted for eligibility limitations as well as for caps and thresholds that determine the impact on the marginal cost of investing in R&D.
The marginal effective ITC rates used in the METR calculation are shown in Table 1. The most generous marginal effective ITC rates are offered by Spain and Canada, while Ireland and France offer relatively generous credits as well. In 6 of the 12 countries, the ITCs are deducted from the base for tax depreciation allowances, which limits tax deductions to the amount of private spending undertaken.
Although only seven countries9 have higher statutory ITC rates for small than for large firms, the marginal effective ITC rates are higher for small firms in all countries except Ireland. In many cases, the difference reflects the exclusion of buildings from the ITC base: buildings are a smaller share of spending by small firms (see Annex 1), so for a given statutory ITC rate the effective ITC rate is slightly higher for small firms.10 Ireland is an exception since its ITC applies to all spending on R&D, including buildings. Canada’s combined federal-provincial marginal effective ITC rate for small firms is the highest in both absolute terms and relative to the credit for large firms.
8 Excluding Austria, which provides a refundable tax credit for non-profitable firms only as an alternative to super depreciation.
9 These are: Canada, France, Italy, Japan, the Netherlands, Norway and the US, where six states provide higher ITCs for small firms. In addition, the UK has a higher super tax depreciation allowance for small firms.
10 Spain has an additional credit for labour expenses, which is more valuable for small firms given their larger share of labour expenses.

Tax Expenditures and Evaluations 2009
Box 1Calculating Marginal Effective Investment Tax Credit RatesThis box describes in general terms how the marginal effective ITC rates used in this paper were calculated, and compares them to average effective rates.
Three countries—Spain, the United States and Ireland—provide ITCs based on spending that exceeds a threshold level. These “incremental” credits are implemented with the intention of raising the marginal effective ITC rate above the average rate, in order to increase the impact on investment per dollar of forgone revenue. In Spain, however, the base is defined as a two-year rolling average of past spending, so investment in the current period raises the base in subsequent years, which substantially reduces the incentive effect of the ITC (see Eisner, Albert and Sullivan (1984) for a detailed explanation). As a result, the marginal effective ITC rate falls well below the statutory rate, and will only be above the average effective ITC rate if R&D spending is growing relatively slowly. This analysis also applies to the additional depreciation deductions provided by Australia, Austria and Greece, which are available to firms that increase spending relative to a past average.
In contrast, the base for the US regular incremental credit is determined by multiplying R&D intensity (the share of R&D spending in total spending) in the base year by a moving average of sales. In this case, the base is only slightly affected by increased investment in R&D, so the marginal effective ITC rate is approximately equal to the statutory rate (see Watson (1996) and Hall (2008) for additional details). But since non-incremental spending receives a zero credit, the marginal effective rate exceeds the average effective ITC rate. Ireland provides a credit for R&D investment in excess of the level in a base year, defined as the first year R&D investments were made or 2003, whichever occurs later. In this case, the marginal ITC rate is lower than the statutory ITC rate because investment by some firms will fall below the level in the base year, making them ineligible for the credit. But since spending below the threshold does not receive a credit, the marginal effective ITC rate will nevertheless be greater than the average effective ITC rate.
Seven countries in the comparison group have ITC rates that vary by size of firm. In the Netherlands the threshold is set low enough that small firms receive a variable ITC rate while in Norway a cap on the credit affects some small firms. In the remaining countries—Canada, France, Italy, Japan and the US—the thresholds are set such that the special rates apply to both small and medium-sized firms. Since the definition of medium-sized firms varies more than the definition of small firms, this paper combines medium-sized firms and large firms into a single group of larger firms. Larger firms in these countries may therefore receive different ITCs, depending on their size. For example, in France a firm spending €150 million on R&D gets a 30% ITC on the first €100 million and 5% on the remaining €50 million. As a result, firms face a marginal ITC rate of either 30% or 5%.
The marginal effective ITC rates for these seven countries are weighted averages of the two rates available to firms, with the weights being the share of R&D conducted by firms spending less than and more than the threshold. Since the marginal rate declines as spending increases, the average effective ITC rate will be higher than the weighted average marginal effective rate. The difference is small in Canada because the higher ITC rate applies to a relatively small number of medium-sized firms that are affected by the phase-out of the more generous small business credit.
40

41
Table 1Marginal Effective Investment Tax Credit Rates (%)1
Country Large SmallCombined
Large/Small
Spain 31.7 34.9 32.2Canada 24.4 44.3 27.8
Federal only 19.2 34.6 21.8France 23.3 29.6 24.4Ireland 22.0 21.8 22.0Korea 13.5 14.7 13.7United States 11.1 12.8 11.4
Federal only 8.0 8.7 8.1Norway 9.3 15.8 10.4Japan 9.3 11.9 9.7Netherlands 7.2 9.2 7.5Italy 2.0 14.3 4.1Belgium 2.7 2.8 2.7Hungary 0.7 0.8 0.71 Ranked by the level of the combined large/small rate. See Box 1 for a discussion of marginal effective ITC rates.
Special Corporate Income Tax RatesEleven countries in the comparison group have a special rate of corporate income tax (CIT) for small firms. But these preferential rates generally have such low taxable income and/or capital thresholds that they are applicable only to a limited number of small firms, as defined in this paper.11 As a result, a low CIT rate is used in the METR calculations only for Canada, Korea, Spain and the UK, which have higher thresholds for their special rates. These lower CIT rates have a counterintuitive effect on the METR: decreases in the CIT rate cause small increases in the METR. In the presence of generous tax depreciation allowances, the normally harmful effect of higher taxes on the return generated by investment in R&D is dominated by the increased value of deductions, causing the effective tax rate to decline slightly.12
11 The OECD gathers data on R&D spending by firms classified by the number of employees. This paper defines small firms as those having less than 50 employees for all countries except Canada, where small firms are defined as those eligible for the 35% federal credit only (see Annex 3 for details on the federal scientific research and experimental development tax incentive program). Firms in the phase-out range of the 35% credit are defined as medium-sized firms but are grouped with large firms in this paper. Note that defining small firms in terms of eligibility for the 35% federal credit rather than in terms of employment has only a minor impact on the share of small firms in total R&D spending.
12 For example, the Canadian METR for small firms falls from -296.6 to -298.4 when the higher large firm CIT rate is used in the calculation.

Tax Expenditures and Evaluations 2009
42
Refundability ProvisionsAs noted above, the METR methodology assumes that firms can fully use depreciation allowances and ITCs as they are earned, which overstates the amount of tax assistance. The international comparisons implicitly assume that the overstatement is the same for all countries. In four countries, however, tax assistance is refundable, so the overstatement will not be uniform. Norway provides a refundable ITC for both large and small firms, although the cap on eligible spending is relatively low. Tax assistance for R&D is partially refundable in three countries. In France, the ITC is refundable after three years of carry-forward, although growing small and medium-sized firms can benefit from immediate refundability.13 Canada’s federal ITC on current spending by small firms is also refundable without restrictions up to the expenditure limit, while ITCs on eligible capital expenditures and current expenditures above the expenditure limit are refundable at a 40% rate.14 In the UK, two-thirds of the super tax depreciation allowance available to small and medium-sized firms is refundable, subject to an additional cap.
Marginal Effective Tax Rates for Large and Small FirmsAn international comparison of METRs for large and small firms is shown in Chart 1, along with the combined rate.15 (For ease of presentation, the METRs have been indexed on the value of the most generous level of overall assistance. As a result, the most generous level of overall assistance has been assigned a value of -100, with the negative value indicating that the tax system is subsidizing investment in R&D.) Considering both large and small firms, Canada has the third most generous level of tax assistance for R&D in the comparison group of countries, behind France and Spain. India and Brazil, ranked fourth and fifth, provide levels of assistance that are similar to Canada. Four of the ten top-ranked countries offer generous ITCs. Brazil, the Czech Republic, Hungary, India, Turkey and the UK are in the top ten because of generous tax depreciation rates, the benefit of which is enhanced by relatively high CIT rates in Brazil and India.
The list of the ten most generous countries does not change when only large firms are considered. Canada’s ranking does, however, fall to fifth since India and Brazil provide more generous support for large firms undertaking R&D than Canada.16 When considering only small firms, the list of top ten countries differs only in that Norway replaces the Czech Republic. Canada has the most generous tax assistance provisions for small firms.
The METRs for small firms generally indicate a greater level of tax assistance (that is, they become more negative) than for large firms. This outcome reflects higher ITC rates for small firms in some countries as well as the differences in the composition of spending, such as a smaller share for capital spending, discussed above.
13 In 2009, refundability is available to all firms, not just to growing small and medium-sized firms.14 Some provincial ITCs are refundable for both large and small firms. See Annex 3.15 The METRs for large and small firms were combined for all countries using the OECD average share of R&D spending
undertaken by small firms as defined in footnote 11.16 An international comparison prepared in 2007 showed that Canada had the third most generous level of tax assistance
for large firms undertaking R&D. Since then, enriched tax assistance in France, along with a modelling change affecting India, have changed this ranking. See John Lester, André Patry and Donald Adéa, “An International Comparison of Marginal Effective Tax Rates on Investment in R&D by Large Firms,” Department of Finance Canada Working Paper 2007-07.

43
Chart 1Index of METRs for Investment in R&Dper cent
Fran
ce
Can
ada
Spa
in-150
-140
-130
-120
-110
-100
-90
-80
-70
-60
-50
-40
-30
-20
-10
0
Indi
a
Bra
zil
Hun
gary
Irela
nd
Turk
ey
Cze
ch R
epub
lic
Uni
ted
Kin
gdom
Japa
n
Nor
way
Chi
na
Aus
tral
ia
Kor
ea
Sin
gapo
re
Bel
gium
Aus
tria
Net
herla
nds
Uni
ted
Sta
tes
Italy
Pol
and
Gre
ece
Finl
and
Mex
ico
New
Zea
land
Luxe
mbo
urg
Den
mar
k
Sw
eden
Slo
vak
Rep
ublic
Por
tuga
l
Hon
g K
ong
Ger
man
y
Icel
and
Sw
itzer
land
Rus
sian
Fed
erat
ion
Small �rms (triangles)
Large �rms (circles)
Combined rates (bars)

Tax Expenditures and Evaluations 2009
44
Subsidy Rates on Investment in R&DMETRs measure the change in the required rate of return on an investment caused by corporate-level taxes. More precisely, for investment in R&D capital, the METR is the “wedge” between gross-of-tax and net-of-tax returns expressed as a percentage of the net-of-tax return to investors.17 The tax system subsidizes investment in R&D in almost all countries, so the tax wedge is generally negative and is typically large relative to the net return to investors. For example, Canada’s METR for large firms is -147%, which means that R&D tax subsidies amount to about 1.5 times the net-of-tax return to investors.
An alternative way to measure tax assistance is to calculate the subsidy rate, defined as the percentage reduction in the cost18 of R&D capital arising from tax incentives. Tax subsidy rates are developed through a straightforward transformation of the METRs, so international rankings of tax support for R&D are not substantially affected.19 The subsidy rates are a useful supplementary measure of tax assistance, primarily because they provide a more easily understood indication than METRs of how tax incentives affect the cost of R&D. For example, Canada’s METR for large firms is equivalent to a 26.9% subsidy rate on the cost of R&D capital.
While such an extension is beyond the scope of this paper, subsidy rates have the further advantage that they can be augmented to include other forms of government assistance, such as grants, that also reduce the cost of R&D capital. A comprehensive measure of government assistance to R&D is of interest in itself and would facilitate empirical analysis of the contribution of government assistance to international variations in R&D intensity. Such an indicator would also make it easier to assess the contribution of individual elements of support to increases in R&D intensity.
Subsidy rates are shown in Table 2 for the 36 countries in the comparison group. The overall subsidy rates range from 40.2% of the cost of R&D in France to near zero in the Russian Federation and Switzerland.
17 As discussed earlier, the return measured gross of corporate-level taxes is used in the denominator of the METR for non-R&D investments. For R&D assets, however, substantial tax preferences mean that the gross-of-tax return can have a value close to or equal to zero, which would cause the METR to become extremely large or become undefined. Using the net return in the denominator avoids this problem.
18 The cost of investing in R&D is defined as the opportunity cost of the funds invested plus a provision for depreciation, which is usually described as the “user cost” of R&D capital. The subsidy rate is the change in the user cost arising from tax provisions (the tax wedge) divided by the user cost net of corporate-level taxes.
19 The rankings for large firms do not change, but the rankings for small firms do change slightly. In particular, France replaces Canada as the jurisdiction with the most generous tax assistance for small firms when the assistance is measured by the subsidy rate. The rankings for small firms change because country-specific tax parameters are used to calculate the net-of-tax return to investors, and variations in the net return have different impacts on subsidy rates and on the METRs. The net return to investors in large firms is assumed to be the same for all countries, so the rankings are not affected.

45
Table 2Subsidy Rates on Investment in R&D (%)
Country Large Firms Small FirmsCombined
Large/Small Combined Ranking France 38.6 47.6 40.2 1Spain 34.1 36.9 34.5 2Canada 26.9 46.0 30.2 3India 29.3 31.7 29.7 4Brazil 28.9 33.0 29.6 5Hungary 26.1 26.8 26.2 6Ireland 26.2 26.1 26.2 7Turkey 23.5 26.3 24.0 8Czech Republic 22.1 24.7 22.5 9United Kingdom 21.1 22.8 21.4 10Japan 18.0 23.2 18.9 11China 17.4 18.8 17.7 12Norway 15.9 24.6 17.4 13Australia 14.2 15.5 14.4 14Singapore 12.6 12.9 12.7 15Korea 12.1 14.2 12.4 16Belgium 11.3 9.6 11.0 17Austria 10.8 12.0 11.0 18Netherlands 10.0 12.2 10.3 19United States 9.1 10.0 9.2 20Italy 4.9 17.5 7.0 21Greece 3.2 4.1 3.4 22Finland 3.1 3.4 3.1 23Mexico 2.7 3.3 2.8 24New Zealand 2.4 3.7 2.6 25Luxembourg 2.3 3.5 2.5 26Denmark 2.3 3.0 2.4 27Sweden 2.1 3.2 2.3 28Slovak Republic 2.2 2.3 2.2 29Germany 1.6 3.3 1.9 30Hong Kong 1.9 2.0 1.9 31Portugal 1.5 3.3 1.8 32Poland 1.5 2.3 1.6 33Iceland 1.3 1.7 1.3 34Switzerland 0.4 2.6 0.8 35Russian Federation 0.2 0.6 0.3 36Unweighted average 12.3 14.9 12.7Median 10.4 12.1 10.7

Tax Expenditures and Evaluations 2009
46
Comparison With the B-IndexChart 2 compares the overall subsidy rates calculated using the METR framework and the B-Index methodology, which is used by the OECD in its international comparisons of tax assistance for R&D.20 The B-Index methodology measures the after-tax cost of investing in R&D taking into consideration ITCs and depreciation allowances. The B-Index differs from the METR framework in three respects:
• TheB-IndexdoesnotincludefinancingcostsinthecostofinvestinginR&D.
• TheB-Indexdoesnotincludetaxesotherthancorporateincometaxes(e.g.capitaltaxesandsales taxes on capital goods are excluded).
• TheB-IndexiscalculatedassumingthatthebenchmarktaxsystemallowsallexpendituresonR&D to be expensed rather than requiring them to be capitalized and depreciated as in the METR framework.
Leaving out financing costs and all taxes other than corporate income taxes increases the level of tax assistance for R&D in the B-Index. In contrast, adopting immediate deductibility of all spending on R&D as the benchmark reduces the level of tax assistance portrayed by the B-Index. For example, expensing of wages constitutes tax assistance in the METR framework but not in the B-Index. As can be seen in Chart 2, the latter effect dominates, so the B-Index subsidy rate is systematically lower than its METR-based counterpart, by 3.6 percentage points on average, or about 30% of the average METR-based subsidy rate. Note that R&D assets such as scientific equipment and buildings cannot always be expensed as assumed in the B-Index, so that the B-Index subsidy rate is negative in countries that do not provide other incentives for R&D. By contrast, in the METR framework the impact of tax depreciation depends on whether it is more or less generous than the economic depreciation rate.
Chart 3 shows the international rankings of subsidy rates obtained using the METR and B-Index frameworks. Most of the changes in moving from the METR to B-Index framework occur for countries providing less than the median level of support to R&D, where the estimates for the B-Index are tightly grouped. Canada’s ranking does not change when tax assistance for R&D is measured using the B-Index.
20 The B-Index was first presented in McFetridge and Warda (1983).

47
Chart 2Subsidy Rates on R&D Investment: METR Framework and B-Index(Combined Large and Small Firms)per cent
Fran
ce
Can
ada
Spa
in
Indi
a
Bra
zil
Hun
gary
Irela
nd
Turk
ey
Cze
ch R
epub
lic
Uni
ted
Kin
gdom
Japa
n
Nor
way
Chi
na
Aus
tral
ia
Kor
ea
Sin
gapo
re
Bel
gium
Aus
tria
Net
herla
nds
Uni
ted
Sta
tes
Italy
Gre
ece
Finl
and
Mex
ico
New
Zea
land
Luxe
mbo
urg
Den
mar
k
Sw
eden
Slo
vak
Rep
ublic
Por
tuga
l
Pol
and
Hon
g K
ong
Ger
man
y
Icel
and
Sw
itzer
land
Rus
sian
Fed
erat
ion
-5
0
5
10
15
20
25
30
35
40
45
METR subsidy rate (column height)
B-Index subsidy rate (dark component)
Chart 3Ranking of Subsidy Rates: METR Framework and B-Index(Combined Large and Small Firms)rank
Fran
ce
Can
ada
Spa
in
Indi
a
Bra
zil
Hun
gary
Irela
nd
Turk
ey
Cze
ch R
epub
lic
Uni
ted
Kin
gdom
Japa
n
Nor
way
Chi
na
Aus
tral
ia
Kor
ea
Sin
gapo
re
Bel
gium
Aus
tria
Net
herla
nds
Uni
ted
Sta
tes
Italy
Pol
and
Gre
ece
Finl
and
Mex
ico
New
Zea
land
Luxe
mbo
urg
Den
mar
k
Sw
eden
Slo
vak
Rep
ublic
Por
tuga
l
Hon
g K
ong
Ger
man
y
Icel
and
Sw
itzer
land
Rus
sian
Fed
erat
ion
02468
1012141618202224262830323436
METR framework
B-Index

Tax Expenditures and Evaluations 2009
48
ConclusionThis paper has presented estimates of tax assistance for investment in R&D by large and small firms as measured by METRs and as measured by subsidy rates calculated using the METR and B-Index frameworks. All 36 countries included in this paper provide tax assistance for investment in R&D through generous tax depreciation allowances and 12 countries provide ITCs as well. This paper has transformed statutory ITC rates into relevant indicators of the incentive to invest in R&D by adjusting them for the impact of eligibility criteria as well as for the impact of caps and thresholds. The METRs calculated for all countries are negative, indicating that investment in R&D is supported by the tax system. Eight countries, including Canada, provide more favourable tax treatment to small firms than large firms undertaking R&D. Considering both small and large firms, Canada has the third most generous R&D tax regime in the comparison group of countries, behind France and Spain. The METR methodology assumes firms can take full advantage of R&D tax incentives without refundability; this downplays the amount of assistance available in Canada and three other countries that have refundability provisions.
Subsidy rates—the percentage reduction in the cost of R&D investment—are a useful supplementary measure of tax assistance, primarily because they provide a more easily understood measure of how tax incentives affect the cost of R&D. For example, overall subsidy rates calculated using the METR framework range from near zero to 40% of the cost of investing in R&D. Since these subsidy rates are developed from the same analytical framework as the METRs, international rankings are not substantially affected. The B-Index, which is the most commonly used indicator for making international comparisons, shows a substantially lower level of tax assistance for R&D largely because the methodology adopts a benchmark tax system in which R&D spending is expensed rather than capitalized as in the METR framework. Nevertheless, using the B-Index methodology does not have a large impact on the international rankings of tax assistance for R&D.
Tax assistance is only one of several ways governments provide support to investment in R&D. A number of other factors, such as the amount of patent protection provided as well as the quality of labour and public infrastructure, affect how much and in what location firms decide to invest in R&D. The tax assistance measures presented in this paper therefore provide a useful but incomplete comparison of the incentive to invest in R&D.

49
Annex 1—Economic ParametersThis annex presents the economic parameters used in the METR model. They comprise the return required by suppliers of financial capital, the financial cost of capital to firms, inflation, debt and equity shares in the financial structure of firms, economic depreciation rates and the weights used to aggregate the inputs used to create the R&D asset. Except for the cost of finance, the economic parameters used in the model refer to the Canadian situation. Only the tax parameters are country-specific. As a result, the estimates presented in this paper indicate what would happen to the METR and the user cost of R&D if the tax systems of other countries were applied in Canada.
Economic Parameters (%)
Share in Total Expenditures1 Large Firms Small Firms Depreciation Rate2
Scientific equipment 7.3 1.3 19.3Buildings 6.6 1.2 6.3Salaries 51.2 54.2 15Overhead 25.1 34.2 15Intermediate inputs 9.7 9.1 15
Total 100 100 14.73
Financing ParametersLarge Firms Small Firms
Nominal return to investors 5.30 5.15Risk-free interest rate4 5.76 5.76Risk-adjusted equity return5 4.99 4.24
Real return to investors 3.30 3.15Nominal cost of finance to firms 4.66 4.52Inflation rate 2.00 2.00
Debt/(Debt plus equity)6 40.00 40.001 Calculated from data supplied by the Canada Revenue Agency.2 Sources: Statistics Canada for physical capital and Hall (2007) for current spending.3 Weighted average rate for large firms. The rate for small firms is 14.9%.4 Average return on 10-year government bonds in G7 countries.5 Calculated assuming that net of personal tax returns on debt and equity are equal. Average personal income tax parameters in the G7 countries are
used for large firms and country-specific tax parameters are used for small firms.6 Ten-year average of the economy-wide debt ratio in Canada.

Tax Expenditures and Evaluations 2009
50
Annex 2—Summary of R&D Tax Provisions by Country in 2012Table A2.1Medium and Large Firms1(%)
Statutory Corporate
Income Tax Rate
Investment Tax Credit2Present Value of Capital
Cost DeductionsCurrent Capital Combined
Marginal Effective
Taxable3/Refundable4
Current/Equipment/Buildings Combined Statutory
Marginal Effective Statutory
Marginal Effective
Group of Seven
Canada 26.1 – 26.5 – 11.8 24.4 Yes/No 100/100/57.7 97.2
Federal only 15 35/20 20.6 35/20 10.8 19.2 Yes/No 100/100/57.7 97.2
France5 34.4 30/5 25.0 30/5 13.1 23.3 No/Yes 100/100/50.6 96.5
Germany 30.2 – – – – – 100/64.9/39.6 93.4
Italy 31.4 30 2.3 – – 2.0 No/No 100/100/48.7 96.6
Japan6 39.5 12/8 10.0 12/8 5.2 9.3 No/No 100/85.1/37.8 94.8
United Kingdom7 28 – – – – – 155.6/100/46.2 144.3
United States 39.1 – 12.8 – 0.5 11.1 Yes/No 100/100/48.1 96.6
Federal only8 32.8 20/10/149 9.7 – – 8.0 Yes/No 100/100/48.1 96.6
Smaller Developed Economies
Australia 30 – – – – – 129.3/118.2/43.5 122.8
Austria 25 – – – – – 128.1/128.1/48.3 122.8
Belgium 33.99 5.3 3.1 – – 2.7 No/No 100/97.5/43.4 96.1
Denmark 25 – – – – – 100/83.3/62.2 96.3
Finland 26 – – – – – 100/100/80 98.7
Greece 25 – – – – – 103.3/91.2/72.9 100.4
Hong Kong 16.5 – – – – – 100/100/67.9 97.8
Iceland 15 – – – – – 100/80.3/44.6 94.9
Ireland 12.5 259 21.8 259/25 23.3 22.0 No/No 100/100/100 100
Luxembourg 29.63 – – – – – 100/82.4/41.9 94.9
Netherlands10 25.5 14.0 8.3 – – 7.2 Yes/No 100/100/56.3 97.1
New Zealand 30 – – – – – 100/85.3/41.8 95.1

51
Table A2.1Medium and Large Firms1(%) (cont’d)
Statutory Corporate
Income Tax Rate
Investment Tax Credit2Present Value of Capital
Cost Deductions
Current Capital Combined Marginal Effective
Taxable3/Refundable4
Current/ Equipment/ Buildings Combined Statutory
Marginal Effective Statutory
Marginal Effective
Norway 28 10.6 6.3 10.6 5.6 9.3 No/Yes 100/80.1/44.7 94.9
Singapore 18 – – – – – 150/150/97.5 146.5
Spain11 30 42/25+429 36.2 8.0 4.2 31.7 No/No 100/100/30.3 95.4
Sweden 28 – – – – – 100/82.6/36.8 94.5
Switzerland 21.2 – – – – – 100/88.7/43.9 95.5
Emerging Economies
Brazil 34 – – – – – 160/87.8/57.5 147.9
China 25 – – – – – 150/121.4/58.3 141.2
Czech Republic 19 – – – – – 200/100/61 183.5
Hungary 20 – – 10.0 4.8 0.7 Yes/No 200/200/35.7 189.2
India 33.99 – – – – – 150/100/100 143
Korea 22 15.0 15.0 10.0 4.8 13.5 Yes/No 87.5/83.9/34.3 83.7
Mexico 28 – – – – – 100/86/73.2 97.2
Poland 19 – – – – – 100/100/41.9 96.1
Portugal 26.5 – – – – – 100/91.9/45.3 95.8Russian
Federation 20 – – – – – 93.2/81.2/48.5 89.4
Slovak Republic 19 – – – – – 100/100/69.9 98
Turkey 20 – – – – – 200/90.9/79.9 184.1
Note: All US$ figures have been adjusted for 2009 purchasing power parities. 1 Includes all firms with more than 50 employees, except in Canada, where small firms are defined as those eligible for the 35% credit only. 2 The base for the investment tax credit (ITC) excludes buildings except for Ireland. 3 An ITC is described as taxable if firms are required to reduce the base for tax deductions by the amount of the credit received. 4 Medium-sized firms benefit from special refundability provisions in Canada and France. 5 Firms are eligible for the 30% ITC on the first US$109.2 million of eligible expenditures and 5% on the expenditures exceeding that amount. 6 The higher ITC rate is available to firms with less than US$858,226 in assets or with less than 1,000 employees. 7 Firms with less than 250 employees and less than US$61 million in assets can claim a 175% deduction on current expenditures. 8 Firms may choose between the regular incremental credit, which has a statutory rate of 20%, and the Alternative Simplified Credit, which has a
14% statutory rate that applies to a different base. The regular incremental credit is capped at 10% for some firms. 9 Incremental ITC. The marginal ITC rate is calculated as the credit on the current year less the present value of forgone credits as a result of the
increase in the expenditure base in future years.10 The ITC is available on labour expenses only.11 Labour expenses receive a 42% volume ITC and other current expenses qualify for a 25% volume ITC. All current expenses are eligible for a 42%
incremental ITC. Scientific equipment expenses qualify for an 8% volume ITC.

Tax Expenditures and Evaluations 2009
52
Table A2.2Enhanced Investment Tax Credits for R&D Undertaken by Small Firms1(%)
Current Capital2Combined Marginal Effective
Taxable3/ RefundableStatutory
Marginal Effective Statutory
Marginal Effective
Canada4 – 45.2 – 10.9 44.3 Yes/Yes5
Federal only 35 35.0 35 18.2 34.6 Yes/Yes
France 30 30.0 30 15.6 29.6 No/Yes6
Italy 30 14.7 – – 14.3 No/No
Japan 12 12.0 12 6.2 11.9 No/No
United States7 – 13.1 – 0.5 12.8 Yes/No
Netherlands8 42/14 9.5 – – 9.2 Yes/No
Norway9 20.0 16.0 16.0 8.3 15.8 No/YesNote: All US$ figures have been adjusted for 2009 purchasing power parities.1 Small firms are defined as firms having less than 50 employees for all countries except Canada, where small firms are defined as those eligible for
the 35% credit only. Only those countries providing higher statutory ITC rates for small firms are included in the table.2 The base for the ITCs excludes buildings.3 An ITC is described as taxable if firms are required to reduce the base for tax deductions by the amount of the credit received. 4 See Annex 3 for a detailed description of tax incentives in Canada.5 ITCs for small firms are refundable in all jurisdictions except Manitoba.6 Immediate refundability is available for growing small firms.7 No enhanced federal ITC for small firms. Arizona, Indiana, Minnesota, North Carolina, Pennsylvania and Rhode Island provide higher ITC rates for
small businesses based on levels of expenditures or gross receipts.8 Firms may claim a 42% ITC for the first US$124,438 in R&D salary and 14% for the excess.9 Eligible expenditures for the ITC are capped at US$0.639 million, so the marginal ITC rate for some small firms is zero.

53
Annex 3—Description of R&D Tax Incentives in Canada
The Federal Scientific Research and Experimental Development (SR&ED) Tax Incentive Program1
The SR&ED tax incentives have two components:
• Anincometaxdeductionallowsimmediateexpensingofallallowableexpenditures(includingfullexpensing of capital in the year of purchase subject to certain rules). The full value of current and capital SR&ED expenditures is added to a pool of unused SR&ED deductions, which can be taken at the discretion of the taxpayer. Unused deductions can be carried forward indefinitely.
• AnITCisappliedtoincometaxesotherwisepayable.Unusedcreditscanbecarriedforward 20 years and back 3 years to reduce taxes payable in those years, and are partially or fully refundable for smaller businesses.
A business can generally claim both the income tax deduction and the ITC on the same SR&ED expenditures, although there are some specific differences in the base of expenditures eligible for the two components of the program. The income tax deduction is net of both federal and provincial ITCs. The federal credit is applied to eligible spending net of provincial ITCs.
Eligible ActivitiesActivities eligible for the SR&ED tax incentives involve systematic investigation or search carried out in a field of science or technology by means of experiment or analysis. In general, three broad categories of activity are eligible: basic research, applied research and experimental development.2 Certain support activities are also eligible where they are commensurate with the needs, and directly in support, of basic research, applied research or experimental development, although there are also certain activities that are excluded from the definition of SR&ED.
When reviewing whether an activity falls within the scope of the SR&ED program, the Canada Revenue Agency uses the following three criteria, each of which must be satisfied, to determine whether the activity meets the definition of SR&ED:
1. Scientific or technological advancement—The work must generate information that advances the understanding of scientific relations or technologies.
2. Scientific or technological uncertainty—The possibility of achieving a given result or objective, or the way in which it could be achieved, must be unknown or indeterminable based on generally available scientific or technological knowledge or experience.
3. Scientific and technical content—There must be evidence that qualified personnel with relevant experience in science, technology or engineering have conducted a systematic investigation through experiment or analysis.
1 See the Canada Revenue Agency SR&ED website at www.cra-arc.gc.ca/sred/ for more information.2 The definition of SR&ED for income tax purposes is largely consistent with the OECD definition of R&D,
as presented in the Frascati Manual.

Tax Expenditures and Evaluations 2009
54
Eligible ExpendituresMost current and capital expenditures in respect of SR&ED in Canada performed by, or on behalf of, a taxpayer and related to a business of the taxpayer, including a possible extension of that business, may be eligible for the SR&ED tax incentives.
In general, current expenses that are eligible for the SR&ED tax incentives include:
• SalariesorwagesofemployeesdirectlyengagedinSR&ED.
• ThecostofmaterialsconsumedortransformedinSR&ED.
• Leasecostsrelatingtomachineryandequipmentusedallorsubstantiallyall(90%ormore)for SR&ED.
• CertainexpensesassociatedwithcontractstoperformSR&EDdirectlyonbehalfofthetaxpayeror payments to third parties where the taxpayer is entitled to exploit the results of the SR&ED.3
In addition, taxpayers can choose how to treat overhead and administrative expenses. Under the “traditional method,” overhead and administrative expenses must be specifically identified and allocated in respect of SR&ED and may be eligible for both the SR&ED tax deduction and credits. Under the “proxy method,” these costs are deductible as ordinary overhead and administrative expenses, and a notional amount that is eligible for the SR&ED tax credits is calculated.
In general, capital expenditures that are eligible for the SR&ED tax incentives consist of expenditures for machinery and equipment that is all or substantially all used or consumed in the performance of SR&ED in Canada.
Rates and LimitsThere are two rates of ITCs for SR&ED performed in Canada:
• Thegeneralrateis20%.
• Anenhancedrateof35%isprovidedtoCanadian-controlledprivatecorporations(CCPCs)on up to $3 million of qualified expenditures.
The $3-million expenditure limit is phased out if prior-year taxable income is between $500,000 and $800,000 or if prior-year taxable capital is between $15 million and $50 million.4 Tax credits earned at the enhanced rate are fully refundable for current expenditures and are 40% refundable for capital expenditures. Unused ITCs can be carried back up to 3 years and carried forward up to 20 years to be applied against taxes payable in those years.
The following table presents the ITC rates and refundability rates for different types of businesses.
3 Generally, eligible third parties are approved non-profit or tax-exempt associations, universities, colleges, research institutes and similar organizations.
4 Special rules apply to associated corporations, which generally result in the application of taxable income, taxable capital and expenditure limits to group totals.

55
Table A3.1ITC and Refundability Rates (%)
Business Type ITC Rates
Refundability Rates
Current Expenditures
Capital Expenditures
Unincorporated businesses 20 40 40CCPCs with prior-year taxable income of $500,000
or less and prior-year taxable capital employed in Canada of $10 million or less
Expenditures up to expenditure limit1 35 100 40Expenditures over expenditure limit 20 40 40
CCPCs with prior-year taxable income between $500,000 and $800,000
Expenditures up to expenditure limit2 35 100 40Expenditures over expenditure limit 20 0 0
CCPCs with prior-year taxable capital employed in Canada between $10 million and $50 million
Expenditures up to expenditure limit3 35 100 40Expenditures over expenditure limit 20 0 0
All other corporations 20 0 01 Expenditure limit is generally $3 million per annum.2 Expenditure limit for CCPCs is phased out for prior-year taxable income between $500,000 and $800,000.3 Expenditure limit for CCPCs is phased out for prior-year taxable capital employed in Canada between $10 million and $50 million.

Tax Expenditures and Evaluations 2009
56
Provincial IncentivesMost provinces and territories offer additional ITCs to firms that perform scientific R&D within their borders.TheonlyprovincesandterritoriesthatdonotprovideITCsarePrinceEdwardIsland,theNorthwestTerritoriesandNunavut.ProvincesgenerallyfollowthefederaldefinitionsforallowableSR&ED activities and expenditures.
ProvincialcreditsaresummarizedinTableA3.2.OnlyOntarioandQuebechaveenhancedITCratesforsmallR&Dperformers.TheQuebecITCisuniqueinthatitappliestowagesonly.ITCsprovidedin all jurisdictions except Ontario, Manitoba and British Columbia are refundable for all firms. The ITCs in Ontario and British Columbia, however, are refundable for small firms.
Manitoba,Ontario,QuebecandYukonprovideITCstofirmsthatundertakeR&Dinconjunctionwith eligible research institutions within their borders; however, these ITCs are not included in the estimates of tax assistance developed in this paper. These credits are:
• Quebec:Arefundable35%creditisapplicableto80%ofpaymentstoeligibleresearchcentres.
• Ontario:Arefundable20%creditisapplicabletopaymentstoeligibleresearchcentres,upto$20 million annually.
• Manitoba:Arefundable20%creditisapplicabletoresearchinnewtechnologiesandbiotechnologies undertaken with eligible research centres.
• Yukon:R&DundertakeninconjunctionwithYukonCollegebenefitsfroma20%refundablecredit,rather than the 15% credit that applies to other R&D expenditures.
Quebec’s2008budgetintroducedanewwage-based30%refundabletaxcreditfore-business,available for salaries paid between March 14, 2008 and December 31, 2015. The credit applies to corporationsthathaveapermanentestablishmentinQuebec,carryout75%oftheiractivitiesinthe information technology sector and whose development activities involve at least six full-time employees,withacapof$20,000peremployee.However,Quebec’sDepartmentofFinanceprojectsthe tax expenditure associated with this new credit will be less than 5% of that of the R&D wage tax credit. Furthermore, since firms cannot claim two tax credits on the same wages, it is assumed that claims will first be directed to the R&D credit when both are available to the firm. As a result, the new credit is not included in the estimates of tax assistance for R&D prepared for this paper.

57
Table A3.2Provincial R&D Tax Incentives
Statutory Rate
Refundable Credit
Carry- Back
Carry- Forward
Expenditure Limit
Phase-Out Criteria
Additional Notes
British Columbia 10% Qualifying CCPCs only
3 years 10 years Federal limit for refundable credit
Federal criteria for refundable credit
Expires August 31, 2014
Alberta 10% All recipients – – $4 million – –
Saskatchewan 15% All recipients – – – – –
Manitoba 20% No 3 years 10 years – – –
Ontario
Innovation Tax Credit
10% All recipients – –
$3 million to nil, based on provincial phase-out criteria
Prior-year taxable capital between $25 million and $50 million and prior-year taxable income between $500,000 and $800,000
Structure similar to two-tiered federal credit
Expenditures above Innovation Tax Credit limit are eligible for R&D Tax Credit
R&D Tax Credit
4.50% No 3 years 20 years – –
Quebec Ranges from 37.5% to 17.5%, based on provincial phase-out criterion
All recipients – – $3 million for ITC rates above 17.5%
Linear phase-out for assets between $50 million and $75 million
Only applies to eligible R&D wages
Non-CCPCs only eligible for 17.5% rate
New Brunswick 15% All recipients – – – – –
Nova Scotia 15% All recipients – – – – –Newfoundland
and Labrador15% All recipients – – – – –
Yukon 15% All recipients – – – – –

Tax Expenditures and Evaluations 2009
58
ReferencesCorrado, Carol, Charles Hulten and Daniel Sichel (2005). “Measuring Capital and Technology: An Expanded Framework.” Measuring Capital in the New Economy, Corrado, Carol, John Haltiwanger and Daniel Sichel, eds. National Bureau of Economic Research Studies in Income and Wealth, Vol. 65.Chicago:TheUniversityofChicagoPress.
Eisner, Robert, Steven H. Albert and Martin A. Sullivan (1984). “The New Incremental Tax Credit for R&D: Incentive or Disincentive?” National Tax Journal, 37 (2): 171–185.
Hall, Bronwyn (2008). “The United States Research and Experimental Credit: A Report for the Canadian Department of Finance.” Manuscript, August 2008.
Hall,Bronwyn(2007).“MeasuringtheReturnstoR&D:TheDepreciationProblem.”NationalBureauofEconomicResearchWorkingPaper13473.
Lester,John,AndréPatryandDonaldAdéa(2007).“AnInternationalComparisonofMarginalEffective Tax Rates on Investment in R&D by Large Firms.” Department of Finance Canada Working Paper2007–07.
McFetridge, Donald and Jacek Warda (1983). “Canadian R&D Incentives: Their Adequacy and Impact.”CanadianTaxPaperNo.70.CanadianTaxFoundation.
Watson, Harry S. (1996). “The 1990 R&D Tax Credit: A Uniform Tax on Inputs and a Subsidy for R&D.” National Tax Journal, 49 (1): 93–103.