2009 alaska health workforce vacancy...
TRANSCRIPT

2009 Alaska Health Workforce Vacancy Study
Alaska Center for Rural Health – Alaska’s AHEC Institute of Social and Economic Research
University of Alaska Anchorage Diplomacy Building, Suites 404 and 500
3211 Providence Drive Anchorage, AK 99508-4614
(907) 786-6579 http://nursing.uaa.alaska.edu/acrh
http://www.iser.uaa.alaska.edu
December 2009
2009 AK Health Workforce Vacancy Study December 2009 ACRH and ISER
i
ACKNOWLEDGEMENTS The Alaska Center for Rural Health –Alaska’s AHEC (ACRH) and the Institute of Social and Economic Research (ISER) wish to thank the many persons who contributed their time and expertise to make this study possible. Advisory Group Alaska Mental Health Trust Authority Alaskan's For Access to Health Care (ACCESS): Geoff Bullock University of Alaska Anchorage: Jan Harris, Sally Mead Research Team, Alaska Center for Rural Health-Alaska’s AHEC and the Institute of Social and Economic Research (ISER) Beth Landon, Sanna Doucette, Rosyland Frazier, Meghan Wilson, Darla Siver, Lexi Hill, Kate Sanders, Suzanne Sharp, Kristin Johnson, Patricia DeRoche, Stephanie Martin, and Donna Prator Project Funding and Support Funding to support the 2009 Alaska Health Workforce Vacancy Study was provided by Alaska Mental Health Trust Authority, Alaskan's for Access to Health Care (ACCESS), University of Alaska Fairbanks, Tanana Valley campus Telemedicine program, and University of Alaska Anchorage's Community and Technical College (CTC) and the School of Nursing. Finally, we wish to thank the hundreds of human resources and personnel staff who responded to our survey and made this study possible.
2009 AK Health Workforce Vacancy Study December 2009 ACRH and ISER
ii
EXECUTIVE SUMMARY Alaska continues to experience health professional shortages. The state has long had a deficient “supply side” characterized by insufficient numbers of key health workers whose recruitment, retention, and training have been impeded by Alaska’s remoteness, harsh climate, rural isolation, low population density, and scarce training resources. Alaska is the only state without a pharmacy school and lacks its own dental and physical therapy schools as well. Health professional shortages can be decreased through the start of new training programs, the expansion of existing programs, and the improvement of the effectiveness of recruitment and retention efforts. However, strategic planning and the execution of such programs require valid and accurate data. To this end, stakeholders such as the Alaska Mental Health Trust Authority (AMHTA) and Alaskan's For Access to Health Care (ACCESS), along with schools and departments within the University of Alaska Anchorage (UAA), funded the Alaska Center for Rural Health-Alaska’s AHEC (ACRH) and the Institute of Social and Economic Research (ISER) to conduct a comprehensive health workforce study during winter and spring of 2009. This report highlights employers’ needs for employees to fill budgeted positions. This is different from a needs assessment that would take into account population demographics and disease incidence and prevalence. This health workforce study is an assessment of health manpower shortage based on budgeted staff positions and their vacancies in organizations throughout the state. Respondents included part-time positions, which resulted in our counting full-time equivalent (FTE) rather than individuals (“bodies”). In situations where a position was divided among more than one occupation (e.g., Dental Assistant and Billing Clerk), we asked the respondent to count the position under which they considered the position’s “primary occupation.” This was a point-in-time cross-sectional study. Recently filled vacancies or imminent vacancies were not counted. Positions filled by relief/temporary/locum/contract health workers were counted as vacancies only if these workers were temporarily filling a currently vacant, budgeted position. Due to budget and time constraints, we were not able to conduct a trend analysis that is a comparison of this study’s findings and the prior 2007 study. The key questions this study sought to answer were (1) How many budgeted positions, either full- or part-time, existed in organizations providing health services in Alaska? (2) How many of these budgeted positions were currently vacant? (3) What was the vacancy rate? (4) How many of the organizations that employ these occupations hired new graduates of training programs? (5) How many of the currently vacant budgeted positions (#2) could be filled by new graduates of training programs? (6) What were the mean and maximum length of time, expressed in months, that the vacancies have existed? (7) What were the principal, underlying causes of vacancies? The study was designed in consultation with an advisory group that included AMHTA, ACCESS, and UAA. The study targeted 93 health occupations. The unit of analysis was the employment site by organization type, which allowed for the allocation of positions and vacancies by geographic region. For each employer, we identified the staff person most

2009 AK Health Workforce Vacancy Study December 2009 ACRH and ISER
iii
knowledgeable about hiring and vacancies. In large organizations this meant that one employer might provide information about multiple sites and organization types; smaller employers were responsible for only a single site. The population for 10 of the organization types was duplicated from the 2007 Alaska Health Workforce Vacancy Study. The final two organization types, Paramedics and State and Municipal health, were added at the request of UAA Allied Health Programs and the Vice Provost of Health Programs after data collection had begun. Paramedics in non-health organizations and the Municipality of Anchorage had not been in the 2007 study. To capture Paramedics, we included non-health-services employers: fire department/emergency services (military, borough, municipality—paid and volunteer), air medevac services, and airports. We also included firefighters with emergency medical services training. We used a list of paramedic employers compiled in 2007 by the paramedic faculty of the University system (Fire and Emergency Services Program in Allied Health) with consultation from the State Emergency Medical Services office. We created the population listing for the 12th type, State and Municipal (employers of public health nurses), which includes just two employers: (1) the State of Alaska, Department of Health and Social Services, Division of Public Health, Public Health Nursing (with 23 sites) and (2) the Municipality of Anchorage, Department of Health and Human Services, Community Health Services Division (with one site). We completed our employer-site list with the assistance of the Chief of Public Health Nursing for the State of Alaska Department of Health and Social Services and the manager of the Municipality of Anchorage, Department of Health and Human Services, Community Health Services Division. We conducted a census of seven of the organization types, and we sampled from the population of the other five. The data collection consisted of (1) a hard copy of the survey instrument mailed to all sampled organizations, followed by (2) telephone calls from trained interviewers who provided clarification, guidance, and options for returning the completed survey. Data collection commenced on March 9, 2009, and concluded on June 26, 2009, for health and non-health organizations. Additional data was collected in October 2009 for public health nurse occupation. We provided these specific dates to highlight this study as a “point in time” assessment of health manpower shortages as the number of positions and vacancies change over time. Quantitative survey data were entered, cleaned, and analyzed using SPSS and SAS software. Qualitative and some quantitative data were entered, cleaned, and analyzed using MS Excel. Content analysis of the qualitative data was completed using conceptual/thematic descriptions of the data based on open coding. The sample of 1,064 employment sites is 72.1% of the statewide population (1064/1476). The 764 completed responses is 51.8% of the statewide population (764/1476), and 71.8% of the sample population (764/1064). Statewide estimates for positions and vacancies were derived by weighting the sample to the total population from which the sample was drawn. For this study, the population was employment sites (employer sites) of health-care workers in the state of Alaska. We stratified the sample by 12 organizational types.
2009 AK Health Workforce Vacancy Study December 2009 ACRH and ISER
iv
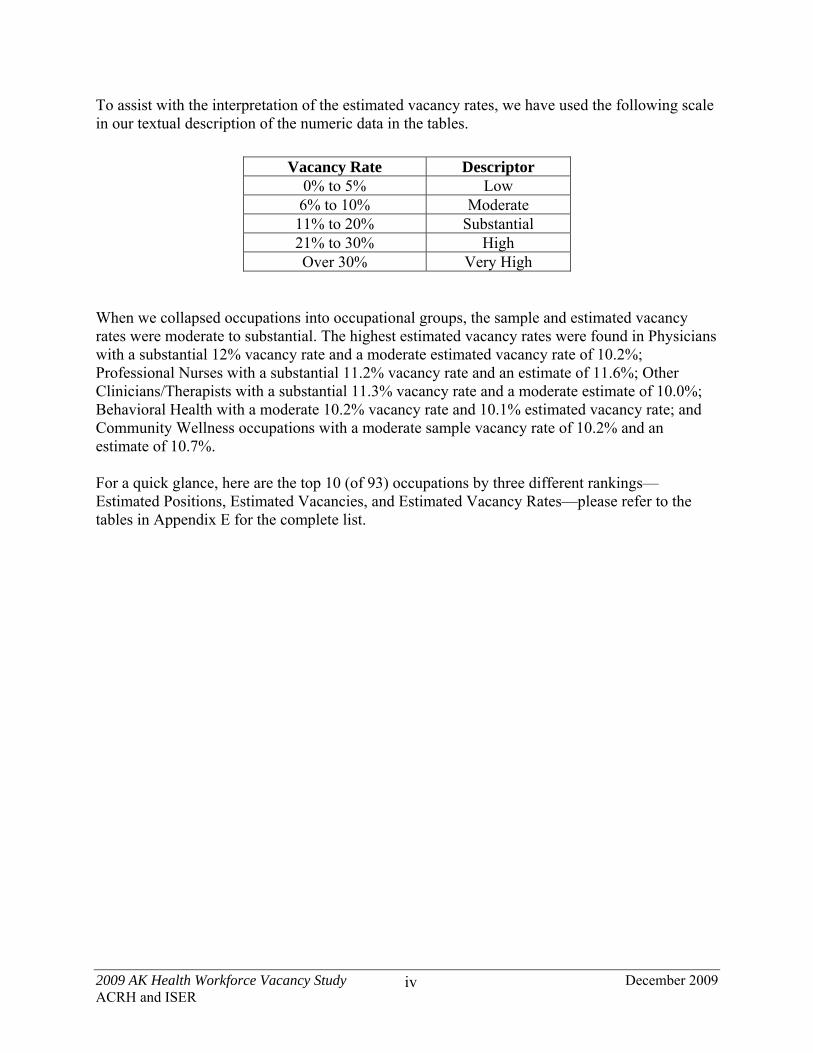
To assist with the interpretation of the estimated vacancy rates, we have used the following scale in our textual description of the numeric data in the tables.
Vacancy Rate Descriptor 0% to 5% Low 6% to 10% Moderate 11% to 20% Substantial 21% to 30% High Over 30% Very High
When we collapsed occupations into occupational groups, the sample and estimated vacancy rates were moderate to substantial. The highest estimated vacancy rates were found in Physicians with a substantial 12% vacancy rate and a moderate estimated vacancy rate of 10.2%; Professional Nurses with a substantial 11.2% vacancy rate and an estimate of 11.6%; Other Clinicians/Therapists with a substantial 11.3% vacancy rate and a moderate estimate of 10.0%; Behavioral Health with a moderate 10.2% vacancy rate and 10.1% estimated vacancy rate; and Community Wellness occupations with a moderate sample vacancy rate of 10.2% and an estimate of 10.7%. For a quick glance, here are the top 10 (of 93) occupations by three different rankings—Estimated Positions, Estimated Vacancies, and Estimated Vacancy Rates—please refer to the tables in Appendix E for the complete list.

2009 AK Health Workforce Vacancy Study December 2009 ACRH and ISER
v
Top Ten Health Shortage Professions Based on Estimated Positions Sample Estimate
Occupations Positions Vacancies
Vacancy Rate
Positions Vacancies Vacancy
Rate Registered Nurse 2680.8 273.5 10.2% 3176.0 321.6 10.1% Certified Nurse Assistant 1245.5 102.0 8.2% 1444.9 120.0 8.3% Administrator/Director/CEO/Manager 837.0 25.0 3.0% 1246.4 33.5 2.7% Human Services Worker HS 804.0 104.0 12.9% 1198.9 146.4 12.2% Firefighter with Emergency Medical Service 903.0 26.0 2.9% 1114.1 32.1 2.9% Billing Clerk/Technician 689.5 37.0 5.4% 1096.1 58.6 5.3% Dental Assistant 574.0 34.0 5.9% 968.3 61.7 6.4% Pharmacy Technician 774.5 23.0 3.0% 819.9 27.8 3.4% Case Manager 620.5 33.0 5.3% 810.2 48.7 6.0% Medical Assistant 357.0 13.5 3.8% 706.7 30.3 4.3%
Top Ten Health Shortage Professions Based on Estimated Vacancies Sample Estimate
Occupations Positions Vacancies
Vacancy Rate
Positions Vacancies Vacancy
Rate Registered Nurse 2680.8 273.5 10.2% 3176.0 321.6 10.1% Human Services Worker HS 804.0 104.0 12.9% 1198.9 146.4 12.2% Certified Nurse Assistant 1245.5 102.0 8.2% 1444.9 120.0 8.3% Licensed Practical Nurse 393.0 44.5 11.3% 578.6 68.2 11.8% Family Physician 315.8 43.0 13.6% 615.4 67.1 10.9% Allied Health Dental Asst 574.0 34.0 5.9% 968.3 61.7 6.4% Billing Clerk/Technician 689.5 37.0 5.4% 1096.1 58.6 5.3% Family Nurse Practitioner 193.0 36.5 18.9% 337.3 58.2 17.2% Case Manager 620.5 33.0 5.3% 810.2 48.7 6.0% Chemical/Substance Counselor 225.0 37.0 16.4% 311.0 48.0 15.4%
Top Ten Health Shortage Professions Based on Estimated Vacancy Rates Sample Estimate
Occupations Positions Vacancies
Vacancy Rate
Positions Vacancies Vacancy
Rate Radiation Oncologist 5.0 3.0 60.0% 5.0 3.0 60.0% Allied Health Paramedic 9.0 4.0 44.4% 9.0 4.0 44.4% Pediatric Nurse Practitioner 15.0 4.0 26.7% 27.8 10.4 37.4% Physical Therapy Assistant 53.0 16.0 30.2% 62.3 17.8 28.5% Nurse Midwife 25.0 4.0 16.0% 41.0 10.4 25.4% Dietitian 36.5 9.0 24.7% 37.2 9.0 24.2% Occupational Therapist 115.0 26.0 22.6% 128.5 29.3 22.8% Women's Health Care Nurse Practitioner 23.0 5.0 21.7% 51.9 11.4 22.0% Psychiatric Nurse Practitioner 25.0 6.0 24.0% 41.9 8.6 20.5% Family Nurse Practitioner 193.0 36.5 18.9% 337.3 58.2 17.2%

2009 AK Health Workforce Vacancy Study December 2009 ACRH and ISER
vi
The following are some highlights of specific occupations: Primary Care Providers
• Primary-care provider occupations had moderate-to-substantial statewide estimated vacancy rates—Family Physician (10.9%), General Internist (7.8%), Family Nurse Practitioner (17.2%), and Physician Assistant (13.2%).
Professional Nurses
• The findings confirm that the shortage of Professional Nurses continues. Moderate statewide estimated vacancy rates are calculated for Registered Nurse at 10.1%, Nurse Educator at 9.4%, and Public Health Nurse at 7.6%. Nurse Manager at 11.8%, Critical Care/Emergency Room/Intensive Care Unit Nurse at 15.0%, Nurse Consultant at 15.1%, Nurse Manger at 11.0%, and Psychiatric Nurse at 12.9% had substantial statewide estimated vacancy rates. The highest statewide estimated vacancy rates were experienced by Nurse Midwife at 25.4%, Pediatric Nurse Practitioner at 37.4%, Psychiatric Nurse Practitioner at 20.5%, and Women’s Health Care Practitioner at 22.0%.
Pharmacy
• The Pharmacist shortage appears to be easing in Alaska, with 37.1 estimated vacancies statewide and an estimated vacancy rate of 8.5%. Pharmacies had the greatest number of vacancies, followed by the Tribal Health Organizations.
Behavioral Health Services
• Though their vacancies were not numerous (11.0 estimated statewide vacancies), Psychiatrists were particularly in demand (12.7% statewide estimated vacancy rate).
• Most of the statewide estimated vacancy rates for Behavioral Health occupations were moderate to substantial. The greatest unmet demand was for Chemical/Substance Abuse Counselor at 15.4% followed by Aide Village Counselor at 14.9%, Clinical Psychologist at 14.8%, with substantial statewide estimated vacancy rates.
Dental
• The estimated statewide vacancy rate for Dentist was 2.6%; however, this masked a 7.1% estimated rural rate. Dental Hygienist showed an estimated vacancy rate of 8.0% statewide with a 15.8% rate in rural regions.
Therapists
• Therapists of all kinds—Physical, Occupational, Speech, and Speech-Language Pathologist—proved to be in short supply; estimated statewide vacancy rates ranged from 10.4% to 28.5%. No part of the state, urban or rural, escaped the shortages.
Other Nursing Staff
• Looking at other nursing occupations, the vacancy rate for Licensed Practical Nurse was fairly high, with 11.3% in the sample and 11.8% for the statewide estimate. The sample vacancy rate for Certified Nurse Assistant was lower (8.2%, sample; 8.5%, statewide estimate).

2009 AK Health Workforce Vacancy Study December 2009 ACRH and ISER
vii
Tribal Health Organizations
• Community Health Aide/Practitioners (CHA/Ps) are predominately located within Tribal Health Organizations. CHA/Ps, with 329.0 statewide estimated positions and 42.6 estimated vacancies, yielded a 12.9% estimated vacancy rate.
Allied Health
• Allied Health occupations were too numerous to address in detail in the context of this report. We focused on eight key Allied Health occupations not already listed: Clinical Lab Assistant, Medical Lab Technician, Phlebotomist, Radiology Technician, Sonographer, Medical Assistant, Medical Technician, and Respiratory Therapist. Except for Sonographer, vacancy rates were generally low to moderate for these occupations, between 2.3% and 5.9% in the sample and between 3.5% and 6.6% for the statewide estimates. With the exception of Medical Assistant (with 30.3 estimated statewide vacancies) and Medical Technician (with 14.8 estimated vacancies statewide), the statewide vacancies were relatively low in number. The sample Sonographer vacancy rate was substantial (13.6%), with 8.0 reported vacancies and 9.6 estimated vacancies, resulting in a 13.7% estimated vacancy rate
Community Education and Wellness Occupations
• Dietitian, Health Educator, and Nutritionist occupations are not numerous but do play an important role in prevention efforts. Dietitian had a high sample and statewide estimated vacancy rate at 24.7% and 24.2%, respectively.
Administrators/Managers
• This section focuses on seven key managerial occupations that are specific to health care: Administrator/Director/CEO/Manager, Behavioral Health Supervisor, Health Information Administrator/Manager, Hospital Administrator, Human Resources Director, Medical Director, and Nursing Director/Executive. Sample and estimated vacancy numbers were generally low for these seven occupations, while estimated vacancy rates were moderately high for two—Hospital Administrators (11.1%) and Nursing Director/Executive (14.6%). This was in contrast to the reported and estimated vacancy rates for Administrator/Director/CEO/Manager (3.0% sample, 2.7% statewide estimate). The highest number of estimated vacancies (33.5) was for Administrator/ Director/CEO/Manager.
Information/Reimbursement
• Among a wide range of “front office” and “back office” occupations responsible for ancillary, non-medical services (but necessary for functioning health-care organizations), vacancy numbers and rates were generally low in both the sample and the statewide estimates. The highest vacancy rates were for Records Clerk/Technician (6.5% sample) and (5.9% estimated).
Paramedic
• For an assessment of Paramedic occupations, we expanded the organization types beyond health-care organizations and included paid and volunteer fire departments and emergency services (military, borough, and municipal), air medevac services, and airports. We also expanded the occupations to include Firefighters with Emergency Medical Services training. Paramedics had a statewide estimated vacancy rate of 44.4% for 4 estimated vacant positions among health-care organizations. Firefighters with Emergency Medicare Service Training had

2009 AK Health Workforce Vacancy Study December 2009 ACRH and ISER
viii
the highest number of estimated positions at 1,114.1 and estimated vacancies of 32.1 resulting in a statewide estimated vacancy rate of 2.9%.
We asked respondents two questions on the hiring of new graduates (e.g., recent nursing school graduates, MDs completing residencies, or H.S. or AA graduates for positions with on-the-job training). First, “Do you hire new graduates in this occupation?” Second, “How many of your current vacancies could you fill with new graduates?” The intent of both questions was to gauge the ability of the job market to absorb new graduates/trainees in order to plan training expansions and/or recruitment campaigns. The top three occupations by estimated positions that could be filled with new graduates were Billing Clerk/Technician with 324.0 estimated vacancies, Health Dental Assistant with 218.0 estimated vacancies, and Administrator/Director/CEO/Manager with 218.0 estimated vacancies We asked respondents to tell us the length of the longest current vacancy, expressed in months. Upon analysis we found there were 12 occupations with a mean estimated vacancy length of one year or greater. These were General Internist, Hospital Administrator, Coding Clerk/Technician, MRI/CT Technician, Nuclear Medicine Technician, Emergency Physician, Nutritionist, Psychiatric Aide/Technician, Social Worker MSW, Echocardiography Technician, Health Educator, and Compliance/Auditor. This illustrates the deficit “supply side” of numerous health occupations, the recruitment of which is impeded by the reasons for vacancies highlighted by our respondents. The top three most frequently reported reasons for vacancies were inadequate pool of qualified workers, insufficient compensation package, and rural isolation.
2009 AK Health Workforce Vacancy Study December 2009 ACRH and ISER
ix
TABLE OF CONTENTS ACKNOWLEDGEMENTS ............................................................................................................ i
EXECUTIVE SUMMARY ........................................................................................................... ii
TABLE OF CONTENTS .............................................................................................................. ix
I. Problem and Rationale............................................................................................................ 1
A. Background ..................................................................................................................... 1
B. Previous Studies .............................................................................................................. 2
II. Methodology .......................................................................................................................... 7
A. Background ..................................................................................................................... 7
1. Advisory Group .......................................................................................................... 7
2. Unit of Analysis ......................................................................................................... 7
3. Study Questions .......................................................................................................... 7
B. Methods .......................................................................................................................... 8
1. Population ................................................................................................................... 8
2. Sample ...................................................................................................................... 10
3. The Study Instrument ............................................................................................... 11
C. Data Collection ............................................................................................................. 12
D. Data Analysis ................................................................................................................ 14
1. Response Rates ......................................................................................................... 14
3. Quantitative Data ...................................................................................................... 16
4. Qualitative Data ........................................................................................................ 16
5. Geographic Regions ................................................................................................. 16
III. Limitations of Study ............................................................................................................ 19
IV. Findings ............................................................................................................................... 21
A. Quantitative Data .......................................................................................................... 28
1. General Distribution of Positions and Vacancies ..................................................... 28
2. Occupational Highlights ........................................................................................... 33
3. Highlighted Occupations .......................................................................................... 37
4. Reasons for Vacancies ............................................................................................. 88
APPENDICES
Appendix A. List of Health Occupations
Appendix B. Health Workforce Surveys
Appendix C. Cover Letter Accompanying Survey Forms
Appendix D. Confidence Intervals for Positions, Vacancies, Number of Vacancies Filled with New Graduates, and Length of Longest Vacancy in Months

2009 AK Health Workforce Vacancy Study December 2009 ACRH and ISER
x
Appendix E. Tables of Samples and Estimates of Positions, Vacancies, Vacancy Rates, Number of Vacancies Filled with New Graduates, Mean and Maximum Length of Longest Vacancy in Months
Appendix F. Tables of Occupations Sorted By Estimates of Positions, Vacancies, Vacancy Rates, Number of Vacancies Filled with New Graduates, Mean and Maximum Length of Longest Vacancy in Months
Figures -------
Figure 1. Statewide Population of Employment Sites by Organization Type ............................... 9
Figure 2. Revised Sample by Organization Type ........................................................................ 13
Figure 3. Responding Organizations by Geographic Region ...................................................... 18
Figure 4. Responding Organizations by Organization Type ....................................................... 21
Figure 5. Responding Organizations by Urban vs. Rural ............................................................ 22
Figure 6. Responding Organizations by Geographic Region ...................................................... 24
Tables -------
Table 1. HPSA and MUA/MUP Listing, March 2009 .................................................................. 2
Table 2. Number and Percentage of 2009 Statewide Population of Employment Sites by Organization Type ....................................................................................................................... 10
Table 3. Census or Target Sample Size by Organization Type ................................................... 11
Table 4. Revised Sample Size by Organization Type .................................................................. 13
Table 5. Response Rates by Organization Type .......................................................................... 14
Table 6. Weight, Completed Surveys, Original Population Listing, and Census or Sample by Organization Type ....................................................................................................................... 15
Table 7. Urban/Rural Geographic Regions Defined with Component Boroughs and Census Areas ............................................................................................................................................ 17
Table 8. Labor Market Areas and Component Boroughs/Census Areas ..................................... 18
Table 9. Organizations with Contract Health Workers ................................................................ 20
Table 10. Responding Organizations by Organization Type ....................................................... 22
Table 11. Percent within Urban/Rural by Responding Organization Type ................................. 23
Table 12. Percent Urban/Rural Designation by Responding Organization Type ........................ 23
Table 13. Percent within Geographic Region by Responding Organization Type ...................... 25
Table 14. Percent in Geographic Region by Responding Organization Type ............................. 26
Table 15. Categorization of Occupations ..................................................................................... 28
Table 16. Positions, Vacancies, and Vacancy Rates by Occupational Group, Sample and Statewide Estimates ..................................................................................................................... 29

2009 AK Health Workforce Vacancy Study December 2009 ACRH and ISER
xi
Table 17. Positions, Vacancies, and Vacancy Rates by Occupational Group and Urban vs. Rural, Sample and Statewide Estimates ....................................................................................... 30
Table 18. Positions, Vacancies, and Vacancy Rates by Occupational Group and Labor Region, Sample and Statewide Estimates .................................................................................... 31
Table 19. Positions, Vacancies, and Vacancy Rates for Occupations with 1,000 or more Estimated Positions, Sample and Statewide Estimates* .............................................................. 33
Table 20. Positions, Vacancies, and Vacancy Rates for Occupations with < 1,000 and > 500 Estimated Positions, Sample and Statewide Estimates* .............................................................. 34
Table 21. Occupations with Most Estimated Statewide Vacancies (at least 100), Sample and Statewide Estimates* ................................................................................................................... 34
Table 22. Occupations with 50-99 Estimated Statewide Vacancies, Sample and Statewide Estimates* .................................................................................................................................... 35
Table 23. Occupations with Highest Vacancy Rates*, Sample and Statewide Estimates ........... 35
Table 24. Positions, Vacancies, and Vacancy Rates for Occupations with at Least 20 Estimated Vacancies (and an estimated vacancy rate of at least 15%), Sample and Statewide Estimates* .................................................................................................................................... 36
Table 25. Sample and Estimated Vacancies for Occupations with at least 20 Estimated Vacancies Willing to Hire New Graduates .................................................................................. 37
Table 26. Physician Positions, Vacancies, and Vacancy Rates, Sample and Statewide Estimates ...................................................................................................................................... 38
Table 27. Physician Vacancies by Organization Type ................................................................ 38
Table 28. Organization Types that Include Only 1 or 2 Physician Occupations, Estimated Vacancies and Vacancy Rates for Physician Occupations .......................................................... 39
Table 29. Positions, Vacancies, and Vacancy Rates for Physician Occupations in Urban and Rural Areas .................................................................................................................................. 39
Table 30. Positions, Vacancies, and Vacancy Rates for Physician Occupations by Geographic Regions ........................................................................................................................................ 41
Table 31. Professional Nursing Occupations, Positions, Vacancies, and Vacancy Rates by Sample and Statewide Estimates ................................................................................................. 42
Table 32. Nursing Occupations Positions, Vacancies, and Vacancy Rates by Organization Type, Sample and Statewide Estimates ....................................................................................... 44
Table 33. Professional Nursing Occupations, Vacancies, and Vacancy Rates by Urban and Rural Regions............................................................................................................................... 47
Table 34. Professional Nursing Occupations, Vacancies, and Vacancy Rates by Labor Market Region ............................................................................................................................. 48
Table 35. Pharmacists and Pharmacy Technicians, Positions, Vacancies, and Vacancy Rates, Sample and Statewide Estimates ................................................................................................. 50
Table 36. Pharmacy Occupations Positions, Vacancies, and Vacancy Rates by Organization Type, Sample and Statewide Estimates ....................................................................................... 51

2009 AK Health Workforce Vacancy Study December 2009 ACRH and ISER
xii
Table 37. Pharmacy Occupations Positions, Vacancies, and Vacancy Rates, Urban and Rural Areas, Sample and Statewide Estimates ...................................................................................... 52
Table 38. Pharmacy Occupations Positions, Vacancies, and Vacancy Rates by Geographic Region, Sample and Statewide Estimates .................................................................................... 52
Table 39. Behavioral Health Positions, Vacancies, and Vacancy Rates, Sample and Statewide Estimates ...................................................................................................................................... 53
Table 40. Behavioral Health Occupations, Estimated Vacancies, and Vacancy Rates by Organization Type ....................................................................................................................... 54
Table 41. Behavioral Health-Specific Occupations, Vacancies, and Vacancy Rates by Labor Market Region ............................................................................................................................. 55
Table 42. Behavioral Health Occupations, Estimated Vacancies, and Vacancy Rates by Urban and Rural Regions ............................................................................................................. 56
Table 43. Dental Positions, Vacancies, and Vacancy Rates, Sample and Statewide Estimates .. 57
Table 44. Dental Positions, Vacancies, and Vacancy Rates by Organization Type, Sample and Statewide Estimates .............................................................................................................. 58
Table 45. Dental Occupations, Estimated Vacancies, and Vacancy Rates by Urban and Rural Regions ........................................................................................................................................ 59
Table 46. Dental Occupations, Estimated Vacancies, and Vacancy Rates by Labor Market Regions ........................................................................................................................................ 59
Table 47. Physical, Occupational, and Speech Therapist Positions, Vacancies, and Vacancy Rates, Sample and Statewide Estimates ....................................................................................... 60
Table 48. Physical, Occupational, and Speech Therapist Occupations, Estimated Vacancies. and Vacancy Rates by Organization Type ................................................................................... 61
Table 49. Physical, Occupational, and Speech Therapist Occupations, Vacancies, and Vacancy Rates by Urban and Rural Regions ............................................................................... 62
Table 50. Physical, Occupational, and Speech Therapist Occupations, Vacancies, and Vacancy Rates by Labor Market Regions ................................................................................... 62
Table 51. Physician Assistant Positions, Vacancies, and Vacancy Rates by Sample and Statewide Estimates ..................................................................................................................... 63
Table 52. Physician Assistant Vacancies and Vacancy Rates by Type of Organization ............. 63
Table 53. Physician Assistant Vacancies and Vacancy Rates by Urban and Rural Regions ...... 63
Table 54. Physician Assistant Vacancies and Vacancy Rates by Labor Market Regions ........... 64
Table 55. Other Nursing Staff Positions, Vacancies, and Vacancy Rates, Sample and Statewide Estimates ..................................................................................................................... 64
Table 56. Other Nursing Staff Occupations, Estimated Vacancies, and Vacancy Rates by Organization Type ....................................................................................................................... 65
Table 57. Other Nursing Staff Occupations, Estimated Vacancies, and Vacancy Rates by Urban and Rural Regions ............................................................................................................. 65

2009 AK Health Workforce Vacancy Study December 2009 ACRH and ISER
xiii
Table 58. Other Nursing Staff Occupations, Estimated Vacancies, and Vacancy Rates by Labor Market Region ................................................................................................................... 66
Table 59. Tribal Health Organization-Specific Positions, Vacancies, and Vacancy Rates, Sample and Statewide Estimates ................................................................................................. 67
Table 60. Tribal Health Organization-Specific Occupations, Estimated Vacancies, and Vacancy Rates by Organization Type .......................................................................................... 67
Table 61. Tribal Health Organization-Specific Occupations, Estimated Vacancies, and Vacancy Rates by Labor Market Region ..................................................................................... 68
Table 62. Tribal Health Organization-Specific Occupations, Estimated Vacancies, and Vacancy Rates by Urban and Rural Regions ............................................................................... 69
Table 63. Tribal Health Organization-Specific Positions, Vacancies, and Vacancy Rates by Geographic Region ...................................................................................................................... 70
Table 64. Allied Health-Specific Positions, Vacancies, and Vacancy Rates, Sample and Statewide Estimates ..................................................................................................................... 71
Table 65. Allied Health-Specific Occupations, Estimated Vacancies, and Vacancy Rates by Organization Type ....................................................................................................................... 72
Table 66. Allied Health-Specific Occupations, Estimated Vacancies, and Vacancy Rates by Urban And Rural Regions ............................................................................................................ 73
Table 67. Allied Health-Specific Occupations, Estimated Vacancies, and Vacancy Rates by Geographic Region ...................................................................................................................... 74
Table 68. Additional Allied Health-Specific Occupations, Vacancies, and Vacancy Rates, Sample and Statewide Estimates ................................................................................................. 75
Table 69. Additional Allied Health-Specific Occupations, Estimated Vacancies, and Vacancy Rates by Organization Type ......................................................................................................... 75
Table 70. Additional Allied Health-Specific Occupations, Estimated Vacancies, and Vacancy Rates by Urban and Rural Regions .............................................................................................. 76
Table 71. Additional Allied Health-Specific Occupations, Estimated Vacancies, and Vacancy Rates by Geographic Region ........................................................................................ 76
Table 72. Community Education and Wellness Positions, Vacancies, and Vacancy Rates, Sample and Statewide Estimates ................................................................................................. 77
Table 73. Community Education and Wellness Occupations, Estimated Vacancies, and Vacancy Rates by Organization Type .......................................................................................... 78
Table 74. Community Education and Wellness Occupations, Estimated Vacancies, and Vacancy Rates by Labor Market Region ..................................................................................... 78
Table 75. Community Education and Wellness Occupations, Estimated Vacancies, and Vacancy Rates by Urban and Rural Regions ............................................................................... 79
Table 76. Managerial and Administrative Positions, Vacancies, and Vacancy Rates, Sample and Statewide Estimates .............................................................................................................. 79
Table 77. Managerial and Administrative Occupations, Estimated Vacancies, and Vacancy Rates by Organization Type ......................................................................................................... 80

2009 AK Health Workforce Vacancy Study December 2009 ACRH and ISER
xiv
Table 78. Managerial and Administrative Occupations, Estimated Vacancies, and Vacancy Rates by Urban And Rural Regions ............................................................................................. 81
Table 79. Managerial and Administrative Occupations, Estimated Vacancies, and Vacancy Rates by Labor Market Region .................................................................................................... 82
Table 80. Information and Reimbursement Positions, Vacancies, and Vacancy Rates, Sample and Statewide Estimates .............................................................................................................. 83
Table 81. Information and Reimbursement Occupations, Estimated Vacancies, and Vacancy Rates by Urban and Rural Regions .............................................................................................. 83
Table 82. Information and Reimbursement Occupations, Estimated Vacancies, and Vacancy Rates by Organization Type ......................................................................................................... 84
Table 83. Information and Reimbursement Occupations, Estimated Vacancies, and Vacancy Rates by Labor Market Region .................................................................................................... 85
Table 84. Paramedic Positions, Vacancies, and Vacancy Rates, Sample and Statewide Estimates ...................................................................................................................................... 86
Table 85. Paramedic Estimated Vacancies and Vacancy Rates by Urban and Rural Regions .... 86
Table 86. Paramedic Estimated Vacancies and Vacancy Rates by Labor Market Region .......... 87
Table 87. Paramedic Estimated Vacancies and Vacancy Rates by Organization Type .............. 87
Table 88. Reasons for Vacancies—All ........................................................................................ 88
Table 89. Reasons for Vacancies, Urban and Rural .................................................................... 89
Table 90. Vacancy Causes by Respondent Type ......................................................................... 89
Table 91. Vacancy Causes by Labor Market Region .................................................................. 90
Table 92. “Do You Hire New Graduates in this Occupation?” with Estimated 50 or More “Yes” Responses .......................................................................................................................... 91
Table 93. Occupations with at Least 50 Estimated Positions that Could Be Filled With New Graduates ..................................................................................................................................... 92
Table 94. Occupations with Equal Sample Mean and Maximum Length of Vacancy ................ 92
Table 95. Occupations with a Mean Vacancy Length of at least Twelve Months ...................... 93
Table 96. Occupations with a Mean Vacancy Length at least Six Months and Less than Twelve Months ............................................................................................................................ 93
Table 97. Occupations with a Maximum Vacancy Length of Twelve Months and Greater ....... 94

2009 AK Health Workforce Vacancy Study December 2009 ACRH and ISER
1
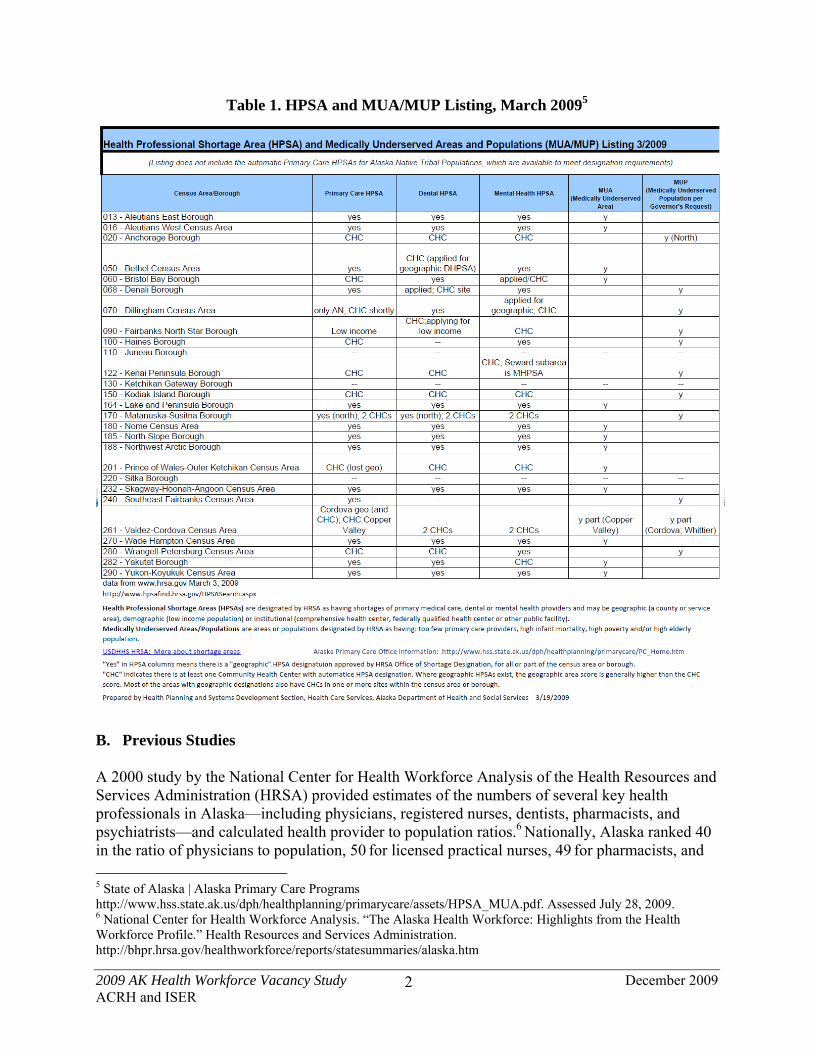
I. Problem and Rationale A. Background Alaska continues to experience health professional shortages. The state has long had a deficient “supply side” characterized by insufficient numbers of key health workers whose recruitment, retention, and training have been impeded by Alaska’s remoteness, harsh climate, rural isolation, low population density, and scarce training resources. Alaska is the only state without a pharmacy school and lacks its own dental and physical therapy schools. “There are few industries in Alaska as large or that have grown as much as health care. It has a presence nearly everywhere in the state and includes a broad spectrum of occupations, ranging from surgeons to home health aides. The industry employs more people in Alaska than the federal government, state government, oil industry, or most other industries. The industry had at least 29,000 jobs in 2007, and its payroll was about $1.2 billion…Nearly as impressive as the sheer size of the state’s health care industry is the lightning speed at which it grows. The number of wage and salary jobs in the industry increased 40 percent between 2000 and 2007, from 20,700 jobs to 29,000…The state’s health care employment has grown more than three times as fast as all other industries since 2000—health care’s 40 percent versus 13 percent for all other industries.”1 Now, exacerbating this already difficult situation is a burgeoning “demand side” for increased health services for a steadily growing and aging population. Leading this demand for health services is a dramatically aging population. “Demographics have been and will continue to be a major contributor to the growth of Alaska’s health care employment, particularly as Alaska’s population continues to age. Although only 6.8 percent of Alaskans are older than 65 (compared to the nation’s 12.4 percent), the state’s 65-plus population grew by 50 percent between 1996 and 20062…the number of Alaskans over 65 is growing fast—it’s expected to double in the next 15 years.3…Because Alaska’s senior population is growing faster than their national cohorts, Alaska’s health care employment is also growing faster and may continue to do so in the future.”4 But despite this dramatic employment growth, supply has not kept up with need or demand. Vast portions of Alaska have been designated either a Health Professional Shortage Area (HPSA) or Medically Underserved Area (MUA) (Table 1). These shortages can be addressed through expansion of existing training programs, initiation of new training programs, and effective recruitment/retention campaigns. But the strategic planning and the execution of such programs require valid and precise data. Though abundant anecdotal evidence testifies to the scope of these shortages, they have not always been broadly or systematically quantified.
1 Fried, Neal, Alaska’s Health Industry, Alaska Economic Trends, February 2008, Volume 28, No. 2, pp 4-5. 2 Ibid. 3 ISER Medicare Report, March 2009 4 Fried, Neal, op.cit., p 7.
2009 AK Health Workforce Vacancy Study December 2009 ACRH and ISER
2
Table 1. HPSA and MUA/MUP Listing, March 20095
B. Previous Studies A 2000 study by the National Center for Health Workforce Analysis of the Health Resources and Services Administration (HRSA) provided estimates of the numbers of several key health professionals in Alaska—including physicians, registered nurses, dentists, pharmacists, and psychiatrists—and calculated health provider to population ratios.6 Nationally, Alaska ranked 40 in the ratio of physicians to population, 50 for licensed practical nurses, 49 for pharmacists, and 5 State of Alaska | Alaska Primary Care Programs http://www.hss.state.ak.us/dph/healthplanning/primarycare/assets/HPSA_MUA.pdf. Assessed July 28, 2009. 6 National Center for Health Workforce Analysis. “The Alaska Health Workforce: Highlights from the Health Workforce Profile.” Health Resources and Services Administration. http://bhpr.hrsa.gov/healthworkforce/reports/statesummaries/alaska.htm
2009 AK Health Workforce Vacancy Study December 2009 ACRH and ISER
3
50 for pharmacy assistants. Another 2000 study by the Bureau of Health Professions of HRSA projected an RN shortage of 58% in Alaska by 2020.7 However, neither study quantified actual current shortages. A precursor of and close model for our investigation was a 2001 study coordinated by the Alaska Center for Rural Health–Alaska’s AHEC (ACRH) to determine the current and projected training needs of the state’s allied health workforce.8 From a representative sample of 369 health organizations of all types and from all regions of the state, the study presented data showing the total numbers of persons currently employed, total vacancies, and estimated annual turnover for 74 allied health occupations. In addition, responding organizations were asked to indicate if they expected to increase hiring in the next 3-5 years as well as the level of and primary reasons for any difficulties they experienced in recruiting. The following recommendations were based on the findings (1) expansion of pharmacy technician training at University of Alaska Fairbanks (UAF); (2) development of a radiologic technology training program; (3) further study of behavioral health professions; (4) development of both training and recruitment programs for rehabilitation staff; (5) increased use of distance education for the training of allied health professionals; and (6) the creation of allied health coordinator positions for each Major Academic Unit (MAU) of the state’s public university system. In 2004, the Western Interstate Commission for Higher Education (WICHE) Mental Health Program released its Status Report on Alaska’s Behavioral Health Workforce in which it summarized workforce data from many sources.9 It predicted that by 2010 there will be a 47% increase from 2000 levels in the need for behavioral health professions, including an 81% increase in the demand for social workers, a 79% increase for mental health counselors, and a 76% increase for behavioral-disorder counselors. In 2005, the Alaska Department of Labor and Workforce Development released its “Alaska Occupational Forecast to 2014.”10
Based on surveys of 4,500 employers of all types, done longitudinally to project trends, the report quantified the number of persons employed in 2004 for selected occupations and projected net 10-year increases in employment for 2014, factoring in both growth and attrition. The report estimated 4,902 RNs employed statewide in 2004, growing to 6,432 by 2014—an increase of 1,530 (31%). Other health occupations expected to increase substantially include EMTs (38%), Home Health Aides (60%), Dental Assistants (35%), and Medical Assistants (36%). While the study was extremely useful for macro-level planning, and quantified the estimated 10-year increases, it did not quantify how much of the current need was not being met; nor did it estimate current numbers of vacancies, vacancy rates, or the annual capacity of the job market to absorb new graduates.
7 Bureau of Health Professions, National Center for Health Workforce Analysis. “Projected Supply, Demand, and Shortages of Registered Nurses: 2000-2020.” Washington, DC: Health Resources and Services Administration, 2002. 8 Alaska Center for Rural Health. “Alaska’s Allied Health Workforce: A Statewide Assessment.” Anchorage: University of Alaska Anchorage, 2001. 9 Western Interstate Commission for Higher Education Mental Health Program. “The Behavioral Health Workforce in Alaska: A Status Report.” Anchorage, Fairbanks, Juneau: University of Alaska, 2004. 10 Alaska Department of Labor and Workforce Development, Research and Analysis Section. “Alaska Occupational Forecast to 2014.” http://146.63.75.50/research/iodata/occproj.htm#healthp

2009 AK Health Workforce Vacancy Study December 2009 ACRH and ISER
4
The Status of Recruitment Resources and Strategies (SORRAS) studies of 2003-2004 and 2005-2006, led by ACRH and funded by the State of Alaska Office of Health Planning, quantified the monetary cost of recruiting health professionals for vacant positions in Alaska.11,12
The 80 hospitals, long-term care facilities, community health centers, and mental health clinics surveyed spent $24 million annually to recruit for the twelve key health occupations targeted by the study. Fifty-four percent of that cost covered the hiring of locums to fill persistently vacant positions. The three main barriers to recruitment identified were (1) locating qualified candidates (in short supply in Alaska); (2) Alaska’s geographic isolation and harsh climate; and (3) the need to satisfy the lifestyle and employment needs of spouses and other family members. Although SORRAS dramatically highlighted the pervasiveness of vacancies and the high financial costs of filling them (or even just attempting to fill them), it was not designed to quantify the numbers and rates of those vacancies. The 2005 Alaska Physician Task Force Report cited a survey done by the Alaska Family Medical Residency (AFMR) program that found a 16% vacancy rate for rural physician positions in Alaska, as well as several specialties in “serious shortage.”13
The Task Force also used data from the Alaska Division of Occupational Licensing, the Alaska State Medical Association (ASMA), and the American Medical Association (AMA) to estimate a statewide shortage of 375 physicians based on physician-to-population ratio. The Task Force estimated that Alaska would need to add 59 new physicians per year (it now nets 38 new physicians per year). Its report quantified the uneven distribution of Alaska’s physicians, showing the shortage was concentrated in rural areas. While this study also shed light on many of the underlying causes of the shortage, it did not quantify actual, current, or unmet needs in terms of numbers of actual physician vacancies. The Alaska Department of Labor “Quarterly Census of Employment & Wages” updates data quarterly for overall employment levels for classes of health-related employers (e.g., General Medical-Surgical Hospitals, Offices of Physicians).14
This yields data useful for tracking industry-wide macro trends but not data for specific occupations. The dramatic and rapid expansion of the RN program in the School of Nursing at the University of Alaska Anchorage (SON-UAA) is one of Alaska’s health workforce development success stories. To guide this expansion, the University began a biannual cross-sectional study to gauge the annual unmet need for nurses (quantified by the number of vacant positions and vacancy rates), and to gauge the ability of the job market to absorb new graduates of the expanding nursing program. The 2002-2003 study surveyed 47 organizations—including hospitals, tribal health organizations, nursing homes, large school districts, and large clinics—that reported 3,522 nursing positions with 275 of them vacant, for an 8% vacancy rate. Forty of those organizations
11 Alaska Center for Rural Health. “Status of Recruitment Resources and Strategies (SORRAS): 2003-2004.” http://nursing.uaa.alaska.edu/acrh/projects/report_sorras-04-05.pdf 12 Alaska Center for Rural Health. “Status of Recruitment Resources and Strategies (SORRAS): 2005-2006.” http://nursing.uaa.alaska.edu/acrh/projects/report_sorras-05-06.pdf 13 Alaska Physician Supply Task Force. “Securing an Adequate Number of Physicians for Alaska’s Needs.” Juneau: Alaska Department of Health and Social Services, 2006. 14 Alaska Department of Labor and Workforce Development, Research and Analysis Section. “Quarterly Census of Employment and Wages.” 2nd Quarter, 2006. Revised 1/18/2007. http://www.labor.state.ak.us/research/ee/ee20062.pdf
2009 AK Health Workforce Vacancy Study December 2009 ACRH and ISER
5
hired new graduates and indicated that they could absorb 68 new nursing graduates while filling those 275 vacancies.15
This biannual study was expanded in scope in 2003-2004 and again in 2005-2006, targeting over 200 health and health-related occupations. The studies surveyed almost 300 health organizations of all types—including hospitals and nursing homes, community health centers, dental clinics, physician-practice clinics, and behavioral health organizations—representing a substantial proportion of total statewide health professional employment. Data collected included number of positions and number of vacancies (from which vacancy rates were calculated), percentage of responding organizations that hire new graduates, and the number of vacant positions that could be filled by new graduates. The 2005-2006 study found that responding organizations had an overall physician vacancy rate of 11%, varying widely from 8% in Anchorage to 23% in the rural North/West region. Substantial vacancy rates were reported for Physical Therapy Assistant (25%), Psychologist (27%), Psychiatrist (20%), Emergency Medical Technician (26%), and Coding Specialist (28%). Substantial numbers of vacancies were reported for Certified Medical Assistant (38), Personal-Care Attendant (84), Physical Therapist (33), Certified Nursing Assistant (143), Licensed Practical Nurse (53), Community Health Aide/Practitioner (57), and Registered Nurse (272).16
Though its sample was by convenience and not representative of the state, the 2005-2006 study turned out to be an excellent model, yielding data extremely useful for strategic health workforce planning. As a result, the office of Karen Perdue, Associate VP for Health at the University of Alaska, and the Alaska Mental Health Trust Authority decided to fund the Alaska Center for Rural Health-Alaska’s AHEC (ACRH) to expand, refine, and execute a similar study. The 2007 study confirmed and quantified trends cited in recent studies and accumulated anecdotal evidence—despite the recent progress in training and deploying health personnel (such as Registered Nurses), critical shortages persist. The situation for key primary-care occupations—Family Physician, General Internist, Nurse Practitioner, and Physician Assistant—was troubling, particularly in the rural areas with numerous estimated vacancies and high estimated state vacancy rates between 15% and 20%. Though their vacancies were not numerous, Psychiatrists were particularly in demand (19.0% estimated vacancy rate) and difficult to recruit (mean vacancy length of 34.5 months). The national Pharmacist shortage apparently has hit Alaska hard, with high estimated vacancies (98) and an estimated vacancy rate of 23.7% affecting every region of the state. Therapists of all kinds—Physical, Occupational, Speech, and Speech-Language Pathologists—were in short supply (estimated vacancy rates ranging from 15.6% to 29.3%). No part of the state escaped the shortages, which were most acute in rural areas in terms of vacancy rate, but numerically high in the Anchorage/Mat-Su region. High numbers of vacancies and high vacancy rates were reported for key specialized nursing occupations, particularly for Nurse Case Manager, Nurse Practitioner, and Critical Care Nurse. These appeared to be the current areas of most critical
15 School of Nursing, University of Alaska Anchorage. “Telephone Survey Re: Registered Nurse Vacancies/New Grads – 2003.” Unpublished report. 16 School of Nursing, University of Alaska Anchorage. “Vacancy Rates – Health Professions – 2005 Survey.” Unpublished report.

2009 AK Health Workforce Vacancy Study December 2009 ACRH and ISER
6
shortage in nursing. The estimated Registered Nurse vacancy rate was moderate (8.0%), but this masked 10% rates in hospitals and tribal health organizations and an estimated rural rate of 16.1%. While the estimated Dentist vacancy rate was 10.3%, this masked a 15.3% estimated rural rate and the very high rate reported by tribal health organizations (42.0%), which had 39% of estimated Dentist vacancies. In the Behavioral Health occupational group, the most acute shortages—with both extremely high vacancy numbers and high vacancy rates—appeared to be among the occupations that fell under Human Services Worker. In addition, overall estimated Behavioral Health occupation vacancies were extremely numerous (1,033), approximately 29% of all estimated vacancies—more than any other occupational group. In Allied Health occupations, high vacancy rates were affecting employers of Physical Therapy Assistants and Respiratory Therapists. Sonographer vacancies were difficult to fill and reported Surgical Technician vacancies, though not numerous, were averaging 3-to-4 years in length. One hundred (100) vacancies and a vacancy rate of 18.1% were reported for Community Health Aide/Practitioners (CHA/Ps). Among “front office” and “back office” occupations, Coding Specialist and Certified Coder had 11% estimated vacancy rates and very long mean vacancy lengths. The managerial occupations for which high vacancy rates were reported were specifically health care related: Behavioral Health Supervisor, Clinical Department Manager, Health Information Manager, Medical Director, Nurse Manager, and Practice Manager. Behavioral health organizations had the most estimated managerial vacancies. Looking at respondent types, tribal health organizations reported the highest overall vacancy…But every respondent type was a locus for acute shortages in key occupations, such as clinics/offices of physicians for PAs, hospitals/nursing homes for RNs, pharmacies for Pharmacists, behavioral health organizations for Human Services Workers, and school districts for Speech-Language Pathologists. Higher vacancy rates were generally found in the rural respondents, particularly in the North/West and Southwest regions, which reported double digit vacancy rates for nearly all occupational groups, and overall vacancy rates around 20%.17 The key questions the current study sought to answer were the same as those in the 2007 study:
What health occupations were, at this time, most critically affected by shortages? Exactly how many vacancies currently remained unfilled? Where were these vacancies
regionally and in what organization types? What did employers perceive to be the major underlying causes of their vacancies? How many new trainees/graduates could the job market actually absorb annually, and
how many organizations could absorb them?
17 Alaska Center for Rural Health. “2007 Alaska Health Workforce Vacancy Study.” Executive Summary, July 2007.
2009 AK Health Workforce Vacancy Study December 2009 ACRH and ISER
7
II. Methodology A. Background 1. Advisory Group This study was designed in consultation with an advisory group (see acknowledgements) that included the Alaska Mental Health Trust Authority (AMHTA), Alaskans for Access to Health Care (ACCESS), and the University of Alaska Anchorage (UAA). The advisory group provided input and guidance for (1) selecting targeted occupations, (2) reviewing the study instrument, and (3) providing comments and revisions for this report. 2. Unit of Analysis The unit of analysis was the employment site by organization type, which allowed for the allocation of positions and vacancies by geographic region. For each employer, we identified the staff person most knowledgeable about hiring and vacancies. In large organizations this meant that one employer might provide information about multiple sites and organization types; smaller employers were responsible for only a single site. 3. Study Questions The study targeted 93 health occupations selected in consultation with the advisory group described above (see Table 14 or Appendix A). For the 93 targeted occupations, the following study questions included:
(1) How many budgeted positions, either full- or part-time, existed in organizations providing health services in Alaska? We asked respondents for the number of budgeted staff positions, not relief/temporary/locums/travelers/contract positions; unless these latter positions were used to temporarily fill budgeted (but currently vacant) staff positions. Respondents included part time positions which resulted in our counting full time equivalent (FTE) rather than individuals (“bodies”). In situations where a position was divided among more than one occupation (e.g., Dental Assistant and Billing Clerk), the respondent asked to count the position under what they considered the position’s “primary occupation.”
(2) How many of these budgeted positions were currently vacant? This was a point-in-time cross-sectional study. Recently filled vacancies or imminent vacancies were not counted. Positions filled by relief/temporary/locum/contract health workers were counted as vacancies only if these workers were temporarily filling a currently vacant budgeted position.
(3) What was the vacancy rate? This was derived from the proportion of budgeted positions [denominator] that were currently vacant [numerator], expressed as a percentage.
(4) How many of the organizations that employ these occupations hired new graduates of training programs?

2009 AK Health Workforce Vacancy Study December 2009 ACRH and ISER
8
(5) How many of the currently vacant budgeted positions (#2) could be filled by new graduates of training programs?
(6) What were the mean and maximum length of time, expressed in months, that the vacancies have existed?
Another question applied to each respondent organization, not to specific occupations: (7) What were the principal underlying causes of vacancies? Respondents were asked to cite
what they believed to be the top two underlying causes for vacancies opening or remaining unfilled.
B. Methods 1. Population All identified health service-providing organizations (public, tribal, private non-profit, and private for-profit) were included in the population. Satellite facilities managed by a parent organization, regardless of their type, were counted as individual employment sites (e.g., behavioral health facilities, hospitals of tribal health organizations, and satellite laboratories of hospitals). The population for 10 of the organization types was duplicated from the 2007 Alaska Health Workforce Vacancy Study. The final two organization types, Paramedics and State and Municipal health, were added after data collection had begun at the request of UAA Allied Health Programs and the Vice Provost of Health Programs. Paramedics in non-health organizations and the Municipality of Anchorage had not been in the 2007 study. To capture Paramedics, we included non-health services employers: fire department/emergency services (military, borough, municipality—paid and volunteer), air medevac services, and airports. We also include firefighters with emergency medical services training. We used a list of paramedic employers compiled in 2007 by the paramedic faculty of the University system (Fire and Emergency Services Program in Allied Health) with consultation from the State Emergency Medical Services office. We created the population listing for the 12th type, State and Municipal (employers of public health nurses), which includes just two employers - the State of Alaska, Department of Health and Social Services, Division of Public Health, Public Health Nursing (with 23 sites) and the Municipality of Anchorage, Department of Health and Human Services, Community Health Services Division (with one site). We completed our employer-site list with the assistance of the Chief of Public Health Nursing for the State of Alaska Department of Health and Social Services and the manager of Municipality of Anchorage, Department of Health and Human Services, Community Health Services Division. Twelve organization types were defined and a sampling frame created, consisting of every organization in the state of Alaska identified for each defined type. Figure 1 and Table 2 present the population, listing the organization types and the number of employment sites identified for each type. Due to time and budget constraints we were not able to update the 2007 (2 year old) population lists.

2009 AK Health Workforce Vacancy Study December 2009 ACRH and ISER
9
Figure 1. Statewide Population of Employment Sites by Organization Type
Behavioral Health
Services 13%
Dental Clinics/Offices
21%
Hospitals/ Nursing Homes
1%Diagnostic
Imaging Centers
1%
Diagnostic Laboratories
1%
Medical Clinics/Offices of Physicians
38%
Paramedic Sites7%
Pharmacies 3%
Physical/ Occupational/
Speech Therapy Facilities
7%
School Districts
4%
State/ Municipal
2%
Tribal Health Organizations
2%
Sample n=1,476

2009 AK Health Workforce Vacancy Study December 2009 ACRH and ISER
10
Table 2. Number and Percentage of 2009 Statewide Population of Employment Sites by Organization Type
Organization Type 2009 Statewide Population of
Employment Sites Percentage
Behavioral Health Services e,g,h 191 12.9% Dental Clinics/Offices d,h 309 20.9% Hospitals/Nursing Homes i 23 1.6% Diagnostic Imaging Centers h 17 1.2% Diagnostic Laboratories 20 1.4% Medical Clinics/Offices of Physicians b,c,h 556 37.7% Paramedic Sites j 101 6.8% Pharmacies f,h 42 2.8% Physical/Occupational/Speech Therapy Facilities g,h 107 7.2% School Districts 55 3.7% State/Municipal k 24 1.6% Tribal Health Organizations a 31 2.1% Total 1,476 100.0%
(a) As defined by and under contract with the Indian Health Service (b) Includes SOA Public Health Nursing, Alaska VA System, and boroughs providing health services (c) Includes single-provider shops with non-provider staff (d) Both multi-provider clinics and single-provider shops with non-provider staff (e) Includes organizations providing mental health services, substance abuse/chemical dependency counseling and treatment services, disability services, child development services, at-risk youth services, and senior independent and assisted living services (f) Multi-facility chains with a centralized human resources department were counted as one organization (g) Excluding self-employed providers (i.e., single-provider shops without non-provider staff); includes chiropractic offices that employ Physical and Occupational Therapists (h) Does not include satellites/departments of other organization types (i) Includes only civilian employees of military hospitals; includes psychiatric hospitals and in-patient psychiatric facilities; includes only large (10+ bed) nursing homes; does not include hospitals managed by tribal health organizations (j) Includes Fire department/emergency services (military, borough, municipality – paid and volunteer), air medevac services, and airports (k) Includes State of Alaska, Department of Health and Social Services, Division of Public Health, Public Health Nursing and the Municipality of Anchorage, Department of Health and Human Services, Community Health Services Division.
2. Sample We conducted a census of seven or the organization types, and sampled from the population of the other five (Table 3). A full census was attempted for diagnostic imaging centers, hospitals and nursing homes, diagnostic laboratories, pharmacies, school districts, and tribal health organizations in order to (1) capture complete statewide data set for these health service organizations for the benefit of study stakeholders and (2) efficiently capture, in these large organizations, a majority of the statewide employment for many of the key targeted occupations.

2009 AK Health Workforce Vacancy Study December 2009 ACRH and ISER
11
For the remaining organization types, sampling was done by type of health organization in order to derive a representative sample, and to generate findings that could be generalized to the entire state. We used a sample size calculator by Raosoft (www.ezsurvey.comsamplesize.html) to determine our target sample size for Behavioral Health Services, Dental Clinics, Medical Clinics, Paramedic Sites, and Physical/Occupational/Speech Therapy Facilities organization types. We used a confidence level of 95% with a margin of error of 5% to calculate the recommended sample sizes. A random sample was generated by placing the list of organizations by type in Excel spreadsheets. Using Excel we generated a random number for each organization. We selected the sample based on the order of the randomly generated number.
Table 3. Census or Target Sample Size by Organization Type
Type of Organization Number Census Diagnostic Imaging Centers 17
Hospitals/Nursing Homes 23* Diagnostic Laboratories 20 Pharmacies 42 School Districts 55 State/Municipal 24 Tribal Health Organizations 31*
Target Sample Size
Behavioral Health Services 128 Dental Clinics/Offices 172 Medical Clinics/Offices of Physicians 227 Paramedic Sites 81 Physical/Occupational/Speech Therapy Facilities 84
Total 904 *For hospitals and Tribal Health Organizations, one organization in each of these groups chose not to participate.
3. The Study Instrument The Study Instruments (see Appendix B) were adapted from the instrument successfully used in the 2005 Workforce/Vacancy Study conducted by the University of Alaska Anchorage School of Nursing, and the 2007 Alaska Health Workforce Vacancy Study conducted by ACRH. An introductory page explained the purpose of the study, listed options for conveying the completed survey, provided the study questions, and clarifications and definitions of key terms, such as “position” and “vacancy.” The body of the instrument was a simple matrix/grid, with questions as the horizontal axis and the targeted occupations as the vertical axis—the latter organized by occupational groups. Space at the end was provided for respondents to add occupations not listed in the instrument. The instrument concluded with the final question regarding principal underlying causes of vacancies as well as a space to provide comments and suggestions. For ease of use and to increase response rate, the instrument was tailored to each organization type by eliminating occupations it did not typically employ. Large organizations (e.g., hospitals) received instruments with the complete list of occupations.

2009 AK Health Workforce Vacancy Study December 2009 ACRH and ISER
12
C. Data Collection The data collection plan consisted of (1) a mail-out of a hard copy of the survey instrument to all sampled organizations, followed by (2) telephone calls from trained interviewers who provided clarification, guidance, and options for returning the completed survey, which included mail, fax, and e-mail. Organizations chosen for sampling were mailed a hard copy of their tailored survey instrument, accompanied by a letter (see Appendix C) explaining the purpose of the study, and a self-addressed, stamped envelope for returning the survey. Interviewers received intensive training in the purpose and methodology of the study and were provided scripts to guide their communications. Their understanding and communication skills were developed and tested via role-playing; subsequent monitoring of their work provided ongoing quality assurance. Interviewers contacted organizations in order to confirm receipt of the mail-out, provide clarification and guidance, and offer the options of returning the completed survey form by mail, fax, or e-mail, or by responding to the interviewer over the phone. Contacts were documented on each survey. Surveys were reviewed daily by the survey supervisor. Every sampled organization received at least one follow-up call from an interviewer (unless they promptly returned the survey via mail before receiving a call). Organizations were re-contacted as needed until they either completed the survey or declined to respond. To acquire the target sample size of completed surveys we replaced organizations with the next on the randomized listing when we determined there was no current practice; phone disconnected; duplicate organization; organization did not fit the study criteria; unable to locate; post office returned mail; or we had an incorrect telephone number. Since the unit of analysis was employment by organization site, total sample organizations increased as satellite employment sites were separated from the parent organization. The revised sample is displayed in (Figure 2 and Table 4).

2009 AK Health Workforce Vacancy Study December 2009 ACRH and ISER
13
Figure 2. Revised Sample by Organization Type
Behavioral Health
Services, 160, 15%
Dental Clinics/Offices
, 215, 20%
Diagnostic Imaging
Centers, 17, 2%
Hospitals/ Nursing
Homes, 23, 2%Diagnostic
Laboratories, 20, 2%
Medical Clinics/Offices of Physicians,
287, 27%
Tribal Health Organizations,
31, 3%
Pharmacies, 42, 4%
Physical/ Occupational/Speech Therapy Facilities, 107,
10%
School Districts, 55,
5%
Paramedic Sites, 83, 8%
State/ Municipal
Government, 24, 2%
Sample n=1064
Table 4. Revised Sample Size by Organization Type
Number Percent Behavioral Health Services 160 15% Dental Clinics/Offices 215 20% Diagnostic Imaging Centers 17 2% Hospitals/Nursing Homes 23 2% Diagnostic Laboratories 20 2% Medical Clinics/Offices of Physicians 287 27% Tribal Health Organizations 31 3% Pharmacies 42 4% Physical/Occupational/Speech Therapy Facilities 107 10% School Districts 55 5% Paramedic Sites 83 8% State/Municipal Government 24 2% Total 1064 100%
All surveys received were reviewed for completeness and internal consistency. When necessary, incomplete or inconsistent surveys were returned to interviewers for resolution with the respondent organization.

2009 AK Health Workforce Vacancy Study December 2009 ACRH and ISER
14
Data collection commenced on March 9, 2009, and concluded on June 26, 2009. Additional data was collected in October 2009 for was on public health nurses by state and municipal government.
D. Data Analysis 1. Response Rates Table 5 shows the response rate for each organization type and for the overall study. Response rates are calculated by dividing the number of completed surveys (column A) by the number of valid sampled organizations (column C minus column D)– that is, the sample minus organizations that are no longer in service; do not fit the study criteria, etc. As Table 5 shows, response rates varied between organization types. Not surprisingly, the highest response rates were in those categories for which we had chosen to conduct a census, ranging from 92.9% to 100%. Other organization types still had high response rates, from 82.8% to 98.4%, and the overall response rate for the study is just under 95%. This high response rate gives us confidence that the results are not likely affected by response bias.
Table 5. Response Rates by Organization Type
Organization Type
A B C D C - D A/(C-D)
Complete Surveys
Refusal Revised Sample
No Longer in Service,
etc.
Valid Sampled Org-sites
Response Rates
Diagnostic Imaging Centers 16 0 17 1 16 100.0% Paramedic Sites 77 0 83 6 77 100.0% Pharmacies 36 0 42 6 36 100.0% School Districts 53 0 55 2 53 100.0%
State/Municipal 24 0 24 0 24 100.0%
Tribal Health Organizations 29 1 31 1 30 96.7% Hospitals/Nursing Homes 22 1 23 0 23 95.7% Diagnostic Laboratories 14 0 20 6 14 92.9% Behavioral Health Services 84 11 160 65 95 88.4% Medical Clinics/Offices of Physicians 187 31 287 69 218 85.8% Physical/Occupational/Speech Therapy Facilities
68 12 107 27 80 85.0%
Dental Clinics/Offices 154 32 215 29 186 82.8%
Total 764 88 1064 212 852 89.7%

2009 AK Health Workforce Vacancy Study December 2009 ACRH and ISER
15
2. Weighting—Statewide Estimates and Aggregation by Organization Type
Statewide estimates for positions and vacancies were derived by weighting the sample to the total population from which the sample was drawn. For this study, the population was employment sites (employer sites) of health care workers in the state of Alaska. We stratified the sample by 12 organizational types. As described in B.1. Population (above) we used the population list developed by ACRH for a 2007 study for 10 types; a list compiled 2007 by the paramedic faculty of the University system for paramedics, and developed a new list for State and Municipal (employers of public health nurses), We updated the 2007 population lists as information emerged during interviews, deleting employers who were no longer in business, correcting information where clinics or offices had changed ownership and adding sites where a single employer had multiple employment sites. Table 6, below, shows the total number of organizations in each type, the number in the sample, the number of completed interviews and the resulting population weight.
Table 6. Weight, Completed Surveys, Original Population Listing, and Census or Sample by Organization Type
Organization Type Census
or Sample
Original Population
Listing
Population corrected for
out of business, etc
Completed Surveys
Weight
Diagnostic Imaging Census 17 16 16 1.00 Hospitals/Nursing Homes Census 23 23 22 1.00* Diagnostic Laboratories Census 20 14 14 1.00 School Districts Census 55 53 53 1.00 Tribal Health Organizations Census 31 30 29 1.00* State/Municipal Census 24 24 24 1.00 Pharmacies Census 42 36 36 1.00 Phys/Occ/Speech Therapists Sample 107 80 68 1.18 Paramedic Sample 101 95 77 1.23 Behavioral Health Sample 191 126 84 1.50 Dental Clinics Sample 309 280 154 1.82 Med Clinics/Dr Offices Sample 556 487 187 2.60 Total 1476 1264 764
* Hospitals/Nursing Homes and Tribal Health Organizations are treated as if all those sampled had responded; see below.
We attempted to interview all employers in seven organization types, and achieved a census for Diagnostic Imaging, Laboratories, Pharmacies, School Districts, and the State of Alaska/ Municipality of Anchorage organization types. For hospitals and Tribal Health Organizations, one organization in each of these groups chose not to participate. They are a small hospital and a tribal health center in southeast Alaska. Each of these organizations is much smaller than the average size of others in their respective groups. We chose to settle for a slight under count in these two groups rather than an over count and are weighting each these groups at 1.0.

2009 AK Health Workforce Vacancy Study December 2009 ACRH and ISER
16
3. Quantitative Data Quantitative survey data were entered directly into SPSS (Statistical Package for the Social Sciences version 15). After cleaning, data were analyzed utilizing this software and Statistical Analysis Software (SAS). The principal outcomes of analysis for each occupation studied were defined as (1) total number of positions reported in the sample; (2) total number of vacancies reported in the sample; (3) vacancy rate of the sample computed with #2 as numerator and #1 as denominator; (4) proportion of responding organizations in the sample that employ the occupation (denominator) and that indicated they hired new graduates (numerator), expressed as a percentage; (5) total number of vacancies in the sample for which new graduates would be considered; (6) mean length of vacancies in the sample, expressed in months; and, (7 ) aggregated principal reasons cited for vacancies as reported in the sample. In addition, population estimates were generated for the variables 1 to 3, 5, and 6, listed above. Ninety-five percent (95%) confidence intervals at α=.05 were generated for variables 1, 2, 5, and 6 and are reported in Appendix D. Details on our procedure for generating the confidence intervals are also described in Appendix D. 4. Qualitative Data For the survey question about the top two underlying causes of vacancies, respondents were given the option of writing in reasons not listed. Similar write-in reasons were grouped into categories which were then added to the analysis. The frequency distribution of all cited reasons was then calculated using SPSS. Occupations not listed in the study instruments that were provided by the respondents and the comments/suggestions section of the survey were recorded in Excel. The frequency distributions of the added occupations were calculated in Excel. The comments and suggestions were analyzed using conceptual/thematic descriptions of the data based on open coding. 5. Geographic Regions We assigned the organizations an urban or rural and labor market designation based the 2007 study for comparability with the 2007 data. a. Urban and Rural We analyzed data for urban and rural employment sites. Respondents were classified “urban” if they were located in one of the following urban or suburban/”bedroom” communities: Anchorage, Eagle River/Chugiak, Fairbanks, North Pole, or Juneau. All other communities were classified as “rural.” (see Table 7). Every organization was assigned to its appropriate urban or rural geographic region. In addition, within each region, each organization was identified by community.
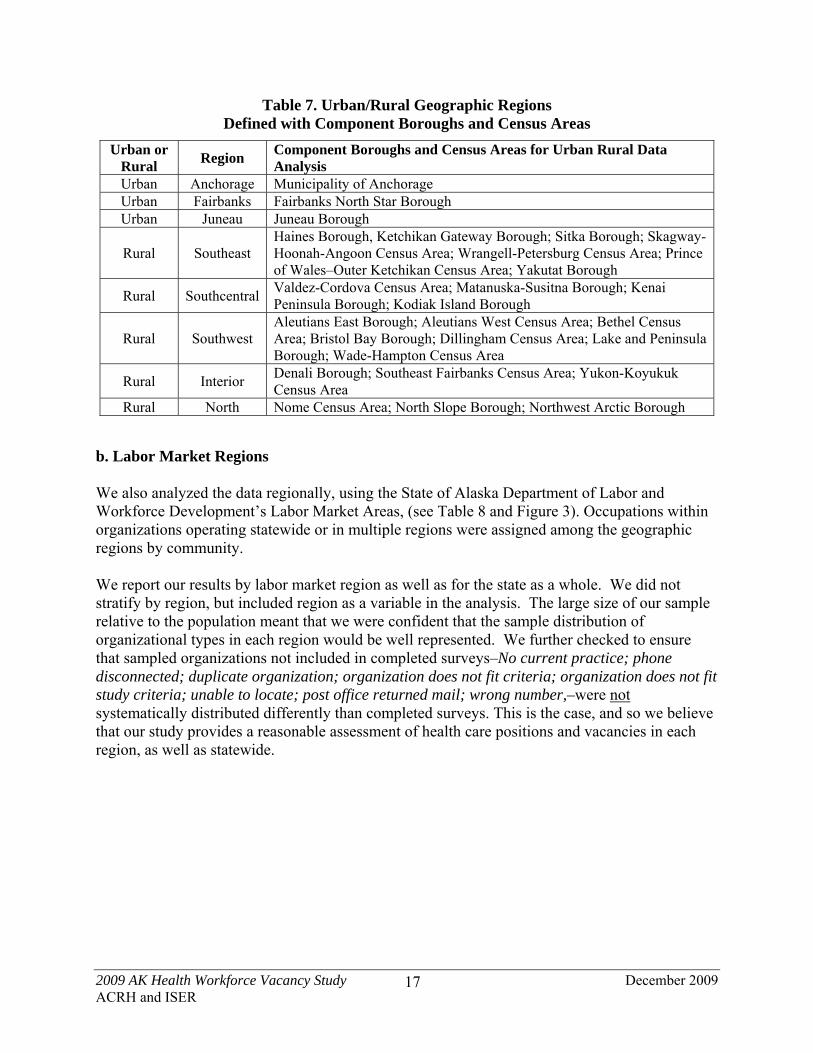
2009 AK Health Workforce Vacancy Study December 2009 ACRH and ISER
17
Table 7. Urban/Rural Geographic Regions Defined with Component Boroughs and Census Areas
Urban or Rural
Region Component Boroughs and Census Areas for Urban Rural Data Analysis
Urban Anchorage Municipality of Anchorage Urban Fairbanks Fairbanks North Star Borough Urban Juneau Juneau Borough
Rural Southeast Haines Borough, Ketchikan Gateway Borough; Sitka Borough; Skagway-Hoonah-Angoon Census Area; Wrangell-Petersburg Census Area; Prince of Wales–Outer Ketchikan Census Area; Yakutat Borough
Rural Southcentral Valdez-Cordova Census Area; Matanuska-Susitna Borough; Kenai Peninsula Borough; Kodiak Island Borough
Rural Southwest Aleutians East Borough; Aleutians West Census Area; Bethel Census Area; Bristol Bay Borough; Dillingham Census Area; Lake and Peninsula Borough; Wade-Hampton Census Area
Rural Interior Denali Borough; Southeast Fairbanks Census Area; Yukon-Koyukuk Census Area
Rural North Nome Census Area; North Slope Borough; Northwest Arctic Borough b. Labor Market Regions We also analyzed the data regionally, using the State of Alaska Department of Labor and Workforce Development’s Labor Market Areas, (see Table 8 and Figure 3). Occupations within organizations operating statewide or in multiple regions were assigned among the geographic regions by community. We report our results by labor market region as well as for the state as a whole. We did not stratify by region, but included region as a variable in the analysis. The large size of our sample relative to the population meant that we were confident that the sample distribution of organizational types in each region would be well represented. We further checked to ensure that sampled organizations not included in completed surveys–No current practice; phone disconnected; duplicate organization; organization does not fit criteria; organization does not fit study criteria; unable to locate; post office returned mail; wrong number,–were not systematically distributed differently than completed surveys. This is the case, and so we believe that our study provides a reasonable assessment of health care positions and vacancies in each region, as well as statewide.

2009 AK Health Workforce Vacancy Study December 2009 ACRH and ISER
18
Table 8. Labor Market Areas and Component Boroughs/Census Areas
Region Component Boroughs and Census Areas
Southeast Juneau Borough; Haines Borough; Ketchikan Gateway Borough; Sitka Borough; Skagway-Hoonah-Angoon Census Area; Wrangell-Petersburg Census Area; Prince of Wales–Outer Ketchikan Census Area; Yakutat Borough
Anchorage/Mat-Su Municipality of Anchorage; Matanuska-Susitna Borough
Gulf Coast Valdez-Cordova Census Area; Kenai Peninsula Borough; Kodiak Island Borough
Southwest Aleutians East Borough; Aleutians West Census Area; Bethel Census Area; Bristol Bay Borough; Dillingham Census Area; Lake and Peninsula Borough; Wade-Hampton Census Area
Interior Fairbanks North Star Borough; Denali Borough; Southeast Fairbanks Census Area; Yukon-Koyukuk Census Area
North Nome Census Area; North Slope Borough; Northwest Arctic Borough
Figure 3. Responding Organizations by Geographic Region
Southwest
North/West
Interior
Fairbanks
Anchorage
Southcentral
SoutheastJuneau

2009 AK Health Workforce Vacancy Study December 2009 ACRH and ISER
19
III. Limitations of Study A study of this magnitude and complexity inevitably carries numerous limitations and the reader is cautioned to keep these limitations in mind. Population We were not able to update the 2007 population listing before data collection due to time and budget constraints. This may result in an under count of new organizations that have opened in the last two years. During data collection we corrected contact information. We deleted organizations that had no current practice; phone disconnected; duplicate organization; organization does not fit study criteria; unable to locate; post office returned mail; and wrong number. We added organization sites as we were able to separate satellite locations from their parent organization. Since we did not go back to the unsampled part of the population listing this may result in an over count in the total population organizations. The 2007 population was 1476 minus the 212 organizations that were excluded resulted in a revised 2009 population of 1264. Data Collection There may be issues of reliability of responses between organizations. For example, occupational titles are often respondent-specific or an artifact of organizational personnel systems; two organizations may have different job titles for what is effectively the same job. In addition, when respondents were asked to count employees wearing multiple job “hats” under what they considered their “primary” occupation, the respondents may not have used consistent criteria for making this determination. Lastly, interviewers sometimes found that respondents did not count vacancies when they provided the total number of positions. This error if not caught would inflate the vacancy rate. While the large majority of respondents spoke to interviewers who verified that “positions” included currently vacancies (vacant positions), there was not enough time or resources to verify this with 223 organizations that responded only by mail. Non-responses for number of “new grad vacancies” were counted as “0.” This may have resulted in under-estimation of numbers of new graduate vacancies. Also, the study was not designed to capture positions in one-person shops or the entire state universe of many occupations, including Certified Nursing Assistant, Home Health Aide, Personal Care Attendant, EMT/ETT, Massage Therapist, Optical/Eye-Care Technician, Optician, Optometrist, Dietician, Nutritionist, and various non-health-care-specific managerial occupations (e.g., Human Resources Manager, Business Manager). The study was not designed to capture the universe of contract health workers; however, 44 organizations reported no health-related positions but had contract health workers. They are included in the study analysis. Their breakdown is shown in Table 9.

2009 AK Health Workforce Vacancy Study December 2009 ACRH and ISER
20
Table 9. Organizations with Contract Health Workers
Organization Type Number Percent Behavioral Health Services 5 11.4% School Districts 37 84.1% Paramedic Sites 2 4.5% Total 44 100.0%
Estimates and Confidence Intervals
Limitations of the confidence intervals are discussed in Appendix D.

2009 AK Health Workforce Vacancy Study December 2009 ACRH and ISER
21
IV. Findings The sample of 1,064 employment sites is 72.1% of the statewide population (1064/1476). The 764 completed responses is 51.8% of the statewide population (764/1476), and 71.8% of the sample population (764/1064). Figure 4 and Table 10 break out the 764 responding employment sites by organization type. Figure 5 shows the sample by rural and urban areas. Tables 11 and 12 provide detail on responding organization types by urban and rural regions. In addition, Figure 6 gives information on the responding organizations by geographic regions of the state with Tables 12 and 13 showing detail of organization type by geographic region.
Figure 4. Responding Organizations by Organization Type
Behavioral Health
Services, 84, 11%
Dental Clinics/ Offices, 154,
20%
Diagnostic Imaging
Centers, 16, 2%
Hospitals/ Nursing
Homes, 22, 3%Diagnostic
Laboratories, 14, 2%
Medical Clinics/Offices of Physicians,
187, 24%
Tribal Health Organizations,
29, 4%
Pharmacies, 36, 5%
Physical/Occupational/
Speech Therapy
Facilities, 68, 9%
School Districts, 53,
7%
Paramedic Sites, 77, 10%
State/ Municipal
Government, 24, 3%
Sample n=764

2009 AK Health Workforce Vacancy Study December 2009 ACRH and ISER
22
Table 10. Responding Organizations by Organization Type
Respondents Organization Type Number Percent Behavioral Health Services 84 11.0% Dental Clinics/Offices 154 20.2% Diagnostic Imaging Centers 16 2.1% Hospitals/Nursing Homes 22 2.9% Diagnostic Laboratories 14 1.8% Medical Clinics/Offices of Physicians 187 24.5% Tribal Health Organizations 29 3.8% Pharmacies 36 4.7% Physical/Occupational/Speech Therapy Facilities 68 8.9% School Districts 53 6.9% Paramedic Sites 77 10.1% State/Municipal Government 24 3.1% Total 764 100.0%
Figure 5. Responding Organizations by Urban vs. Rural
Urban, 424, 55%
Rural, 340, 45%
Sample n=764

2009 AK Health Workforce Vacancy Study December 2009 ACRH and ISER
23
Table 11. Percent within Urban/Rural by Responding Organization Type
Percent within Urban vs. Rural Designation Urban Rural Total Organization Type Number Percent Number Percent Number Percent Behavioral Health Services 44 10% 40 12% 84 11%
Dental Clinics/Offices 109 26% 45 13% 154 20%
Diagnostic Imaging Centers 12 3% 4 1% 16 2%
Hospitals/Nursing Homes 10 2% 12 4% 22 3%
Diagnostic Laboratories 9 2% 5 1% 14 2%
Medical Clinics/Offices of Physicians 135 32% 52 15% 187 24%
Tribal Health Organizations 8 2% 21 6% 29 4%
Pharmacies 20 5% 16 5% 36 5% Physical/Occupational/Speech Therapy Facilities
47 11% 21 6% 68 9%
School Districts 6 1% 47 14% 53 7%
Paramedic Sites 21 5% 56 16% 77 10%
State/Municipal Government 3 1% 21 6% 24 3%
Total 424 100% 340 100% 764 100%
Table 12. Percent Urban/Rural Designation by Responding Organization Type
Percent Urban vs. Rural by Organization Type Urban Rural Total Organization Type Number Percent Number Percent Number Percent Behavioral Health Services 44 52% 40 48% 84 100%
Dental Clinics/Offices 109 71% 45 29% 154 100%
Diagnostic Imaging Centers 12 75% 4 25% 16 100%
Hospitals/Nursing Homes 10 45% 12 55% 22 100%
Diagnostic Laboratories 9 64% 5 36% 14 100%
Medical Clinics/Offices of Physicians 135 72% 52 28% 187 100%
Tribal Health Organizations 8 28% 21 72% 29 100%
Pharmacies 20 56% 16 44% 36 100% Physical/Occupational/Speech Therapy Facilities
47 69% 21 31% 68 100%
School Districts 6 11% 47 89% 53 100%
Paramedic Sites 21 27% 56 73% 77 100%
State/Municipal Government 3 13% 21 88% 24 100%
Total 424 55% 340 45% 764 100%
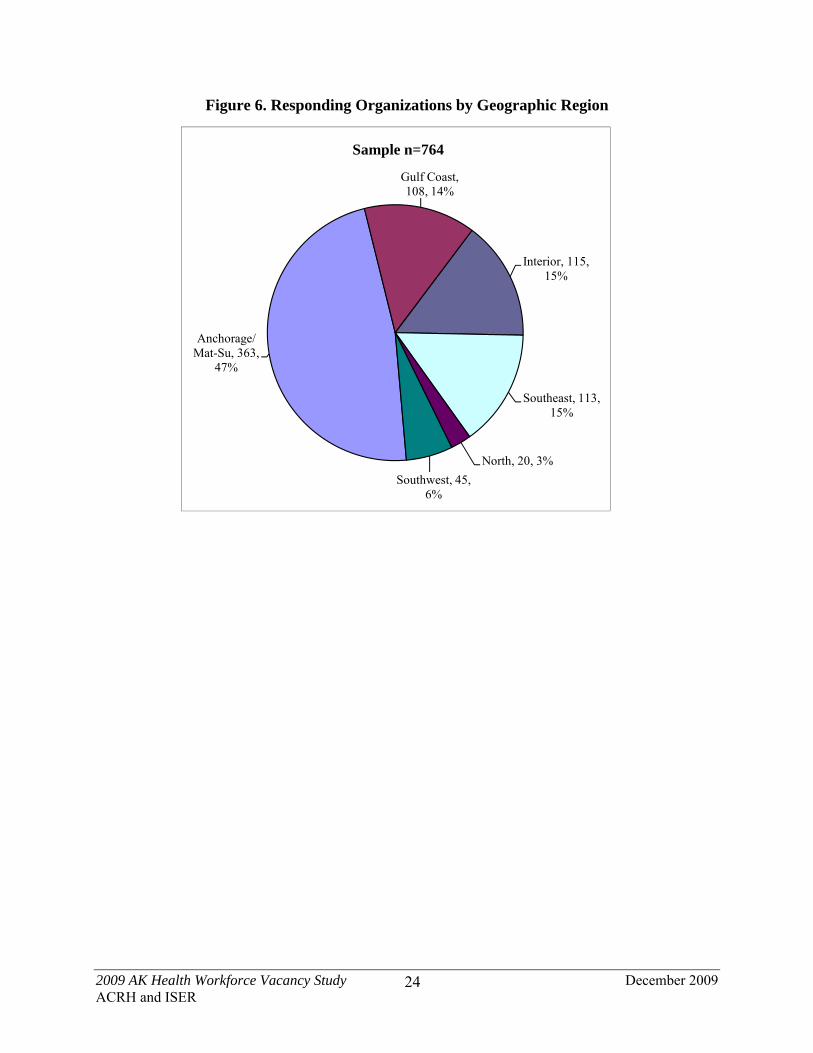
2009 AK Health Workforce Vacancy Study December 2009 ACRH and ISER
24
Figure 6. Responding Organizations by Geographic Region
Anchorage/ Mat-Su, 363,
47%
Gulf Coast, 108, 14%
Interior, 115, 15%
Southeast, 113, 15%
North, 20, 3%
Southwest, 45, 6%
Sample n=764

2009 AK Health Workforce Vacancy Study December 2009 ACRH and ISER
25
Table 13. Percent within Geographic Region by Responding Organization Type
Organization Type Anchorage/
Mat-Su Gulf
Coast Interior Southeast North Southwest Total
Behavioral Health Services Number 39 13 11 17 2 2 84 Percent 11% 12% 10% 15% 10% 4% 11%
Dental Clinics/Offices Number 92 21 21 15 1 4 154 Percent 25% 19% 18% 13% 5% 9% 20%
Diagnostic Imaging Centers Number 11 2 2 1 0 0 16 Percent 3% 2% 2% 1% 0% 0% 2%
Hospitals/Nursing Homes Number 7 7 2 6 0 0 22 Percent 2% 6% 2% 5% 0% 0% 3%
Diagnostic Laboratories Number 10 1 2 1 0 0 14 Percent 3% 1% 2% 1% 0% 0% 2%
Medical Clinics/Offices of Physicians Number 119 15 28 20 0 5 187 Percent 33% 14% 24% 18% 0% 11% 24%
Tribal Health Organizations Number 6 10 3 4 2 4 29 Percent 2% 9% 3% 4% 10% 9% 4%
Pharmacies Number 15 7 4 10 0 0 36 Percent 4% 6% 3% 9% 0% 0% 5%
Physical/Occupational/Speech Therapy Facilities
Number 42 10 12 4 0 0 68 Percent 12% 9% 10% 4% 0% 0% 9%
School Districts Number 4 4 10 18 4 13 53 Percent 1% 4% 9% 16% 20% 29% 7%
Paramedic Sites Number 15 12 15 10 11 14 77 Percent 4% 11% 13% 9% 55% 31% 10%
State/Municipal Government Number 3 6 5 7 0 3 24 Percent 1% 6% 4% 6% 0% 7% 3%
Total Number 363 108 115 113 20 45 764 Percent 100% 100% 100% 100% 100% 100% 100%

2009 AK Health Workforce Vacancy Study December 2009 ACRH and ISER
26
Table 14. Percent in Geographic Region by Responding Organization Type
Organization Type Anchorage/
Mat-Su Gulf
Coast Interior Southeast North Southwest Total
Behavioral Health Services Number 39 13 11 17 2 2 84 Percent 46% 15% 13% 20% 2% 2% 100%
Dental Clinics/Offices Number 92 21 21 15 1 4 154 Percent 60% 14% 14% 10% 1% 3% 100%
Diagnostic Imaging Centers Number 11 2 2 1 0 0 16 Percent 69% 13% 13% 6% 0% 0% 100%
Hospitals/Nursing Homes Number 7 7 2 6 0 0 22 Percent 32% 32% 9% 27% 0% 0% 100%
Diagnostic Laboratories Number 10 1 2 1 0 0 14 Percent 71% 7% 14% 7% 0% 0% 100%
Medical Clinics/Offices of Physicians Number 119 15 28 20 0 5 187 Percent 64% 8% 15% 11% 0% 3% 100%
Tribal Health Organizations Number 6 10 3 4 2 4 29 Percent 21% 34% 10% 14% 7% 14% 100%
Pharmacies Number 15 7 4 10 0 0 36 Percent 42% 19% 11% 28% 0% 0% 100%
Physical/Occupational/Speech Therapy Facilities
Number 42 10 12 4 0 0 68 Percent 62% 15% 18% 6% 0% 0% 100%
School Districts Number 4 4 10 18 4 13 53 Percent 8% 8% 19% 34% 8% 25% 100%
Paramedic Sites Number 15 12 15 10 11 14 77 Percent 19% 16% 19% 13% 14% 18% 100%
State/Municipal Government Number 3 6 5 7 0 3 24 Percent 13% 25% 21% 29% 0% 13% 100%
Total Number 363 108 115 113 20 45 764 Percent 48% 14% 15% 15% 3% 6% 100%

2009 AK Health Workforce Vacancy Study December 2009 ACRH and ISER
27
To assist with the interpretation of the estimated vacancy rates we have used the following scale in our textual description of the numeric data in the tables.
Vacancy Rate Descriptor 0% to 5% Low 6% to 10% Moderate 11% to 20% Substantial 21% to 30% High Over 30% Very High
Highlights of the findings are presented in section IV of this report. More detailed information is printed in Appendices E-F. Note: position, vacancies, and vacancy rates are rounded to one decimal place.

2009 AK Health Workforce Vacancy Study December 2009 ACRH and ISER
28
A. Quantitative Data 1. General Distribution of Positions and Vacancies Table 15 lists the 93 identified occupations categorized by specific occupational groups.
Table 15. Categorization of Occupations
Physicians 1. Emergency Physician 2. Family Physician 3. General Internist 4. Psychiatrist 5. Radiation Oncologist 6. Radiologist
Professional Nurses 7. Case Manager/Nurse Case
Manager 8. Critical Care/Emergency
Room/Intensive Care Unit Nurse
9. Family Nurse Practitioner 10. Nurse Anesthetist 11. Nurse Consultant 12. Nurse Educator 13. Nurse-Midwife 14. Pediatric Nurse-Practitioner 15. Psychiatric Nurse 16. Psychiatric Nurse-
Practitioner 17. Public Health Nurse 18. Registered Nurse 19. Women’s Health Care Nurse
Practitioner 20. Nurse Manager
Other Nursing Staff 21. Certified Nursing Assistant 22. Home Health Aide 23. Licensed Practical Nurse 24. Personal Care Attendant
Other Clinicians/Therapists 25. Physician Assistant 26. Dentist 27. Occupational Therapist 28. Pharmacist 29. Physical Therapist 30. Speech Therapist 31. Speech-Language Pathologist
Behavioral Health 32. Behavioral Health
Aide/Village Counselor 33. Behavioral Health Clinician
34. Chemical Dependency/ Substance-Abuse Counselor
35. Case Mgr/Care Coordinator 36. Human Services Worker/HS 37. Human Services Worker/AA 38. Marital/Family Therapist 39. Licensed Professional
Counselor 40. Psychiatric Aide/Technician 41. Psychologist/Psych Associate 42. Clinical Psychologist (PhD) 43. Social Worker—BSW,
MSW, LCSW
Allied Health 44. Clinical Lab Assistant 45. Dental Assistant 46. Dental Health Aide Therapist 47. Dental Hygienist 48. Echocardiography
Technician 49. EEG Technician 50. EKG Technician 51. EMT/ETT 52. Mammographer 53. Massage Therapist 54. Medical Assistant 55. Medical Lab Technician 56. Medical Technologist 57. MRI/CT Technician 58. Nuclear Medicine Technician 59. Paramedic 60. Pharmacy Technician 61. Phlebotomist 62. Physical Therapy Assistant 63. Radiologic Technician 64. Respiratory Therapist 65. Sonographer 66. Sterile Processing Technician 67. Surgical Technician/ Surgical
Technologist
Health Education/Community Wellness
68. Community Health Representative
69. Community Wellness Advocate
70. Dietitian 71. Health Educator 72. Nutritionist 73. Village Health Educator 74. Community Health
Aide/Practitioner (CHA/P)
Managers/Administrators 75. Behavioral Health
Supervisor–examples: a. Chief Clinical Officer b. Clinical Coordinator c. Clinical Program
Coordinators d. Director of Behavioral
Health e. Village Clinical
Supervisor 76. Health Information
Administrator/Director/ Manager
77. Hospital Administrator 78. Human Resources Director 79. Medical Director 80. Nurse Executive/Director of
Nursing 81. Administrator/Director/
CEO/ Manager
Information/Reimbursement 82. Billing Clerk and Technician 83. Billing Supervisor 84. Compliance Officer/Auditor 85. Medical Records Clerk and
Technician 86. Transcriptionist 87. Coding Clerk and Technician 88. Certified Coder 89. Coding Specialist
Paramedics 90. Paramedic 91. Emergency Medical 92. Technician I, II, III 93. Firefighter w/EMT Training

2009 AK Health Workforce Vacancy Study December 2009 ACRH and ISER
29
The highest estimated vacancy rates were found in Physicians with a 12% vacancy rate and an estimated statewide vacancy of 10.2%; Professional Nurses, an 11.2% vacancy rate and a statewide estimate of 11.6%; Other Clinicians/Therapists, an 11.3% vacancy rate and a statewide estimate of 10.0%; Behavioral Health Services, a 10.2% vacancy rate and 10.1% estimated vacancy rate; and Community Wellness occupations, a vacancy rate of 10.2% and a statewide estimate of 10.7% (see Table 16).
Table 16. Positions, Vacancies, and Vacancy Rates by Occupational Group, Sample and Statewide Estimates
Occupational Group Sample Statewide Estimates
Positions VacanciesVacancy
Rates Positions Vacancies
Vacancy Rates
Physicians 559.8 67.0 12.0% 964.9 98.5 10.2% Professional Nurses 3835.8 429.0 11.2% 4638.1 539.8 11.6% Other Nursing Staff 2160.0 179.5 8.3% 2687.4 232.2 8.6% Other Clinicians/Therapists 1479.0 167.0 11.3% 1946.0 194.8 10.0% Behavioral Health 2908.3 295.5 10.2% 3914.2 394.5 10.1% Allied Health 3542.8 179.5 5.1% 4860.7 265.9 5.5% Community/Wellness 608.5 62.0 10.2% 643.9 68.9 10.7% Managers/Administration 1300.0 56.0 4.3% 1905.7 82.9 4.3% Information/Reimbursement 1824.0 89.5 4.9% 2850.7 127.4 4.5% Paramedics 1137.0 32.0 2.8% 1402.8 39.5 2.8%
Looking at an urban/rural disaggregation of vacancies from the sample, smaller vacancy numbers (but much higher vacancy rates) were recorded for the rural respondents (Table 17). In the URBAN areas, Professional Nurses (10.9% in the sample and 11.0% statewide estimated vacancy rates) and Community Wellness occupations (13.4% sample and 13.3% estimated statewide vacancy rates) remained substantial; however, Physicians dropped (7.2% sample vacancy rate and 6.3% estimated statewide vacancy rate) compared to the overall rates. In the RURAL areas, vacancies for Professional Nurses (11.9% vacancy rate, 13.5% statewide estimated vacancy rates) remained high along with Physicians (23.0% sample vacancy rate, 20.5% estimated statewide vacancy rate). In the rural areas, Other Clinicians and Therapists occupations had a 21.0% sample vacancy rate and an 19.0% estimated statewide vacancy rate and Behavioral Health occupations had a vacancy rate of 10.7% and an estimated vacancy rate of 9.4%. The estimated rural vacancy rate was around three times the urban rate for Physicians (6.3% urban, 20.5% rural), and twice as much for Allied Health occupations (4.1% urban, 9.2% rural). The estimated urban vacancy rate for Health Education/Community Wellness occupations was about one-third higher than the rural rate (8.4% rural, 13.3% urban). Estimated vacancies for urban Paramedics were four times the rural rate (0.8% rural, 3.9% urban).

2009 AK Health Workforce Vacancy Study December 2009 ACRH and ISER
30
Table 17. Positions, Vacancies, and Vacancy Rates by Occupational Group and Urban vs. Rural, Sample and Statewide Estimates
Urban Sample Estimate
Occupational Group Positions VacanciesVacancy
Rate Positions Vacancies
Vacancy Rate
Physicians 390.5 28.0 7.2% 702.4 44.5 6.3% Professional Nurses 2739.0 298.5 10.9% 3426.6 376.0 11.0% Other Nursing Staff 1525.5 120.0 7.9% 1852.5 152.1 8.2% Other Clinicians/Therapists 1021.5 71.0 7.0% 1371.7 85.4 6.2% Behavioral Health 1759.0 172.0 9.8% 2329.1 245.1 10.5% Allied Health 2610.0 101.0 3.9% 3560.5 146.3 4.1% Community/Wellness 291.0 39.0 13.4% 306.1 40.6 13.3% Managers/Administration 827.0 35.0 4.2% 1282.8 51.3 4.0% Information/Reimbursement 1273.5 56.0 4.4% 2059.6 85.2 4.1% Paramedics 737.0 29.0 3.9% 909.3 35.8 3.9% Rural Sample Estimate
Occupational Group Positions VacanciesVacancy
Rate Positions Vacancies
Vacancy Rate
Physicians 169.3 39.0 23.0% 262.5 53.9 20.5% Professional Nurses 1096.8 130.5 11.9% 1211.5 163.8 13.5% Other Nursing Staff 634.5 59.5 9.4% 834.9 80.1 9.6% Other Clinicians/Therapists 457.5 96.0 21.0% 574.4 109.4 19.0% Behavioral Health 1149.3 123.5 10.7% 1585.1 149.4 9.4% Allied Health 932.8 78.5 8.4% 1300.2 119.6 9.2% Community/Wellness 317.5 23.0 7.2% 337.8 28.3 8.4% Managers/Administration 473.0 21.0 4.4% 622.8 31.6 5.1% Information/Reimbursement 550.5 33.5 6.1% 791.1 42.2 5.3% Paramedics 400.0 3.0 0.8% 493.5 3.7 0.8%
Table 18 looks at vacancy rates in the sample and statewide estimates across geographic regions. Though their vacancy numbers tend to be much lower than those of more populous regions, the entire rural North and Southwest regions had by far the highest range of vacancy rates and estimated vacancy rates (68.2% and 21.5%, respectively), and reported double-digit rates for several occupational groups.

2009 AK Health Workforce Vacancy Study December 2009 ACRH and ISER
31
Table 18. Positions, Vacancies, and Vacancy Rates by Occupational Group and Labor Region, Sample and Statewide Estimates
Anchorage/Mat-Su Sample Estimate
Occupational Group Positions VacanciesVacancy
Rate Sum Vacancies
Vacancy Rate
Physicians 313.0 26.0 8.3% 570.9 42.5 7.5% Professional Nurses 2224.0 216.5 9.7% 2787.6 264.7 9.5% Other Nursing Staff 944.5 64.0 6.8% 1258.7 85.9 6.8% Other Clinicians/Therapists 852.5 64.0 7.5% 1115.3 74.4 6.7% Behavioral Health 1677.0 137.0 8.2% 2310.0 199.2 8.6% Allied Health 2272.0 78.5 3.5% 3110.2 111.5 3.6% Community/Wellness 184.0 15.0 8.2% 197.9 15.0 7.6% Managers/Administration 678.5 27.0 4.0% 1084.6 40.7 3.8% Information/Reimbursement 1065.5 43.0 4.0% 1789.7 60.0 3.4% Paramedics 589.0 8.0 1.4% 726.7 9.9 1.4% Gulf Coast Sample Estimate
Occupational Group Positions VacanciesVacancy
Rate Positions Vacancies
Vacancy Rate
Physicians 50.0 7.0 14.0% 82.6 13.4 16.2% Professional Nurses 405.5 48.5 12.0% 450.6 65.7 14.6% Other Nursing Staff 273.0 33.0 12.1% 333.8 43.1 12.9% Other Clinicians/Therapists 134.0 27.5 20.5% 171.3 32.5 19.0% Behavioral Health 260.0 16.0 6.2% 438.8 23.9 5.5% Allied Health 298.8 26.0 8.7% 416.0 45.5 10.9% Community/Wellness 44.0 4.0 9.1% 53.6 5.6 10.5% Managers/Administration 155.3 4.0 2.6% 207.1 7.7 3.7% Information/Reimbursement 173.0 9.0 5.2% 257.8 14.2 5.5% Paramedics 201.0 0.0 0.0% 248.0 0.0 0.0% Interior Sample Estimate
Occupational Group Positions VacanciesVacancy
Rate Positions Vacancies
Vacancy Rate
Physicians 49.5 5.5 11.1% 117.3 12.7 10.8% Professional Nurses 464.5 66.0 14.2% 579.3 94.8 16.4% Other Nursing Staff 278.0 47.0 16.9% 330.9 58.1 17.6% Other Clinicians/Therapists 254.0 19.5 7.7% 373.9 26.0 7.0% Behavioral Health 283.0 36.0 12.7% 370.8 48.9 13.2% Allied Health 444.0 22.0 5.0% 634.7 33.2 5.2% Community/Wellness 81.0 19.0 23.5% 89.2 20.6 23.1% Managers/Administration 108.0 5.0 4.6% 182.3 7.3 4.0% Information/Reimbursement 243.5 12.0 4.9% 362.5 21.7 6.0% Paramedics 165.0 20.0 12.1% 203.6 24.7 12.1%

2009 AK Health Workforce Vacancy Study December 2009 ACRH and ISER
32
Table 18. Positions, Vacancies, and Vacancy Rates by Occupational Group and Labor Region, Sample and Statewide Estimates (continued)
Southeast Sample Estimate
Occupational Group Positions VacanciesVacancy
Rate Positions Vacancies
Vacancy Rate
Physicians 95.0 6.0 6.3% 133.4 6.5 4.9% Professional Nurses 471.0 34.0 7.2% 534.3 40.9 7.7% Other Nursing Staff 582.5 24.0 4.1% 663.3 29.5 4.4% Other Clinicians/Therapists 149.5 25.0 16.7% 186.7 28.5 15.2% Behavioral Health 273.5 33.5 12.2% 355.8 46.3 13.0% Allied Health 304.0 28.0 9.2% 430.1 41.1 9.6% Community/Wellness 64.5 6.0 9.3% 64.5 6.0 9.3% Managers/Administration 238.0 14.0 5.9% 297.2 17.1 5.8% Information/Reimbursement 219.0 9.0 4.1% 297.2 12.7 4.3% Paramedics 83.0 1.0 1.2% 102.4 1.2 1.2% North Sample Estimate
Occupational Group Positions VacanciesVacancy
Rate Positions Vacancies
Vacancy Rate
Physicians 22.0 15.0 68.2% 22.0 15.0 68.2% Professional Nurses 63.0 28.0 44.4% 63.0 28.0 44.4% Other Nursing Staff 23.0 6.0 26.1% 23.5 6.0 25.5% Other Clinicians/Therapists 28.0 11.0 39.3% 28.8 11.8 41.0% Behavioral Health 103.5 15.0 14.5% 103.5 15.0 14.5% Allied Health 58.0 12.0 20.7% 60.5 12.8 21.2% Community/Wellness 57.0 4.0 7.0% 57.0 4.0 7.0% Managers/Administration 41.0 4.0 9.8% 42.3 4.8 11.4% Information/Reimbursement 45.0 5.0 11.1% 46.3 5.0 10.8% Paramedics 74.0 3.0 4.1% 91.3 3.7 4.1% Southwest Sample Estimate
Occupational Group Positions VacanciesVacancy
Rate Positions Vacancies
Vacancy Rate
Physicians 30.3 7.5 24.8% 38.7 8.3 21.5% Professional Nurses 207.8 36.0 17.3% 223.4 45.6 20.4% Other Nursing Staff 59.0 5.5 9.3% 77.1 9.5 12.3% Other Clinicians/Therapists 61.0 20.0 32.8% 69.9 21.6 30.9% Behavioral Health 311.3 58.0 18.6% 335.4 61.2 18.2% Allied Health 166.0 13.0 7.8% 209.1 21.9 10.5% Community/Wellness 178.0 14.0 7.9% 181.7 17.7 9.7% Managers/Administration 79.3 2.0 2.5% 92.2 5.2 5.6% Information/Reimbursement 82 12 14.0% 108 14 13.1% Paramedics 25 0 0.0% 31 0 0.0%

2009 AK Health Workforce Vacancy Study December 2009 ACRH and ISER
33
Physician estimated vacancy rates were highest in the North region at 68.2% with the Southwest region a distance second, yet high, at 21.5%, followed by the Gulf Coast (16.2%). Professional Nurses had its highest estimated vacancy rate in the North region at 44.4% along with other Nursing staff occupations at 25.5% and Other Clinicians and Therapists at 41.0%. Interior had the highest estimated vacancy rates for Health Education/Community Wellness positions at 20.6%, Health Information occupations at 6.0%, and Paramedic positions at 12.1%. The Southeast region had the highest estimated vacancy rate for Manger positions at 5.8%. 2. Occupational Highlights a. Occupations with Most Estimated Positions Table 19 presents health occupations with at least 1,000 estimated positions including vacancies. These 6 occupations represented 9,276.4 estimated positions—approximately 36.27% of the estimated positions statewide (see Appendix F for all Occupations Sorted by Estimated Positions).
Table 19. Positions, Vacancies, and Vacancy Rates for Occupations with 1,000 or more Estimated Positions, Sample and Statewide Estimates*
Occupation Sample Statewide Estimates
Positions VacanciesVacancy
Rates Positions Vacancies
Vacancy Rates
Registered Nurse 2,680.8 273.5 10.2% 3176.0 321.6 10.1%
Certified Nurse Asst 1,245.5 102.0 8.2% 1,444.9 120.0 8.3% Administrator/Director/CEO/ Manager
837.0 25.0 3.0% 1,246.4 33.5 2.7%
Behavioral Health Human Services Worker–HS
804.0 104.0 12.9% 1,198.9 146.4 12.2%
Firefighter with Emergency Medical Service
903.0 26.0 2.9% 1,114.1 32.1 2.9%
Billing Clerk/Technician 689.5 37.0 5.4% 1,096.1 58.6 5.3% *See Appendix F for a list of occupations sorted by estimated positions
Registered Nurse and Certified Nurse Assistant were the most numerous primary health-care occupations, with 3,176.0 and 1,444.9 estimated positions, respectively. Managerial occupations had 1,246.4 estimated positions. Human Services Worker-HS (1,198.9) includes Activity Therapist, Crisis Center Advocate, Direct Care Provider, Direct Support Personnel, Family Services Worker, Family Services Caseworker, Family Advocate, Individual Services Provider, Life Coach/Life Skills Specialist, Mental Health Associate, and Residential Aide. Completing the list were Firefighter with Emergency Medical Service (1,114.1), and Billing Clerk/Technician (1,096.1).
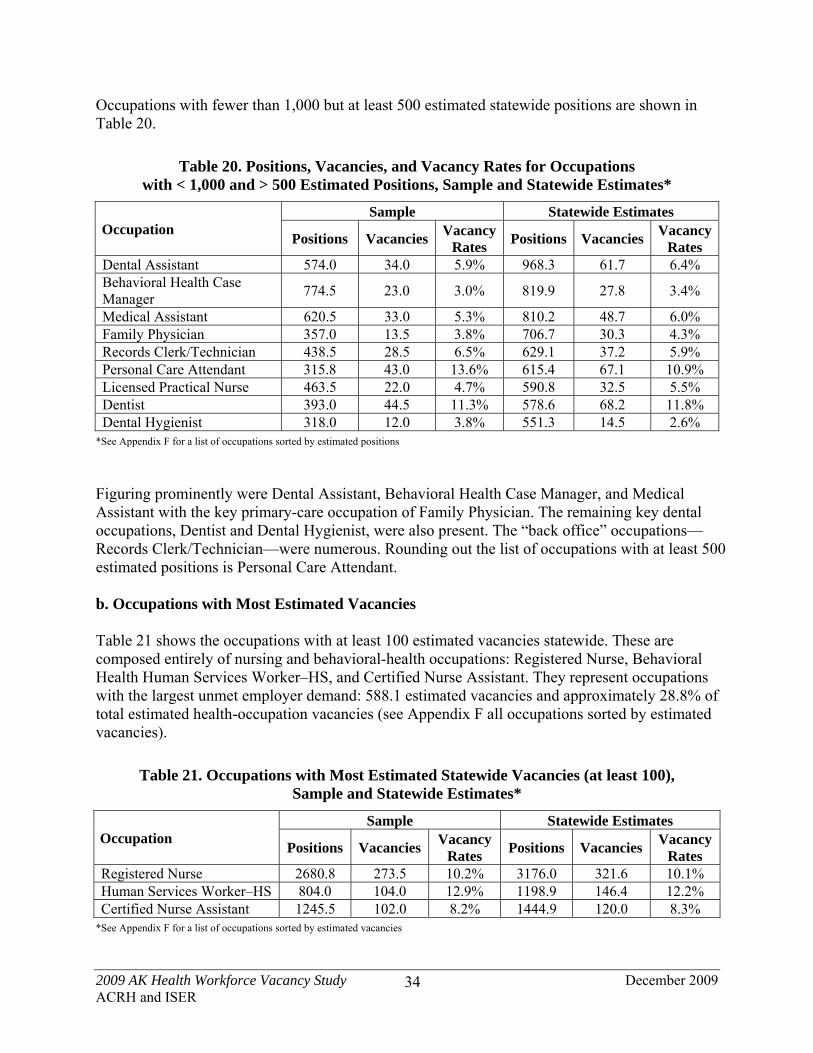
2009 AK Health Workforce Vacancy Study December 2009 ACRH and ISER
34
Occupations with fewer than 1,000 but at least 500 estimated statewide positions are shown in Table 20.
Table 20. Positions, Vacancies, and Vacancy Rates for Occupations with < 1,000 and > 500 Estimated Positions, Sample and Statewide Estimates*
Occupation Sample Statewide Estimates
Positions VacanciesVacancy
Rates Positions Vacancies
Vacancy Rates
Dental Assistant 574.0 34.0 5.9% 968.3 61.7 6.4% Behavioral Health Case Manager
774.5 23.0 3.0% 819.9 27.8 3.4%
Medical Assistant 620.5 33.0 5.3% 810.2 48.7 6.0% Family Physician 357.0 13.5 3.8% 706.7 30.3 4.3% Records Clerk/Technician 438.5 28.5 6.5% 629.1 37.2 5.9% Personal Care Attendant 315.8 43.0 13.6% 615.4 67.1 10.9% Licensed Practical Nurse 463.5 22.0 4.7% 590.8 32.5 5.5% Dentist 393.0 44.5 11.3% 578.6 68.2 11.8% Dental Hygienist 318.0 12.0 3.8% 551.3 14.5 2.6%
*See Appendix F for a list of occupations sorted by estimated positions
Figuring prominently were Dental Assistant, Behavioral Health Case Manager, and Medical Assistant with the key primary-care occupation of Family Physician. The remaining key dental occupations, Dentist and Dental Hygienist, were also present. The “back office” occupations—Records Clerk/Technician—were numerous. Rounding out the list of occupations with at least 500 estimated positions is Personal Care Attendant. b. Occupations with Most Estimated Vacancies Table 21 shows the occupations with at least 100 estimated vacancies statewide. These are composed entirely of nursing and behavioral-health occupations: Registered Nurse, Behavioral Health Human Services Worker–HS, and Certified Nurse Assistant. They represent occupations with the largest unmet employer demand: 588.1 estimated vacancies and approximately 28.8% of total estimated health-occupation vacancies (see Appendix F all occupations sorted by estimated vacancies).
Table 21. Occupations with Most Estimated Statewide Vacancies (at least 100), Sample and Statewide Estimates*
Occupation Sample Statewide Estimates
Positions VacanciesVacancy
Rates Positions Vacancies
Vacancy Rates
Registered Nurse 2680.8 273.5 10.2% 3176.0 321.6 10.1% Human Services Worker–HS 804.0 104.0 12.9% 1198.9 146.4 12.2% Certified Nurse Assistant 1245.5 102.0 8.2% 1444.9 120.0 8.3%
*See Appendix F for a list of occupations sorted by estimated vacancies

2009 AK Health Workforce Vacancy Study December 2009 ACRH and ISER
35
Occupations with fewer than 100 but at least 50 estimated vacancies statewide are presented in Table 22. Two key primary-care occupations (Family Physician and Family Nurse Practitioner) are listed. Dental Assistant, Billing Clerk/Technician, and Licensed Practical Nurse also had over 50 estimated vacancies.
Table 22. Occupations with 50-99 Estimated Statewide Vacancies, Sample and Statewide Estimates*
Occupation Sample Statewide Estimates
Positions VacanciesVacancy
Rates Positions Vacancies
Vacancy Rates
Licensed Practical Nurse 393.0 44.5 11.3% 578.6 68.2 11.8% Family Physician 315.8 43.0 13.6% 615.4 67.1 10.9% Dental Assistant 574.0 34.0 5.9% 968.3 61.7 6.4% Billing Clerk/Technician 689.5 37.0 5.4% 1096.1 58.6 5.3% Family Nurse Practitioner 193.0 36.5 18.9% 337.3 58.2 17.2%
*See Appendix F for a list of occupations sorted by estimated vacancies
c. Occupations with Highest Estimated Vacancy Rates Table 23 presents occupations with estimated vacancy rates of 20% and higher (see Table 27 for all occupations sorted by estimated vacancy rates). These represent the occupations with the highest percentages of unmet employer demand. Among those with at least 20% estimated vacancy rates were Radiation Oncologist, Allied Health Paramedic, Pediatric Nurse Practitioner, Physical Therapy Assistant, Nurse Midwife, Dietitian, Occupational Therapist, Women's Health Care Nurse Practitioner, and Psychiatric Nurse Practitioner.
Table 23. Occupations with Highest Vacancy Rates*, Sample and Statewide Estimates
Occupation Sample Statewide Estimates
Positions Vacancies Vacancy
Rates Positions Vacancies
Vacancy Rates
Radiation Oncologist 5.0 3.0 60.0% 5.0 3.0 60.0% Allied Health Paramedic 9.0 4.0 44.4% 9.0 4.0 44.4% Pediatric Nurse Practitioner 15.0 4.0 26.7% 27.8 10.4 37.4% Physical Therapy Assistant 53.0 16.0 30.2% 62.3 17.8 28.5% Nurse Midwife 25.0 4.0 16.0% 41.0 10.4 25.4% Dietitian 36.5 9.0 24.7% 37.2 9.0 24.2% Occupational Therapist 115.0 26.0 22.6% 128.5 29.3 22.8% Women's Health-Care Nurse Practitioner
23.0 5.0 21.7% 51.9 11.4 22.0%
Psychiatric Nurse Practitioner
25.0 6.0 24.0% 41.9 8.6 20.5%
*See Appendix F for a list of occupations sorted by estimated vacancy rates
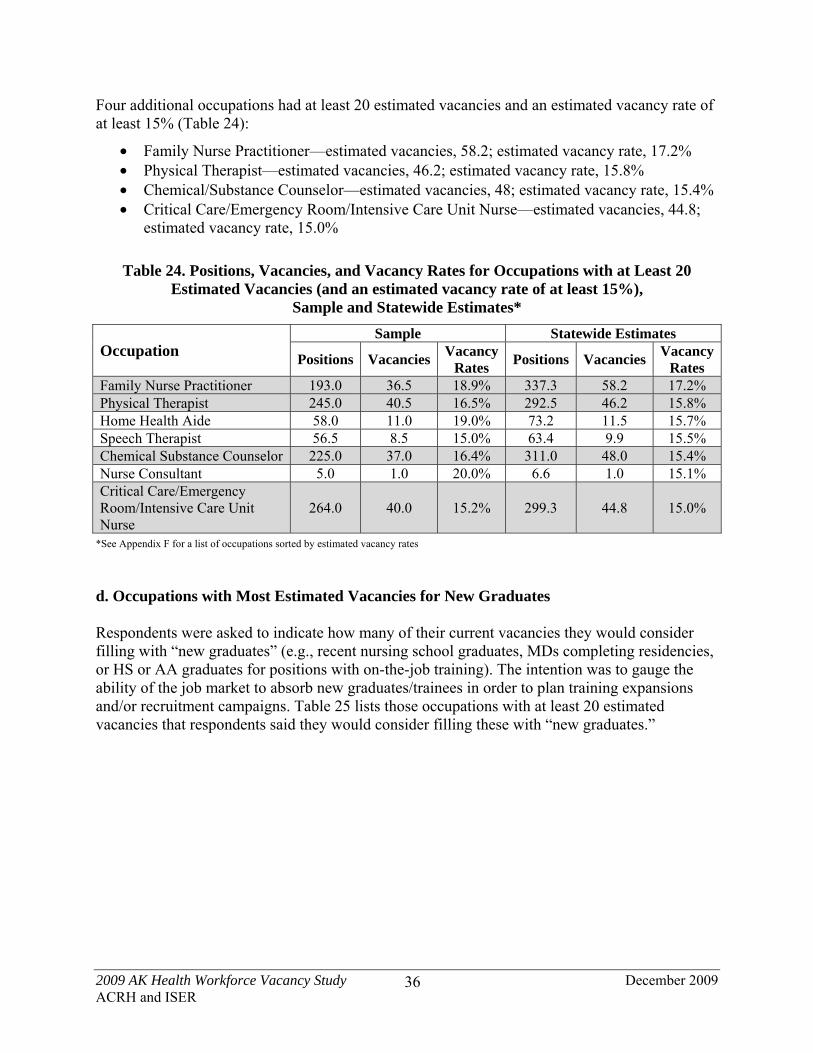
2009 AK Health Workforce Vacancy Study December 2009 ACRH and ISER
36
Four additional occupations had at least 20 estimated vacancies and an estimated vacancy rate of at least 15% (Table 24):
Family Nurse Practitioner—estimated vacancies, 58.2; estimated vacancy rate, 17.2% Physical Therapist—estimated vacancies, 46.2; estimated vacancy rate, 15.8% Chemical/Substance Counselor—estimated vacancies, 48; estimated vacancy rate, 15.4% Critical Care/Emergency Room/Intensive Care Unit Nurse—estimated vacancies, 44.8;
estimated vacancy rate, 15.0%
Table 24. Positions, Vacancies, and Vacancy Rates for Occupations with at Least 20 Estimated Vacancies (and an estimated vacancy rate of at least 15%),
Sample and Statewide Estimates*
Occupation Sample Statewide Estimates
Positions VacanciesVacancy
Rates Positions Vacancies
Vacancy Rates
Family Nurse Practitioner 193.0 36.5 18.9% 337.3 58.2 17.2% Physical Therapist 245.0 40.5 16.5% 292.5 46.2 15.8% Home Health Aide 58.0 11.0 19.0% 73.2 11.5 15.7% Speech Therapist 56.5 8.5 15.0% 63.4 9.9 15.5% Chemical Substance Counselor 225.0 37.0 16.4% 311.0 48.0 15.4% Nurse Consultant 5.0 1.0 20.0% 6.6 1.0 15.1% Critical Care/Emergency Room/Intensive Care Unit Nurse
264.0 40.0 15.2% 299.3 44.8 15.0%
*See Appendix F for a list of occupations sorted by estimated vacancy rates
d. Occupations with Most Estimated Vacancies for New Graduates Respondents were asked to indicate how many of their current vacancies they would consider filling with “new graduates” (e.g., recent nursing school graduates, MDs completing residencies, or HS or AA graduates for positions with on-the-job training). The intention was to gauge the ability of the job market to absorb new graduates/trainees in order to plan training expansions and/or recruitment campaigns. Table 25 lists those occupations with at least 20 estimated vacancies that respondents said they would consider filling these with “new graduates.”

2009 AK Health Workforce Vacancy Study December 2009 ACRH and ISER
37
Table 25. Sample and Estimated Vacancies for Occupations with at least 20 Estimated Vacancies Willing to Hire New Graduates
Occupation
Sample Estimate
Cu
rren
t V
acan
cies
C
ould
Fil
l wit
h
New
Gra
dua
tes
Cu
rren
t V
acan
cies
C
ould
Fil
l wit
h
New
Gra
dua
tes
Behavioral Health Human Services Worker-HS 79 121 Other Nursing Staff Certified Nurse Assistant 89 102 Professional Nurses Registered Nurse 64 96 Other Nursing Staff Licensed Practical Nurse 33 48 Allied Health Dental Assistant 25 44 Professional Nurses Family Nurse Practitioner 23 43 Physicians Family Physician 27 42 Behavioral Health Case Manger 28 42 Information and Reimbursement Billing Clerk/Technician 25 39 Allied Health Dental Hygienist 21 39 Behavioral Health Clinician 28 38 Other Clinicians/Therapists Physical Therapist 32 37 Behavioral Health Chemical and Substance Counselor 23 32 Other Nursing Staff Personal Care Attendant 21 32 Other Clinicians/Therapists Physician Assistant 17 30 Behavioral Health Human Services Worker Degree 20 29 Other Clinicians/Therapists Occupational Therapist 24 27 Allied Health Medical Assistant 12 27 Information and Reimbursement Records Clerk/Technician 21 26 Health Education and Community Wellness Community Health Aide/ Practitioner 24 26 Other Clinicians/Therapists Pharmacist 23 24
3. Highlighted Occupations In this section, emphasis is placed on estimated vacancies and vacancy rates. See Appendix E for sample and statewide estimated positions, vacancies, and vacancy rates for each occupation presented by organization type, urban versus rural areas, and geographic regions. a. Physicians Table 26 presents the sample and statewide estimates for positions, vacancies, and vacancy rates for physicians. The category of “physician” includes Surgeons and Doctors of Osteopathic Medicine (DOs) but does not include Naturopaths, Chiropractors, or Podiatrists.
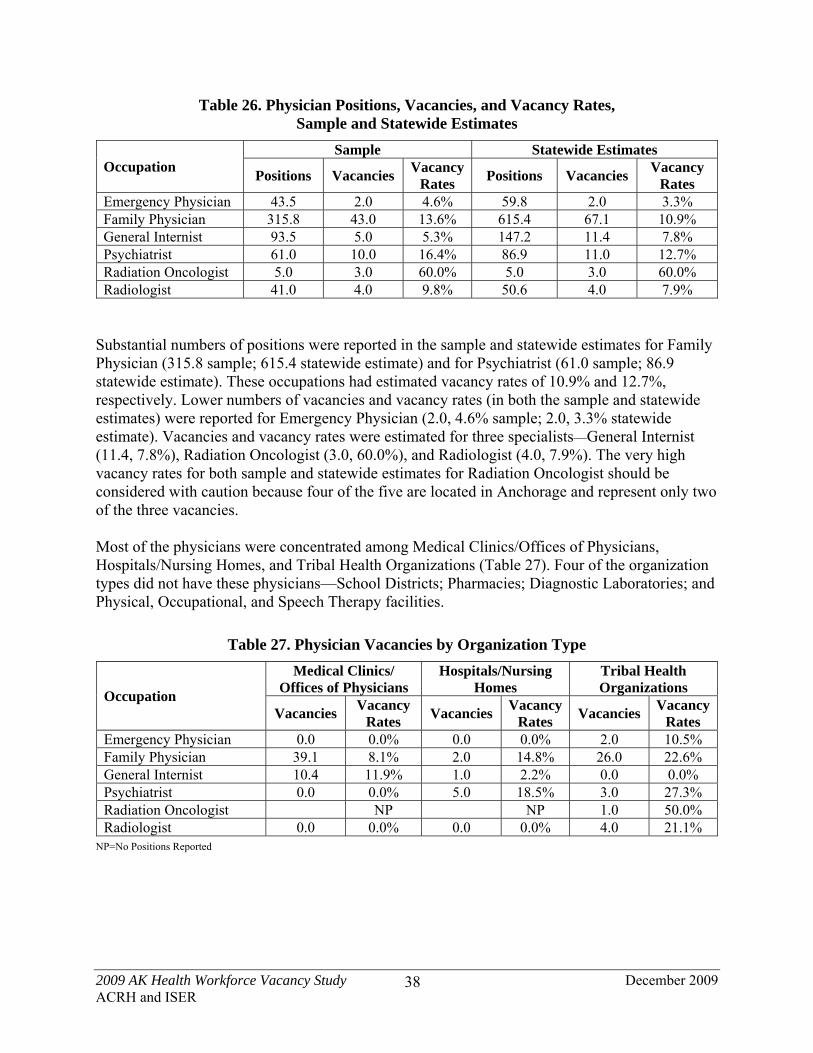
2009 AK Health Workforce Vacancy Study December 2009 ACRH and ISER
38
Table 26. Physician Positions, Vacancies, and Vacancy Rates, Sample and Statewide Estimates
Occupation Sample Statewide Estimates
Positions Vacancies Vacancy
Rates Positions Vacancies
Vacancy Rates
Emergency Physician 43.5 2.0 4.6% 59.8 2.0 3.3% Family Physician 315.8 43.0 13.6% 615.4 67.1 10.9% General Internist 93.5 5.0 5.3% 147.2 11.4 7.8% Psychiatrist 61.0 10.0 16.4% 86.9 11.0 12.7% Radiation Oncologist 5.0 3.0 60.0% 5.0 3.0 60.0% Radiologist 41.0 4.0 9.8% 50.6 4.0 7.9%
Substantial numbers of positions were reported in the sample and statewide estimates for Family Physician (315.8 sample; 615.4 statewide estimate) and for Psychiatrist (61.0 sample; 86.9 statewide estimate). These occupations had estimated vacancy rates of 10.9% and 12.7%, respectively. Lower numbers of vacancies and vacancy rates (in both the sample and statewide estimates) were reported for Emergency Physician (2.0, 4.6% sample; 2.0, 3.3% statewide estimate). Vacancies and vacancy rates were estimated for three specialists—General Internist (11.4, 7.8%), Radiation Oncologist (3.0, 60.0%), and Radiologist (4.0, 7.9%). The very high vacancy rates for both sample and statewide estimates for Radiation Oncologist should be considered with caution because four of the five are located in Anchorage and represent only two of the three vacancies. Most of the physicians were concentrated among Medical Clinics/Offices of Physicians, Hospitals/Nursing Homes, and Tribal Health Organizations (Table 27). Four of the organization types did not have these physicians—School Districts; Pharmacies; Diagnostic Laboratories; and Physical, Occupational, and Speech Therapy facilities.
Table 27. Physician Vacancies by Organization Type
Occupation
Medical Clinics/ Offices of Physicians
Hospitals/Nursing Homes
Tribal Health Organizations
Vacancies Vacancy
Rates Vacancies
Vacancy Rates
Vacancies Vacancy
Rates Emergency Physician 0.0 0.0% 0.0 0.0% 2.0 10.5% Family Physician 39.1 8.1% 2.0 14.8% 26.0 22.6% General Internist 10.4 11.9% 1.0 2.2% 0.0 0.0% Psychiatrist 0.0 0.0% 5.0 18.5% 3.0 27.3% Radiation Oncologist NP NP 1.0 50.0% Radiologist 0.0 0.0% 0.0 0.0% 4.0 21.1%
NP=No Positions Reported

2009 AK Health Workforce Vacancy Study December 2009 ACRH and ISER
39
Each of the remaining organizational types reported one or two types of physician. Table 28 shows their estimated vacancies and vacancy rates.
Table 28. Organization Types that Include Only 1 or 2 Physician Occupations, Estimated Vacancies and Vacancy Rates for Physician Occupations
Organization Type Occupation Estimated Vacancies
Estimated Vacancy Rates
Behavioral Health Services Psychiatrist 3.0 20.0% Paramedic Emergency Physician 0.0 0.0% Dental Clinics Family Physician 0.0 0.0%
Diagnostic Imaging Radiation Oncologist 2.0 66.7% Radiologist 0.0 0.0%
The estimated vacancy rate for Emergency Physicians in urban Alaska was 0.0% compared to 8.0% in rural areas (Table 29). Similarly, Radiologists had a 0.0% urban vacancy rate compared to 33.3% in rural Alaska. The urban rate for Family Physicians was 5.9%, and the rural rate was 23.5%. The estimated urban rate for General Internists was 6.6%, and the rural rate was 12.9%.
Table 29. Positions, Vacancies, and Vacancy Rates for Physician Occupations in Urban and Rural Areas
Occupation
Urban Areas Sample
Urban Areas Estimate
Rural Areas Sample
Rural Areas Estimates
Pos
itio
ns
Vac
anci
es
Vac
ancy
R
ates
Pos
itio
ns
Vac
anci
es
Vac
ancy
R
ates
Pos
itio
ns
Vac
anci
es
Vac
ancy
R
ates
Pos
itio
ns
Vac
anci
es
Vac
ancy
R
ates
Emergency Physician 20.0 0.0 0.0% 34.7 0.0 0.0% 23.5 2.0 8.5% 25.1 2.0 8.0%
Family Physician 218.0 15.0 6.9% 441.8 26.2 5.9% 97.8 28.0 28.6% 173.6 40.8 23.5%
General Internist 73.5 3.0 4.1% 119.2 7.8 6.6% 20.0 2.0 10.0% 28.0 3.6 12.9%
Psychiatrist 46.0 8.0 17.4% 64.0 8.5 13.3% 15.0 2.0 13.3% 22.8 2.5 11.0%
Radiation Oncologist 4.0 2.0 50.0% 4.0 2.0 50.0% 1.0 1.0 100.0% 1.0 1.0 100.0%
Radiologist 29.0 0.0 0.0% 38.6 0.0 0.0% 12.0 4.0 33.3% 12.0 4.0 33.3%
Looking at physicians by region, we noted the following statewide estimates (see Table 30):
Emergency Physician. Positions reported in all but one (North) of the six labor-market regions. Only the Southwest Region reported vacancies (2 vacancies; 20% vacancy rate for the sample and statewide estimates).
Family Physician. Vacant positions reported in each region, with the lowest estimated rates in Southeast (3.0 vacancies, 3.5% vacancy rate) and the highest in the North region (10.0, 58.8%). The large percentage difference was due to the greater total number of family practice physicians in the Southeast region than in the North. Estimates in the remaining regions were Anchorage (21.6, 5.9%), Gulf Coast (13.4, 25.4%); Interior (12.7, 19.0%); and Southwest (6.3, 25.5%).

2009 AK Health Workforce Vacancy Study December 2009 ACRH and ISER
40
General Internist. No positions reported in the North or Southwest regions, and no vacancies reported in the Gulf Coast or Interior regions. Anchorage had the highest estimated number of vacancies (10.4), and a vacancy rate of 12.5%; the Southeast region had 1 estimated vacancy and a vacancy rate of 4.8%.
Psychiatrist. Positions reported in all six labor-market regions; however, only three regions reported vacancies: North (1, 100%); Southeast (2.5, 20.0%); and Anchorage (7.5, 14 5%). The Gulf Coast, Interior, and Southwest regions reported no vacancies.
Radiation Oncologist. As noted earlier, all Radiation Oncologist positions were located in Anchorage, with the estimated number of vacancies at 3 and a vacancy rate of 60.0%.
Radiologist. The highest number of Radiologists were located in Anchorage. All regions, except the North, had estimates of zero vacancies and 0% vacancy rate. The North labor region had 4.0 vacancies and a 100% vacancy rate.

2009 AK Health Workforce Vacancy Study December 2009 ACRH and ISER
41
Table 30. Positions, Vacancies, and Vacancy Rates for Physician Occupations by Geographic Regions
Occupation
Anchorage Sample Anchorage Estimates
Gulf Coast Sample
Gulf Coast Estimate
Interior Sample Interior Estimate
Pos
itio
ns
Vac
anci
es
Vac
ancy
R
ates
Pos
itio
ns
Vac
anci
es
Vac
ancy
R
ates
Pos
itio
ns
Vac
anci
es
Vac
ancy
R
ates
Pos
itio
ns
Vac
anci
es
Vac
ancy
R
ates
Pos
itio
ns
Vac
anci
es
Vac
ancy
R
ates
Pos
itio
ns
Vac
anci
es
Vac
ancy
R
ates
Emergency Physician 17.0 0.0 0.0% 29.8 0.0 0.0% 9.5 0.0 0.0% 11.1 0.0 0.0% 2.0 0.0 0.0% 2.2 0.0 0.0%
Family Physician 169.0 12.0 7.1% 368.8 21.6 5.9% 25.5 7.0 27.5% 52.8 13.4 25.4% 27.0 5.5 20.4% 67.1 12.7 19.0%
General Internist 61.0 4.0 6.6% 83.5 10.4 12.5% 7.0 0.0 0.0% 7.0 0.0 0.0% 14.5 0.0 0.0% 36.2 0.0 0.0%
Psychiatrist 37.0 7.0 18.9% 51.8 7.5 14.5% 5.0 0.0 0.0% 8.7 0.0 0.0% 5.0 0.0 0.0% 10.8 0.0 0.0%
Radiation Oncologist 5.0 3.0 60.0% 5.0 3.0 60.0% NP NP NP NP
Radiologist 24.0 0.0 0.0% 32.0 0.0 0.0% 3.0 0.0 0.0% 3.0 0.0 0.0% 1.0 0.0 0.0% 1.0 0.0 0.0%
Occupation
Southeast Sample Southeast Estimate North Sample North Estimate Southwest Sample Southwest Estimates
Pos
itio
ns
Vac
anci
es
Vac
ancy
R
ates
Pos
itio
ns
Vac
anci
es
Vac
ancy
R
ates
Pos
itio
ns
Vac
anci
es
Vac
ancy
R
ates
Pos
itio
ns
Vac
anci
es
Vac
ancy
R
ates
Pos
itio
ns
Vac
anci
es
Vac
ancy
R
ates
Pos
itio
ns
Vac
anci
es
Vac
ancy
R
ates
Emergency Physician
5.0 0.0 0.0% 6.6 0.0 0.0% NP NP 10.0 2.0 20.0% 10.0 2.0 20.0%
Family Physician 61.0 3.0 4.9% 85.1 3.0 3.5% 17.0 10.0 58.8% 17.0 10.0 58.8% 16.3 5.5 33.8% 24.7 6.3 25.5%
General Internist 11.0 1.0 9.1% 20.6 1.0 4.8% NP NP NP NP
Psychiatrist 11.0 2.0 18.2% 12.5 2.5 20.0% 1.0 1.0 100.0% 1.0 1.0 100.0% 2.0 0.0 0.0% 2.0 0.0 0.0%
Radiation Oncologist
NP NP NP NP NP NP
Radiologist 7.0 0.0 0.0% 8.6 0.0 0.0% 4.0 4.0 100.0% 4.0 4.0 100.0% 2.0 0.0 0.0% 2.0 0.0 0.0%
NP=No Positions Reported

2009 AK Health Workforce Vacancy Study December 2009 ACRH and ISER
42
b. Professional Nurses Table 31 presents the sample and statewide estimates for Professional Nursing occupations (Licensed Practical Nurses are included with Other Nursing Staff). Statewide estimates indicated high vacancy rates of more than 20% for some nurse specialties: Nurse Midwife (25.4%), Pediatric Nurse Practitioner (37.4%) Psychiatric Nurse Practitioner (20.5%), and Women’s Health-Care Nurse Practitioner (22.0%). The following nursing occupations showed high rates of vacancies in both the sample and statewide estimate: Nurse Case Manager (11.8%), Critical Care/Emergency Room/Intensive-Care-Unit Nurse (15.0%), and Family Nurse Practitioner (17.2%). Nurse Managers, Psychiatric Nurses, and Psychiatric Nurse Practitioners also had a significant number of estimated vacancies (16.3, 11.0, 8.6, respectively), with estimated vacancy rates of 11.0%, 12.9%, and 20.5%, respectively.
Table 31. Professional Nursing Occupations, Positions, Vacancies, and Vacancy Rates by Sample and Statewide Estimates
Occupations Sample Statewide Estimates
Positions VacanciesVacancy
Rates Positions Vacancies
Vacancy Rates
Nurse Case Manger 218.0 22.0 10.1% 262.5 31.0 11.8% Critical Care/Emergency Room/Intensive Care Unit Nurse
264.0 40.0 15.2% 299.3 44.8 15.0%
Family Nurse Practitioner 193.0 36.5 18.9% 337.3 58.2 17.2% Nurse Anesthetist 27.0 0.0 0.0% 27.0 0.0 0.0% Nurse Consultant 5.0 1.0 20.0% 6.6 1.0 15.1% Nurse Educator 47.0 5.0 10.6% 53.4 5.0 9.4% Nurse Manager 123.0 11.0 8.9% 149.0 16.3 11.0% Nurse Midwife 25.0 4.0 16.0% 41.0 10.4 25.4% Pediatric Nurse Practitioner 15.0 4.0 26.7% 27.8 10.4 37.4% Psychiatric Nurse 82.0 11.0 13.4% 85.2 11.0 12.9% Psychiatric Nurse Practitioner
25.0 6.0 24.0% 41.9 8.6 20.5%
Public Health Nurse 131.0 10.0 7.6% 131.0 10.0 7.6% Registered Nurse 2,680.8 273.5 10.2% 3,176.0 321.6 10.1% Women's Health-Care Nurse Practitioner
23.0 5.0 21.7% 51.9 11.4 22.0%
The estimated Registered Nurse vacancy rate was 10.1%, representing an estimated 321.6 vacancies, with 273.5 vacancies reported in the sample alone. Nurse Anesthetist was the only nurse occupation with 0 vacancies. Public Health Nurses reported vacancies at 10.0 and a moderate vacancy rate of 7.6%.

2009 AK Health Workforce Vacancy Study December 2009 ACRH and ISER
43
No professional nursing occupations were reported from Pharmacies, Diagnostic Laboratories, PT/OT/ST facilities, or Paramedics. Dental Clinics and Diagnostic Imaging facilities had one or two positions in the sample or estimates (see Table 32). School Districts rely heavily on Registered Nurses and reported a low sample vacancy at 6.0, with a statewide estimated vacancy rate at 4.8%. Each of the four organization types with the highest utilization of professional nurses had at least one nursing occupation with an estimated vacancy rate greater than 20% in various specialty areas:
Behavioral Health Services. Psychiatric Nurse Practitioner, estimated vacancy rate, 40.0%.
Tribal Health Facilities. Critical Care/Emergency Room/Intensive Care Unit, 26.7%; Family Nurse Practitioner, 25.0%; Nurse Educator, 20.0%; Psychiatric Nurse, 66.7%; Public Health Nurse, 100%; and Women’s Health Care Nurse Practitioner, 33.3%.
Hospitals and Nursing Homes. Nurse Consultant, 25.0%; Psychiatric Nurse Practitioner, 37.5%.
Medical Clinics and Offices of Physicians. Nurse Case Manager, 26.3%; Nurse Manager, 21.4%; Nurse Midwife, 40.0%; Pediatric Nurse Practitioner, 50.0%; and Women’s Health Care Nurse Practitioner, 22.2%.
Registered Nurses (RNs) showed substantial sample and estimated vacancy rates in Hospitals and Nursing Homes (10.2% in sample and estimate), Behavioral Health Services (12.5% in sample and estimate), and Tribal Health Organizations (11.4% in sample and estimate). Estimated vacancy rates for RNs in Medical Clinics and Offices of Physicians were slightly lower at 9.5%, and just 4.8% in School Districts. These RNs include all skill levels—novice to advanced—and do not correspond to a need for new nursing graduates. Nurse Case Mangers had the highest number of reported positions concentrated in Tribal Health Organizations (128.0 in both sample and statewide estimates) and estimated vacancy rates of 7.8%. Medical Clinics/Offices of Physicians had the highest estimated vacancy rate at 26.3%, with 13.0 estimated vacancies. Hospitals/Nursing Homes had the highest number of Critical Care/Emergency Room/Intensive Care Unit Nurse positions (227.0). Tribal Health Organizations had the highest estimated vacancy rate at 26.7%, for 4.0 estimated vacancies. Family Nurse Practitioners at Tribal Health Organizations, Hospitals/Nursing Homes, and Medical Clinics/Offices of Physicians had vacancies that exceeded 10% (25.0%, 15.0%, 15.2%, respectively).
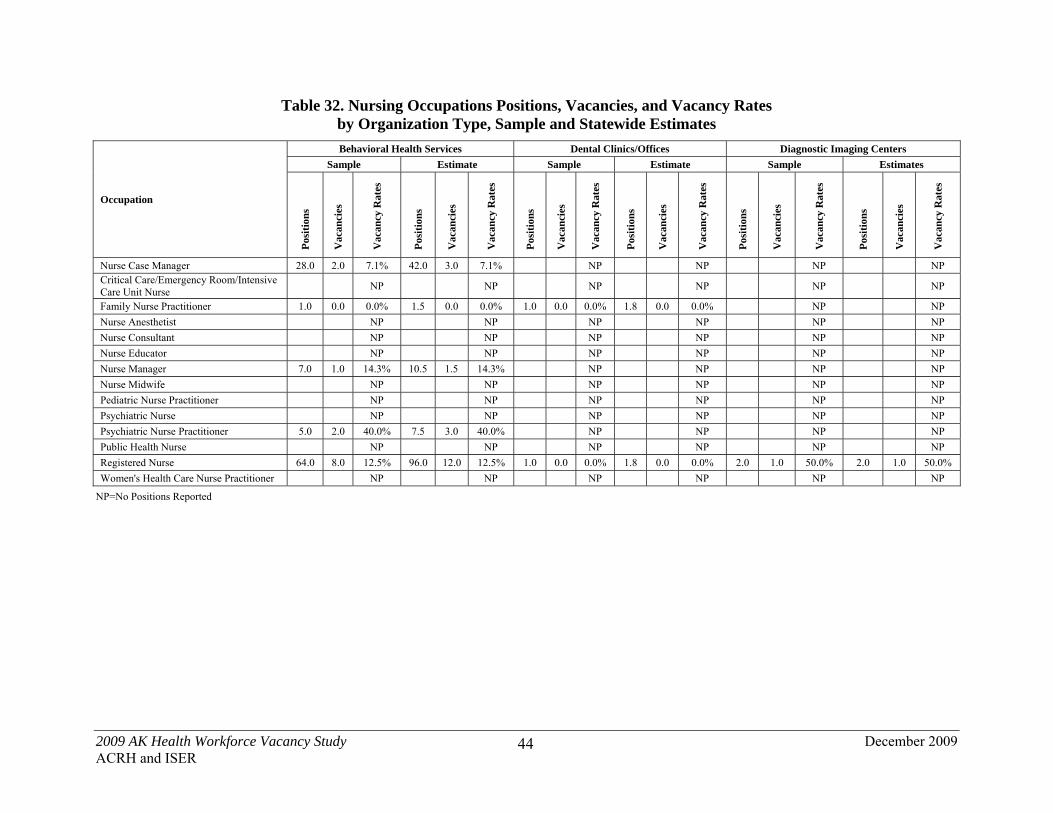
2009 AK Health Workforce Vacancy Study December 2009 ACRH and ISER
44
Table 32. Nursing Occupations Positions, Vacancies, and Vacancy Rates by Organization Type, Sample and Statewide Estimates
Occupation
Behavioral Health Services Dental Clinics/Offices Diagnostic Imaging Centers
Sample Estimate Sample Estimate Sample Estimates
Pos
itio
ns
Vac
anci
es
Vac
ancy
Rat
es
Pos
itio
ns
Vac
anci
es
Vac
ancy
Rat
es
Pos
itio
ns
Vac
anci
es
Vac
ancy
Rat
es
Pos
itio
ns
Vac
anci
es
Vac
ancy
Rat
es
Pos
itio
ns
Vac
anci
es
Vac
ancy
Rat
es
Pos
itio
ns
Vac
anci
es
Vac
ancy
Rat
es
Nurse Case Manager 28.0 2.0 7.1% 42.0 3.0 7.1% NP NP NP NP Critical Care/Emergency Room/Intensive Care Unit Nurse
NP NP NP NP NP NP
Family Nurse Practitioner 1.0 0.0 0.0% 1.5 0.0 0.0% 1.0 0.0 0.0% 1.8 0.0 0.0% NP NP
Nurse Anesthetist NP NP NP NP NP NP
Nurse Consultant NP NP NP NP NP NP
Nurse Educator NP NP NP NP NP NP
Nurse Manager 7.0 1.0 14.3% 10.5 1.5 14.3% NP NP NP NP
Nurse Midwife NP NP NP NP NP NP
Pediatric Nurse Practitioner NP NP NP NP NP NP
Psychiatric Nurse NP NP NP NP NP NP
Psychiatric Nurse Practitioner 5.0 2.0 40.0% 7.5 3.0 40.0% NP NP NP NP
Public Health Nurse NP NP NP NP NP NP
Registered Nurse 64.0 8.0 12.5% 96.0 12.0 12.5% 1.0 0.0 0.0% 1.8 0.0 0.0% 2.0 1.0 50.0% 2.0 1.0 50.0%
Women's Health Care Nurse Practitioner NP NP NP NP NP NP
NP=No Positions Reported

2009 AK Health Workforce Vacancy Study December 2009 ACRH and ISER
45
Table 32. Nursing Occupations Positions, Vacancies, and Vacancy Rates by Organization Type, Sample and Statewide Estimates (continued)
Hospitals/Nursing Homes Medical Clinics/Offices of Physicians Tribal Health Organizations
Sample Estimate Sample Estimate Sample Estimate
Occupation
Pos
itio
ns
Vac
anci
es
Vac
ancy
Rat
es
Pos
itio
ns
Vac
anci
es
Vac
ancy
Rat
es
Pos
itio
ns
Vac
anci
es
Vac
ancy
Rat
es
Pos
itio
ns
Vac
anci
es
Vac
ancy
Rat
es
Pos
itio
ns
Vac
anci
es
Vac
ancy
Rat
es
Pos
itio
ns
Vac
anci
es
Vac
ancy
Rat
es
Nurse Case Manager 43.0 5.0 11.6% 43.0 5.0 11.6% 19.0 5.0 26.3% 49.5 13.0 26.3% 128.0 10.0 7.8% 128.0 10.0 7.8%
Critical Care/Emergency Room/Intensive Care Unit Nurse
227.0 33.0 14.5% 227.0 33.0 14.5% 22.0 3.0 13.6% 57.3 7.8 13.6% 15.0 4.0 26.7% 15.0 4.0 26.7%
Family Nurse Practitioner 20.0 3.0 15.0% 20.0 3.0 15.0% 89.0 13.5 15.2% 231.8 35.2 15.2% 80.0 20.0 25.0% 80.0 20.0 25.0%
Nurse Anesthetist 6.0 0.0 0.0% 6.0 0.0 0.0% NP NP 21.0 0.0 0.0% 21.0 0.0 0.0%
Nurse Consultant 4.0 1.0 25.0% 4.0 1.0 25.0% 1.0 0.0 0.0% 2.6 0.0 0.0% NP NP
Nurse Educator 38.0 4.0 10.5% 38.0 4.0 10.5% 4.0 0.0 0.0% 10.4 0.0 0.0% 5.0 1.0 20.0% 5.0 1.0 20.0%
Nurse Manager 88.0 6.0 6.8% 88.0 6.0 6.8% 14.0 3.0 21.4% 36.5 7.8 21.4% 14.0 1.0 7.1% 14.0 1.0 7.1%
Nurse Midwife 3.0 0.0 0.0% 3.0 0.0 0.0% 10.0 4.0 40.0% 26.0 10.4 40.0% 12.0 0.0 0.0% 12.0 0.0 0.0%
Pediatric Nurse Practitioner
5.0 0.0 0.0% 5.0 0.0 0.0% 8.0 4.0 50.0% 20.8 10.4 50.0% 2.0 0.0 0.0% 2.0 0.0 0.0%
Psychiatric Nurse 77.0 9.0 11.7% 77.0 9.0 11.7% 2.0 0.0 0.0% 5.2 0.0 0.0% 3.0 2.0 66.7% 3.0 2.0 66.7%
Psychiatric Nurse Practitioner
8.0 3.0 37.5% 8.0 3.0 37.5% 9.0 1.0 11.1% 23.4 2.6 11.1% 3.0 0.0 0.0% 3.0 0.0 0.0%
Public Health Nurse 3.0 0.0 0.0% 3.0 0.0 0.0% NP NP 5.0 5.0 100.0% 5.0 5.0 100.0%
Registered Nurse 1,629.0 166.0 10.2% 1,629.0 166.0 10.2% 288.3 27.5 9.5% 750.7 71.6 9.5% 571.0 65.0 11.4% 571.0 65.0 11.4%
Women's Health Care Nurse Practitioner
NP NP 18.0 4.0 22.2% 46.9 10.4 22.2% 3.0 1.0 33.3% 3.0 1.0 33.3%
NP=No Positions Reported

2009 AK Health Workforce Vacancy Study December 2009 ACRH and ISER
46
Table 32. Nursing Occupations Positions, Vacancies, and Vacancy Rates by Organization Type, Sample and Statewide Estimates (continued)
Occupation
School Districts Paramedic Sites
Sample Estimates Sample Estimates
Pos
itio
ns
Vac
anci
es
Vac
ancy
R
ates
Pos
itio
ns
Vac
anci
es
Vac
ancy
R
ates
Pos
itio
ns
Vac
anci
es
Vac
ancy
R
ates
Pos
itio
ns
Vac
anci
es
Vac
ancy
R
ates
Nurse Case Manager NP NP NP NP
Critical Care/Emergency Room/Intensive Care Unit Nurse NP NP NP NP
Family Nurse Practitioner 1.0 0.0 0.0% 1.0 0.0 0.0% 1.0 0.0 0.0% 1.2 0.0 0.0%
Nurse Anesthetist NP NP NP NP
Nurse Consultant NP NP NP NP
Nurse Educator NP NP NP NP
Nurse Manager NP NP NP NP
Nurse Midwife NP NP NP NP
Pediatric Nurse Practitioner NP NP NP NP
Psychiatric Nurse NP NP NP NP
Psychiatric Nurse Practitioner NP NP NP NP
Public Health Nurse NP NP NP NP
Registered Nurse 125.5 6.0 4.8% 125.5 6.0 4.8% NP NP
Women's Health Care Nurse Practitioner 2.0 0.0 0.0% 2.0 0.0 0.0% NP NP
NP=No Positions Reported

2009 AK Health Workforce Vacancy Study December 2009 ACRH and ISER
47
Table 33 illustrates the many double-digit urban and rural estimated vacancy rates for professional nursing occupations.
Table 33. Professional Nursing Occupations, Vacancies, and Vacancy Rates by Urban and Rural Regions
Occupation
Urban Area Sample Urban Area Estimate Rural Area Sample Rural Area Estimates
Pos
itio
ns
Vac
anci
es
Vac
ancy
R
ates
Pos
itio
ns
Vac
anci
es
Vac
ancy
R
ates
Pos
itio
ns
Vac
anci
es
Vac
ancy
R
ates
Pos
itio
ns
Vac
anci
es
Vac
ancy
R
ates
Nurse Case Manger 147.0 15.0 10.2% 178.5 18.7 10.5% 71.0 7.0 9.9% 84.0 12.3 14.7%
Critical Care/Emergency Room/Intensive Care Unit Nurse
183.0 32.0 17.5% 211.9 33.6 15.9% 81.0 8.0 9.9% 87.4 11.2 12.8%
Family Nurse Practitioner 143.0 22.0 15.4% 250.4 36.4 14.6% 50.0 14.5 29.0% 86.9 21.7 25.0%
Nurse Anesthetist 21.0 0.0 0.0% 21.0 0.0 0.0% 6.0 0.0 0.0% 6.0 0.0 0.0%
Nurse Consultant 5.0 1.0 20.0% 6.6 1.0 15.1% NP NP
Nurse Educator 37.0 4.0 10.8% 41.8 4.0 9.6% 10.0 1.0 10.0% 11.6 1.0 8.6%
Nurse Manager 83.0 7.0 8.4% 102.6 10.2 9.9% 40.0 4.0 10.0% 46.3 61 13.2%
Nurse Midwife 22.0 3.0 13.6% 36.4 7.8 21.4% 3.0 1.0 33.3% 4.6 2.6 56.6%
Pediatric Nurse Practitioner 13.0 3.0 23.1% 24.2 7.88 32.2% 2.0 1.0 50.0% 3.6 2.6 72.3%
Psychiatric Nurse 81.0 11.0 13.6% 84.2 11.0 13.1% 1.0 0.0 0.0% 1.0 0.0 0.0%
Psychiatric Nurse Practitioner 23.0 5.0 21.7% 36.7 6.0 16.3% 2.0 1.0 50.0% 5.2 2.6 50.0%
Public Health Nurse 54.0 2.0 3.7% 54.0 2.0 3.7% 77.0 8.0 10.4 77.0 8.0 10.4
Registered Nurse 1,927.0 190.5 9.9% 2,378.2 229.6 9.7% 753.8 83.0 11.0% 797.8 92.0 11.5%
Women’s Health Care Nurse Practitioner 19.0 3.0 15.8% 46.3 7.8 16.9% 4.0 2.0 50.0% 5.6 3.6 64.3%
NP=No Positions Reported
As shown on Table 34, substantial to very high estimated vacancy rates appeared in the following key nursing specialties:
Nurse Case Managers—North, 10.0%; Southwest, 12.4%; Interior, 30.7%; Southeast, 31.8%; and Gulf Coast, 41.1% Family Nurse Practitioners—Southeast, 12.3%; Anchorage, 12.4%; Southwest, 22.4%; Gulf Coast, 28.7%; Interior, 33.7%;
and North, 100.0% Critical Care/Emergency Room/Intensive Care Unit Nurse—Southeast, 12.8%; Interior, 22.7%; and Southwest, 45.6%
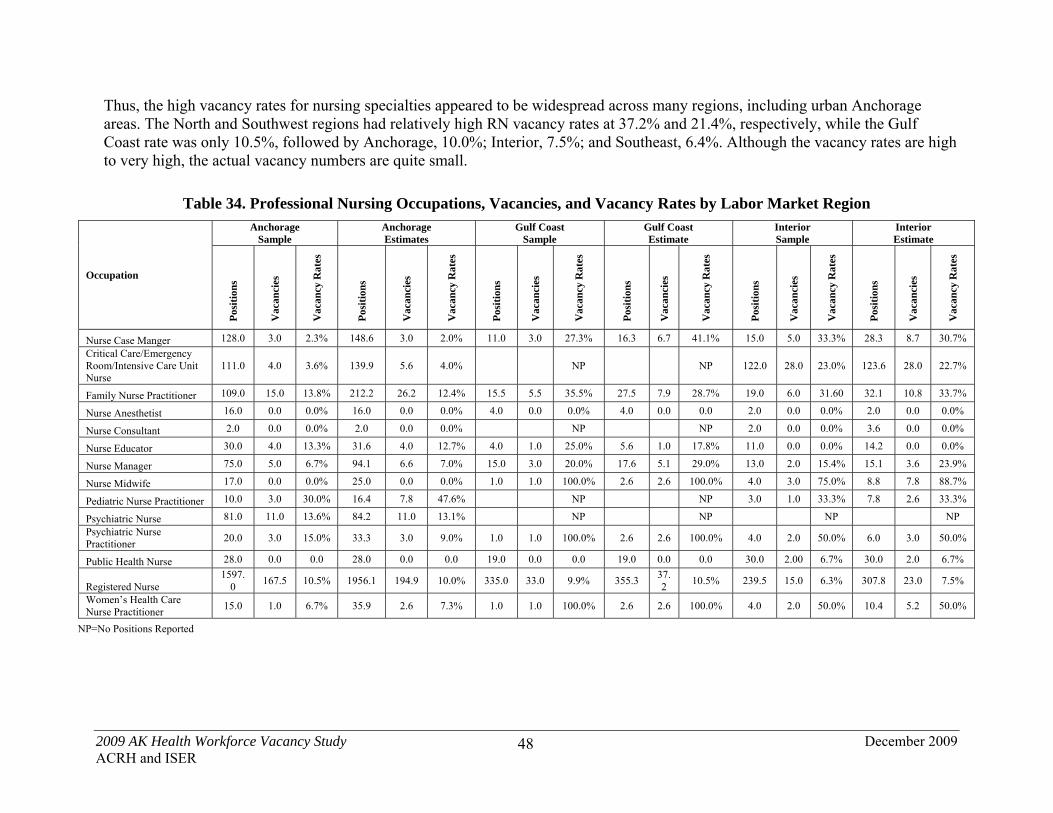
2009 AK Health Workforce Vacancy Study December 2009 ACRH and ISER
48
Thus, the high vacancy rates for nursing specialties appeared to be widespread across many regions, including urban Anchorage areas. The North and Southwest regions had relatively high RN vacancy rates at 37.2% and 21.4%, respectively, while the Gulf Coast rate was only 10.5%, followed by Anchorage, 10.0%; Interior, 7.5%; and Southeast, 6.4%. Although the vacancy rates are high to very high, the actual vacancy numbers are quite small.
Table 34. Professional Nursing Occupations, Vacancies, and Vacancy Rates by Labor Market Region
Occupation
Anchorage Sample
Anchorage Estimates
Gulf Coast Sample
Gulf Coast Estimate
Interior Sample
Interior Estimate
Pos
itio
ns
Vac
anci
es
Vac
ancy
Rat
es
Pos
itio
ns
Vac
anci
es
Vac
ancy
Rat
es
Pos
itio
ns
Vac
anci
es
Vac
ancy
Rat
es
Pos
itio
ns
Vac
anci
es
Vac
ancy
Rat
es
Pos
itio
ns
Vac
anci
es
Vac
ancy
Rat
es
Pos
itio
ns
Vac
anci
es
Vac
ancy
Rat
es
Nurse Case Manger 128.0 3.0 2.3% 148.6 3.0 2.0% 11.0 3.0 27.3% 16.3 6.7 41.1% 15.0 5.0 33.3% 28.3 8.7 30.7%
Critical Care/Emergency Room/Intensive Care Unit Nurse
111.0 4.0 3.6% 139.9 5.6 4.0% NP NP 122.0 28.0 23.0% 123.6 28.0 22.7%
Family Nurse Practitioner 109.0 15.0 13.8% 212.2 26.2 12.4% 15.5 5.5 35.5% 27.5 7.9 28.7% 19.0 6.0 31.60 32.1 10.8 33.7%
Nurse Anesthetist 16.0 0.0 0.0% 16.0 0.0 0.0% 4.0 0.0 0.0% 4.0 0.0 0.0 2.0 0.0 0.0% 2.0 0.0 0.0%
Nurse Consultant 2.0 0.0 0.0% 2.0 0.0 0.0% NP NP 2.0 0.0 0.0% 3.6 0.0 0.0%
Nurse Educator 30.0 4.0 13.3% 31.6 4.0 12.7% 4.0 1.0 25.0% 5.6 1.0 17.8% 11.0 0.0 0.0% 14.2 0.0 0.0%
Nurse Manager 75.0 5.0 6.7% 94.1 6.6 7.0% 15.0 3.0 20.0% 17.6 5.1 29.0% 13.0 2.0 15.4% 15.1 3.6 23.9%
Nurse Midwife 17.0 0.0 0.0% 25.0 0.0 0.0% 1.0 1.0 100.0% 2.6 2.6 100.0% 4.0 3.0 75.0% 8.8 7.8 88.7%
Pediatric Nurse Practitioner 10.0 3.0 30.0% 16.4 7.8 47.6% NP NP 3.0 1.0 33.3% 7.8 2.6 33.3%
Psychiatric Nurse 81.0 11.0 13.6% 84.2 11.0 13.1% NP NP NP NP
Psychiatric Nurse Practitioner
20.0 3.0 15.0% 33.3 3.0 9.0% 1.0 1.0 100.0% 2.6 2.6 100.0% 4.0 2.0 50.0% 6.0 3.0 50.0%
Public Health Nurse 28.0 0.0 0.0 28.0 0.0 0.0 19.0 0.0 0.0 19.0 0.0 0.0 30.0 2.00 6.7% 30.0 2.0 6.7%
Registered Nurse 1597.
0 167.5 10.5% 1956.1 194.9 10.0% 335.0 33.0 9.9% 355.3
37.2
10.5% 239.5 15.0 6.3% 307.8 23.0 7.5%
Women’s Health Care Nurse Practitioner
15.0 1.0 6.7% 35.9 2.6 7.3% 1.0 1.0 100.0% 2.6 2.6 100.0% 4.0 2.0 50.0% 10.4 5.2 50.0%
NP=No Positions Reported

2009 AK Health Workforce Vacancy Study December 2009 ACRH and ISER
49
Table 34. Professional Nursing Occupations, Vacancies, and Vacancy Rates by Labor Market Region (continued)
Southeast
Sample Southeast Estimate
North Sample
North Estimate
Southwest Sample
Southwest Estimates
Occupation
Pos
itio
ns
Vac
anci
es
Vac
ancy
R
ates
Pos
itio
ns
Vac
anci
es
Vac
ancy
R
ates
Pos
itio
ns
Vac
anci
es
Vac
ancy
R
ates
Pos
itio
ns
Vac
anci
es
Vac
ancy
R
ates
Pos
itio
ns
Vac
anci
es
Vac
ancy
R
ates
Pos
itio
ns
Vac
anci
es
Vac
ancy
R
ates
Nurse Case Manger 20.0 7.0 35.0% 22.0 7.0 31.8% 10.0 1.0 10.0% 10.0 1.0 10.0% 34.0 3.0 8.8% 37.2 4.6 12.4%
Critical Care/Emergency Room/Intensive Care Unit Nurse
14.0 2.0 14.3% 15.6 2.0 12.8% NP NP 17.0 6.0 35.3% 20.2 9.2 45.6%
Family Nurse Practitioner 35.0 4.0 11.4% 45.4 5.6 12.3% 4.0 4.0 100.0% 4.0 4.0 100.0% 10.5 2.0 19.0% 16.1 3.6 22.4%
Nurse Anesthetist 3.0 0.0 0.0% 3.0 0.0 0.0% NP NP 2.0 0.0 0.0% 2.0 0.0 0.0%
Nurse Consultant 1.0 1.0 100.0% 1.0 1.0 100.0% NP NP NP NP
Nurse Educator 1.0 0.0 0.0% 1.0 0.0 0.0% NP NP 1.0 0.0 0.0% 1.0 0.0 0.0%
Nurse Manager 16.0 0.0 0.0% 18.1 0.0 0.0% 1.0 1.0 100.0% 1.0 1.0 100.0% 3.0 0.0 0.0% 3.0 0.0 0.0%
Nurse Midwife 3.0 0.0 0.0% 4.6 0.0 0.0% NP NP NP NP
Pediatric Nurse Practitioner 1.0 0.0 0.0% 2.6 0.0 0.0% NP NP 1.0 0.0 0.0% 1.0 0.0 0.0%
Psychiatric Nurse NP NP NP NP 1.0 0.0 0.0% 1.0 0.0 0.0%
Psychiatric Nurse Practitioner NP NP NP NP NP NP
Public Health Nurse 25.0 0.0 0.0% 25.0 0.0 0.0% 5.0 5.0 100.0% 5.0 5.0 100.0% 24.0 3.0 12.5% 24.0 3.0 12.5%
Registered Nurse 352.0 20.0 5.7% 395.9 25.3 6.4% 43.0 16.0 37.2% 43.0 16.0 37.2% 114.3 22.0 19.3% 117.9 25.2 21.4%
Women’s Health Care Nurse Practitioner
NP NP 1.0 1.0 100.0% 1.0 1.0 100.0% 2.0 0.0 0.0% 2.0 0.0 0.0%
NP=No Positions Reported
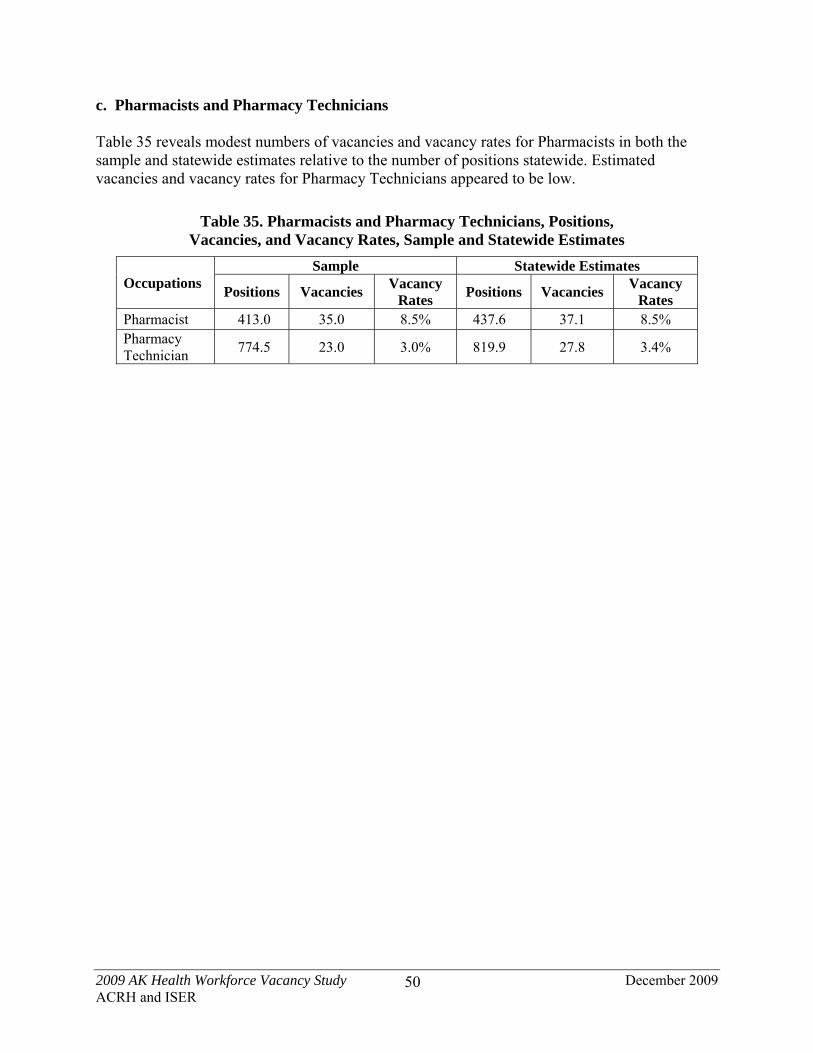
2009 AK Health Workforce Vacancy Study December 2009 ACRH and ISER
50
c. Pharmacists and Pharmacy Technicians Table 35 reveals modest numbers of vacancies and vacancy rates for Pharmacists in both the sample and statewide estimates relative to the number of positions statewide. Estimated vacancies and vacancy rates for Pharmacy Technicians appeared to be low.
Table 35. Pharmacists and Pharmacy Technicians, Positions, Vacancies, and Vacancy Rates, Sample and Statewide Estimates
Occupations Sample Statewide Estimates
Positions Vacancies Vacancy
Rates Positions Vacancies
Vacancy Rates
Pharmacist 413.0 35.0 8.5% 437.6 37.1 8.5% Pharmacy Technician
774.5 23.0 3.0% 819.9 27.8 3.4%

2009 AK Health Workforce Vacancy Study December 2009 ACRH and ISER
51
Pharmacies had the greatest number of Pharmacist positions, followed by Tribal Health Organizations (Table 36). The estimated vacancy rate was the highest for Behavioral Health Services at 100.0%. The remaining estimated vacancy rates ranged from 8.2% to 5.8%. Following Pharmacies, Hospitals/Nursing Homes had the second highest number of technician positions. Estimated vacancy rates were low for this occupation, with the exception of Medical Clinics which had 7.8 estimated vacancies for a vacancy rate of 10.7%.
Table 36. Pharmacy Occupations Positions, Vacancies, and Vacancy Rates by Organization Type, Sample and Statewide Estimates
Occupation
Behavioral Health Services Hospitals/Nursing Homes Medical Clinics/Offices of Physicians Sample Estimate Sample Estimate Sample Estimates
Pos
itio
ns
Vac
anci
es
Vac
ancy
R
ates
Pos
itio
ns
Vac
anci
es
Vac
ancy
R
ates
Pos
itio
ns
Vac
anci
es
Vac
ancy
R
ates
Pos
itio
ns
Vac
anci
es
Vac
ancy
R
ates
Pos
itio
ns
Vac
anci
es
Vac
ancy
R
ates
Pos
itio
ns
Vac
anci
es
Vac
ancy
R
ates
Pharmacist 1.0 1.0 100.0% 1.5 1.5 100.0% 86.0 5.0 5.8% 86.0 5.0 5.8% 15.0 1.0 6.7% 39.1 2.6 6.7%
Pharmacy Technician
1.0 0.0 0.0% 1.5 0.0 0.0% 97.0 3.0 3.1% 97.0 3.0 3.1% 28.0 3.0 10.7% 72.9 7.8 10.7%
Occupation
Tribal Health Organizations Pharmacies Physical/Occupational/Speech
Therapy Sample Estimate Sample Estimate Sample Estimate
Pos
itio
ns
Vac
anci
es
Vac
ancy
R
ates
Pos
itio
ns
Vac
anci
es
Vac
ancy
R
ates
Pos
itio
ns
Vac
anci
es
Vac
ancy
R
ates
Pos
itio
ns
Vac
anci
es
Vac
ancy
R
ates
Pos
itio
ns
Vac
anci
es
Vac
ancy
R
ates
Pos
itio
ns
Vac
anci
es
Vac
ancy
R
ates
Pharmacist 92.0 10.0 10.9% 92.0 10.0 10.9% 219.0 18.0 8.2% 219.0 18.0 8.2% NP NP
Pharmacy Technician
77.0 3.0 3.9% 77.0 3.0 3.9% 571.5 14.0 2.4% 571.5 14.0 2.4% NP NP
NP=No Positions Reported

2009 AK Health Workforce Vacancy Study December 2009 ACRH and ISER
52
Urban areas have the higher number of sample and estimated positions for Pharmacists and Pharmacy Technicians. Rural areas had higher sample and estimated vacancy rates for both occupations (Table 37).
Table 37. Pharmacy Occupations Positions, Vacancies, and Vacancy Rates, Urban and Rural Areas, Sample and Statewide Estimates
Occupation
Urban Rural Sample Estimate Sample Estimate
Pos
itio
ns
Vac
anci
es
Vac
ancy
R
ates
Pos
itio
ns
Vac
anci
es
Vac
ancy
R
ates
Pos
itio
ns
Vac
anci
es
Vac
ancy
R
ates
Pos
itio
ns
Vac
anci
es
Vac
ancy
R
ates
Pharmacist 324.5 24.0 7.4% 348.6 25.6 7.3% 88.5 11.0 12.4% 89.0 11.5 12.9% Pharmacy Technician
651.5 18.0 2.8% 686.8 21.2 3.1% 123.0 5.0 4.1% 133.1 6.6 5.0%
Looking at the breakdown by geographic regions (Table 38), the North had the highest sample and estimated vacancy rate for Pharmacists (75.0% for sample and estimated vacancy rate), followed by the Interior (18.2% sample, 17.8% estimated vacancy rates), and Southwest (15.0% sample and estimated vacancy rates). The highest sample and estimated vacancy rates for the Pharmacy Technician were also in the North region at 25.0%, followed by the Southwest region with a sample vacancy rate of 5.3% and an estimated vacancy rate of 12.6%.
Table 38. Pharmacy Occupations Positions, Vacancies, and Vacancy Rates by Geographic Region, Sample and Statewide Estimates
Geographic Region
Occupation
Sample Estimate
Pos
itio
ns
Vac
anci
es
Vac
ancy
R
ates
Pos
itio
ns
Vac
anci
es
Vac
ancy
R
ates
Anchorage Pharmacist 269.5 15.0 5.6% 282.3 15.0 5.3% Pharmacy Technician 602.5 14.0 2.3% 621.8 14.0 2.3%
Gulf Coast Pharmacist 26.0 2.0 7.7% 26.5 2.5 9.4% Pharmacy Technician 34.0 0.0 0.0% 36.1 0.0 0.0%
Interior Pharmacist 33.0 6.0 18.2% 42.6 7.6 17.8% Pharmacy Technician 46.0 4.0 8.7% 66.9 7.2 10.8%
Southeast Pharmacist 60.5 6.0 9.9% 62.1 6.0 9.7% Pharmacy Technician 65.0 2.0 3.1% 66.6 2.0 3.0%
North Pharmacist 4.0 3.0 75.0% 4.0 3.0 75.0% Pharmacy Technician 8.0 2.0 25.0% 8.0 2.0 25.0%
Southwest Pharmacist 20.0 3.0 15.0% 20.0 3.0 15.0% Pharmacy Technician 19.0 1.0 5.3% 20.6 2.6 12.6%
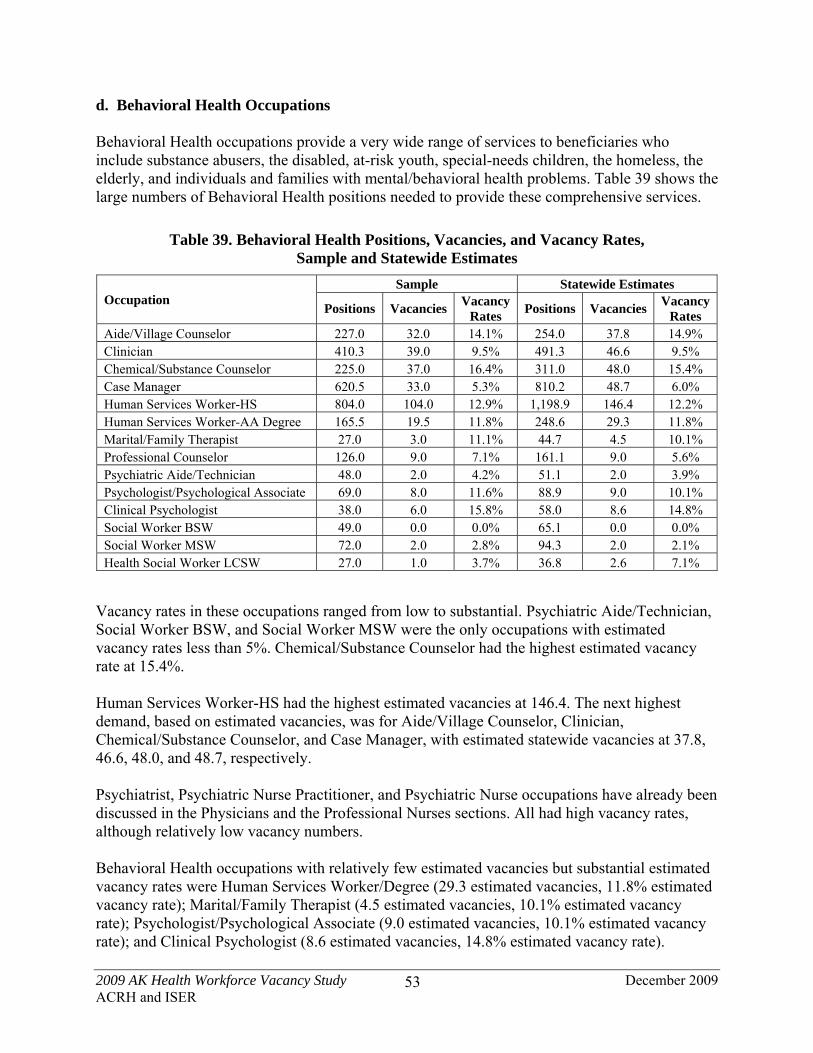
2009 AK Health Workforce Vacancy Study December 2009 ACRH and ISER
53
d. Behavioral Health Occupations Behavioral Health occupations provide a very wide range of services to beneficiaries who include substance abusers, the disabled, at-risk youth, special-needs children, the homeless, the elderly, and individuals and families with mental/behavioral health problems. Table 39 shows the large numbers of Behavioral Health positions needed to provide these comprehensive services.
Table 39. Behavioral Health Positions, Vacancies, and Vacancy Rates, Sample and Statewide Estimates
Occupation Sample Statewide Estimates
Positions Vacancies Vacancy
Rates Positions Vacancies
Vacancy Rates
Aide/Village Counselor 227.0 32.0 14.1% 254.0 37.8 14.9% Clinician 410.3 39.0 9.5% 491.3 46.6 9.5% Chemical/Substance Counselor 225.0 37.0 16.4% 311.0 48.0 15.4% Case Manager 620.5 33.0 5.3% 810.2 48.7 6.0% Human Services Worker-HS 804.0 104.0 12.9% 1,198.9 146.4 12.2% Human Services Worker-AA Degree 165.5 19.5 11.8% 248.6 29.3 11.8% Marital/Family Therapist 27.0 3.0 11.1% 44.7 4.5 10.1% Professional Counselor 126.0 9.0 7.1% 161.1 9.0 5.6% Psychiatric Aide/Technician 48.0 2.0 4.2% 51.1 2.0 3.9% Psychologist/Psychological Associate 69.0 8.0 11.6% 88.9 9.0 10.1% Clinical Psychologist 38.0 6.0 15.8% 58.0 8.6 14.8% Social Worker BSW 49.0 0.0 0.0% 65.1 0.0 0.0% Social Worker MSW 72.0 2.0 2.8% 94.3 2.0 2.1% Health Social Worker LCSW 27.0 1.0 3.7% 36.8 2.6 7.1%
Vacancy rates in these occupations ranged from low to substantial. Psychiatric Aide/Technician, Social Worker BSW, and Social Worker MSW were the only occupations with estimated vacancy rates less than 5%. Chemical/Substance Counselor had the highest estimated vacancy rate at 15.4%. Human Services Worker-HS had the highest estimated vacancies at 146.4. The next highest demand, based on estimated vacancies, was for Aide/Village Counselor, Clinician, Chemical/Substance Counselor, and Case Manager, with estimated statewide vacancies at 37.8, 46.6, 48.0, and 48.7, respectively. Psychiatrist, Psychiatric Nurse Practitioner, and Psychiatric Nurse occupations have already been discussed in the Physicians and the Professional Nurses sections. All had high vacancy rates, although relatively low vacancy numbers. Behavioral Health occupations with relatively few estimated vacancies but substantial estimated vacancy rates were Human Services Worker/Degree (29.3 estimated vacancies, 11.8% estimated vacancy rate); Marital/Family Therapist (4.5 estimated vacancies, 10.1% estimated vacancy rate); Psychologist/Psychological Associate (9.0 estimated vacancies, 10.1% estimated vacancy rate); and Clinical Psychologist (8.6 estimated vacancies, 14.8% estimated vacancy rate).

2009 AK Health Workforce Vacancy Study December 2009 ACRH and ISER
54
While the estimated vacancy rates for Chemical/Substance Counselors (17.3%), Marital/Family Therapists (23.1%), Psychologist/Psychological Associates (18.2%), and Clinical Psychologists (25.0%) were heavily concentrated in Behavioral Health Organizations, high estimated vacancies appeared to be concentrated in other organization types as well (Table 40):
Tribal Health Organizations—Behavioral Health Clinician, 16.9% (23.0 estimated vacancies); Human Services Worker–HS, 22.9% (28.0 estimated vacancies); Professional Counselor, 100.0% (6.0 estimated vacancies); Clinical Psychologist, 22.2% (2.0 estimated vacancies); and Social Worker MSW, 20.0% (2.0 estimated vacancies).
Hospitals/Nursing Homes—Chemical/Substance Counselor, 26.1% (6.0 estimated vacancies).
School Districts—Professional Counselor, 15.0% (3.0 estimated vacancies) and Psychologist/ Psychological Associate, 13.6% (6.0 estimated vacancies).
Medical Clinics/Offices of Physicians—Social Worker LCSW, 33.3% (2.6 estimated vacancies).
Table 40. Behavioral Health Occupations, Estimated Vacancies, and Vacancy Rates by Organization Type
Occupation
Behavioral Health Services
Hospitals/Nursing Homes
Tribal Health Organizations
Medical Clinics/ Offices of Physicians
School Districts
Est
imat
ed
Vac
anci
es
Est
imat
ed
Vac
ancy
R
ates
Est
imat
ed
Vac
anci
es
Est
imat
ed
Vac
ancy
R
ates
Est
imat
ed
Vac
anci
es
Est
imat
ed
Vac
ancy
R
ates
Est
imat
ed
Vac
anci
es
Est
imat
ed
Vac
ancy
R
ates
Est
imat
ed
Vac
anci
es
Est
imat
ed
Vac
ancy
R
ates
Aide/Village Counselor
3.0 5.3% NP 27.0 14.7% 7.8 60.0% NP
Clinician 18.0 9.9% 3.0 7.2% 23.0 16.9% 2.6 7.8% 0 0.0% Chemical/Substance Counselor
33.0 17.3% 6.0 26.1% 9.0 14.8% 0.0 0.0% NP
Case Manager 37.5 8.6% 2.0 1.3% 4.0 2.6% 5.2 7.1% NP Human Services Worker–HS
108.0 11.6% 0.0 0.0% 28.0 22.9% 10.4 7.7% NP
Human Services Worker–AA Degree
29.3 12.5% 0.0 0.0% 0.0 0.0% 0.0 0.0% NP
Marital/Family Therapist
4.5 23.1% 0.0 0.0% NP 0.0 0.0% NP
Professional Counselor
0.0 0.0% 0.0 0.0% 6.0 100.0% 0.0 0.0% 3.0 15.0%
Psych Aide/Tech 0.0 0.0% 0.0 0.0% 2.0 7.1% 0.0 0.0% NP Psychologist/Psych Associate
3.0 18.2% 0.0 0.0% 0.0 0.0% 0.0 0.0% 6.0 13.6%
Clinical Psychologist
3.0 25.0% 1.0 9.1% 2.0 22.2% 2.6 10.0% NP
Social Worker BSW 0.0 0.0% 0.0 0.0% NP 0.0 0.0% NP Social Worker MSW
0.0 0.0% 0.0 0.0% 2.0 20.0% 0.0 0.0% NP
Social Worker LCSW
0.0 0.0% 0.0 0.0% 0.0 0.0% 2.6 33.3% NP
NP=No Positions Reported

2009 AK Health Workforce Vacancy Study December 2009 ACRH and ISER
55
Estimated vacancy rates for many occupations were high in all regions for at least one occupation, many with small numbers of positions (Table 41). Those that were greater than 20% are listed below:
• Aide/Village Counselor—Gulf Coast, 23.1%; Interior, 43.7%; North, 41.2% • Clinician—Southwest, 36.0% • Chemical/Substance Counselor—North, 100.0%; Interior, 26.9% • Case Manager—Southwest, 25.5% • Human Services Worker–HS—Southwest, 29.6% • Human Services Worker-AA Degree—Interior, 35.3% • Marital/Family Therapist—Southeast, 100.0% • Professional Counselor—Southwest, 43.4% • Psychologist/Psychological Associate—Southeast, 28.6% • Clinical Psychologist—Interior, 33.3%; Southeast, 29.4%; North, 50.0% • Social Worker MSW—Southwest, 22.2% • Social Worker LCSW—Interior, 50.0%
Table 41. Behavioral Health-Specific Occupations, Vacancies, and Vacancy Rates by Labor Market Region
Occupation
Anchorage Gulf Coast Interior Southeast North Southwest
Estimated Vacancies
Estimated Vacancy
Rates
Estimated Vacancies
Estimated Vacancy
Rates
Estimated Vacancies
Estimated Vacancy
Rates
Estimated Vacancies
Estimated Vacancy
Rates
Estimated Vacancies
Estimated Vacancy
Rates
Estimated Vacancies
Estimated Vacancy
Rates
Aide/Village Counselor 3.0 5.2% 3.0 23.1% 11.8 43.7% NP 7.0 41.2% 13.0 9.4% Clinician 14.0 7.0% 3.0 14.5% 2.0 2.1% 8.0 11.3% 5.0 7.9% 14.6 36.0% Chemical/Substance Counselor 20.5 14.9% 1.0 2.3% 13.5 26.9% 12.0 18.3% 1.0 100.0% 0.0 0.0% Case Manager 36.6 6.1% 0.0 0.0% 4.0 7.5% 5.5 7.6% 0.0 0.0% 2.6 25.5% Human Services Worker–HS 97.5 12.3% 10.4 5.7% 9.5 11.2% 4.0 8.6% 1.0 9.5% 24.0 29.6% Human Services Worker–AA 16.5 9.5% 1.5 9.8% 3.0 35.3% 8.3 17.5% 0.0 0.0% 0.0 0.0% Marital/Family Therapist 1.5 4.7% 0.0 0.0% 0.0 0.0% 3.0 100.0% NP 0.0 0.0% Professional Counselor 2.0 2.5% 3.0 6.3% 0.0 0.0% 0.0 0.0% NP 4.0 43.4% Psychiatric Aide/Technician 0.0 0.0% NP 0.0 0.0% NP NP 2.0 7.1% Psychologist/Psychological Assoc 3.0 5.7% 2.0 14.3% 1.0 12.5% 3.0 28.6% 0.0 0.0% NP Clinical Psychologist 3.6 12.0% 0.0 0.0% 1.5 33.3% 2.5 29.4% 1.0 50.0% 0.0 0.0% Social Worker BSW 0.0 0.0% 0.0 0.0% 0.0 0.0% 0.0 0.0% NP NP Social Worker MSW 1.0 1.8% 0.0 0.0% 0.0 0.0% 0.0 0.0% NP 1.0 22.2% Social Worker LCSW 0.0 0.0% 0.0 0.0% 2.6 50.0% 0.0 0.0% 0.0 0.0% 0.0 0.0%
NP=No Positions Reported
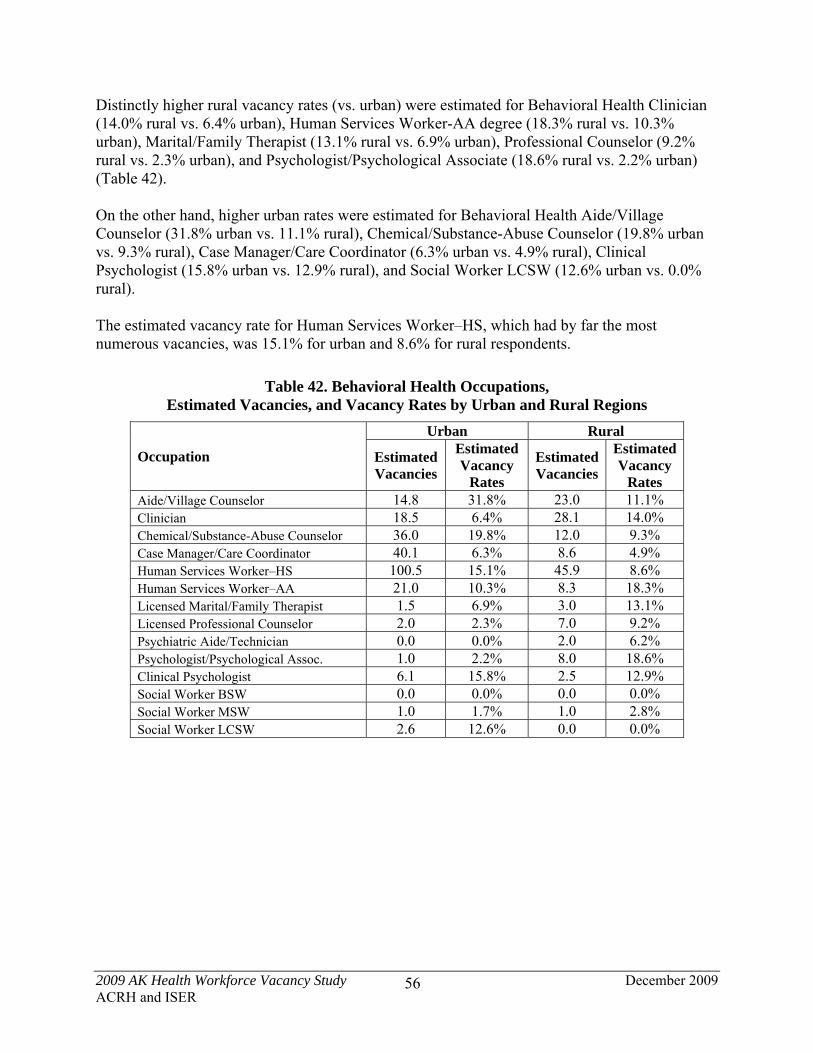
2009 AK Health Workforce Vacancy Study December 2009 ACRH and ISER
56
Distinctly higher rural vacancy rates (vs. urban) were estimated for Behavioral Health Clinician (14.0% rural vs. 6.4% urban), Human Services Worker-AA degree (18.3% rural vs. 10.3% urban), Marital/Family Therapist (13.1% rural vs. 6.9% urban), Professional Counselor (9.2% rural vs. 2.3% urban), and Psychologist/Psychological Associate (18.6% rural vs. 2.2% urban) (Table 42). On the other hand, higher urban rates were estimated for Behavioral Health Aide/Village Counselor (31.8% urban vs. 11.1% rural), Chemical/Substance-Abuse Counselor (19.8% urban vs. 9.3% rural), Case Manager/Care Coordinator (6.3% urban vs. 4.9% rural), Clinical Psychologist (15.8% urban vs. 12.9% rural), and Social Worker LCSW (12.6% urban vs. 0.0% rural). The estimated vacancy rate for Human Services Worker–HS, which had by far the most numerous vacancies, was 15.1% for urban and 8.6% for rural respondents.
Table 42. Behavioral Health Occupations, Estimated Vacancies, and Vacancy Rates by Urban and Rural Regions
Occupation
Urban Rural
Estimated Vacancies
Estimated Vacancy
Rates
Estimated Vacancies
Estimated Vacancy
Rates Aide/Village Counselor 14.8 31.8% 23.0 11.1% Clinician 18.5 6.4% 28.1 14.0% Chemical/Substance-Abuse Counselor 36.0 19.8% 12.0 9.3% Case Manager/Care Coordinator 40.1 6.3% 8.6 4.9% Human Services Worker–HS 100.5 15.1% 45.9 8.6% Human Services Worker–AA 21.0 10.3% 8.3 18.3% Licensed Marital/Family Therapist 1.5 6.9% 3.0 13.1% Licensed Professional Counselor 2.0 2.3% 7.0 9.2% Psychiatric Aide/Technician 0.0 0.0% 2.0 6.2% Psychologist/Psychological Assoc. 1.0 2.2% 8.0 18.6% Clinical Psychologist 6.1 15.8% 2.5 12.9% Social Worker BSW 0.0 0.0% 0.0 0.0% Social Worker MSW 1.0 1.7% 1.0 2.8% Social Worker LCSW 2.6 12.6% 0.0 0.0%

2009 AK Health Workforce Vacancy Study December 2009 ACRH and ISER
57
e. Dental Occupations “Dentist” includes Orthodontist and Dental/Oral Surgeon. (Dental Health Aide Therapist will be discussed in the Tribal Health Organization section of occupations). Table 43 shows that 12.0 vacancies were reported for Dentists in the sample, and 14.5 were estimated statewide; the estimated vacancy rate was 2.6% but was even higher in the sample (3.8%). Vacancies for Dental Hygienists were modest at 40.7 statewide estimates, and an estimated vacancy rate of 8.0%. Dental Assistants had more numerous estimated vacancies at 61.7, with a relatively modest estimated vacancy rate of 6.4%.
Table 43. Dental Positions, Vacancies, and Vacancy Rates, Sample and Statewide Estimates
Occupation Sample Statewide Estimates
Positions VacanciesVacancy
Rates Positions Vacancies
Vacancy Rates
Dentist 318.0 12.0 3.8% 551.3 14.5 2.6% Dental Assistant 574.0 34.0 5.9% 968.3 61.7 6.4% Dental Hygienist 285.5 21.5 7.5% 506.6 40.7 8.0%

2009 AK Health Workforce Vacancy Study December 2009 ACRH and ISER
58
These estimated Dentist vacancies were primarily in Dental Clinics/Offices and Tribal Health Organizations (Table 44). Tribal Health Organizations had a Dentist vacancy rate and estimated vacancy rate of 16.7%. The vacancy rate and estimated vacancy rate for Dental Clinics/Offices was much lower—only 1.2%. Medical Clinics/Offices of Physicians had 57.3 estimated positions but zero vacancies. The distribution of the estimated Dental Assistant and Hygienist positions were more strongly concentrated in the Dental Clinics, followed by Tribal Health Organizations with a few in Medical Clinics/Offices of Physicians. Dental Assistant estimated vacancy rates were 10.3% in Medical Clinics (7.8 estimated vacancies) and 6.6% in Dental Clinics (50.9 estimated vacancies). The estimated vacancy rate for Dental Hygienists was highest in the Medical Clinics at 25.0% (5.2 estimated vacancies), followed by Dental Clinics at 7.7% (35.5 estimated vacancies).
Table 44. Dental Positions, Vacancies, and Vacancy Rates by Organization Type, Sample and Statewide Estimates
Occupation
Dental Clinics/Offices Medical Clinics/Offices of Physicians Tribal Health Organizations Sample Estimate Sample Estimate Sample Estimate
Pos
itio
ns
Vac
anci
es
Vac
ancy
R
ates
Pos
itio
ns
Vac
anci
es
Vac
ancy
R
ates
Pos
itio
ns
Vac
anci
es
Vac
ancy
R
ates
Pos
itio
ns
Vac
anci
es
Vac
ancy
R
ates
Pos
itio
ns
Vac
anci
es
Vac
ancy
R
ates
Pos
itio
ns
Vac
anci
es
Vac
ancy
R
ates
Dentist 242.0 3.0 1.2% 440.0 5.5 1.2% 22.0 0.0 0.0% 57.3 0.0 0.0% 54.0 9.0 16.7% 54.0 9.0 16.7% Dental Assistant 425.0 28.0 6.6% 772.7 50.9 6.6% 29.0 3.0 10.3% 75.5 7.8 10.3% 120.0 3.0 2.5% 120.0 3.0 2.5% Dental Hygienist 254.5 19.5 7.7 462.7 35.5 7.7% 8.0 2.0 25.0% 20.8 5.2 25.0% 23.0 0.0 0.0% 23.0 0.0 0.0%

2009 AK Health Workforce Vacancy Study December 2009 ACRH and ISER
59
Table 45 shows that estimated vacancies for dental occupations were higher for Dentist in the rural areas, with an estimated rural vacancy rate of 7.1%. This was in part due to the high estimated vacancy numbers and rates for the Tribal Health Organizations, which are overwhelmingly rural.
Table 45. Dental Occupations, Estimated Vacancies, and Vacancy Rates by Urban and Rural Regions
Occupation
Urban Rural
Estimated Vacancies
Estimated Vacancy
Rates
Estimated Vacancies
Estimated Vacancy
Rates Dentist 2.8 0.7% 11.6 7.1% Dental Assistant 33.5 5.2% 28.2 8.7% Dental Hygienist 16.4 4.6% 24.3 15.8%
Looking at the regional distribution of vacancies and estimated rates (see Table 46), Dentist vacancy rates were highest in the North (38.9%) and Southwest (15.8%), which was consistent with the strongly rural distribution of these vacancies. Dental Assistant estimated vacancy rates were highest in the Gulf Coast (10.3%), North (10.2%), and Southwest (11.9%). Dental Hygienist estimated vacancy rates were high in four regions: Gulf Coast (17.2%), Southeast (12.7%), North (100.0%), and Southwest (21.6%).
Table 46. Dental Occupations, Estimated Vacancies, and Vacancy Rates by Labor Market Regions
Occupation
Anchorage Gulf Coast Interior Southeast North Southwest
Estimated Number
Estimated Vacancy
Rate
Estimated Number
Estimated Vacancy
Rate
Estimated Number
Estimated Vacancy
Rate
Estimated Number
Estimated Vacancy
Rate
Estimated Number
Estimated Vacancy
Rate
Estimated Number
Estimated Vacancy
Rate
Dentist 2.8 0.9% 1.0 1.9% 0.0 0.0% 2.8 5.9% 3.8 38.9% 4.0 15.8% Dental Assistant 30.9 6.0% 9.9 10.3% 6.2 3.4% 7.3 6.3% 2.0 10.2% 5.5 11.9% Dental Hygienist 15.5 5.3% 11.7 17.2% 1.8 2.4% 7.3 12.7% 1.8 100.0% 2.6 21.6%
NP=No Positions Reported

2009 AK Health Workforce Vacancy Study December 2009 ACRH and ISER
60
f. Physical, Occupational, and Speech Therapist This occupational group includes Physical Therapist, Occupational Therapist, Speech Therapist, Speech-Language Pathologist, and the Allied Health occupation Physical Therapy Assistant. In addition to therapy clinics and offices, these occupations are employed by a broad range of respondent types, including Hospitals/Nursing Homes, Tribal Health Organizations, Medical Clinics/Offices of Physicians, and School Districts (most of which, however, contract with private providers rather than hire therapists directly). Table 47 shows that vacancy rates, both sample and statewide estimates, were substantial to very high for all of these occupations.
Table 47. Physical, Occupational, and Speech Therapist Positions, Vacancies, and Vacancy Rates, Sample and Statewide Estimates
Occupation Sample Statewide Estimates
Positions Vacancies Vacancy
Rates Positions Vacancies
Vacancy Rates
Physical Therapist 245.0 40.5 16.5% 292.5 46.2 15.8% Occupational Therapist 115.0 26.0 22.6% 128.5 29.3 22.8% Speech Therapist 56.5 8.5 15.0% 63.4 9.9 15.5% Speech-language Pathologist
151.5 15.5 10.2% 157.7 16.4 10.4%
Physical Therapy Assistant
53.0 16.0 30.2% 62.3 17.8 28.5%
The estimated vacancy rate for Physical Therapist was 15.8%; for Speech Therapist, 15.5%. The rate was 28.5% for Physical Therapy Assistant. Sample vacancy rates ranged from 10.2% for Speech-language Pathologist to 30.2% for Physical Therapy Assistant.
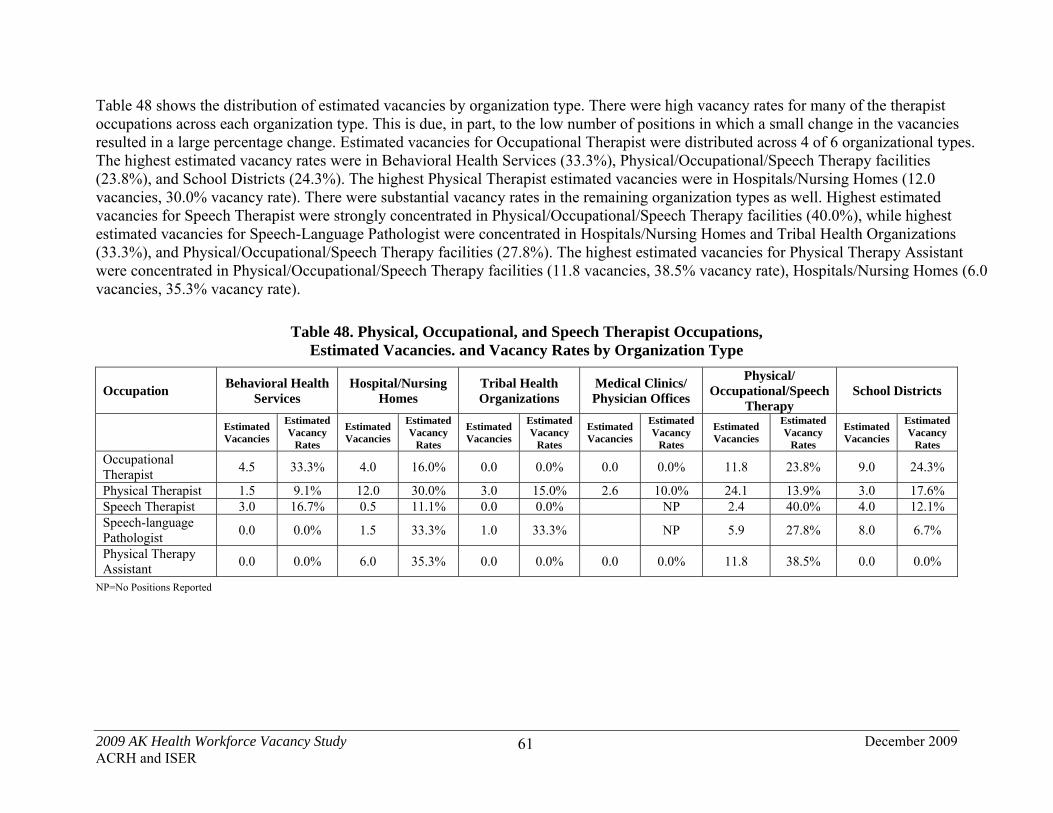
2009 AK Health Workforce Vacancy Study December 2009 ACRH and ISER
61
Table 48 shows the distribution of estimated vacancies by organization type. There were high vacancy rates for many of the therapist occupations across each organization type. This is due, in part, to the low number of positions in which a small change in the vacancies resulted in a large percentage change. Estimated vacancies for Occupational Therapist were distributed across 4 of 6 organizational types. The highest estimated vacancy rates were in Behavioral Health Services (33.3%), Physical/Occupational/Speech Therapy facilities (23.8%), and School Districts (24.3%). The highest Physical Therapist estimated vacancies were in Hospitals/Nursing Homes (12.0 vacancies, 30.0% vacancy rate). There were substantial vacancy rates in the remaining organization types as well. Highest estimated vacancies for Speech Therapist were strongly concentrated in Physical/Occupational/Speech Therapy facilities (40.0%), while highest estimated vacancies for Speech-Language Pathologist were concentrated in Hospitals/Nursing Homes and Tribal Health Organizations (33.3%), and Physical/Occupational/Speech Therapy facilities (27.8%). The highest estimated vacancies for Physical Therapy Assistant were concentrated in Physical/Occupational/Speech Therapy facilities (11.8 vacancies, 38.5% vacancy rate), Hospitals/Nursing Homes (6.0 vacancies, 35.3% vacancy rate).
Table 48. Physical, Occupational, and Speech Therapist Occupations, Estimated Vacancies. and Vacancy Rates by Organization Type
Occupation Behavioral Health
Services Hospital/Nursing
Homes Tribal Health Organizations
Medical Clinics/ Physician Offices
Physical/ Occupational/Speech
TherapySchool Districts
Estimated Vacancies
Estimated Vacancy
Rates
Estimated Vacancies
Estimated Vacancy
Rates
Estimated Vacancies
Estimated Vacancy
Rates
Estimated Vacancies
Estimated Vacancy
Rates
Estimated Vacancies
Estimated Vacancy
Rates
Estimated Vacancies
Estimated Vacancy
Rates
Occupational Therapist
4.5 33.3% 4.0 16.0% 0.0 0.0% 0.0 0.0% 11.8 23.8% 9.0 24.3%
Physical Therapist 1.5 9.1% 12.0 30.0% 3.0 15.0% 2.6 10.0% 24.1 13.9% 3.0 17.6% Speech Therapist 3.0 16.7% 0.5 11.1% 0.0 0.0% NP 2.4 40.0% 4.0 12.1% Speech-language Pathologist
0.0 0.0% 1.5 33.3% 1.0 33.3% NP 5.9 27.8% 8.0 6.7%
Physical Therapy Assistant
0.0 0.0% 6.0 35.3% 0.0 0.0% 0.0 0.0% 11.8 38.5% 0.0 0.0%
NP=No Positions Reported
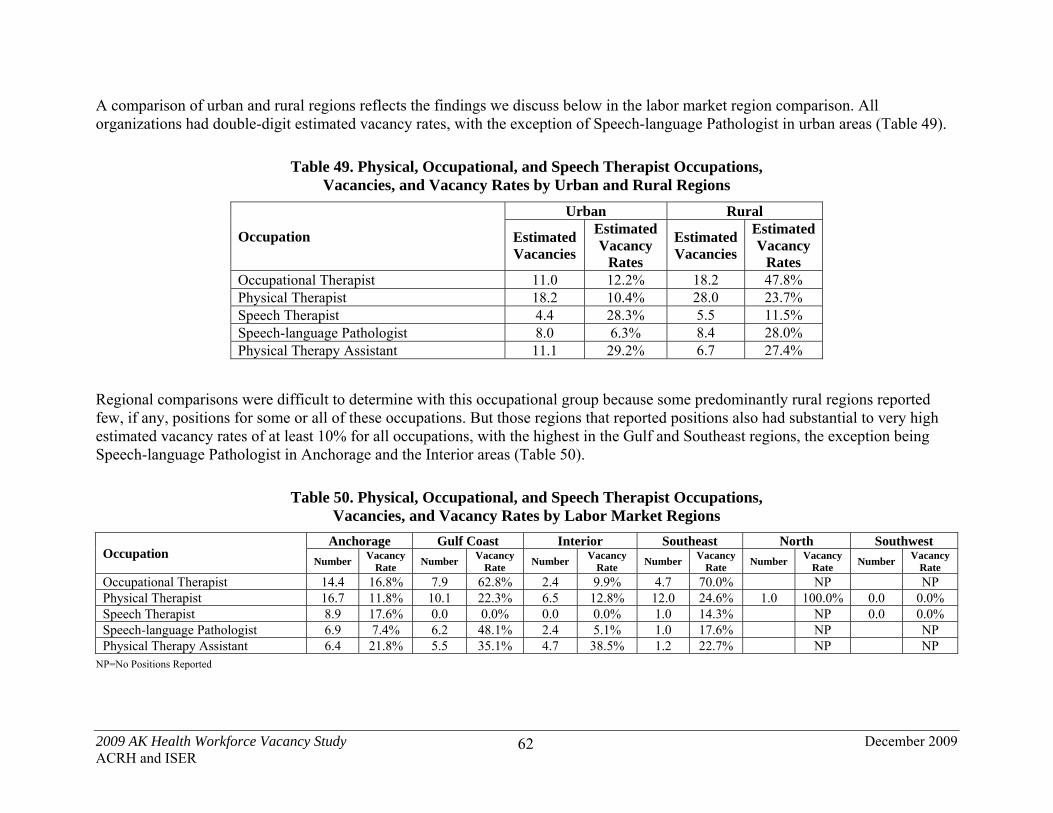
2009 AK Health Workforce Vacancy Study December 2009 ACRH and ISER
62
A comparison of urban and rural regions reflects the findings we discuss below in the labor market region comparison. All organizations had double-digit estimated vacancy rates, with the exception of Speech-language Pathologist in urban areas (Table 49).
Table 49. Physical, Occupational, and Speech Therapist Occupations, Vacancies, and Vacancy Rates by Urban and Rural Regions
Occupation
Urban Rural
Estimated Vacancies
Estimated Vacancy
Rates
Estimated Vacancies
Estimated Vacancy
Rates Occupational Therapist 11.0 12.2% 18.2 47.8% Physical Therapist 18.2 10.4% 28.0 23.7% Speech Therapist 4.4 28.3% 5.5 11.5% Speech-language Pathologist 8.0 6.3% 8.4 28.0% Physical Therapy Assistant 11.1 29.2% 6.7 27.4%
Regional comparisons were difficult to determine with this occupational group because some predominantly rural regions reported few, if any, positions for some or all of these occupations. But those regions that reported positions also had substantial to very high estimated vacancy rates of at least 10% for all occupations, with the highest in the Gulf and Southeast regions, the exception being Speech-language Pathologist in Anchorage and the Interior areas (Table 50).
Table 50. Physical, Occupational, and Speech Therapist Occupations, Vacancies, and Vacancy Rates by Labor Market Regions
Occupation Anchorage Gulf Coast Interior Southeast North Southwest
Number Vacancy
Rate Number
Vacancy Rate
Number Vacancy
Rate Number
Vacancy Rate
Number Vacancy
Rate Number
Vacancy Rate
Occupational Therapist 14.4 16.8% 7.9 62.8% 2.4 9.9% 4.7 70.0% NP NP Physical Therapist 16.7 11.8% 10.1 22.3% 6.5 12.8% 12.0 24.6% 1.0 100.0% 0.0 0.0% Speech Therapist 8.9 17.6% 0.0 0.0% 0.0 0.0% 1.0 14.3% NP 0.0 0.0% Speech-language Pathologist 6.9 7.4% 6.2 48.1% 2.4 5.1% 1.0 17.6% NP NP Physical Therapy Assistant 6.4 21.8% 5.5 35.1% 4.7 38.5% 1.2 22.7% NP NP
NP=No Positions Reported

2009 AK Health Workforce Vacancy Study December 2009 ACRH and ISER
63
g. Physician Assistant The Physician Assistant (PA) is a unique health occupation that does not fit neatly into traditional health-care occupation categories but which, like Nurse Practitioner, is a critical mid-level primary-care provider. Table 51 shows there were an estimated 315.1 positions statewide based on 180.0 reported in the sample. The estimated vacancy rate was 13.2%. The vacancy rates (both sample and state estimate) were high, as were the number of vacancies.
Table 51. Physician Assistant Positions, Vacancies, and Vacancy Rates by Sample and Statewide Estimates
Occupation Sample Statewide Estimates
Positions Vacancies Vacancy
Rates Positions Vacancies
Vacancy Rates
Physician Assistant 180.0 29.5 16.4% 315.1 41.5 13.2% Table 52 shows that the estimated vacancies were highest in the Tribal Health Organizations (22.0 estimated vacancies, 27.8% estimated vacancy rate) and in Medical Clinics/Offices of Physicians—the primary employer of PAs (8.9% estimated vacancy rate). Hospitals/Nursing Homes and Physical, Occupational, and Speech Therapy facilities employed a few PAs but reported no vacancies.
Table 52. Physician Assistant Vacancies and Vacancy Rates by Type of Organization
Occupation
Hospital/Nursing Homes
Tribal Health Organizations
Medical Clinics/Physician
Offices
Physical, Occupational,
Speech Therapy
Vac
anci
es
Vac
ancy
R
ate
Vac
anci
es
Vac
ancy
R
ate
Vac
anci
es
Vac
ancy
R
ate
Vac
anci
es
Vac
ancy
R
ate
Physician Assistant 0.0 0.0% 22.0 27.8% 19.5 8.9% 0.0 0.0% The estimated vacancies were disproportionately rural, with 26.1 estimated rural vacancies resulting in an estimated 29.9% rural vacancy rate. There were 15.4 estimated urban vacancies, with a 6.8% estimated urban vacancy rate (Table 53).
Table 53. Physician Assistant Vacancies and Vacancy Rates by Urban and Rural Regions
Urban Rural
Occupation Vacancies Vacancy
Rates Vacancies
Vacancy Rates
Physician Assistant 15.4 6.8% 26.1 29.9%

2009 AK Health Workforce Vacancy Study December 2009 ACRH and ISER
64
Regionally, the estimated vacancy rates for Physician Assistants, as displayed in Table 54, varied widely from highest in the Southwest (78.5%) to lowest in the Anchorage/Matanuska-Susitna region (6.3%). Ranging between high and low were North (28.6%), Gulf Coast (25.8%), Southeast (10.9%), and Interior (7.3%).
Table 54. Physician Assistant Vacancies and Vacancy Rates by Labor Market Regions
Labor Market Regions Physician Assistant Vacancies
Physician Assistant
Vacancy Rates Anchorage 9.8 6.3% Gulf Coast 4.9 25.8% Interior 7.2 7.3% Southeast 1.0 10.9% North 4.0 28.6% Southwest 14.6 78.5%
h. Other Nursing Staff The Other Nursing Staff category is comprised of health occupations which are ancillary to nursing services. Certified Nurse Assistant and Licensed Practical Nurse were among the most numerous health-care occupations in terms of both positions and vacancies (see Table 55).
Table 55. Other Nursing Staff Positions, Vacancies, and Vacancy Rates, Sample and Statewide Estimates
Occupation Sample Statewide Estimates
Positions Vacancies Vacancy
Rates Positions Vacancies
Vacancy Rates
Certified Nurse Assistant
1,245.5 102.0 8.2% 1,444.9 120.0 8.3%
Home Health Aide 58.0 11.0. 19.0% 73.2 11.5 15.7% Licensed Practical Nurse
393.0 44.5 11.3% 578.6 68.2 11.8%
Personal Care Attendant
463.5 22.0 4.7% 590.8 32.5 5.5%
The vacancy rate for Licensed Practical Nurse was fairly high, with 11.3% in the sample and 11.8% in the statewide estimate. The vacancy rate for Certified Nurse Assistant was lower (sample, 8.2%; statewide estimate, 8.3%), although vacancies were more numerous (sample, 102.0; statewide estimate, 120.0). Home Health Aide had a high estimated vacancy rate at 15.7% with 11.5 estimated vacancies. There were numerous Personal Care Attendant positions with a low estimated vacancy rate of 5.5%.

2009 AK Health Workforce Vacancy Study December 2009 ACRH and ISER
65
As shown in Table 56, Tribal Health Organizations had the highest estimated vacancy rates for Certified Nurse Assistants (23.7%), Home Health Aides (40.0%), and Licensed Practical Nurses (15.0%). Behavioral Health Services and Medical Clinics/Physician Offices had estimated vacancy rates for Licensed Practical Nurses at 12.9% and 12.7%, respectively. Medical Clinics also had a high vacancy rate for Certified Nurse Assistants at 10.5%. Personal Care Attendants are often hired by individuals to provide home-based care and may have been under-represented in our sampled organizations.
Table 56. Other Nursing Staff Occupations, Estimated Vacancies, and Vacancy Rates by Organization Type
Occupation
Behavioral Health Services
Hospital/Nursing Homes
Tribal Health Organizations
Medical Clinics/ Physician Offices
Estimated Vacancies
Estimated Vacancy
Rate
Estimated Vacancies
Estimated Vacancy
Rate
Estimated Vacancies
Estimated Vacancy
Rate
Estimated Vacancies
Estimated Vacancy
Rate
Certified Nurse Assistant
6.0 4.3% 51.0 5.7% 37.0 23.7% 26.0 10.5%
Home Health Aide 1.5 4.2% 0.0 0.0% 10.0 40.0% 0.0 0.0% Licensed Practical Nurse
6.0 12.9% 15.0 8.5% 12.0 15.0% 35.2 12.7%
Personal Care Attendant
31.5 8.3% 0.0 0.0% 1.0 6.7% NP
NP=No Positions Reported
As Table 57 shows, estimated LPN vacancies appeared more acute among the rural respondents than among those in urban regions (16.1%, rural; 10.5%, urban). On the other hand, rural areas had a 0.0% estimated vacancy rate for Home Health Aides, while urban Alaska saw a rate of 27.6%.
Table 57. Other Nursing Staff Occupations, Estimated Vacancies, and Vacancy Rates by Urban and Rural Regions
Urban Rural
Occupation Estimated Vacancies
Estimated Vacancy
Rates
Estimated Vacancies
Estimated Vacancy
Rates Certified Nurse Assistant 79.6 7.8% 40.4 9.7% Home Health Aide 11.5 27.6% 0.0 0.0% Licensed Practical Nurse 46.4 10.5% 21.7 16.1% Personal Care Attendant 14.5 4.3% 18.0 7.2%

2009 AK Health Workforce Vacancy Study December 2009 ACRH and ISER
66
As Table 58 shows, the highest estimated vacancy rates for Licensed Practical Nurses were reported by the North (33.3%) and Gulf Coast (34.5%) regions—all rural, consistent with the high rural LPN rate noted above. Vacancy rates for Certified Nurse Assistants were variable: Southeast, 3.1%; Anchorage, 7.1%; Southwest, 9.8%; Gulf Coast, 13.3%; Interior, 14.8%; and North, 23.1%.
Table 58. Other Nursing Staff Occupations, Estimated Vacancies, and Vacancy Rates by Labor Market Region
Occupation
Anchorage Gulf Coast Interior
Estimated Vacancies
Estimated Vacancy
Rate
Estimated Vacancies
Estimated Vacancy
Rate
Estimated Vacancies
Estimated Vacancy
Rate Certified Nurse Assistant
40.0 7.1% 31.3 13.3% 30.6 14.8%
Home Health Aide 1.5 5.4% 0.0 0.0% 10.0 53.8% Licensed Practical Nurse
26.9 8.4% 11.8 34.5% 17.5 16.6%
Personal Care Attendant
17.5 5.0% 0.0 0.0% NP
Occupation
Southeast North Southwest
Estimated Vacancies
Estimated Vacancy
Rate
Estimated Vacancies
Estimated Vacancy
Rate
Estimated Vacancies
Estimated Vacancy
Rate Certified Nurse Assistant
12.5 3.1% 3.0 23.1% 2.6 9.8%
Home Health Aide 0.0 0.0% NP 0.0 0.0% Licensed Practical Nurse
2.0 2.6% 3.0 33.3% 6.9 20.3%
Personal Care Attendant
15.0 8.3% 0.0 0.0% 0.0 0.0%
NP=No Positions Reported
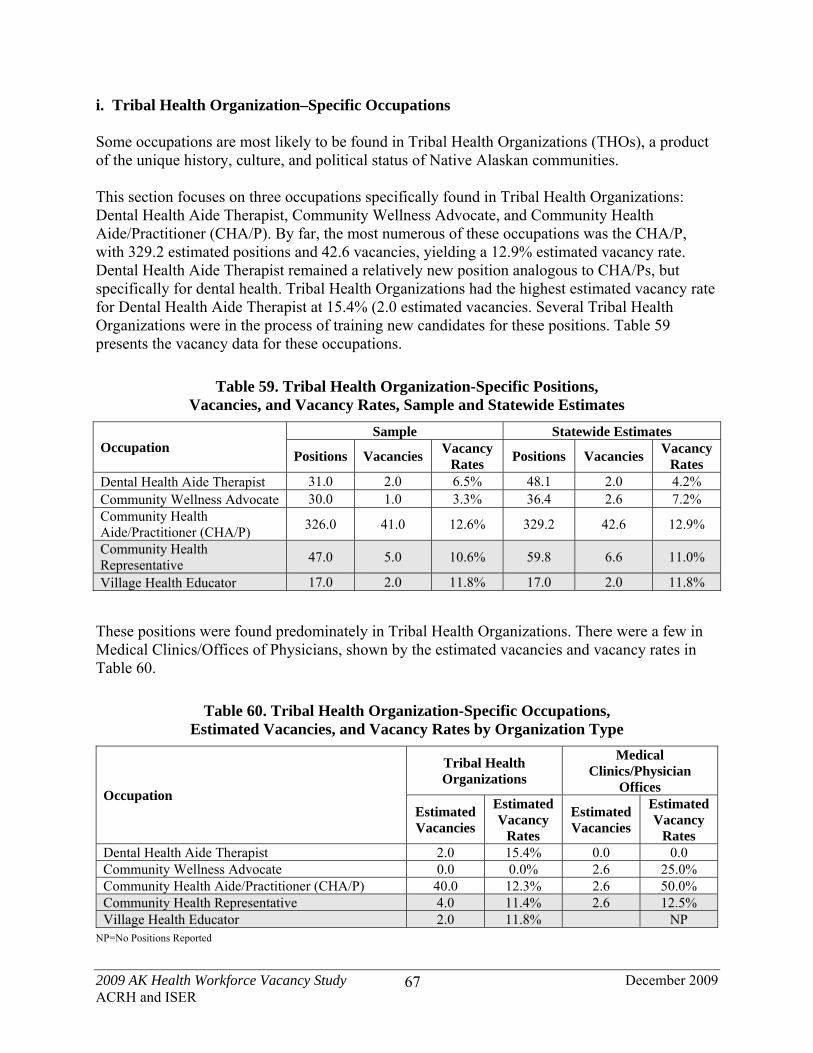
2009 AK Health Workforce Vacancy Study December 2009 ACRH and ISER
67
i. Tribal Health Organization–Specific Occupations Some occupations are most likely to be found in Tribal Health Organizations (THOs), a product of the unique history, culture, and political status of Native Alaskan communities. This section focuses on three occupations specifically found in Tribal Health Organizations: Dental Health Aide Therapist, Community Wellness Advocate, and Community Health Aide/Practitioner (CHA/P). By far, the most numerous of these occupations was the CHA/P, with 329.2 estimated positions and 42.6 vacancies, yielding a 12.9% estimated vacancy rate. Dental Health Aide Therapist remained a relatively new position analogous to CHA/Ps, but specifically for dental health. Tribal Health Organizations had the highest estimated vacancy rate for Dental Health Aide Therapist at 15.4% (2.0 estimated vacancies. Several Tribal Health Organizations were in the process of training new candidates for these positions. Table 59 presents the vacancy data for these occupations.
Table 59. Tribal Health Organization-Specific Positions, Vacancies, and Vacancy Rates, Sample and Statewide Estimates
Occupation Sample Statewide Estimates
Positions Vacancies Vacancy
Rates Positions Vacancies
Vacancy Rates
Dental Health Aide Therapist 31.0 2.0 6.5% 48.1 2.0 4.2% Community Wellness Advocate 30.0 1.0 3.3% 36.4 2.6 7.2% Community Health Aide/Practitioner (CHA/P)
326.0 41.0 12.6% 329.2 42.6 12.9%
Community Health Representative
47.0 5.0 10.6% 59.8 6.6 11.0%
Village Health Educator 17.0 2.0 11.8% 17.0 2.0 11.8%
These positions were found predominately in Tribal Health Organizations. There were a few in Medical Clinics/Offices of Physicians, shown by the estimated vacancies and vacancy rates in Table 60.
Table 60. Tribal Health Organization-Specific Occupations, Estimated Vacancies, and Vacancy Rates by Organization Type
Occupation
Tribal Health Organizations
Medical Clinics/Physician
Offices
Estimated Vacancies
Estimated Vacancy
Rates
Estimated Vacancies
Estimated Vacancy
Rates Dental Health Aide Therapist 2.0 15.4% 0.0 0.0 Community Wellness Advocate 0.0 0.0% 2.6 25.0% Community Health Aide/Practitioner (CHA/P) 40.0 12.3% 2.6 50.0% Community Health Representative 4.0 11.4% 2.6 12.5% Village Health Educator 2.0 11.8% NP
NP=No Positions Reported
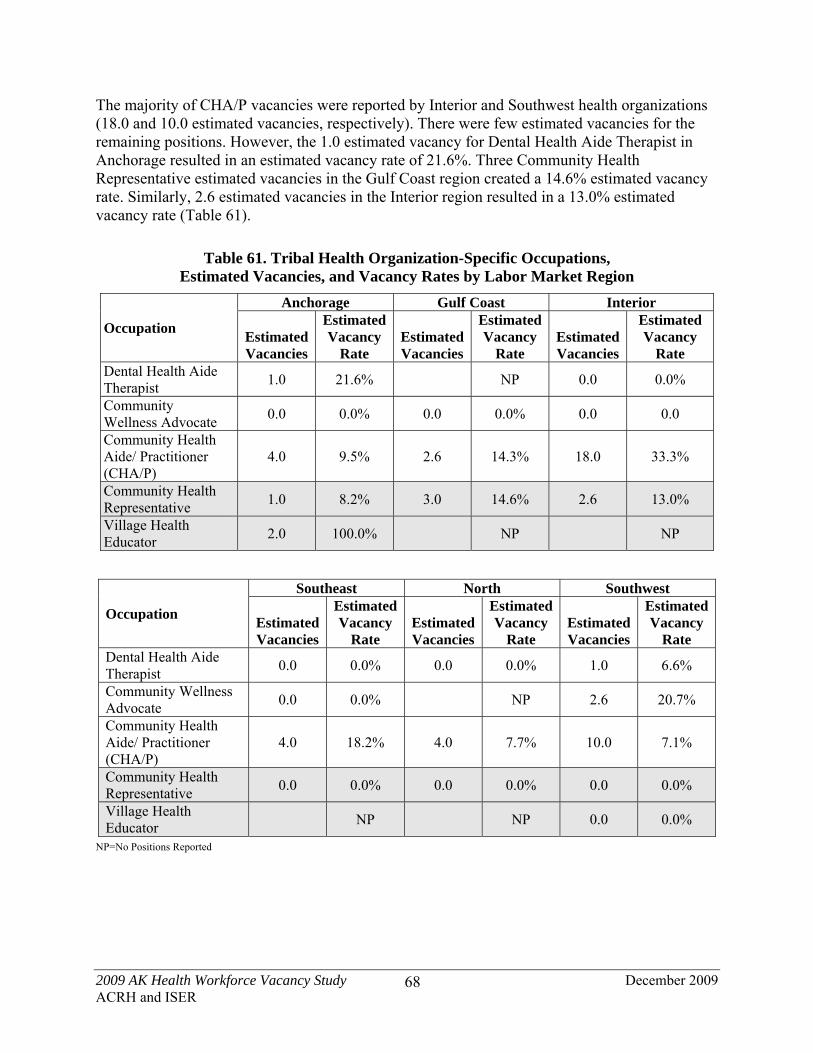
2009 AK Health Workforce Vacancy Study December 2009 ACRH and ISER
68
The majority of CHA/P vacancies were reported by Interior and Southwest health organizations (18.0 and 10.0 estimated vacancies, respectively). There were few estimated vacancies for the remaining positions. However, the 1.0 estimated vacancy for Dental Health Aide Therapist in Anchorage resulted in an estimated vacancy rate of 21.6%. Three Community Health Representative estimated vacancies in the Gulf Coast region created a 14.6% estimated vacancy rate. Similarly, 2.6 estimated vacancies in the Interior region resulted in a 13.0% estimated vacancy rate (Table 61).
Table 61. Tribal Health Organization-Specific Occupations, Estimated Vacancies, and Vacancy Rates by Labor Market Region
Occupation
Anchorage Gulf Coast Interior
Estimated Vacancies
Estimated Vacancy
Rate Estimated Vacancies
Estimated Vacancy
Rate Estimated Vacancies
Estimated Vacancy
Rate Dental Health Aide Therapist
1.0 21.6% NP 0.0 0.0%
Community Wellness Advocate
0.0 0.0% 0.0 0.0% 0.0 0.0
Community Health Aide/ Practitioner (CHA/P)
4.0 9.5% 2.6 14.3% 18.0 33.3%
Community Health Representative
1.0 8.2% 3.0 14.6% 2.6 13.0%
Village Health Educator
2.0 100.0% NP NP
Occupation
Southeast North Southwest
Estimated Vacancies
Estimated Vacancy
Rate Estimated Vacancies
Estimated Vacancy
Rate Estimated Vacancies
Estimated Vacancy
Rate Dental Health Aide Therapist
0.0 0.0% 0.0 0.0% 1.0 6.6%
Community Wellness Advocate
0.0 0.0% NP 2.6 20.7%
Community Health Aide/ Practitioner (CHA/P)
4.0 18.2% 4.0 7.7% 10.0 7.1%
Community Health Representative
0.0 0.0% 0.0 0.0% 0.0 0.0%
Village Health Educator
NP NP 0.0 0.0%
NP=No Positions Reported

2009 AK Health Workforce Vacancy Study December 2009 ACRH and ISER
69
Estimated vacancies were highest in the urban areas for Community Health Aide Practitioner (CHA/P), with 26.0 estimated vacancies and an estimated vacancy rate of 25.5% (Table 62).
Table 62. Tribal Health Organization-Specific Occupations, Estimated Vacancies, and Vacancy Rates by Urban and Rural Regions
Urban Rural
Occupation Estimated Vacancies
Estimated Vacancy
Rates
Estimated Vacancies
Estimated Vacancy
Rates Dental Health Aide Therapist 1.0 12.5% 1.0 2.5% Community Wellness Advocate 0.0 0.0% 2.6 14.6% Community Health Aide/Practitioner (CHA/P) 26.0 25.5% 16.6 7.3% Community Health Representative 3.6 11.5% 3.0 10.5% Village Health Educator 2.0 100.0% 0.0 0.0%

2009 AK Health Workforce Vacancy Study December 2009 ACRH and ISER
70
As noted in Table 63, highest estimated vacancy rates were concentrated in the Anchorage region for Dental Health Aide Therapist at 22.6%; in the Interior and Southeast regions for the Community Health Aide/Practitioner at 33.3% and 18.2%, respectively. The highest estimate vacancy rate for the Community Wellness Advocate was in the Southwest region at 20.7%.
Table 63. Tribal Health Organization-Specific Positions, Vacancies, and Vacancy Rates by Geographic Region
Anchorage Gulf Coast Interior Sample Estimate Sample Estimate Sample Estimate
Pos
itio
ns
Vac
anci
es
Vac
ancy
R
ates
Pos
itio
ns
Vac
anci
es
Vac
ancy
R
ates
Pos
itio
ns
Vac
anci
es
Vac
ancy
R
ates
Pos
itio
ns
Vac
anci
es
Vac
ancy
R
ates
Pos
itio
ns
Vac
anci
es
Vac
ancy
R
ates
Pos
itio
ns
Vac
anci
es
Vac
ancy
R
ates
Dental Health Aide Therapist 3.0 1.0 33.3% 4.6 1.0 22.6% NP NP 2.0 0.0 0.0% 5.2 0.0 0.0%
Community Wellness Advocate 11.0 0.0 0.0% 15 0 0.0% 2.0 0.0 0.0% 5.2 0.0 0.0% 2.0 0.0 0.0% 2.0 0.0 0.0%
Community Health Aide/Practitioner (CHA/P)
42.0 4.0 9.5% 42.0 4.0 9.5% 15.0 1.0 6.7% 18.2 2.6 14.3% 54.0 18.0 33.3% 54.0 18.0 33.3%
Community Health Representative
9.0 1.0 11.1% 12.2 1.0 8.2% 19.0 3.0 15.8% 20.6 3.0 14.6% 12.0 1.0 8.3% 20.0 2.6 13.0%
Village Health Educator 2.0 2.0 100.0% 2.0 2.0 100.0% NP NP NP NP
Southeast North Southwest Sample Estimate Sample Estimate Sample Estimate
Pos
itio
ns
Vac
anci
es
Vac
ancy
R
ates
Pos
itio
ns
Vac
anci
es
Vac
ancy
R
ates
Pos
itio
ns
Vac
anci
es
Vac
ancy
R
ates
Pos
itio
ns
Vac
anci
es
Vac
ancy
R
ates
Pos
itio
ns
Vac
anci
es
Vac
ancy
R
ates
Pos
itio
ns
Vac
anci
es
Vac
ancy
R
ates
Dental Health Aide Therapist 12.0 0.0 0.0% 20.2 0.0 0.0% 3.0 0.0 0.0% 3.0 0.0 0.0% 11.0 1.0 9.1% 15.1 1.0 6.6%
Community Wellness Advocate 4.0 0.0 0.0% 4.0 0.0 0.0% NP NP 11.0 1.0 9.1% 12.6 2.6 20.7%
Community Health Aide/Practitioner (CHA/P)
22.0 4.0 18.2% 22.0 4.0 18.2% 52.0 4.0 7.7% 52.0 4.0 7.7% 141.0 10.0 7.1% 141.0 10.0 7.1%
Community Health Representative
1.0 0.0 0.0% 1.0 0.0 0.0% 2.0 0.0 0.0% 2.0 0.0 0.0% 4.0 0.0 0.0% 4.0 0.0 0.0%
Village Health Educator NP NP NP NP 15.0 0.0 0.0% 15.0 0.0 0.0%
NP=No Positions Reported

2009 AK Health Workforce Vacancy Study December 2009 ACRH and ISER
71
j. Allied Health Allied Health occupations were too numerous to address in detail in the context of this report. Tables for Allied Health occupations not detailed in this report are located at the end of this section of the report. Those occupations include Mammographer, MRI/CT Technician, Nuclear Medicine Technician, Sterile Processing Technician, Surgical Technician, Echocardiograph Technician, EEG Technician, EKG Technician, and Massage Therapist. We will focus on eight key Allied Health occupations not already listed: Clinical Lab Assistant, Medical Lab Technician, Phlebotomist, Radiology Technician, Sonographer, Medical Assistant, Medical Technician, and Respiratory Therapist. Other Allied Health occupations—Dental Assistant, Dental Hygienist, Dental Health Aide/Therapist, Pharmacy Technician, Physical Therapy Assistant, Paramedic, and EMT/ETT—are discussed in other parts of this report.
Except for Sonographer, vacancy rates were generally low to moderate for these occupations, between 2.3% and 5.9% in the sample and between 3.5% and 6.6% for the statewide estimates. With the exception of Medical Assistant (with 30.3 estimated statewide vacancies) and Medical Technician (with 14.8 estimated vacancies statewide), the statewide vacancies were relatively low in number. The sample Sonographer vacancy rate was substantial (13.6%), with 8.0 reported vacancies and 9.6 estimated vacancies, resulting in a 13.7% estimated vacancy rate (Table 64).
Table 64. Allied Health-Specific Positions, Vacancies, and Vacancy Rates, Sample and Statewide Estimates
Occupation Sample Statewide Estimates
Positions VacanciesVacancy
Rates Positions Vacancies
Vacancy Rates
Clinical Lab Assistant 87.0 2.0 2.3% 114.3 5.2 4.6% Medical Lab Technician 97.0 3.5 3.6% 141.1 5.9 4.2% Phlebotomist 155.8 8.0 5.1% 187.1 9.6 5.1% Radiology Technician 178.5 6.0 3.4% 219.4 7.6 3.5% Sonographer 59.0 8.0 13.6% 70.2 9.6 13.7% Medical Assistant 357.0 13.5 3.8% 706.7 30.3 4.3% Medical Technician 197.5 10.0 5.1% 224.8 14.8 6.6% Respiratory Therapist 68.0 4.0 5.9% 68.0 4.0 5.9%

2009 AK Health Workforce Vacancy Study December 2009 ACRH and ISER
72
Table 65 shows that, among the lab occupations, Diagnostic Laboratories and Medical Clinics/Offices of Physicians had the highest estimated vacancy rates: Clinical Lab Assistant (11.8%) and Medical Lab Technician (18.2%). Radiology Technicians had relatively low estimated vacancy rates. In contrast, Sonographers had higher vacancy rates in Hospitals and Medical Clinics (21.4% and 14.3%, respectively). Medical Technician had an estimated vacancy rate of 17.6% in Medical Clinics. Respiratory Therapist had an estimated rate of 9.4% in Tribal Health Organizations.
Table 65. Allied Health-Specific Occupations, Estimated Vacancies, and Vacancy Rates by Organization Type
Occupation
Diagnostic Imaging
Hospital/Nursing Homes
Diagnostic Laboratories
Tribal Health Organizations
Medical Clinics/ Offices of Physicians
Est
imat
ed
Vac
anci
es
Est
imat
ed
Vac
ancy
R
ates
Est
imat
ed
Vac
anci
es
Est
imat
ed
Vac
ancy
R
ates
Est
imat
ed
Vac
anci
es
Est
imat
ed
Vac
ancy
R
ates
Est
imat
ed
Vac
anci
es
Est
imat
ed
Vac
ancy
R
ates
Est
imat
ed
Vac
anci
es
Est
imat
ed
Vac
ancy
R
ates
Clinical Lab Assistant NP 0.0 0.0% 0.0 0.0% 0.0 0.0% 5.2 11.8% Medical Lab Technician NP 0.0 0.0% 1.0 18.2% 1.0 8.3% 3.9 5.5% Phlebotomist NP 3.0 3.8% 3.0 6.2% 1.0 12.5% 2.6 5.2% Radiology Technician 1.0 2.1% 2.0 2.4% NP 2.0 10.0% 2.6 3.9% Sonographer 0.0 0.0% 6.0 21.4% NP 1.0 11.1% 2.6 14.3% Medical Assistant 0.0 0.0% 2.0 5.9% NP 1.0 1.0% 27.3 4.8% Medical Technician 0.0 0.0% 3.0 2.8% 0.0 0.0% 4.0 6.3% 7.8 17.6% Respiratory Therapist NP 1.0 2.8% NP 3.0 9.4% NP
NP=No Positions Reported
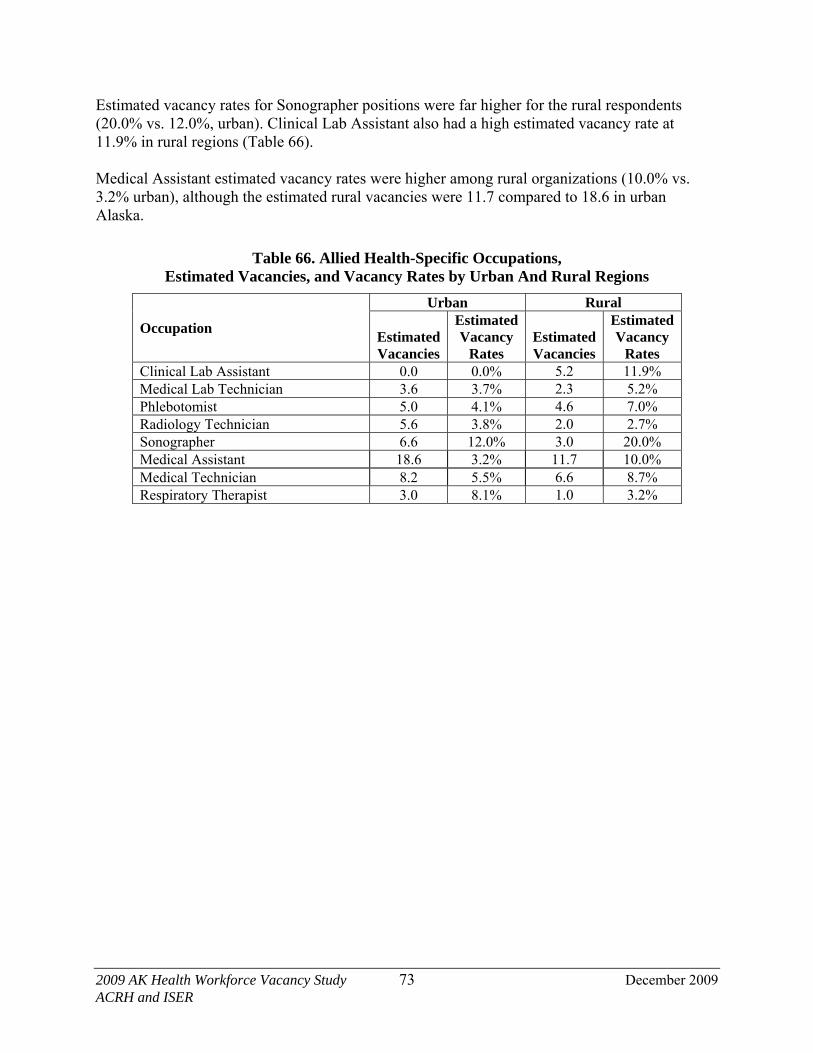
2009 AK Health Workforce Vacancy Study 73 December 2009 ACRH and ISER
Estimated vacancy rates for Sonographer positions were far higher for the rural respondents (20.0% vs. 12.0%, urban). Clinical Lab Assistant also had a high estimated vacancy rate at 11.9% in rural regions (Table 66). Medical Assistant estimated vacancy rates were higher among rural organizations (10.0% vs. 3.2% urban), although the estimated rural vacancies were 11.7 compared to 18.6 in urban Alaska.
Table 66. Allied Health-Specific Occupations, Estimated Vacancies, and Vacancy Rates by Urban And Rural Regions
Occupation
Urban Rural
Estimated Vacancies
Estimated Vacancy
Rates Estimated Vacancies
Estimated Vacancy
Rates Clinical Lab Assistant 0.0 0.0% 5.2 11.9% Medical Lab Technician 3.6 3.7% 2.3 5.2% Phlebotomist 5.0 4.1% 4.6 7.0% Radiology Technician 5.6 3.8% 2.0 2.7% Sonographer 6.6 12.0% 3.0 20.0% Medical Assistant 18.6 3.2% 11.7 10.0% Medical Technician 8.2 5.5% 6.6 8.7% Respiratory Therapist 3.0 8.1% 1.0 3.2%
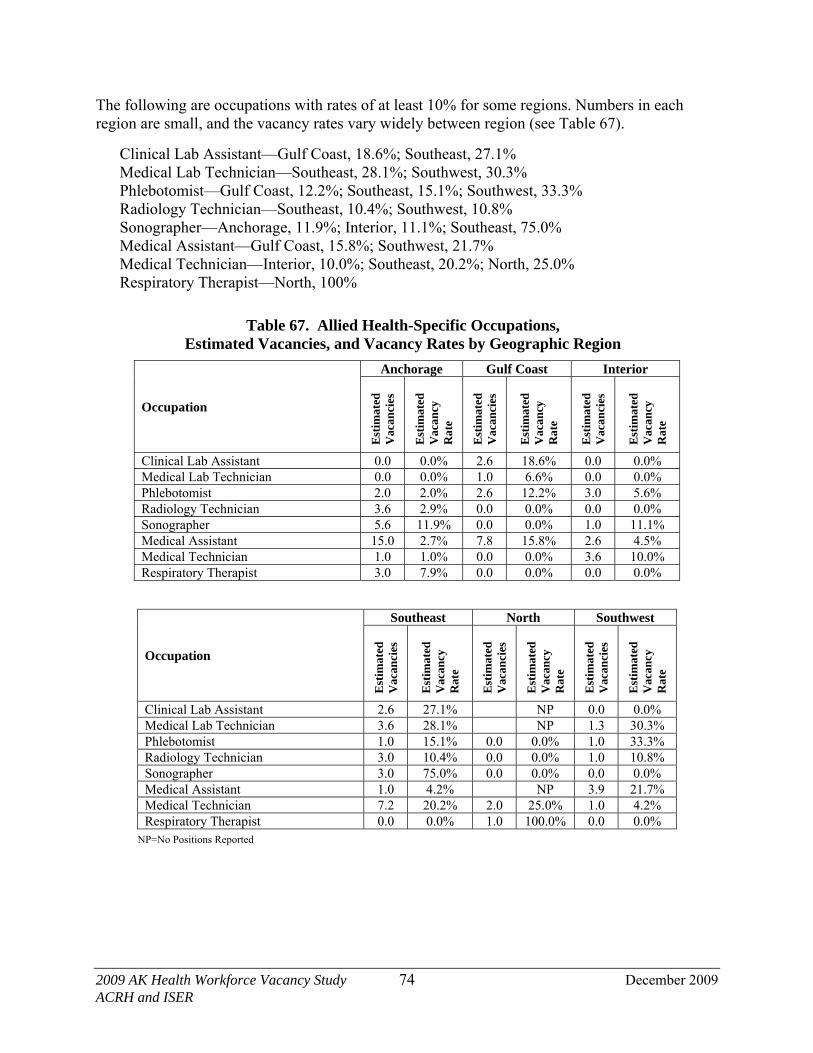
2009 AK Health Workforce Vacancy Study 74 December 2009 ACRH and ISER
The following are occupations with rates of at least 10% for some regions. Numbers in each region are small, and the vacancy rates vary widely between region (see Table 67).
Clinical Lab Assistant—Gulf Coast, 18.6%; Southeast, 27.1% Medical Lab Technician—Southeast, 28.1%; Southwest, 30.3% Phlebotomist—Gulf Coast, 12.2%; Southeast, 15.1%; Southwest, 33.3% Radiology Technician—Southeast, 10.4%; Southwest, 10.8% Sonographer—Anchorage, 11.9%; Interior, 11.1%; Southeast, 75.0% Medical Assistant—Gulf Coast, 15.8%; Southwest, 21.7% Medical Technician—Interior, 10.0%; Southeast, 20.2%; North, 25.0% Respiratory Therapist—North, 100%
Table 67. Allied Health-Specific Occupations, Estimated Vacancies, and Vacancy Rates by Geographic Region
Occupation
Anchorage Gulf Coast Interior E
stim
ated
V
acan
cies
Est
imat
ed
Vac
ancy
R
ate
Est
imat
ed
Vac
anci
es
Est
imat
ed
Vac
ancy
R
ate
Est
imat
ed
Vac
anci
es
Est
imat
ed
Vac
ancy
R
ate
Clinical Lab Assistant 0.0 0.0% 2.6 18.6% 0.0 0.0% Medical Lab Technician 0.0 0.0% 1.0 6.6% 0.0 0.0% Phlebotomist 2.0 2.0% 2.6 12.2% 3.0 5.6% Radiology Technician 3.6 2.9% 0.0 0.0% 0.0 0.0% Sonographer 5.6 11.9% 0.0 0.0% 1.0 11.1% Medical Assistant 15.0 2.7% 7.8 15.8% 2.6 4.5% Medical Technician 1.0 1.0% 0.0 0.0% 3.6 10.0% Respiratory Therapist 3.0 7.9% 0.0 0.0% 0.0 0.0%
Occupation
Southeast North Southwest
Est
imat
ed
Vac
anci
es
Est
imat
ed
Vac
ancy
R
ate
Est
imat
ed
Vac
anci
es
Est
imat
ed
Vac
ancy
R
ate
Est
imat
ed
Vac
anci
es
Est
imat
ed
Vac
ancy
R
ate
Clinical Lab Assistant 2.6 27.1% NP 0.0 0.0% Medical Lab Technician 3.6 28.1% NP 1.3 30.3% Phlebotomist 1.0 15.1% 0.0 0.0% 1.0 33.3% Radiology Technician 3.0 10.4% 0.0 0.0% 1.0 10.8% Sonographer 3.0 75.0% 0.0 0.0% 0.0 0.0% Medical Assistant 1.0 4.2% NP 3.9 21.7% Medical Technician 7.2 20.2% 2.0 25.0% 1.0 4.2% Respiratory Therapist 0.0 0.0% 1.0 100.0% 0.0 0.0%
NP=No Positions Reported

2009 AK Health Workforce Vacancy Study 75 December 2009 ACRH and ISER
Table 68. Additional Allied Health-Specific Occupations, Vacancies, and Vacancy Rates, Sample and Statewide Estimates
Occupation Sample Statewide Estimates
Positions Vacancies Vacancy
Rates Positions Vacancies
Vacancy Rates
Mammographer 43.0 2.0 4.7% 51.0 2.0 3.9% MRI/CT Technician 56.0 2.0 3.6% 56.0 2.0 3.6% Nuclear Medicine Technician
10.0 1.0 10.0% 10.0 1.0 10.0%
Sterile Processing Technician
83.0 6.0 7.2% 97.4 6.0 6.2%
Surgical Technician 64.0 6.0 9.4% 64.0 6.0 9.4% Echocardiography Technician
14.0 1.0 7.1% 14.0 1.0 7.1%
EEG Technician 10.0 0.0 0.0% 10.0 0.0 0.0% EKG Technician 33.0 0.0 0.0% 50.6 0.0 0.0% Massage Therapist 60.0 3.0 5.0% 75.2 3.4 4.5%
Table 69. Additional Allied Health-Specific Occupations, Estimated Vacancies, and Vacancy Rates by Organization Type
Occupation
Diagnostic Imaging
Hospital/Nursing Homes
Diagnostic Laboratories
Tribal Health Organizations
Medical Clinics/Physician
Offices
Est
imat
ed
Vac
anci
es
Est
imat
ed
Vac
ancy
R
ates
Est
imat
ed
Vac
anci
es
Est
imat
ed
Vac
ancy
R
ates
Est
imat
ed
Vac
anci
es
Est
imat
ed
Vac
ancy
R
ates
Est
imat
ed
Vac
anci
es
Est
imat
ed
Vac
ancy
R
ates
Est
imat
ed
Vac
anci
es
Est
imat
ed
Vac
ancy
R
ates
Mammographer 0.0 0.0% 1.0 4.2% NP 1.0 14.3% 0.0 0.0% MRI/CT Technician 0.0 0.0% 1.0 3.8% NP 1.0 6.7% NP Nuclear Med Technician 1.0 20.0% 0.0 0.0% NP NP NP Sterile Processing Technician NP 5.0 8.9% NP 1.0 5.6% 0.0 0.0% Surgical Technician NP 6.0 13.0% NP 0.0 0.0% NP Echocardiography Technician 0.0 0.0% 1.0 14.3% NP 0.0 0.0% NP EEG Technician NP 0.0 0.0% NP 0.0 0.0% NP EKG Technician NP 0.0 0.0% NP 0.0 0.0% 0.0 0.0%
NP=No Positions Reported
Occupation
Tribal Health Medical
Clinics/Physician Offices
Physical, Occupation, and Speech Therapist
Est
imat
ed
Vac
anci
es
Est
imat
ed
Vac
ancy
R
ates
Est
imat
ed
Vac
anci
es
Est
imat
ed
Vac
ancy
R
ates
Est
imat
ed
Vac
anci
es
Est
imat
ed
Vac
ancy
R
ates
Massage Therapist 1.0 33.3% 0.0 0.0% 2.4 4.0%

2009 AK Health Workforce Vacancy Study 76 December 2009 ACRH and ISER
Table 70. Additional Allied Health-Specific Occupations, Estimated Vacancies, and Vacancy Rates by Urban and Rural Regions
Occupation
Urban Rural
Estimated Vacancies
Estimated Vacancy
Rates
Estimated Vacancies
Estimated Vacancy
Rates Mammographer 1.0 2.9% 1.0 5.9% MRI/CT Technician 1.0 2.9% 1.0 4.8% Nuclear Med Technician 1.0 14.3% 0.0 0.0% Sterile Processing Technician 3.0 4.0% 3.0 13.5% Surgical Technician 1.0 2.1% 5.0 29.4% Echocardiography Technician 1.0 9.1% 0.0 0.0% EEG Technician 0.0 0.0% 0.0 0.0% EKG Technician 0.0 0.0% 0.0 0.0% Massage Therapist 1.0 1.8% 2.4 12.3%
NP=No Positions Reported
Table 71. Additional Allied Health-Specific Occupations, Estimated Vacancies, and Vacancy Rates by Geographic Region
Occupation
Anchorage Gulf Coast Interior Southeast North Southwest
Est
imat
ed
Vac
anci
es
Est
imat
ed
Vac
ancy
R
ate
Est
imat
ed
Vac
anci
es
Est
imat
ed
Vac
ancy
R
ate
Est
imat
ed
Vac
anci
es
Est
imat
ed
Vac
ancy
R
ate
Est
imat
ed
Vac
anci
es
Est
imat
ed
Vac
ancy
R
ate
Est
imat
ed
Vac
anci
es
Est
imat
ed
Vac
ancy
R
ate
Est
imat
ed
Vac
anci
es
Est
imat
ed
Vac
ancy
R
ate
Mammographer 1.0 4.1% 0.0 0.0% 0.0 0.0% 0.0 0.0% 0.0 0.0% 1.0 33.3% MRI/CT Technician 0.0 0.0% 0.0 0.0% 1.0 6.7% 0.0 0.0% NP 1.0 33.3% Nuclear Med Technician 0.0 0.0% 0.0 0.0% 0.0 0.0% 1.0 100.0% NP NP Echocardiography Technician 0.0 0.0% 0.0 0.0% 1.0 20.0% NP NP NP EEG Technician 0.0 0.0% NP NP NP NP NP EKG Technician 0.0 0.0% 0.0 0.0% 0.0 0.0% 0.0 0.0% NP NP Sterile Processing Technician 5.0 7.2% 0.0 0.0% 0.0 0.0% 1.0 33.3% 0.0 0.0% 0.0 0.0% Surgical Technician 3.0 6.5% 2.0 33.3% 1.0 12.5% 0.0 0.0% NP NP Massage Therapist 1.0 2.0% 2.4 34.2% 0.0 0.0% 0.0 0.0% NP NP
NP=No Positions Reported

2009 AK Health Workforce Vacancy Study 77 December 2009 ACRH and ISER
k. Community Education and Wellness Occupations Health Educator, Dietitian, and Nutritionist were not numerous but do play an important role in prevention and treatment efforts. Health Educators made up the largest portion of these occupations. They were thinly distributed across the state, primarily in Tribal Health Organizations, Hospitals/Nursing Homes, and Medical Clinics/Offices of Physicians. There were few vacancies in either the sample or the statewide estimate. Dietitians had the highest vacancies and rates: sample (9.0, 24.7%) and statewide estimate (9.0, 24.2%) (Table 72).
Table 72. Community Education and Wellness Positions, Vacancies, and Vacancy Rates, Sample and Statewide Estimates
Occupation Sample Statewide Estimates
Positions Vacancies Vacancy
Rates Positions Vacancies
Vacancy Rates
Health Educator 132.0 3.0 2.3% 136.8 4.6 3.4% Dietitian 36.5 9.0 24.7% 37.2 9.0 24.2% Nutritionist 20.0 1.0 5.0% 27.5 1.5 5.5%

2009 AK Health Workforce Vacancy Study December 2009 ACRH and ISER
78
Diagnostic Imaging facilities and Tribal Health Organizations had the highest estimated vacancy rates for Dietitians (100.0% and 50.0%, respectively). Health Educators had an estimated vacancy rate of 33.3% for Medical Clinics/Offices of Physicians (Table 73).
Table 73. Community Education and Wellness Occupations, Estimated Vacancies, and Vacancy Rates by Organization Type
Occupation
Behavioral Health
Diagnostic Imaging
Hospitals/Nursing Homes
Tribal Health Organizations
Medical Clinics/ Physician
Offices
Physical/ Occupational/,
Speech Therapy
School Districts
Est
imat
ed
Vac
anci
es
Est
imat
ed
Vac
ancy
R
ates
Est
imat
ed
Vac
anci
es
Est
imat
ed
Vac
ancy
R
ates
Est
imat
ed
Vac
anci
es
Est
imat
ed
Vac
ancy
R
ates
Est
imat
ed
Vac
anci
es
Est
imat
ed
Vac
ancy
R
ates
Est
imat
ed
Vac
anci
es
Est
imat
ed
Vac
ancy
R
ates
Est
imat
ed
Vac
anci
es
Est
imat
ed
Vac
ancy
R
ates
Est
imat
ed
Vac
anci
es
Est
imat
ed
Vac
ancy
R
ates
Health Educator NP NP 0.0 0.0% 2.0 4.8% 2.6 33.3% NP 0.0 0.0% Dietitian 0.0 0.0% 2.0 100.0% 0.0 0.0% 7.0 50.0% NP 0.0 0.0% NP Nutritionist 1.5 6.7% NP 0.0 0.0% 0.0 0.0% NP NP NP
NP=No Positions Reported
The estimated highest vacancy rate for Dietitian was in Anchorage at 51.9% (7.0 estimated vacancies). Southwest had a single estimated vacancy for Dietitian, resulting in a 33.3% estimate vacancy rate. Health Educator had an estimated vacancy rate of 72.3% in Southwest, and Nutritionist had an estimated vacancy rate of 60.0% for the same region (Table 74).
Table 74. Community Education and Wellness Occupations, Estimated Vacancies, and Vacancy Rates by Labor Market Region
Occupation
Anchorage Gulf Coast Interior Southeast North Southwest
Est
imat
ed
Vac
anci
es
Est
imat
ed
Vac
ancy
R
ates
Est
imat
ed
Vac
anci
es
Est
imat
ed
Vac
ancy
R
ates
Est
imat
ed
Vac
anci
es
Est
imat
ed
Vac
ancy
R
ates
Est
imat
ed
Vac
anci
es
Est
imat
ed
Vac
ancy
R
ates
Est
imat
ed
Vac
anci
es
Est
imat
ed
Vac
ancy
R
ates
Est
imat
ed
Vac
anci
es
Est
imat
ed
Vac
ancy
R
ates
Health Educator 1.0 1.1% 0.0 0.0% 0.0 0.0% 1.0 3.3% 0.0 0.0% 2.6 72.3% Dietitian 7.0 51.9% 0.0 0.0% 0.0 0.0% 1.0 13.3% 0.0 0.0% 1.0 33.3% Nutritionist 0.0 0.0% NP 0.0 0.0% NP 0.0 0.0% 1.5 60.0%
NP=No Positions Reported

2009 AK Health Workforce Vacancy Study December 2009 ACRH and ISER
79
The high estimated vacancy rates in rural regions for these Education and Wellness occupations were consistent with the high rates in Tribal Health Organizations, which were predominately located in rural Alaska (Table 75).
Table 75. Community Education and Wellness Occupations, Estimated Vacancies, and Vacancy Rates by Urban and Rural Regions
Occupation Urban Rural
Vacancies Vacancy
Rates Vacancies
Vacancy Rates
Health Educator 2.0 1.6% 2.6 23.2% Dietitian 7.0 29.6% 2.0 14.8% Nutritionist 0.0 0.0% 1.5 6.1%
l. Managers and Administrators This section focuses on seven key managerial occupations that are specific to health care: Administrator/Director/CEO/Manager, Behavioral Health Supervisor, Health Information Administrator/Manager, Hospital Administrator, Human Resources Director, Medical Director, and Nursing Director/Executive. Not discussed here are non-health care-specific (“generic”) managerial occupations (i.e., those not employed exclusively by health-care-providing organizations, such as CEO, CFO, Office Manager, or Business Manager). Sample and estimated vacancy numbers were generally low for those seven occupations, while estimated vacancy rates were moderately high for two—Hospital Administrators (11.1%) and Nursing Director/Executive (14.6%) (Table 76). This was in contrast to the reported and estimated vacancy rates for Administrator/Director/CEO/Manager (3.0% sample, 2.7% statewide estimate). The highest number of estimated vacancies (33.5) was for Administrator/Director/ CEO/Manager.
Table 76. Managerial and Administrative Positions, Vacancies, and Vacancy Rates, Sample and Statewide Estimates
Occupation Sample Statewide Estimates
Positions VacanciesVacancy
Rates Positions Vacancies
Vacancy Rates
Administrator/Director/ CEO/Manager
837.0 25.0 3.0% 1,246.4 33.5 2.7%
Behavioral Health Supervisor 154.0 8.0 5.2% 219.1 12.6 5.8% Health Information Administrator/Manager
65.0 4.0 6.2% 95.1 5.6 5.9%
Hospital Administrator 9.0 1.0 11.1% 9.0 1.0 11.1% Human Resources Director 89.5 6.0 6.7% 132.0 9.1 6.9% Medical Director 91.5 6.0 6.6% 130.0 10.2 7.9% Nursing Director/ Executive 54.0 6.0 11.1% 74.1 10.8 14.6%
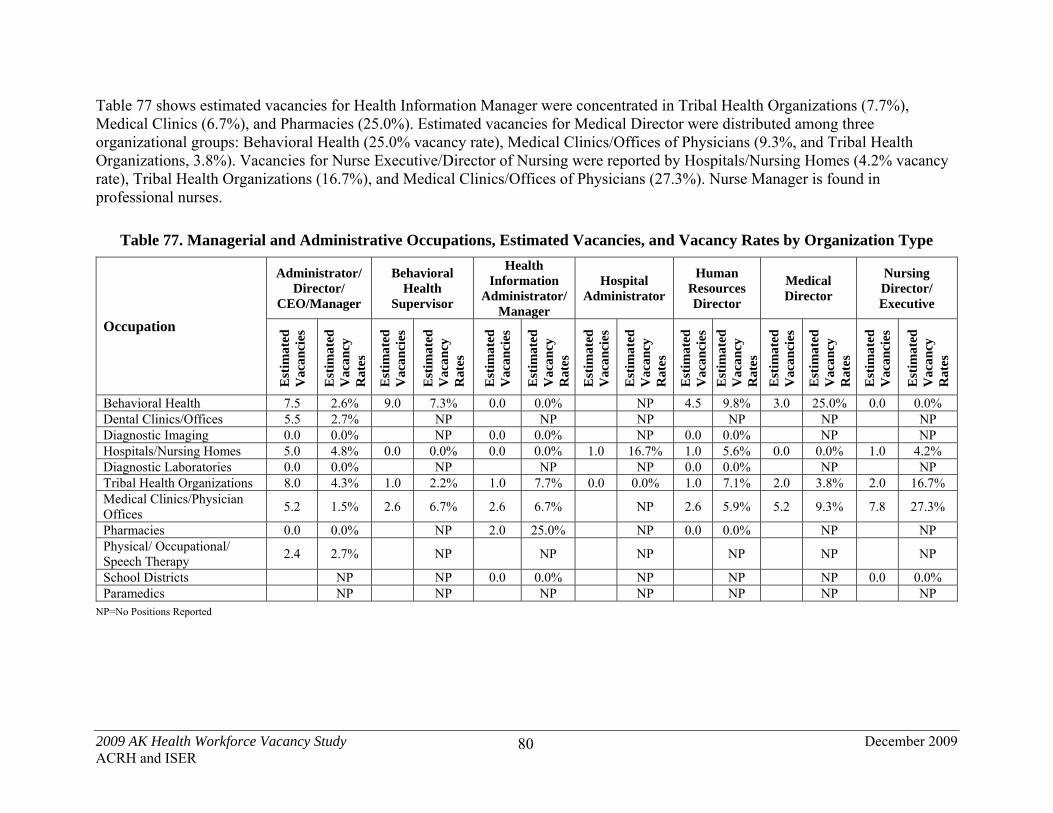
2009 AK Health Workforce Vacancy Study December 2009 ACRH and ISER
80
Table 77 shows estimated vacancies for Health Information Manager were concentrated in Tribal Health Organizations (7.7%), Medical Clinics (6.7%), and Pharmacies (25.0%). Estimated vacancies for Medical Director were distributed among three organizational groups: Behavioral Health (25.0% vacancy rate), Medical Clinics/Offices of Physicians (9.3%, and Tribal Health Organizations, 3.8%). Vacancies for Nurse Executive/Director of Nursing were reported by Hospitals/Nursing Homes (4.2% vacancy rate), Tribal Health Organizations (16.7%), and Medical Clinics/Offices of Physicians (27.3%). Nurse Manager is found in professional nurses.
Table 77. Managerial and Administrative Occupations, Estimated Vacancies, and Vacancy Rates by Organization Type
Occupation
Administrator/Director/
CEO/Manager
Behavioral Health
Supervisor
Health Information
Administrator/Manager
Hospital Administrator
Human Resources Director
Medical Director
Nursing Director/ Executive
Est
imat
ed
Vac
anci
es
Est
imat
ed
Vac
ancy
R
ates
Est
imat
ed
Vac
anci
es
Est
imat
ed
Vac
ancy
R
ates
Est
imat
ed
Vac
anci
es
Est
imat
ed
Vac
ancy
R
ates
Est
imat
ed
Vac
anci
es
Est
imat
ed
Vac
ancy
R
ates
Est
imat
ed
Vac
anci
es
Est
imat
ed
Vac
ancy
R
ates
Est
imat
ed
Vac
anci
es
Est
imat
ed
Vac
ancy
R
ates
Est
imat
ed
Vac
anci
es
Est
imat
ed
Vac
ancy
R
ates
Behavioral Health 7.5 2.6% 9.0 7.3% 0.0 0.0% NP 4.5 9.8% 3.0 25.0% 0.0 0.0% Dental Clinics/Offices 5.5 2.7% NP NP NP NP NP NP Diagnostic Imaging 0.0 0.0% NP 0.0 0.0% NP 0.0 0.0% NP NP Hospitals/Nursing Homes 5.0 4.8% 0.0 0.0% 0.0 0.0% 1.0 16.7% 1.0 5.6% 0.0 0.0% 1.0 4.2% Diagnostic Laboratories 0.0 0.0% NP NP NP 0.0 0.0% NP NP Tribal Health Organizations 8.0 4.3% 1.0 2.2% 1.0 7.7% 0.0 0.0% 1.0 7.1% 2.0 3.8% 2.0 16.7% Medical Clinics/Physician Offices
5.2 1.5% 2.6 6.7% 2.6 6.7% NP 2.6 5.9% 5.2 9.3% 7.8 27.3%
Pharmacies 0.0 0.0% NP 2.0 25.0% NP 0.0 0.0% NP NP Physical/ Occupational/ Speech Therapy
2.4 2.7% NP NP NP NP NP NP
School Districts NP NP 0.0 0.0% NP NP NP 0.0 0.0% Paramedics NP NP NP NP NP NP NP
NP=No Positions Reported

2009 AK Health Workforce Vacancy Study December 2009 ACRH and ISER
81
Hospital Administrator and Human Resources Director had moderate estimated vacancy rates in rural areas (20.0% and 12.2%, respectively); however, the highest vacancy rate was for Nursing Director/Executive at 26.0% (Table 78). Vacancy rates for these managerial and administrative occupations were relatively low in urban Alaska, with the exception of Medical Directors with an estimated vacancy rate of 8.1%.
Table 78. Managerial and Administrative Occupations, Estimated Vacancies, and Vacancy Rates by Urban And Rural Regions
Occupation
Urban Rural
Estimated Vacancies
Estimated Vacancy
Rates
Estimated Vacancies
Estimated Vacancy
Rates Administrator/Director/CEO/Manager 23.9 2.8% 9.6 2.4% Behavioral Health Supervisor 11.1 6.7% 1.5 2.8% Health Information Administrator/Manager 2.6 4.5% 3.0 8.0% Hospital Administrator 0.0 0.0% 1.0 20.0% Human Resources Director 3.5 4.1% 5.6 12.2% Medical Director 6.6 8.1% 3.6 7.5% Nursing Director/Executive 3.6 7.8% 7.2 26.0%
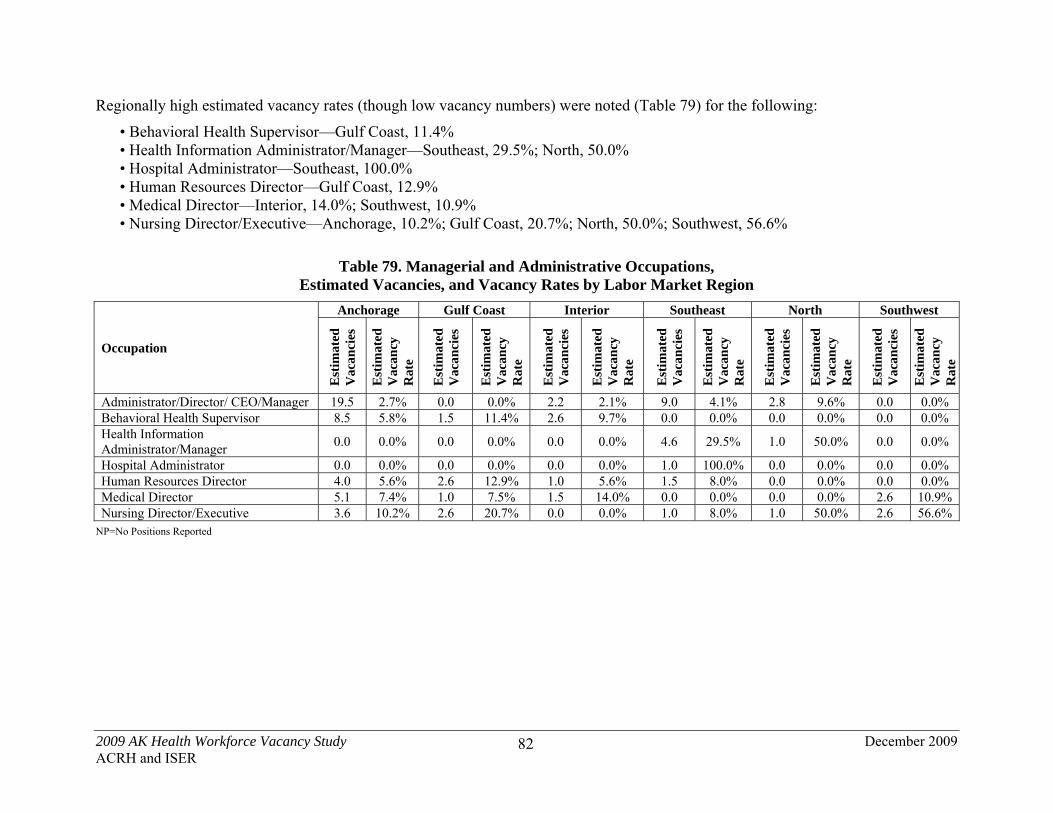
2009 AK Health Workforce Vacancy Study December 2009 ACRH and ISER
82
Regionally high estimated vacancy rates (though low vacancy numbers) were noted (Table 79) for the following:
• Behavioral Health Supervisor—Gulf Coast, 11.4% • Health Information Administrator/Manager—Southeast, 29.5%; North, 50.0% • Hospital Administrator—Southeast, 100.0% • Human Resources Director—Gulf Coast, 12.9% • Medical Director—Interior, 14.0%; Southwest, 10.9% • Nursing Director/Executive—Anchorage, 10.2%; Gulf Coast, 20.7%; North, 50.0%; Southwest, 56.6%
Table 79. Managerial and Administrative Occupations, Estimated Vacancies, and Vacancy Rates by Labor Market Region
Occupation
Anchorage Gulf Coast Interior Southeast North Southwest
Est
imat
ed
Vac
anci
es
Est
imat
ed
Vac
ancy
R
ate
Est
imat
ed
Vac
anci
es
Est
imat
ed
Vac
ancy
R
ate
Est
imat
ed
Vac
anci
es
Est
imat
ed
Vac
ancy
R
ate
Est
imat
ed
Vac
anci
es
Est
imat
ed
Vac
ancy
R
ate
Est
imat
ed
Vac
anci
es
Est
imat
ed
Vac
ancy
R
ate
Est
imat
ed
Vac
anci
es
Est
imat
ed
Vac
ancy
R
ate
Administrator/Director/ CEO/Manager 19.5 2.7% 0.0 0.0% 2.2 2.1% 9.0 4.1% 2.8 9.6% 0.0 0.0% Behavioral Health Supervisor 8.5 5.8% 1.5 11.4% 2.6 9.7% 0.0 0.0% 0.0 0.0% 0.0 0.0% Health Information Administrator/Manager
0.0 0.0% 0.0 0.0% 0.0 0.0% 4.6 29.5% 1.0 50.0% 0.0 0.0%
Hospital Administrator 0.0 0.0% 0.0 0.0% 0.0 0.0% 1.0 100.0% 0.0 0.0% 0.0 0.0% Human Resources Director 4.0 5.6% 2.6 12.9% 1.0 5.6% 1.5 8.0% 0.0 0.0% 0.0 0.0% Medical Director 5.1 7.4% 1.0 7.5% 1.5 14.0% 0.0 0.0% 0.0 0.0% 2.6 10.9% Nursing Director/Executive 3.6 10.2% 2.6 20.7% 0.0 0.0% 1.0 8.0% 1.0 50.0% 2.6 56.6%
NP=No Positions Reported

2009 AK Health Workforce Vacancy Study December 2009 ACRH and ISER
83
m. Information and Reimbursement—Coding, Billing, and Health Information Occupations These occupations include a wide range of “front office” and “back office” ancillary non-medical services necessary for the functioning of health-care organizations. The occupations of focus here specifically involve coding, billing, and health information processing. Some may have overlapping job functions and skills (e.g., Billing Clerk/Technician and Billing Specialist), while others combine dual sets of skills (e.g., Billing/Coding Clerk). Vacancy numbers and rates were generally low for these occupations in both the sample and the statewide estimates (Table 80). The highest vacancy rates were Records Clerk/Technician (6.5% sample) and (5.9% estimated).
Table 80. Information and Reimbursement Positions, Vacancies, and Vacancy Rates, Sample and Statewide Estimates
Occupation Sample Statewide Estimates
Positions VacanciesVacancy
Rates Positions Vacancies
Vacancy Rates
Billing Clerk/Technician 689.5 37.0 5.4% 1,096.1 58.6 5.3% Billing Supervisor 173.0 4.0 2.3% 299.0 6.3 2.1% Compliance/Auditor 54.0 2.0 3.7% 92.1 3.6 3.9% Records Clerk/Technician 438.5 28.5 6.5% 629.1 37.2 5.9% Transcriptionist 99.0 1.0 1.0% 143.7 1.5 1.0% Coding Clerk/Technician 191.0 7.0 3.7% 269.3 7.0 2.6% Certified Coder 117.0 7.0 6.0% 233.0 10.2 4.4% Coding Specialist 62.0 3.0 4.8% 88.6 3.0 3.4%
Looking at the urban/rural distribution of estimated vacancies, vacancy rates tended to be about the same between the two areas, with the exception of Certified Coder which had the highest estimated vacancy rate at 15.8% in rural areas (Table 81).
Table 81. Information and Reimbursement Occupations, Estimated Vacancies, and Vacancy Rates by Urban and Rural Regions
Urban Rural
Occupation Estimated Vacancies
Estimated Vacancy
Rates
Estimated Vacancies
Estimated Vacancy
Rates Billing Clerk/Technician 38.4 5.0% 20.2 6.1% Billing Supervisor 1.2 0.6% 5.1 4.8% Compliance/Auditor 3.6 5.1% 0.0 0.0% Records Clerk/Technician 30.9 6.5% 6.3 4.1% Transcriptionist 1.5 1.4% 0.0 0.0% Coding Clerk/Technician 5.0 2.5% 2.0 2.9% Certified Coder 2.6 1.4% 7.6 15.8% Coding Specialist 2.0 3.1% 1.0 4.1%

2009 AK Health Workforce Vacancy Study December 2009 ACRH and ISER
84
As presented in Table 82, the highest estimated vacancy rates for Certified Coder and Coding Specialist were reported by Tribal Health Organizations (28.6% and 16.7%, respectively). Medical Clinics/Physician Offices and Hospitals/Nursing Homes reported low estimated rates for Certified Coder at 2.8% and 4.2%, respectively. Estimated vacancy rates for Records Clerk/Technician were distributed principally between Behavioral Health Services (12.0%) and Tribal Health Organizations (12.8%). Lastly, estimated vacancy rates for Transcriptionist were concentrated in Behavioral Health Services (16.7%).
Table 82. Information and Reimbursement Occupations, Estimated Vacancies, and Vacancy Rates by Organization Type
Occupations
Billing Clerk/ Technician
Billing Supervisor
Compliance/ Auditor
Records Clerk/
Technician Transcription
Coding Clerk/
Technician
Certified Coder
Coding Specialist
Est
imat
ed
Vac
anci
es
Est
imat
ed
Vac
ancy
R
ates
E
stim
ated
V
acan
cies
Est
imat
ed
Vac
ancy
R
ates
Est
imat
ed
Vac
anci
es
Est
imat
ed
Vac
ancy
R
ates
E
stim
ated
V
acan
cies
E
stim
ated
V
acan
cy
Rat
es
Est
imat
ed
Vac
anci
es
Est
imat
ed
Vac
ancy
R
ates
Est
imat
ed
Vac
anci
es
Est
imat
ed
Vac
ancy
R
ates
E
stim
ated
V
acan
cies
Est
imat
ed
Vac
ancy
R
ates
E
stim
ated
V
acan
cies
E
stim
ated
V
acan
cy
Rat
es
Behavioral Health Services 4.5 4.3% 1.5 4.8% 0.0 0.0% 4.5 12.0% 1.5 16.7% 0.0 0.0% 0.0 0.0% 0.0 0.0% Dental Clinics/Offices 0.0 0.0% 0.0 0.0% NP 0.0 0.0% NP 0.0 0.0% NP NP Diagnostic Imaging 0.0 0.0% 0.0 0.0% NP 0.0 0.0% 0.0 0.0% NP NP 0.0 0.0% Hospitals/Nursing Homes 5.0 4.2% 0.0 0.0% 0.0 0.0% 3.0 2.6% 0.0 0.0% 0.0 0.0% 1.0 4.2% 0.0 0.0% Diagnostic Laboratories 0.0 0.0% 0.0 0.0% NP 0.0 0.0% NP 0.0 0.0% NP NP Tribal Health Organizations 9.0 7.4% 1.0 5.9% 1.0 8.3% 18.0 12.8% 0.0 0.0% 7.0 7.1% 4.0 28.6% 2.0 16.7% Medical Clinics/Physician Offices
31.3 6.3% 2.6 1.8% 2.6 5.0% 11.7 4.7% 0.0 0.0% 0.0 0.0% 5.2 2.8% 0.0 0.0%
Pharmacies 3.0 8.1% 0.0 0.0% NP 0.0 0.0% NP 0.0 0.0% NP 1.0 25.0% Physical/Occupational/ Speech Therapy
5.9 9.6% 1.2 4.0% NP 0.0 0.0% NP 0.0 0.0% 0.0 0.0% NP
School Districts NP NP 0.0 0.0% NP NP NP NP NP Paramedics NP NP NP NP NP NP NP NP
NP=No Positions Reported

2009 AK Health Workforce Vacancy Study December 2009 ACRH and ISER
85
We found concentrations of unfilled positions in the following specific regional “pockets” by estimated vacancy rates (Table 83):
• Billing Clerk/Technician—Southwest, 13.1%; North, 12.9% • Compliance/Auditor—Interior 23.0% • Certified Coder—Southeast, 9.6%; Southwest, 44.5% • Coding Specialist—Southeast, 15.1%
Table 83. Information and Reimbursement Occupations, Estimated Vacancies, and Vacancy Rates by Labor Market Region
Occupation
Anchorage Gulf Coast Interior Southeast North Southwest E
stim
ated
V
acan
cies
Est
imat
ed
Vac
ancy
R
ates
Est
imat
ed
Vac
anci
es
Est
imat
ed
Vac
ancy
R
ates
Est
imat
ed
Vac
anci
es
Est
imat
ed
Vac
ancy
R
ates
Est
imat
ed
Vac
anci
es
Est
imat
ed
Vac
ancy
R
ates
Est
imat
ed
Vac
anci
es
Est
imat
ed
Vac
ancy
R
ates
Est
imat
ed
Vac
anci
es
Est
imat
ed
Vac
ancy
R
ates
Billing Clerk/Technician 25.0 3.7% 8.6 8.1% 8.4 6.1% 9.7 7.8% 3.0 12.9% 4.0 13.1% Billing Supervisor 2.7 1.5% 2.6 7.6% 1.0 2.6% 0.0 0.0% 0.0 0.0% 0.0 0.0% Compliance/Auditor 1.0 1.7% 0.0 0.0% 2.6 23.0% 0.0 0.0% 0.0 0.0% 0.0 0.0% Records Clerk/Technician 25.3 6.1% 2.0 4.5% 5.6 7.1% 0.0 0.0% 1.0 9.1% 3.3 9.8% Transcriptionist 0.0 0.0% 0.0 0.0% 1.5 5.5% 0.0 0.0% NP NP Coding Clerk/Technician 4.0 2.5% 0.0 0.0% 0.0 0.0% 1.0 2.0% 1.0 20.0% 1.0 7.8% Certified Coder 0.0 0.0% 1.0 5.8% 2.6 8.3% 1.0 9.6% 0.0 0.0% 5.6 44.5% Coding Specialist 2.0 3.6% 0.0 0.0% 0.0 0.0% 1.0 15.1% NP NP
NP=No Positions Reported

2009 AK Health Workforce Vacancy Study December 2009 ACRH and ISER
86
n. Paramedic Due to Alaska’s vast and diverse geography, first responders to emergencies are also diverse. The survey for paramedic positions was augmented shortly after data collection started. We expanded the organization types beyond health-care organizations and included fire department/emergency services (military, borough, and municipality), paid and volunteer, air medevac services, and airports. We also expanded the occupations to include firefighters with emergency medical services training. Paramedic occupations had a significant number of volunteer positions due to the numerous volunteer fire departments throughout Alaska. The augmented sample that includes fire department/emergency services (military, borough, and municipality), paid and volunteer, air medevac services, and airports shows that this is where most paramedic/EMT positions are located. Also of note is the importance of volunteers in these occupations, as noted by 43.0 volunteer emergency staff which include volunteer paramedics, EMTs, and firefighters with EMT training that were in the health-care organization sample (Table 84).
Table 84. Paramedic Positions, Vacancies, and Vacancy Rates, Sample and Statewide Estimates
Occupations Sample Statewide Estimates
Positions Vacancies Vacancy
Rates Positions Vacancies
Vacancy Rates
Health-Care Organizations Sample Allied Health Paramedic 9.0 4.0 44.4% 9.0 4.0 44.4% Allied Health EMT/ETT 23.0 0.0 0.0% 27.7 0.0 0.0% Augmented Sample Paramedic 234.0 6.0 2.6% 288.7 7.4 2.6% Firefighter with Emergency Medical Service
903.0 26.0 2.9% 1,114.1 32.1 2.9%
Health-Care Organization Sample—Other Occupations* Volunteer Emergency Staff 43.0 EMT I, II, III 14.0
*Other occupations are included in statewide. They are not disaggregated by urban vs. rural, geographic region, or organization type.
Paramedic positions had a high vacancy rate in the rural areas at 66.7% (Table 85).
Table 85. Paramedic Estimated Vacancies and Vacancy Rates by Urban and Rural Regions
Occupation Urban Rural
Estimated Vacancies
Estimated Vacancy Rates
Estimated Vacancies
Estimated Vacancy Rates
Health Care Organizations Sample EMT/ETT 0.0 0.0% 0.0 0.0% Paramedic 0.0 0.0% 4.0 66.7% Augmented Sample Paramedic 4.9 3.6% 2.5 1.6% Firefighter with Emergency Medical Service 30.8 4.0% 1.2 0.4%

2009 AK Health Workforce Vacancy Study December 2009 ACRH and ISER
87
Consistent with the high estimated vacancy rate in the rural areas for paramedics was the high rate in the North region, which is predominately rural (Table 86). The Interior region shows an estimated vacancy rate of 15.1% for firefighter with EMT training and may be related to a concentration of firefighters who were employed in this area.
Table 86. Paramedic Estimated Vacancies and Vacancy Rates by Labor Market Region
Occupation
Anchorage Gulf Coast Interior Southeast North Southwest
Est
imat
ed
Vac
anci
es
Est
imat
ed
Vac
ancy
R
ate
Est
imat
ed
Vac
anci
es
Est
imat
ed
Vac
ancy
R
ate
Est
imat
ed
Vac
anci
es
Est
imat
ed
Vac
ancy
R
ate
Est
imat
ed
Vac
anci
es
Est
imat
ed
Vac
ancy
R
ate
Est
imat
ed
Vac
anci
es
Est
imat
ed
Vac
ancy
R
ate
Est
imat
ed
Vac
anci
es
Est
imat
ed
Vac
ancy
R
ate
Health-Care Organizations Sample EMT/ETT NP 0.0 0.0% 0.0 0.0% 0.0 0.0% NP 0.0 0.0% Paramedic 0.0 0.0% NP NP 0.0 0.0% 4.0 66.7% NP
Augmented Sample Paramedic 2.5 2.4% 0.0 0.0% 1.2 2.6% 1.2 4.8% 2.5 13.3% NP Firefighter with Emergency Medical Service
7.4 1.2% 0.0 0.0% 23.4 15.1% 0.0 0.0% 1.2 1.7% 0.0 0.0%
NP=No Positions Reported
The 50.0% vacancy rate in paramedic positions reflects the need for employment in these occupations in fire department/emergency services (military, borough, and municipality), air medevac services, and airports (Table 87).
Table 87. Paramedic Estimated Vacancies and Vacancy Rates by Organization Type
Occupation Tribal Health Paramedic
Estimated Vacancies
Estimated Vacancy Rates
Estimated Vacancies
Estimated Vacancy Rates
Health-Care Organizations Sample EMT/ETT 0.0 0.0% 0.0 0.0% Paramedic 4.0 50.0% NP Augmented Sample Paramedic NP 7.4 2.6% Firefighter with EMS NP 32.1 2.9%
NP=No Positions Reported
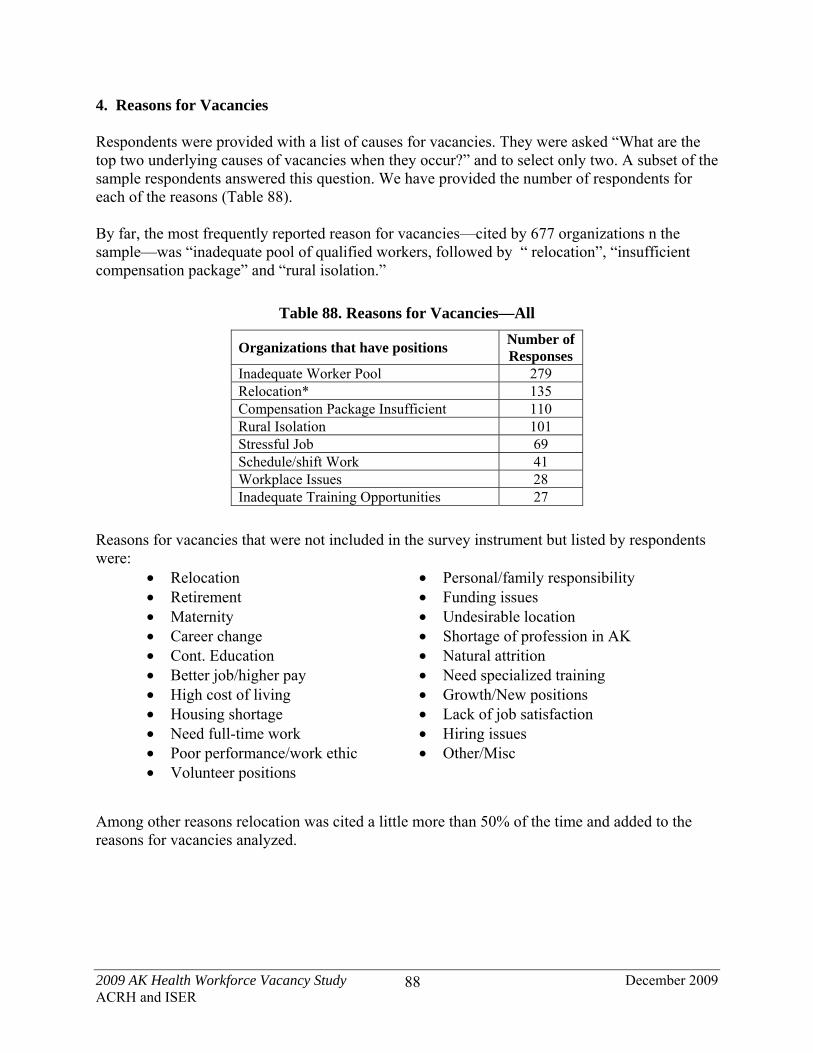
2009 AK Health Workforce Vacancy Study December 2009 ACRH and ISER
88
4. Reasons for Vacancies Respondents were provided with a list of causes for vacancies. They were asked “What are the top two underlying causes of vacancies when they occur?” and to select only two. A subset of the sample respondents answered this question. We have provided the number of respondents for each of the reasons (Table 88). By far, the most frequently reported reason for vacancies—cited by 677 organizations n the sample—was “inadequate pool of qualified workers, followed by “ relocation”, “insufficient compensation package” and “rural isolation.”
Table 88. Reasons for Vacancies—All
Organizations that have positions Number of Responses
Inadequate Worker Pool 279 Relocation* 135 Compensation Package Insufficient 110 Rural Isolation 101 Stressful Job 69 Schedule/shift Work 41 Workplace Issues 28 Inadequate Training Opportunities 27
Reasons for vacancies that were not included in the survey instrument but listed by respondents were:
Relocation Personal/family responsibility Retirement Funding issues Maternity Undesirable location Career change Shortage of profession in AK Cont. Education Natural attrition Better job/higher pay Need specialized training High cost of living Growth/New positions Housing shortage Lack of job satisfaction Need full-time work Hiring issues Poor performance/work ethic Other/Misc Volunteer positions
Among other reasons relocation was cited a little more than 50% of the time and added to the reasons for vacancies analyzed.

2009 AK Health Workforce Vacancy Study December 2009 ACRH and ISER
89
When the sample was separated into urban and rural regions, the general similarity in the frequency distributions of the reasons cited was striking. For both urban and rural respondents, the most commonly cited cause was “insufficient pool of qualified applicants” (163 urban, 116 rural). For urban respondents, relocation at 92 was the second most frequently cited cause verses rural respondents who cited insufficient compensation package as the second most frequent reason for vacancies (Table 89).
Table 89. Reasons for Vacancies, Urban and Rural
Reasons for Vacancies
Inad
equa
te
Wor
ker
Poo
l
Rel
ocat
ion
Com
pen
sati
on
Pac
kag
e In
suff
icie
nt
Inad
equa
te
Tra
inin
g O
pp
ortu
nit
ies
Str
essf
ul J
ob
Ru
ral I
sola
tion
Sch
edu
le/S
hif
t W
ork
Wor
kp
lace
Is
sues
Urban (n=393) 163 92 56 18 47 23 26 18 Rural (n=284) 116 43 54 9 22 78 15 10
Separating the reasons by organization type yields varying distributions of most frequently cited causes for vacancies (Table 90, next page). Every respondent type cited “inadequate pool of qualified applicants”. “Inadequate compensation” and “relocation” were also noted as second across the organization groups, with the exception of the dental clinics for compensation package and school districts for relocation.
Table 90. Vacancy Causes by Respondent Type
Respondent Type
Inad
equa
te
Wor
ker
Poo
l
Rel
ocat
ion
Com
pen
sati
on
Pac
kag
e In
suff
icie
nt
Inad
equa
te
Tra
inin
g O
pp
ortu
nit
ies
Str
essf
ul J
ob
Ru
ral
Isol
atio
n
Sch
edu
le/S
hif
t W
ork
Wor
kp
lace
Is
sues
Behavioral Health (n=84) 29 9 28 2 18 8 7 0 Dental Clinics (n=148) 60 50 12 8 14 7 16 11 Diagnostic Imaging (n=16) 3 5 0 0 0 1 1 1 Hospitals/Nursing Homes (n=17) 11 2 4 2 4 3 0 1 Laboratories(n=13) 4 4 3 0 2 0 0 0 Med Clinics/Dr Offices (n=171) 61 41 24 4 21 18 3 9 Tribal Health (n=25) 9 4 3 1 4 10 0 2 Pharmacies (n=35) 23 7 7 3 3 7 1 0 PT/OT/ST (n=64) 37 4 10 5 2 9 7 3 School Districts (n=15) 7 3 6 0 0 4 0 0 State/Municipal (n=24) 23 0 1 0 0 23 1 0 Paramedic (n=73) 12 6 12 2 1 11 5 1
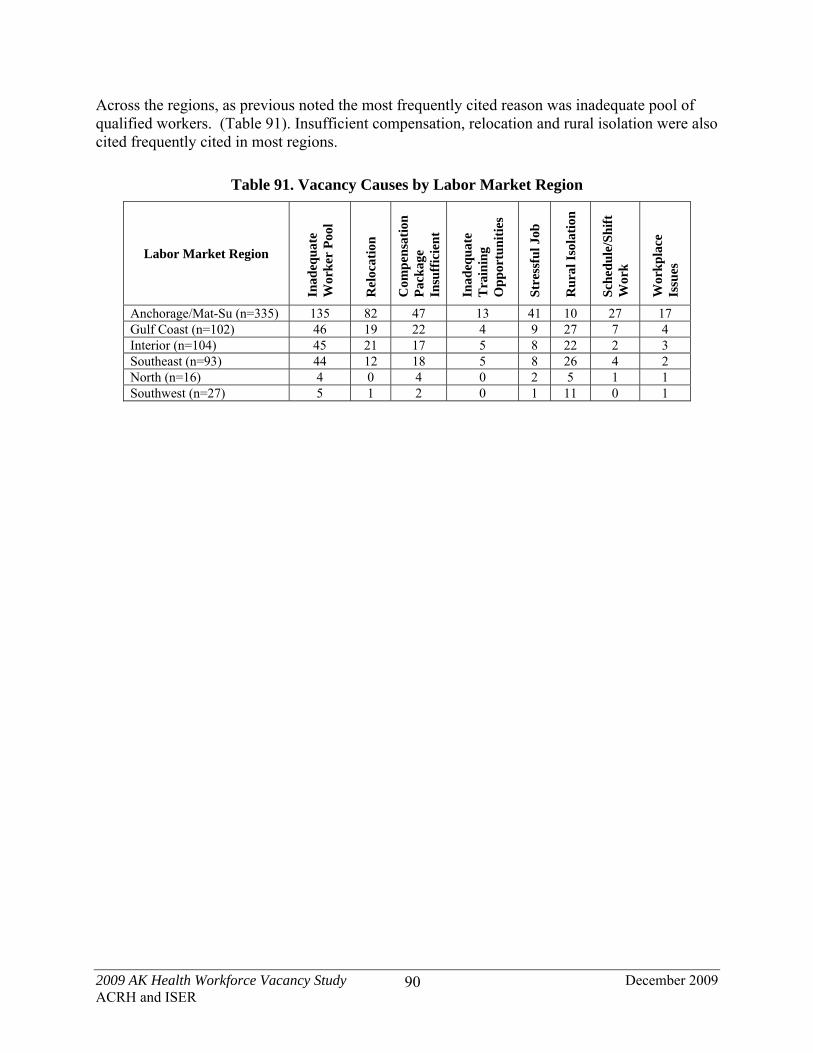
2009 AK Health Workforce Vacancy Study December 2009 ACRH and ISER
90
Across the regions, as previous noted the most frequently cited reason was inadequate pool of qualified workers. (Table 91). Insufficient compensation, relocation and rural isolation were also cited frequently cited in most regions.
Table 91. Vacancy Causes by Labor Market Region
Labor Market Region
Inad
equa
te
Wor
ker
Poo
l
Rel
ocat
ion
Com
pen
sati
on
Pac
kag
e In
suff
icie
nt
Inad
equa
te
Tra
inin
g O
pp
ortu
nit
ies
Str
essf
ul J
ob
Ru
ral I
sola
tion
Sch
edu
le/S
hif
t W
ork
Wor
kp
lace
Is
sues
Anchorage/Mat-Su (n=335) 135 82 47 13 41 10 27 17 Gulf Coast (n=102) 46 19 22 4 9 27 7 4 Interior (n=104) 45 21 17 5 8 22 2 3 Southeast (n=93) 44 12 18 5 8 26 4 2 North (n=16) 4 0 4 0 2 5 1 1 Southwest (n=27) 5 1 2 0 1 11 0 1

2009 AK Health Workforce Vacancy Study December 2009 ACRH and ISER
91
5. New Graduates Respondents were asked two questions on the hiring of new graduates. The first was “Do you hire new graduates in this occupation?” Table 92 displays occupations with estimated 50 or more “yes” responses.
Table 92. “Do You Hire New Graduates in this Occupation?” with Estimated 50 or More “Yes” Responses
Organization Type Occupation Sample Estimate 100 Plus Estimated
Information and Reimbursement Billing Clerk/Technician 186 324 Allied Health Health Dental Assistant 122 218 Managers and Administrators Administrator/Director/CEO/Manager 115 218 Professional Nurses Registered Nurse 96 187 Allied Health Dental Hygienist 99 180 Information and Reimbursement Records Clerk/Technician 91 163 Allied Health Medical Assistant 61 143 Other Nursing Staff Licensed Practical Nurse 68 131 Other Clinicians/Therapists Dentist 69 120 Professional Nurses Family Nurse Practitioner 49 106 Other Nursing Staff Certified Nurse Assistant 58 100 >50 and <100 EstimatedInformation and Reimbursement Billing Supervisor 46 88 Other Clinicians/Therapists Physician Assistant 37 85 Physicians Family Physician 34 79 Behavioral Health Behavioral Health Case Manager 44 67 Other Clinicians/Therapists Physical Therapist 53 65 Information and Reimbursement Coding Clerk/Technician 34 60 Allied Health Allied Health Medical Lab Technician 30 57 Allied Health Allied Health Pharmacy Technician 42 52 Behavioral Health Chemical/Substance Counselor 35 52 Behavioral Health Clinician 35 51
Respondents were asked “How many of the currently vacant budgeted positions could be filled by new graduates of training programs?” This question provides an indication of the demand for new graduates of training programs. Among occupations that had at least 50 positions that could be filled by new graduates were two nursing occupations—Certified Nurse Assistant and Registered Nurse. In addition, the leading position that could be filled by new graduates was a Behavioral Health occupation—Human Services Worker–HS (Table 93).

2009 AK Health Workforce Vacancy Study December 2009 ACRH and ISER
92
Table 93. Occupations with at Least 50 Estimated Positions that Could Be Filled With New Graduates
Organization Type Occupation
Sample Estimate Current vacancies that could be filled with new graduates
Current vacancies that could be filled with new graduates
Behavioral Health Human Services Worker–HS 79 121 Other Nursing Staff Certified Nurse Assistant 89 102 Professional Nurses Registered Nurse 64 96
See Appendix E for detailed tables on all occupations by organization type, urban versus rural, and geographic regions. 6. Length of Longest Vacancy Expressed in Months Respondents were asked to tell us the longest length of time, in months, a vacancy had existed. In the analysis, we combined the responses in SPSS and calculated the mean (average) and maximum (longest) length of vacancy in months. Twelve occupations had the same mean and maximum vacancy length (see Table 94) with the longest length for the General Internist at 24 months.
Table 94. Occupations with Equal Sample Mean and Maximum Length of Vacancy
Occupation Group Occupations Sample
Maximum Sample Mean
Physicians General Internist 24.0 24.0 Managers and Administrators Hospital Administrator 6.0 6.0 Information and Reimbursement Coding Clerk/Technician 6.0 6.0 Allied Health MRI/CT Technician 4.0 4.0 Allied Health Nuclear Med Technician 4.0 4.0 Physicians Emergency Physician 3.0 3.0 Health Education and Community Wellness Nutritionist 3.0 3.0 Behavioral Health Psychiatric Aide/Technician 2.0 2.0 Behavioral Health Social Worker MSW 2.0 2.0 Allied Health Echocardiography Technician 2.0 2.0 Health Education and Community Wellness Health Educator 1.0 1.0 Information and Reimbursement Compliance/Auditor 1.0 1.0
Fourteen occupations shown in Table 95 had an estimated mean vacancy length of one year or greater. A relatively new occupation in dental health care—Dental Health Aide Therapist—was the position with the greatest vacancy length (25 months mean). This occupation was followed by General Internists (24 months mean); rounding out the top three occupations was Public Health Nurse (24 months mean).

2009 AK Health Workforce Vacancy Study December 2009 ACRH and ISER
93
Table 95. Occupations with a Mean Vacancy Length of at least Twelve Months
Occupation Group Occupations Sample
Maximum Sample Mean
Allied Health Dental Health Aide Therapist 48.0 25.0 Physicians General Internist 24.0 24.0 Professional Nurses Public Health Nurse 51.0 24.0 Health Education and Community Wellness Community Health Aide/Practitioner (CHAP) 95.0 22.8 Information and Reimbursement Certified Coder 36.0 16.0 Other Clinicians/Therapists Occupational Therapist 36.0 14.5 Paramedics Firefighter with Emergency Medical Service 50.0 14.4 Allied Health Dental Hygienist 108.0 14.4 Other Clinicians/Therapists Speech Language Pathologist 60.0 14.2 Other Nursing Staff Home Health Aide 16.0 13.0 Other Clinicians/Therapists Speech Therapist 30.0 12.8 Physicians Family Physician 48.0 12.7 Managers and Administrators Nursing Director/Executive 48.0 12.6 Professional Nurses Nurse Manager 48.0 12.4
An additional 23 occupations had an estimated mean vacancy length of less than 12 months and greater than 6 months (Table 96). The highest among these were Nurse Manger, Sonographer, and Women's Health Care Nurse Practitioner 11.6, 11.2, and 11.0 months respectively.
Table 96. Occupations with a Mean Vacancy Length at least Six Months and Less than Twelve Months
Occupation Group Occupations Sample
Maximum Sample Mean
Professional Nurses Nurse Case Manger 48.0 11.6 Allied Health Sonographer 24.0 11.2 Professional Nurses Women's Health Care Nurse Practitioner 24.0 11.0 Other Clinicians/Therapists Pharmacist 36.0 10.6 Other Clinicians/Therapists Physical Therapist 30.0 10.4 Physicians Radiation Oncologist 10.0 9.3 Managers and Administrators Health Information Administrator/Manager 12.0 9.3 Professional Nurses Pediatric Nurse Practitioner 12.0 9.3 Other Clinicians/Therapists Dentist 26.0 9.2 Professional Nurses Nurse Midwife 12.0 9.0 Health Education and Community Wellness Village Health Educator 9.0 9.0 Other Clinicians/Therapists Physician Assistant 30.0 8.9 Professional Nurses Family Nurse Practitioner 24.0 7.9 Behavioral Health Psychologist/Psychological Associate 12.0 7.4 Behavioral Health Professional Counselor 9.0 7.0 Allied Health Allied Health Physical Therapy Assistant 12.0 6.9 Professional Nurses Registered Nurse 48.0 6.8 Health Education and Community Wellness Community Health Representative 16.0 6.3 Behavioral Health Clinical Psychologist 12.0 6.0 Managers and Administrators Hospital Administrator 6.0 6.0 Information and Reimbursement Coding Clerk/Technician 6.0 6.0 Information and Reimbursement Coding Specialist 10.0 6.0 Behavioral Health Aide/Village Counselor 17.0 6.0

2009 AK Health Workforce Vacancy Study December 2009 ACRH and ISER
94
There were 46 health occupations (almost half of the 93 occupations included in this study) that had a maximum vacancy length of at least 12 months. Table 97 illustrates the deficient “supply side” of numerous health occupations, recruitment of which is impeded by the reasons for vacancies highlighted by the respondents in this report.
Table 97. Occupations with a Maximum Vacancy Length of Twelve Months and Greater
Occupation Group Occupations Sample Maximum
Sample Mean
Allied Health Dental Hygienist 108.0 14.4 Health Education and Community Wellness Community Health Aide/Practitioner 95.0 22.8 Other Clinicians/Therapists Speech Language Pathologist 60.0 14.2 Professional Nurses Public Health Nurse 51.0 24.0 Paramedics Firefighter with Emergency Medical Service 50.0 14.4 Allied Health Dental Health Aide Therapist 48.0 25.0 Physicians Family Physician 48.0 12.7 Managers and Administrators Nursing Director/Executive 48.0 12.6 Professional Nurses Nurse Manager 48.0 12.4 Professional Nurses Nurse Case Manger 48.0 11.6 Professional Nurses Registered Nurse 48.0 6.8 Information and Reimbursement Certified Coder 36.0 16.0 Other Clinicians/Therapists Occupational Therapist 36.0 14.5 Other Clinicians/Therapists Pharmacist 36.0 10.6 Information and Reimbursement Billing Clerk/Technician 36.0 5.3 Allied Health Dental Assistant 36.0 4.3 Other Clinicians/Therapists Speech Therapist 30.0 12.8 Other Clinicians/Therapists Physical Therapist 30.0 10.4 Other Clinicians/Therapists Physician Assistant 30.0 8.9 Other Clinicians/Therapists Dentist 26.0 9.2 Managers and Administrators Administrator/Director/CEO/Manager 26.0 5.5 Physicians General Internist 24.0 24.0 Allied Health Sonographer 24.0 11.2 Professional Nurses Women's Health Care Nurse Practitioner 24.0 11.0 Professional Nurses Family Nurse Practitioner 24.0 7.9 Other Nursing Staff Certified Nurse Assistant 24.0 5.6 Behavioral Health Clinician 18.0 4.1 Behavioral Health Chemical/Substance Counselor 18.0 3.4 Behavioral Health Aide/Village Counselor 17.0 6.0 Other Nursing Staff Home Health Aide 16.0 13.0 Health Education and Community Wellness Community Health Representative 16.0 6.3 Physicians Psychiatrist 15.0 5.0 Managers and Administrators Health Information Administrator/Manager 12.0 9.3 Professional Nurses Pediatric Nurse Practitioner 12.0 9.3 Professional Nurses Nurse Midwife 12.0 9.0 Behavioral Health Psychologist/Psychological Associate 12.0 7.4 Allied Health Physical Therapy Assistant 12.0 6.9 Behavioral Health Clinical Psychologist 12.0 6.0 Allied Health Massage Therapist 12.0 5.3 Professional Nurses Critical Care/ER/Intensive Care Unit Nurse 12.0 5.3 Managers and Administrators Medical Director 12.0 5.0 Behavioral Health Human Services Worker Degree 12.0 4.8 Allied Health Allied Health Medical Technician 12.0 4.6 Other Nursing Staff Licensed Practical Nurse 12.0 3.0 Other Nursing Staff Personal Care Attendant 12.0 2.4 Behavioral Health Human Services Worker HS 12.0 2.2