2007_financials_report
DESCRIPTION
http://www.ksturnpike.com/assets/uploads/2007_financials_report.pdfTRANSCRIPT

Kansas Turnpike AuthorityFinancial Statements
with Supplementary Information
Years ended December 31, 2007 and 2006
with
Independent Auditors’ Report

12
Table of Contents
PageIndependent Auditors’ Report .................................................................................................. 13
Management’s Discussion and Analysis .................................................................................... 14
Basic Financial Statements:Balance Sheets .............................................................................................................. 18Statements of Revenues,
Expenses and Changes in Net Assets...................................................................... 20Statements of Cash Flows ............................................................................................ 21Notes to Financial Statements ...................................................................................... 22
Supplementary Information:Combining Balance Sheet ............................................................................................ 32Combining Statement of Revenues
Expenses and Changes in Net Assets...................................................................... 34Summary of Toll Revenues............................................................................................ 36
Statistical Data:Operating Summaries – Vehicles, Mileage and Revenue.............................................. 37Schedule of Service Area Traffic and Sales .................................................................. 38Schedule of Activity by Interchange.............................................................................. 39Schedule of Monthly Vehicles, Mileage and Toll Revenues.......................................... 40Summary of Turnpike Traffic ........................................................................................ 41Summary of Average Daily Traffic between Interchanges ............................................ 41
This is a copy of the Authority’s annual financial statements reproduced from an electronic file. An orig-inal copy of this document is available at the Authority’s office.

Spanning the Future 13
Independent Auditors’ Report
Board of DirectorsKansas Turnpike Authority
We have audited the accompanying basic financial statements of the Kansas Turnpike Authority as of and for theyears ended December 31, 2007 and 2006, as listed in the table of contents. These financial statements are theresponsibility of the Turnpike’s management. Our responsibility is to express an opinion on these financial state-ments based on our audits.
We conducted our audits in accordance with auditing standards generally accepted in the United States ofAmerica. Those standards require that we plan and perform the audits to obtain reasonable assurance aboutwhether the financial statements are free of material misstatement. An audit includes examining, on a test basis,evidence supporting the amounts and disclosures in the basic financial statements. An audit also includes assess-ing the accounting principles used and significant estimates made by management, as well as evaluating the over-all basic financial statement presentation. We believe that our audits provide a reasonable basis for our opinion.
As explained in Note 1, the Turnpike does not provide for recognition of depreciation on turnpike facilities; doesnot capitalize either interest costs or the costs of improvements and replacements financed by other than bond pro-ceeds; and capitalizes bond issuance costs and related premiums and discounts as part of turnpike facilities withoutamortizing such costs (collectively, the “Exceptions”). These practices are not, in our opinion, in accordance withaccounting principles generally accepted in the United States of America. The effects of these practices on thefinancial statements have not been determined.
In our opinion, except for the effects of the Exceptions as discussed in the preceding paragraph, the financialstatements referred to above present fairly, in all material respects, the financial position of the Kansas TurnpikeAuthority as of December 31, 2007 and 2006, and its changes in financial position and its cash flows for the yearsthen ended in conformity with accounting principles generally accepted in the United States of America.
The accompanying management’s discussion and analysis as listed in the table of contents is not a required partof the basic financial statements but is supplementary information required by accounting principles accepted in theUnited States of America. We have applied certain limited procedures, which consisted principally of inquiries ofmanagement regarding the methods of measurement and presentation of the required supplementary information.However, we did not audit the information and express no opinion on it.
Our audits were conducted for the purpose of forming an opinion on the Turnpike’s basic financial statements.The accompanying supplementary information as listed in the table of contents is presented for purposes of addi-tional analysis and is not a required part of the basic financial statements. Such information has been subjected tothe auditing procedures applied in the audits of the basic financial statements and, in our opinion, except for theeffects of the accounting methods discussed in the third paragraph of our report on the basic financial statements,such information is fairly stated, in all material respects, in relation to the basic financial statements taken as awhole. The statistical data has not been subjected to the auditing procedures applied in the audits of the basicfinancial statements and, accordingly, we express no opinion thereon.
CERTIFIED PUBLIC ACCOUNTANTS
February 27, 2008Wichita, Kansas

14
Management’s Discussion and AnalysisOur discussion and analysis of The Kansas Turnpike Authority’s (KTA or Turnpike) financial perform-
ance provides an overview of the Turnpike’s financial activities for the fiscal year ended December 31,2007. Please read it in conjunction with the Turnpike’s financial statements and associated footnotes.
Financial Highlights• The Turnpike’s net assets increased in 2007 by approximately $5.5
million or 1.6% compared to 2006.
• Operating revenues increased by approximately $2.9 million or 3.6%in 2007 compared to 2006.
• Operating expenses increased by approximately $27.9 million or59.6% in 2007 compared to 2006.
• Long-term debt decreased by approximately $9.5 million or 3.9% in2007 compared to 2006.
Using this Annual ReportThis discussion and analysis is intended to serve as an introduction to the KTA’s financial statements,
which are comprised of the basic financial statements and the notes to the financial statements and sup-plementary information presented. Since the KTA operates like a single enterprise fund, fund level finan-cial statements are not shown. In addition to the basic financial statements, this report also containsother supplementary information.
The basic financial statements are designed to provide readers with a broad overview of the KTA’sfinances, in a manner similar to a private-sector business. The Turnpike’s financial statements consist ofthree statements – balance sheet; statement of revenues, expenses and changes in net assets; and state-ment of cash flows. These statements provide information about the activities of the Turnpike, includingresources held by the Turnpike but restricted for specific purposes by bond trust indentures. In additionto the basic financial statements, this report also contains other supplementary information concerningthe Turnpike’s traffic and revenues by vehicle class, as required by bond trust indentures.
The Balance Sheet and Statement of Revenues, Expenses, and Change in Net AssetsOne of the most important questions asked about the Turnpike’s finances is, “Is the Turnpike as a
whole better or worse off as a result of the year’s activities?” The Balance Sheets and the Statements ofRevenues, Expenses, and Change in Net Assets report information about the Turnpike’s resources and itsactivities in a way that helps answer this question. These statements include all restricted and unrestrict-ed assets and all liabilities using the accrual basis of accounting. All of the current year’s revenues andexpenses are taken into account regardless of when cash is received or paid.
These two statements report the Turnpike’s net assets and changes in them. You can think of theTurnpike’s net assets – the difference between assets and liabilities – as one way to measure theTurnpike’s financial health, or financial position. Over time, increases or decreases in the Turnpike’s netassets are one indicator of whether its financial health is improving or deteriorating. You will need to con-sider other nonfinancial factors, however, such as changes in the Turnpike’s customer base and measuresof the quality of service it provides, as well as local, regional and national economic factors to assess theoverall health of the Turnpike.

Spanning the Future 15
The Statement of Cash FlowsThe final required statement is the Statement of Cash Flows. The statement reports cash receipts, cashpayments, and net changes in cash resulting from operations, investing, and financing activities. It pro-vides answers to such questions as “Where did cash come from?”, and “What was the change in cashbalance during the reporting period?”
Notes to the Financial StatementsThe notes provide additional information that is essential to a full understanding of the data provided
in the basic financial statements.
Other InformationIn addition to the basic financial statements and accompanying notes, this report also presents certain
supplementary information concerning Turnpike traffic and revenues by vehicle class, as required bybond trust indentures.
The Turnpike’s Net AssetsThe Turnpike’s net assets are the difference between its assets and liabilities reported in the Balance
sheet. The Turnpike’s net assets increased in 2007 by approximately $5.5 million (1.6%).
ASSETS2007 2006 2005
Cash and cash equivalents $ 35,781,134 $ 27,328,335 $ 30,661,789Short-term investments 78,806,313 98,814,123 65,760,276Accounts receivable 800,145 773,419 561,564Other current assets 2,929,075 3,273,011 2,437,226Capital assets 448,823,108 447,974,637 411,268,520Other noncurrent assets 50,006,967 43,510,333 90,520,412
Total assets 617,146,742 621,673,858 601,209,787
LIABILITIES
Long-term debt outstanding 236,860,000 246,380,000 254,130,000Other current liabilities 20,051,632 20,697,460 22,028,978Other long-term liabilities 1,777,688 1,622,846 1,525,685
Total liabilities 258,689,320 268,700,306 277,684,663
NET ASSETS
Invested in capital assets, net of related debt 202,443,108 191,503,760 145,502,123Restricted expendable net assets 10,226,648 12,932,142 48,607,892Unrestricted 145,787,666 148,537,650 129,415,109
Total net assets $ 358,457,422 $ 352,973,552 $ 323,525,124
Net assets may serve, over time, as a useful indicator of an organization’s financial position. In thecase of the KTA, assets exceeded liabilities by $358,457,422 at the close of the most recent year. This rep-resents an increase of $5,483,870 (1.6%) over the previous year.

16
Unrestricted net assets decreased from $148,537,650 at December 31, 2006 to $145,787,666 atDecember 31, 2007, a decrease of $2,749,984 (1.8%) in unrestricted net assets.
By far, the largest portion of the KTA’s net assets reflects its investment in capital assets, such as right-of-way, roads, bridges, and buildings less any related debt used to acquire those assets that are still out-standing. The KTA uses these capital assets to provide services to customers and consequently, theseassets are not available to liquidate liabilities or other future spending. Although the Turnpike’s invest-ment in capital assets is reported net of related debt, it should be noted that the resources needed torepay this debt must be provided from other sources, since the capital assets themselves cannot be usedto liquidate these liabilities.
The most noteworthy change in the Turnpike’s assets and liabilities is an increase in Capital Assets,attributed to the completion of the widening of I-70 between Topeka and Lecompton.
Changes in the Turnpike’s Net AssetsIn 2007, the Turnpike’s net assets increased by approximately $5.5 million or 1.6% of total net assets,
as shown in the table below.
CHANGES IN NET ASSETS2007 2006 2005
Operating revenuesTolls $ 78,195,540 $ 75,745,880 $ 73,622,065Other operating revenues 4,714,533 4,250,517 3,714,207
Total operating revenues 82,910,073 79,996,397 77,336,272
Operating expensesAdministration 6,548,399 6,281,659 5,766,982Insurance 7,677,844 6,422,266 6,326,547Toll collection 11,557,942 11,062,548 11,000,904Patrol 5,442,957 5,241,421 4,894,323Maintenance 8,986,183 7,814,559 8,829,274Cost of improvements, major repairs 34,482,921 9,971,643 5,757,349
and replacementsTotal operating expenses 74,696,246 46,794,096 42,575,379
Operating income 8,213,827 33,202,301 34,760,893
Nonoperating revenues (expenses)Investment revenue 8,681,873 8,124,447 5,991,874Interest on long-term debt (11,411,830) (11,878,320) (12,364,019)
Net nonoperating revenues(expenses) (2,729,957) (3,753,873) (6,372,145)
Increase in Net Assets $ 5,483,870 $ 29,448,428 $ 28,388,748

Spanning the Future 17
Operating IncomeThe first component of the overall change in the Turnpike’s net assets is its operating income – gen-
erally, the difference between net toll revenue and the expenses incurred to maintain and patrol the roadand collect that revenue. In fiscal year 2007, the Turnpike reported operating income, which is consis-tent with the Turnpike’s operating history. The Turnpike’s management and staff have worked togetherto ensure quality customer service and maintain a strong financial position.
Net toll revenues grew from approximately $75.7 million in fiscal year 2006 to approximately $78.2million, an increase of 3.2%. The Turnpike’s concessionaire rental revenue increased 3.9% in 2007 com-pared to 2006. Another significant area of increase was in K-TAG transactions, which increased 5% in2007 compared to 2006. Over 40% of all vehicles used the K TAG electronic system.
Operating expenses increased approximately $27.9 million or 59.6% from fiscal year 2006 to fiscal year2007. The increase was primarily attributable to the cost of improvements, major repairs, and replace-ments, which increased from $9.9 million in 2006 to $34.5 million in 2007.
Nonoperating Revenues and ExpensesNonoperating revenues and expenses consist primarily of investment earnings and interest paid on
long-term debt. One factor contributing to the increase in nonoperating revenues is the comparativelyhigher rate of interest in the current economic environment and improvement in the fair value of theinvestments. Revenues from investments for fiscal year 2007 were approximately $0.6 million more thanfiscal year 2006.
The Turnpike’s Cash FlowsChanges in the Turnpike’s operating cash flows are consistent with changes in operating income and
nonoperating revenues and expenses, discussed earlier.
CAPITAL ASSET AND DEBT ADMINISTRATIONCapital Assets
At the end of 2007, the Turnpike had approximately $449 million invested in capital assets. In 2007,the Turnpike capitalized approximately $1 million in construction projects, turnpike improvements andother monies spent from bond proceeds. The major construction projects involved widening the portionof I-70 between East Topeka and Lecompton to six lanes.
DebtAt the end of fiscal year 2007, the Turnpike had $246,380,000 of tax-exempt bonds outstanding.
Moody’s Investor Service has rated KTA bonds “Aaa” Insured/”A1” Underlying, and Standard & Poor’s hasrated the bonds “AAA” Insured/”A” Underlying.
Contacting the Turnpike’s Financial ManagementThis financial report is designed to provide our customers, suppliers, investors, and creditors with a
general overview of the Turnpike’s finances and of the Turnpike’s accountability for the money it receives.If you have questions about this report or need additional financial information, contact the Turnpike’sHeadquarters at 9401 E. Kellogg, Wichita, KS 67207.

18
Balance SheetsDecember 31, 2007 and 2006
ASSETS
2007 2006Current Assets
Cash and cash equivalents $ 35,781,134 $ 27,328,335Short-term investments 78,806,313 98,814,123Accounts receivable 800,145 773,419Accrued interest receivable 1,722,113 1,578,919Material and supply inventory 441,775 433,702Prepaid expense and other assets 765,187 1,260,390
Total current assets 118,316,667 130,188,888
Restricted AssetsCash and cash equivalents 40,658 2,591,484Investments 14,062,455 14,158,868Accrued interest receivable -- 5,489
Total restricted assets 14,103,113 16,755,841
Other Long-Term Investments 35,903,854 26,754,492
Capital AssetsCost of initial turnpike and improvements financed
with bond proceeds 448,823,108 447,974,637
Total assets $ 617,146,742 $ 621,673,858

Spanning the Future 19
Balance SheetsDecember 31, 2007 and 2006
LIABILITIES AND NET ASSETS
2007 2006Current Liabilities
Current maturities of long-term debt $ 9,520,000 $ 9,125,000Prepaid tolls 2,417,424 2,278,610Accounts payable 633,075 858,702Accrued expenses 3,912,159 4,735,757Accrued interest 3,568,974 3,699,391
Total current liabilities 20,051,632 20,697,460
Long-Term DebtTurnpike revenue bonds 236,860,000 246,380,000
Other Long-Term Liabilities 1,777,688 1,622,846
Total liabilities 258,689,320 268,700,306
Net AssetsInvested in capital assets, net of related debt 202,443,108 191,503,760Restricted – expendable for
Debt service 10,226,648 11,601,326Turnpike improvements -- 1,330,816
Unrestricted 145,787,666 148,537,650
Total net assets 358,457,422 352,973,552
Total liabilities and net assets $ 617,146,742 $ 621,673,858
The accompanying notes are an integral part of these financial statements.

20
Statements of Revenues, Expenses and Changes in Net AssetsYears Ended December 31, 2007 and 2006
2007 2006Operating Revenues
Tolls $ 78,195,540 $ 75,745,880Concessionaire rentals 3,103,710 2,987,601Miscellaneous 1,610,823 1,262,916
82,910,073 79,996,397
Operating ExpensesAdministration 6,548,399 6,281,659Insurance 7,677,844 6,422,266Toll collection 11,557,942 11,062,548Patrol 5,442,957 5,241,421Maintenance 8,986,183 7,814,559Cost of improvements, major repairs
and replacements 34,482,921 9,971,643
74,696,246 46,794,096
Operating Income 8,213,827 33,202,301
Nonoperating Revenues (Expenses)Investment revenue 8,681,873 8,124,447Interest on long-term debt (11,411,830) (11,878,320)
(2,729,957) (3,753,873)
Change in Net Assets 5,483,870 29,448,428
Net Assets, Beginning of Year 352,973,552 323,525,124
Net Assets, End of Year $ 358,457,422 $ 352,973,552
The accompanying notes are an integral part of these financial statements.

Spanning the Future 21
Statements of Cash FlowsYears Ended December 31, 2007 and 2006
2007 2006Operating Activities
Cash received from toll collections $ 78,274,806 $ 75,850,060Cash received from concessionaire rentals and miscellaneous 4,747,355 4,013,632Cash paid to suppliers and employees (74,137,622) (46,457,807)
Net cash flows from operating activities 8,884,539 33,405,885
Capital and Related Financing ActivitiesProceeds from issuance of long-term debt -- 12,690,000Interest paid (11,542,247) (12,192,916)Retirement of long-term debt (9,125,000) (20,830,000)Payments for capitalized costs (1,814,348) (37,861,637)
Net cash flows from capital and relatedfinancing activities (22,481,595) (58,194,553)
Investing ActivitiesInvestment revenue realized 6,770,952 5,869,842Proceeds from sale and maturities of investments 162,376,886 166,247,634Purchase of investments (149,648,809) (160,464,165)
Net cash flows from investing activities 19,499,029 11,653,311
Change in Cash and Cash Equivalents 5,901,973 (13,135,357)
Cash and Cash Equivalents, Beginning of Year 29,919,819 43,055,176
Cash and Cash Equivalents, End of Year $ 35,821,792 $ 29,919,819
Reconciliation of Net Operating Activities to Net Cash Flowsfrom Operating Activities
Operating income $ 8,213,827 $ 33,202,301Changes in operating assets and liabilities
Accounts receivable and prepaid tolls 112,088 (132,705)Material and supply inventory (8,073) (41,827)Accounts payable and accrued expenses 71,494 546,609Prepaid expenses and other assets 495,203 (168,493)
Net cash flows from operating activities $ 8,884,539 $ 33,405,885
The accompanying notes are an integral part of these financial statements.

22
Notes to Financial Statements
1. NATURE OF OPERATIONS AND SUMMARY OF SIGNIFICANT ACCOUNTING POLICIES
Nature of Turnpike – The Kansas Turnpike Authority (Turnpike) was created as a public corpo-ration in 1953 by the Kansas Legislature with power to construct, operate and maintain turnpikeprojects and to issue revenue bonds for any of its corporate purposes, payable solely from thetolls and revenue pledged for their payment.
The Kansas Turnpike Authority consists of five members, two appointed by the Governor, theSecretary of Transportation, the Chairperson of the Senate Committee on Transportation andUtilities and a member of the House of Representatives Committee on Transportation.
The Turnpike extends unsecured credit to certain K-TAG customers.
Basis of Accounting, Capitalized Costs and Depreciation – The Turnpike maintains its accountsin accordance with its interpretation of the Kansas statutes and the 1985 Trust Agreement, asamended. Capitalized costs include the cost of the initial turnpike and subsequent improvementsfinanced with bond proceeds. Capitalized costs include the cost of acquisition and construction,allocable expense in connection with bond offerings, premium or discount on sale of bonds andcertain legal and administrative expenses incurred during the construction period. However,other practices do not conform with generally accepted accounting principles, including: 1) costof major repairs, replacements and improvements not financed by bond proceeds are paid by thereplacement reserve fund and are not capitalized, 2) interest costs are not capitalized, 3) depre-ciation is not provided on capital assets, and 4) amortization is not applied to the other costs cap-italized. Otherwise, the financial statements of the Turnpike have been prepared on the accrualbasis of accounting using the economic resources measurement focus.
Operating Revenues and Expenses – The principal revenues of the Turnpike are toll revenuesreceived from customers. The Turnpike also recognizes as operating revenue rental fees receivedfrom concessionaires from operating leases on concession property, rental fees received fromright-of-way operating leases and other revenues earned related to the operation of theTurnpike, administrative expenses and Turnpike improvements not funded from bonds. All otherrevenues and expenses are reported as non-operating revenues and expenses. The Turnpike firstapplies restricted net assets when an expense or outlay is incurred for purposes for which bothrestricted and unrestricted net assets are available.
Use of Estimates – The preparation of financial statements in conformity with accounting prin-ciples generally accepted in the United States of America requires management to make esti-mates and assumptions that affect the reported amounts of assets and liabilities and disclosureof contingent assets and liabilities at the date of the financial statements and the reportedamounts of revenues and expenses during the reporting period. Actual results could differ fromthose estimates.
Investments and Investment Income – Investments are recorded at fair value. Fair value isdetermined using quoted market prices. Investment income includes dividend and interest

Spanning the Future 23
income and the net change for the year in the fair value. In accordance with the 1985 TrustAgreement, as amended, interest earned and profits realized from investments in all funds andaccounts, except the construction fund, are deposited in the revenue fund. Losses are chargedto the fund or account owning the investment.
Inventories – Material and supply inventory is valued at cost determined using the FIFO (first-in, first-out) method.
Prepaid Tolls – The Turnpike collects tolls in advance of actual usage for certain membersusing the K-TAG program. Customers are allowed a discount from normal toll rates if certain pre-paid balances are maintained. Prepaid amounts are recorded as a liability until such amounts arerealized through the usage of the turnpike by its customers.
Cash Equivalents – The Turnpike considers all liquid investments with original maturities ofthree months or less from the date of purchase to be cash equivalents. At December 31, 2007and 2006, cash equivalents consisted primarily of commercial paper, money market accountswith brokers and certain U.S. agency obligations.
Proprietary Activity Accounting – As permitted by Governmental Accounting Standards BoardStatement No. 20, the Turnpike has elected to apply only those applicable Financial AccountingStandards Board Statements and Interpretations issued prior to December 1, 1989.
Compensated Absences – The Turnpike policies allow full-time employees to earn vacation asfollows:
Length of Service Earnings Rate Allowed Vacation EarningsLess than 5 years 4 hours for each two-week period 13 days per year5 to 15 years 5 hours for each two-week period 16.25 days per year15 to 25 years 6 hours for each two-week period 19.5 days per yearGreater than 25 years 7 hours for each two-week period 22.75 days per year
The maximum number of vacation days, which may be accumulated as of the first day periodending January, is 30 days. This maximum is increased by five days for each five years of servicefor employees with lengths of service over 25 years.
Beginning December 20, 1996, the Turnpike discontinued the sick leave policy and createdpaid time off (PTO). Paid time off can be used at the employee’s discretion and is earned at therate of 2.5 hours (3.5 hours over 25 years) each two-week period. Once each calendar year, theemployee can choose to be paid for PTO over 40 hours. The accumulated sick leave balance priorto December 20, 1996, may still be taken after all PTO is used. Employees who have completedeight years of continuous full-time service will be paid 30% of the value of any unused sick leaveupon termination.
The Turnpike has recorded these liabilities using the pay rates in effect at the balance sheetdate plus an additional amount for compensation-related payments such as social security andMedicare taxes computed using rates in effect at that date. The estimated compensatedabsences liability expected to be paid more than one year after the balance sheet date is includ-ed in other long-term liabilities.

24
Net Assets – Net assets of the Turnpike are classified in three components. Net assets invest-ed in capital assets, net of related debt, consist of capital assets reduced by the outstanding bal-ances of borrowings that are attributable to the acquisition, construction or improvement ofthose assets. Restricted expendable net assets are non-capital assets, the use of which is limitedby external constraints imposed by creditors (such as through debt covenants), grantor or donors,including amounts deposited with trustees as required by bond indentures, reduced by the out-standing balances of any related borrowings. Unrestricted net assets are remaining assets lessremaining liabilities that do not meet the definition of invested in capital assets, net of relateddebt or restricted expendable net assets.
2. BUDGET PROCESS
Each year the Turnpike prepares a preliminary annual budget of operating expenses. Copiesare filed with the Trustee, Consulting Engineers and Principal Underwriters on or beforeNovember 1. Holders of 25% in the aggregate principal amount of bonds outstanding or a major-ity of the Principal Underwriters may request a public hearing. On or before December 1, theConsulting Engineers recommend the amount to be transferred to the replacement reserve fundfor major repairs and replacements. The budget is adopted on or before January 1. The Turnpikemay amend the budget at any time with the approval of the Consulting Engineers.
A comparison of actual expenses in the revenue fund and operations account with the budg-et for the year ended December 31, 2007, is as follows:
Over Budget Actual (Under)
Administration $ 6,680,200 $ 6,548,399 $ (131,801)Insurance 7,030,000 7,677,844 647,844Toll Collection 11,049,700 11,557,942 508,242Patrol 5,175,900 5,442,957 267,057Maintenance 9,153,500 8,986,183 (167,317)
$ 39,089,300 $ 40,213,325 $ 1,124,025
3. DEPOSITS, INVESTMENTS AND INVESTMENT INCOME
Deposits – Custodial credit risk is the risk that in the event of a bank failure, an entity’sdeposits may not be returned to it. The Turnpike’s deposit policy for custodial credit risk requirescompliance with the provisions of state law.
State law requires collateralization of all deposits with federal depository insurance; bondsand other obligations of the U.S. Treasury, U.S. agencies or instrumentalities or the state ofKansas; bonds of any city, county, school district or special road district of the state of Kansas;bonds of any state; or a surety bond having an aggregate value at least equal to the amount ofthe deposits.
At December 31, 2007 and 2006, $0 and $26,529 of the Turnpike’s bank balances of$7,112,490 and $7,218,763, respectively, were exposed to custodial credit risk since they wereuninsured and uncollateralized.

Spanning the Future 25
Investments – The Turnpike may legally invest in direct obligations of and other obligationsguaranteed as to principal by the U.S. Treasury and U.S. agencies and instrumentalities, bankrepurchase agreements, money market funds, commercial paper and municipal obligations.
At December 31, 2007, the Turnpike had the following investments and maturities:
Maturities in Years
More thanType Fair Value Less than 1 1 – 5 6 – 10 10
U.S. Treasuryobligations $ 11,142,454 $ -- $ 7,239,354 $ -- $ 3,903,100
U.S. agencyobligations 117,630,168 85,629,414 32,000,754 -- --
Money marketmutual funds 27,152,600 27,152,600 -- -- --
Commercial paperobligations 1,056,740 1,056,740 -- -- --
156,981,962 $ 113,838,754 $ 39,240,108 $ -- $ 3,903,100Less cashequivalents (28,209,340)
Investments perthe balance sheet $ 128,772,622
Interest Rate Risk – As a means of limiting its exposure to fair value losses arising from risinginterest rates, the Turnpike’s investment policy limits investments in mortgage backed securityissuers with remaining maturities not exceeding three years, commercial paper which matures nomore than 270 days after the date of purchase and U.S. dollar denominated deposit accountsmaturing no more than 360 days after purchase.
Credit Risk – Credit risk is the risk that the issuer or other counterparty to an investment willnot fulfill its obligations. It is the Turnpike’s policy to limit its investments in securities to the toptwo ratings issued by nationally recognized statistical rating organizations (NRSROs). AtDecember 31, 2007 and 2006, the Turnpike’s investments in U.S. agency obligations not directlyguaranteed by the U.S. government were rated AAA by Standard & Poor’s and Aaa by Moody’sInvestors Services and its investments in commercial paper obligations were rated A-1+ byStandard & Poor’s.
Concentration of Credit Risk – The Turnpike places no limit on the amount that may be invest-ed in any one issuer. At December 31, 2007 and 2006, the Turnpike’s investment in Federal HomeLoan Mortgage Corporation constituted 24.8% and 28.8% of total investments and, investmentsin Federal National Mortgage Association constituted 49.6% and 47.6%, respectively of its totalinvestments.

26
Summary of Carrying Values – The carrying values of deposits and investments shown aboveare included in the balance sheet as follows:
2007 2006Carrying Value:
Deposits $ 7,612,452 $ 7,950,980Investments 156,981,962 161,696,322
$ 164,594,414 $ 169,647,302
Included in the following balance sheet captions:Cash and cash equivalents $ 35,781,134 $ 27,328,335Short-term investments 78,806,313 98,814,123Restricted cash and cash equivalents 40,658 2,591,484Restricted investments 14,062,455 14,158,868Other long-term investments 35,903,854 26,754,492
$ 164,594,414 $ 169,647,302
Investment Income – Investment income for the year ended December 31, consisted of:
2007 2006
Interest and dividend income $ 8,416,702 $ 7,544,851Net change in fair value of investments 265,171 579,596
$ 8,681,873 $ 8,124,447
4. CAPITAL ASSETS
Capital assets activity for the years ended December 31, 2007 and 2006, was:
December 31, December 31, 2006 Additions Disposals Transfers 2007
Cost of initialTurnpike andimprovementsfinanced withbond proceeds $ 447,974,637 $ 848,471 $ -- $ -- $ 448,823,108
December 31, December 31,2005 Additions Disposals Transfers 2006
Cost of initialTurnpike andimprovementsfinanced withbond proceeds $ 411,268,520 $ 36,706,117 $ -- $ -- $ 447,974,637

Spanning the Future 27
5. ACCOUNTS PAYABLE AND ACCRUED EXPENSES
Accounts payable and accrued expenses in current liabilities at December 31, consisted of:
2007 2006
Payable to suppliers $ 633,075 $ 858,702Contracts payable and retained amounts 591,995 1,511,293Payable to employees (including payroll
taxes and benefits) 2,495,164 2,474,464Estimated self-insurance costs 825,000 750,000
$ 4,545,234 $ 5,594,459
6. LONG-TERM OBLIGATIONS
The following is a summary of long-term obligation transactions for the Turnpike for the yearsended December 31, 2007 and 2006:
December 31, December 31, Current2006 Additions Deductions 2007 Portion
Long-term debtRevenue bonds $ 255,505,000 $ -- $ 9,125,000 $ 246,380,000 $ 9,520,000
Other long-termliabilitiesAccrued
compensatedabsences 3,322,846 1,777,388 1,660,546 3,439,688 1,662,000
Total long-termobligations $ 258,827,846 $ 1,777,388 $10,785,546 $ 249,819,688 $ 11,182,000
December 31, December 31, Current2005 Additions Deductions 2006 Portion
Long-term debtRevenue bonds $ 263,645,000 $ 12,690,000 $20,830,000 $ 255,505,000 $ 9,125,000
Other long-termliabilitiesAccruedcompensated
absences 3,225,685 1,734,769 1,637,608 3,322,846 1,700,000
Total long-termobligations $ 266,870,685 $ 14,424,769 $22,467,608 $ 258,827,846 $ 10,825,000

28
7. REVENUE BONDS PAYABLE
At December 31, 2007 and 2006, Turnpike revenue bonds payable were as follows:
2007 2006Series 1993 $ 5,180,000 $ 5,180,000Series 1998 -- 3,675,000Series 2002 80,020,000 82,120,000Series 2003A 97,155,000 100,505,000Series 2004 51,335,000 51,335,000Series 2006A 12,690,000 12,690,000
$ 246,380,000 $ 255,505,000
Interest rates on the bonds vary between 2.00% and 5.55%. The debt service requirementsas of December 31, 2007, are as follows:
Total to beYear Ending December 31, Paid Principal Interest
2008 $ 21,039,206 $ 9,520,000 $ 11,519,2062009 21,034,192 9,950,000 11,084,1922010 21,037,841 10,335,000 10,702,8412011 21,040,791 10,805,000 10,235,7912012 21,037,657 11,340,000 9,697,6572013 – 2017 105,195,412 64,865,000 40,330,4122018 – 2022 82,185,460 57,360,000 24,825,4602023 – 2027 58,041,960 45,100,000 12,941,9602028 – 2032 23,046,190 18,480,000 4,566,1902033 – 2036 9,219,140 8,625,000 594,140
$ 382,877,849 $ 246,380,000 $ 136,497,849
Bonds subject to redemption prior to maturity at the Turnpike’s option are as follows:
Callable on or After Call Price
Series 2002 September 1, 2012 At 101% of parSeptember 1, 2013 At par
Series 2003A September 1, 2013 At par
Series 2004A-1 September 1, 2014 At par
Series 2004A-2 September 1, 2014 At 101% of parSeptember 1, 2015 At 100.50% of parSeptember 1, 2016 At par
In October 2006, the Turnpike issued $12,690,000 in Series 2006A Turnpike RefundingRevenues Bonds with a net interest cost of 3.45% to currently refund Series 1999 Revenue Bondswhich had interest rates ranging from 4.10% to 4.75%. The refunding increased the total debt

Spanning the Future 29
service payments over the next 14 years by $3,779,885, and resulted in an economic loss of$746,500. As a result of the refunding, the refunded bonds are considered to be defeased andhave been removed from long-term debt. The bonds are considered auction rate securities, withvariable interest rates established at each “auction period”, which is weekly for these bonds. Themaximum interest rate allowed under current Kansas law is the daily yield for 10-year treasurybonds published on the Monday preceding each auction date, plus 3%.
On February 15, 2008, the Turnpike experienced a failed auction. This resulted in the Series2006A bonds being subject to the maximum interest rate, which was 6.616% at that time. Dueto this increase in interest rate, on February 21, 2008 the Turnpike issued a Material Event Noticeindicating its intent to purchase the bonds in the secondary market from any bond owner. OnFebruary 22, 2008, the Turnpike gave notice of the exercise of its option to call all $12,690,000of the Series 2006A bonds, for redemption and payment on March 24, 2008, at a redemptionprice of 100% of the principal amount thereof, plus accrued interest.
8. DEFINED BENEFIT PENSION PLAN
The Turnpike participates in the Kansas Public Employees Retirement System (KPERS) which isa cost-sharing multiple-employer defined benefit pension plan administered by the KPERS Boardof Trustees. The plan provides retirement, life insurance, disability income and death benefitswhich are established and may be changed by the Kansas Legislature with the concurrence of theGovernor. KPERS issues a publicly available financial report that includes financial statementsand required supplementary information. That report may be obtained by writing to KPERS at611 South Kansas Avenue, Suite 100, Topeka, Kansas 66603-3803, or by calling KPERS at 1-888-275-5737.
Contribution requirements are established and may be changed by the Kansas Legislaturewith the concurrence of the Governor. Plan members of KPERS are required to contribute 4% oftheir annual covered salary and the Turnpike is required to contribute at an actuarially deter-mined rate. The employer contribution rates for KPERS for 2007, 2006 and 2005 were 4.31%,3.81%, 3.41%, respectively. The Turnpike’s contributions to KPERS for 2007, 2006 and 2005 were$827,425, $706,333, and $624,319, respectively, and were equal to the required contributions foreach year.
9. CONTINGENCIES
The Turnpike records liabilities resulting from claim and legal action only when it is probablethat a liability has been incurred and the amount can be reasonably estimated. Various legalactions, primarily due to automobile accidents, are pending against the Turnpike. These claimsare generally covered by insurance. No amount has been recorded as a liability for contingenciesat December 31, 2007 and 2006.
10. RISK MANAGEMENT
The Turnpike is exposed to various risks of loss related to torts; theft of, damage to anddestruction of assets; business interruption; errors and omissions; employee injuries and illness-es; natural disasters; and employee health, dental and accident benefits. Commercial insurance

30
coverage is purchased for claims arising from such matters other than those related to worker’scompensation and employee health benefits. Settled claims have not exceeded such commercialcoverage during the past three years.
Liabilities include an accrual for claims that have been incurred but not reported. Claims lia-bilities are reevaluated periodically to take into consideration recently settled claims, frequencyof claims and other economic and social factors.
Changes in the balance of claims liabilities during 2007 and 2006 are summarized as follows:
2007 2006
Balance, beginning of year $ 750,000 $ 750,000Current year claims and changes in estimates 5,730,980 4,683,327Claim payments (5,655,980) (4,683,327)
Balance, end of year $ 825,000 $ 750,000
Employees who have reached age 59 and choose to retire early will continue to receive thesame Kansas Turnpike Authority standard insurance plan paid by the Turnpike to age 65, provid-ing they meet certain longevity requirements. The Turnpike is liable for the health insuranceclaims of 10 early retirees at December 31, 2007. Medical claims attributable to the retirees arefunded on a pay-as-you-go basis.
11. OPERATING LEASES
The Turnpike has entered into several leasing agreements with service stations, restaurantsand communications companies along the turnpike. The future minimum rental income on theseleases are as follows:
2008 $ 3,156,9542009 2,999,2782010 3,015,3262011 2,929,1412012 2,920,643
2013 – 2015 758,153
Total $ 15,779,495
The leases generally have terms of five years, 10.5 years or 12 years. The five-year service sta-tion leases have one five-year renewal option. The five-year restaurant leases have up to threefive-year renewal options. Both restaurant and service station leases with 10.5 years have norenewal options, and the 12-year leases have two five-year renewal options if mutually agreedupon by the Turnpike and lessee. All leases are anticipated to renew at a time of expiration or beleased to other parties. The Turnpike is reimbursed for all utility payments and the lessee isresponsible for insurance expenses associated with the properties. In one instance, the Turnpikehas agreed to have the lessee construct new buildings. If, at the conclusion of the lease, the les-

Spanning the Future 31
see is not successful in the bidding for a new lease, the Turnpike is committed to reimburse thelessee for certain costs of construction, net of depreciation, of approximately $285,000. Theservice station and restaurant leases have base rents and contingent rental payments based onthe gallons of gasoline sold or gross sales for the restaurant.
The lease agreements with communications companies are to operate communication sys-tems within the Turnpike right-of-way. The leases generally have terms of five years or ten years.The five-year leases have anywhere from four to nine five-year renewal options. The Turnpikedoes not incur any significant costs associated with the maintenance of the communications sys-tems and upon termination of the leases, the communication systems become the property ofthe Turnpike.
12. COMMITMENTS
The Turnpike has committed to construction contracts for turnpike repair and improvementsvalued at approximately $25 million at December 31, 2007.
The Turnpike has an agreement with the Kansas Highway Patrol (Patrol), whereby the Patrolagrees to provide adequate policing and patrolling of the Kansas Turnpike and its facilities. Thetotal cost of policing the Kansas Turnpike and its facilities is paid by the Turnpike, includingsalaries and benefits, and the cost of uniforms, equipment and other expenses. The Turnpikealso reimburses the Patrol for certain training costs related to increases in the number of troopsprovided by the Patrol to the Turnpike.
13. PENDING GOVERNMENTAL ACCOUNTING STANDARDS
The effect on the Turnpike’s financial statements of the following statements issued, but notyet adopted, has not yet been determined.
GASB Statement No. 45, Accounting and Financial Reporting by Employers for Post-employ-ment Benefits Other than Pensions, was issued in June 2004. This statement provides guidanceon the accounting and reporting by employers for the costs and obligations of post-employmenthealthcare and other non-pension benefits provided to employees as part of their compensationof services. The provisions of this statement are effective for the Turnpike’s fiscal year endingDecember 31, 2008.
32
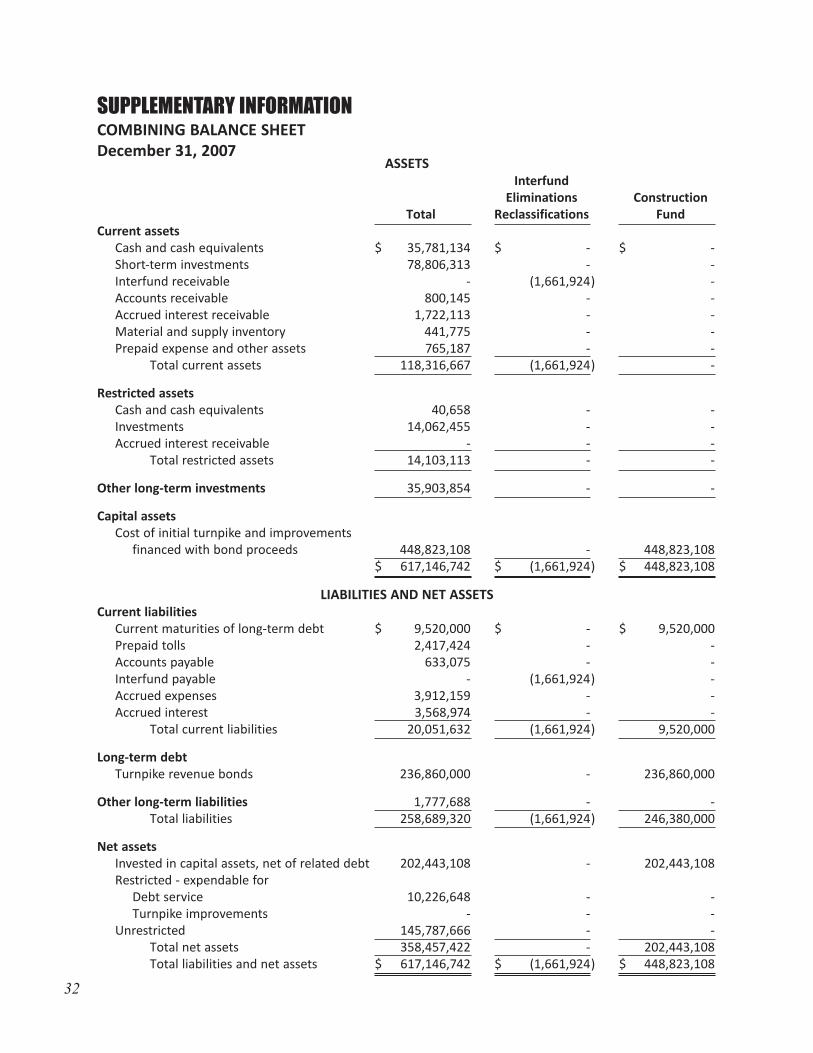
SUPPLEMENTARY INFORMATIONCOMBINING BALANCE SHEETDecember 31, 2007
ASSETSInterfund
Eliminations ConstructionTotal Reclassifications Fund
Current assetsCash and cash equivalents $ 35,781,134 $ - $ - Short-term investments 78,806,313 - - Interfund receivable - (1,661,924) - Accounts receivable 800,145 - - Accrued interest receivable 1,722,113 - - Material and supply inventory 441,775 - - Prepaid expense and other assets 765,187 - -
Total current assets 118,316,667 (1,661,924) -
Restricted assetsCash and cash equivalents 40,658 - - Investments 14,062,455 - - Accrued interest receivable - - -
Total restricted assets 14,103,113 - -
Other long-term investments 35,903,854 - -
Capital assetsCost of initial turnpike and improvements
financed with bond proceeds 448,823,108 - 448,823,108 $ 617,146,742 $ (1,661,924) $ 448,823,108
LIABILITIES AND NET ASSETSCurrent liabilities
Current maturities of long-term debt $ 9,520,000 $ - $ 9,520,000 Prepaid tolls 2,417,424 - - Accounts payable 633,075 - - Interfund payable - (1,661,924) - Accrued expenses 3,912,159 - - Accrued interest 3,568,974 - -
Total current liabilities 20,051,632 (1,661,924) 9,520,000
Long-term debtTurnpike revenue bonds 236,860,000 - 236,860,000
Other long-term liabilities 1,777,688 - - Total liabilities 258,689,320 (1,661,924) 246,380,000
Net assetsInvested in capital assets, net of related debt 202,443,108 - 202,443,108 Restricted - expendable for
Debt service 10,226,648 - - Turnpike improvements - - -
Unrestricted 145,787,666 - - Total net assets 358,457,422 - 202,443,108 Total liabilities and net assets $ 617,146,742 $ (1,661,924) $ 448,823,108

Spanning the Future 33
SUPPLEMENTARY INFORMATIONCOMBINING BALANCE SHEETDecember 31, 2007
ASSETSRevenue Fund
And Operations Debt Service Debt Service Replacement GeneralFund Fund Reserve Fund Reserve Fund Fund
$ 12,775,109 $ - $ - $ 11,087,175 $ 11,918,850 6,474,409 - - 60,029,437 12,302,467 1,661,924 - - - -
800,145 - - - - 1,460,357 - - 214,944 46,812
441,775 - - - - 765,187 - - - -
24,378,906 - - 71,331,556 24,268,129
- 37,030 3,628 - - - 6,823,101 7,239,354 - - - - - - - - 6,860,131 7,242,982 - -
2,009,036 - - 19,952,648 13,942,170
- - - - - $ 26,387,942 $ 6,860,131 $ 7,242,982 $ 91,284,204 $ 38,210,299
LIABILITIES AND NET ASSETS
$ - $ - $ - $ - $ - 2,417,424 - - - -
633,075 - - - - - 95,715 211,776 1,122,813 231,620
3,320,164 - - 591,995 - - 3,568,974 - - -
6,370,663 3,664,689 211,776 1,714,808 231,620
- - - - -
1,777,688 - - - - 8,148,351 3,664,689 211,776 1,714,808 231,620
- - - - -
- 3,195,442 7,031,206 - - - - - - -
18,239,591 - - 89,569,396 37,978,679 18,239,591 3,195,442 7,031,206 89,569,396 7,978,679
$ 26,387,942 $ 6,860,131 $ 7,242,982 $ 91,284,204 $ 38,210,299

34
COMBINING STATEMENT OF REVENUES, EXPENSES AND CHANGES IN NET ASSETSYear Ended December 31, 2007
Revenue FundConstruction And Operations
Total Fund FundOperating Revenues
Tolls $ 78,195,540 $ - $ 78,195,540 Concessionaire rentals 3,103,710 - 3,103,710 Miscellaneous 1,610,823 - 1,610,823
82,910,073 - 82,910,073
Operating ExpensesAdministration 6,548,399 - 6,548,399 Insurance 7,677,844 - 7,677,844 Toll collection 11,557,942 - 11,557,942 Patrol 5,442,957 - 5,442,957 Maintenance 8,986,183 - 8,986,183 Cost of improvements, major repairs and
replacements 34,482,921 - - 74,696,246 - 40,213,325
Operating Income (Loss) 8,213,827 - 42,696,748
Nonoperating revenues (expenses)Transfers between funds - 9,601,872 (52,342,471)Investment revenue 8,681,873 6,660 8,714,766 Interest on long-term debt (11,411,830) - -
(2,729,957) 9,608,532 (43,627,705)
Change in net assets 5,483,870 9,608,532 (930,957)
Net assets, beginning of year 352,973,552 192,834,576 19,170,548
Net assets, end of year $ 358,457,422 $ 202,443,108 $ 18,239,591

Spanning the Future 35
COMBINING STATEMENT OF REVENUES, EXPENSES AND CHANGES IN NET ASSETSYear Ended December 31, 2007
Debt Service Debt Service Replacement GeneralFund Reserve Fund Reserve Fund Fund
$ - $ - $ - $ - - - - - - - - - - - - -
- - - - - - - - - - - - - - - - - - - -
- - 34,482,921 - - - 34,482,921 -
- - (34,482,921) -
11,424,423 (1,387,271) 19,519,913 13,183,534 - - (37,835) (1,718)
(11,411,830) - - - 12,593 (1,387,271) 19,482,078 13,181,816
12,593 (1,387,271) (15,000,843) 13,181,816
3,182,849 8,418,477 104,570,239 24,796,863
$ 3,195,442 $ 7,031,206 $ 89,569,396 37,978,679

36
SUMMARY OF TOLL REVENUESYear Ended December 31, 2007
Class Toll Revenue Vehicles
2-axle vehicles $ 46,564,740 28,689,2203-axle vehicles 1,356,232 511,733 4-axle vehicles 2,666,620 583,719 5-axle vehicles 25,057,691 3,184,508 6-axle vehicles 1,266,728 109,914 7-axle vehicles 911,809 37,354 8-axle vehicles 826,108 27,178 9-axle vehicles 487,452 13,883 Discounts and Adjustments (941,840) 338,376
$ 78,195,540 33,495,885

Spanning the Future 37
STATISTICAL DATAOPERATING SUMMARIES - VEHICLES, MILEAGE AND REVENUEYears Ended December 31, 2007 and 2006 (Unaudited)
2007 Increase(Decrease) as a
2007 2006 Percent of 2006Number of Vehicles:
Passenger Cars 28,689,220 28,297,667 1.38%Commercial vehicles 4,468,289 4,458,265 0.22%Discounts and adjustments 338,376 366,477 -7.67%
Total 33,495,885 33,122,409 1.13%
Percentage of Vehicles:Passenger cars 85.65% 85.43% 0.25%Commercial vehicles 13.34% 13.46% -0.89%
Number of Miles:Passenger cars 1,138,780,003 1,138,192,093 0.05%Commercial vehicles 281,288,801 277,008,048 1.55%
Total 1,420,068,804 1,415,200,141 0.34%
Percentage of Miles:Passenger cars 80.19% 80.43% -0.29%Commercial vehicles 19.81% 19.57% 1.20%
Toll Revenue (Gross):Passenger cars $ 46,564,740 $ 45,388,097 2.59%Commercial vehicles 32,572,640 31,236,478 4.28%Discounts and adjustments (941,840) (878,695) 7.19%
Total $ 78,195,540 $ 75,745,880 3.23%
Percentage of Toll Revenue:Passenger cars 59.55% 59.92% -0.62%Commercial vehicles 41.66% 41.24% 1.01%
Miles Per Trip:Passenger cars 39.69 40.22 -1.31%Commercial vehicles 62.95 62.13 1.32%
Revenue Per Trip:Passenger cars $ 1.62 $ 1.60 1.19%Commercial Vehicles $ 7.29 $ 7.01 4.04%
Revenue Per Mile:Passenger Cars $ 0.04089 $ 0.03988 2.54%Commercial vehicles $ 0.11580 $ 0.11276 2.69%Discounts and adjustments $ (0.00066) $ (0.00062) 6.82%

38
SCHEDULE OF SERVICE AREA TRAFFIC AND SALESYears Ended December 31, 2007 and 2006(Unaudited)
2007 Per Vehicle Passing AreaVehicles Gallons Motor Restaurant Gallons Motor Restaurant
Service Area Passing Area Fuel Sold Gross Sales Fuel Sales
Belle Plaine 6,802,645 6,135,395 $ 2,838,337 0.90 $ 0.42 Towanda 4,682,327 4,346,122 1,505,244 0.93 $ 0.32 Matfield Green 4,607,792 5,239,285 2,114,103 1.14 $ 0.46 Emporia 2,358,439 3,323,744 1,336,989 1.41 $ 0.57 Topeka 12,874,147 6,886,880 2,676,708 0.53 $ 0.21 Lawrence 10,859,996 4,856,629 3,499,269 0.45 $ 0.32
42,185,346 30,788,055 $ 13,970,650
2006
Belle Plaine 6,785,831 5,679,719 $ 2,726,070 0.84 $ 0.40 Towanda 4,701,604 4,081,967 1,489,934 0.87 $ 0.32 Matfield Green 4,690,745 4,606,464 2,034,667 0.98 $ 0.43 Emporia 2,379,386 3,018,160 1,318,265 1.27 $ 0.55 Topeka 12,677,102 5,999,416 2,531,110 0.47 $ 0.20 Lawrence 10,658,512 4,845,874 3,412,054 0.45 $ 0.32
41,893,180 28,231,600 $ 13,512,100

Spanning the Future 39
SCHEDULE OF ACTIVITY BY INTERCHANGEYears Ended December 31, 2007 and 2006(Unaudited)
Interchange 2007 2006Percent
Entering Exiting Total Entering Exiting Total IncreaseNo. Location Vehicles Vehicles Vehicles Vehicles Vehicles Vehicles (Decrease)
004 Southern Terminal 2,688,675 2,811,835 5,500,510 2,689,377 2,829,959 5,519,336 -0.34%019 Wellington: US 160 776,337 747,750 1,524,087 761,505 723,736 1,485,241 2.62%033 Mulvane: K-53 590,766 538,122 1,128,888 570,260 524,448 1,094,708 3.12%039 Haysville-Derby: 71st St. 809,589 801,674 1,611,263 803,994 810,283 1,614,277 -0.19%042 Wichita: I-135, I-235, 47th St. 3,397,582 3,426,777 6,824,359 3,382,778 3,383,389 6,766,167 0.86%045 Wichita: K-15 823,173 894,316 1,717,489 811,839 879,946 1,691,785 1.52%050 Wichita: US 54/400, Kellogg Ave. 1,502,200 1,546,362 3,048,562 1,533,239 1,569,378 3,102,617 -1.74%053 Wichita: K-96 910,602 878,956 1,789,558 845,365 823,711 1,669,076 7.22%057 Andover: 21st St. 459,861 439,616 899,477 449,472 426,865 876,337 2.64%071 El Dorado: US 254 1,032,361 1,007,315 2,039,676 1,024,755 999,460 2,024,215 0.76%076 El Dorado: US 77 208,185 195,470 403,655 178,409 174,635 353,044 14.34%092 Cassoday: K-177 100,997 104,377 205,374 111,329 114,547 225,876 -9.08%127 Emporia: I-35N 1,979,198 1,883,505 3,862,703 2,035,790 1,921,199 3,956,989 -2.38%147 Council Grove, Osage City: US 56 126,920 127,291 254,211 128,256 128,241 256,497 -0.89%177 Topeka: I-470W, US 75, Top. Blvd. 2,371,536 2,402,809 4,774,345 2,410,221 2,414,793 4,825,014 -1.05%182 Topeka: Valley Falls: K-4/I-70W 514,223 451,352 965,575 504,211 447,453 951,664 1.46%183 Topeka: I-70 4,530,665 4,582,278 9,112,943 4,421,833 4,491,812 8,913,645 2.24%197 Lecompton, Lawrence: K-10 1,611,494 1,606,320 3,217,814 1,519,929 1,510,042 3,029,971 6.20%202 Lawrence: US 59, S. Iowa St. 1,909,981 1,817,656 3,727,637 1,907,059 1,830,690 3,737,749 -0.27%204 Lawrence: US 59, US40 1,255,698 1,306,874 2,562,572 1,201,932 1,240,422 2,442,354 4.92%224 Bonner Springs 207,772 173,245 381,017 200,802 178,720 379,522 0.39%236 Eastern Terminal 5,207,782 5,271,697 10,479,479 5,105,505 5,174,131 10,279,636 1.94%

40
SCHEDULE OF MONTHLY VEHICLES, MILEAGE AND TOLL REVENUEYear Ended December 31, 2007(Unaudited)
Average AverageGross Revenue Miles Revenue
Per PerMonth Vehicles Mileage Passenger Commercial Vehicle Vehicle
January 2,369,773 98,923,528 $ 3,076,042 $ 2,531,158 41.74 $ 2.37 February 2,302,989 95,748,632 3,021,568 2,328,566 41.58 2.32 March 2,861,796 123,846,824 3,968,718 2,744,533 43.28 2.35 April 2,732,425 115,185,936 3,678,039 2,606,365 42.16 2.30 May 2,926,997 124,940,403 4,013,311 2,717,922 42.69 2.30 June 2,917,401 126,247,442 4,046,563 2,728,707 43.27 2.32 July 2,990,234 130,835,571 4,440,535 2,845,859 43.75 2.44 August 3,010,125 128,587,968 4,297,593 3,037,783 42.72 2.44 September 2,808,902 119,189,281 4,000,992 2,766,173 42.43 2.41 October 2,915,082 122,897,756 4,082,999 3,020,310 42.16 2.44 November 2,849,900 124,894,802 4,262,439 2,728,969 43.82 2.45 December 2,471,885 108,770,661 3,675,941 2,516,295 44.00 2.51
33,157,509 1,420,068,804 $ 46,564,740 $ 32,572,640 42.83 $ 2.39
Total Gross Toll Revenue $ 79,137,380
Discounts and Adjustments (941,840)
Total Adjusted Revenue $ 78,195,540

236
204
202
197
183
182
177
147
127
92
76
Spanning the Future 41
SUMMARY OF TURNPIKE TRAFFICYear Ended December 31, 2007(Unaudited)
Turnpike K-TAG2007 2006 2007 2006
Vehicles 33,157,509 32,755,932 13,506,274 12,851,109Passenger 28,689,220 28,297,667 11,531,120 10,879,007Commercial 4,468,289 4,458,265 1,975,154 1,972,102
Miles Traveled 1,420,068,804 1,415,200,141 478,661,008 452,695,681Passenger 1,138,780,003 1,138,192,093 361,355,901 338,966,436Commercial 281,288,801 277,008,048 117,305,107 113,729,245
Toll Revenue 79,137,380 76,624,575 29,804,598 27,877,277Passenger 46,564,740 45,388,097 15,089,293 13,835,034Commercial 32,572,640 31,236,478 14,715,305 14,042,243
Average Toll $ 2.39 $ 2.34 $ 2.21 $ 2.17Passenger $ 1.62 $ 1.60 $ 1.31 $ 1.27Commercial $ 7.29 $ 7.01 $ 7.45 $ 7.12
Average Trip Miles 43 43 35 35Passenger 40 40 31 31Commercial 63 62 59 58
SUMMARY OF AVERAGE DAILY TRAFFIC BETWEEN INTERCHANGESYear Ended December 31, 2007 (Unaudited)
Southbound Northbound Southbound Northbound
14,836 14,917
15,002 15,222
14,531 14,498
17,659 17,613
5,133 5,228
6,540 6,463
3,404 3,412
3,226 3,235
6,438 6,186
6,514 6,271
76
71
57
53
50
45
42
39
33
19
4
6,574 6,296
6,588 6,241
6,786 6,384
7,446 6,957
7,833 7,464
6,412 6,239
11,873 11,780
10,359 10,244
9,448 9,189
7,704 7,366