2006 men’s ncaa basketball tournamenteuler.slu.edu/~clair/pools/ncaa2006.pdf · 2006 men’s ncaa...
TRANSCRIPT

2006 Men’s NCAA Basketball Tournament
Bryan Clair and David Letscher
June 5, 2006

Chapter 1
Introduction
This report concerns the 2006 Men’s NCAA Division I Basketball Tournament. We (theauthors) applied techniques of our paper “Optimal Strategies for Sports Betting Pools”(Clair-Letscher, 2005).
We entered three large online pools: ESPN’s Tournament Challenge, Yahoo’s Tourna-ment Pick’em and CBS Sportsline Bracket Challenge. The pools are free. ESPN scoring is10,20,40,80,120,160. Yahoo and CBS scoring is 1,2,4,8,16,32.
After the winners were announced, ESPN reported “more than 3,000,000” entries. Theactual number of competitors in the Yahoo and CBS pools were never published, but fromthe percentile rankings of our scores along the way, we estimated 1.2 million for Yahoo and300,000 for CBS. We also estimated 2.6 million entries for ESPN, a bit below their reportedfigure.
For inputs to our algorithms, we require pool data and actual data. The pool data camefrom Yahoo. For actual data, we used computer rankings by Jeff Sagarin (www.usatoday.com/sports/sagarin.htm) and by David Letscher (dehn.slu.edu/sports). We also used past resultsof seed-vs-seed matchups from NCAA history.
This year, we were invited to write an article for the New York Times sports section.The article appeared Monday, March 13, the day after “Selection Sunday”. Because of thisand other news coverage, many players used our published picks in their pools. The websitewith our picks received approximately 50,000 hits in the days before the tournament began.From a sample of public picks used in ESPN, we found quite a few players chose our exactpicks in the ESPN pool. This has a large negative impact on the quality of these picks insuch pools.
This year the tournament featured a number of striking upsets (see Figure 1.1). Inparticular, heavy favorites Duke and Connecticut failed to reach the final four, making itan ideal year for a contrarian strategy. Our computer generated picks had excellent results.We heard back from about a dozen people who won their pools using our publicly availablepicks (shown in Chapter 3). All of these reports were from people entered in 20-50 personpools.
1

Figure 1.1: 2006 Tournament results
15 Belmont
2 UCLA
10 Alabama
7 Marquette
14 Xavier
3 Gonzaga
11 S Diego St
6 Indiana
13 Bradley
4 Kansas
12 Kent St.
5 Pittsburgh
9 Bucknell
8 Arkansas
16 O Roberts
1 Memphis
15 Penn
2 Texas
10 N.C. St
7 California
14 NW St.
3 Iowa
11 South. Ill.
6 W. Virginia
13 Iona
4 LSU
12 Tx A&M
5 Syracuse
9 NC Wilm
8 G Wash
16 Southern
1 Duke
15 Davidson
2 Ohio St.
10 N. Iowa
7 Georgetown14 S. Alabama
3 Florida
11 UW Milw.
6 Oklahoma
13 Pacific
4 Boston Coll.
12 Montana
5 Nevada
9 Wisconsin
8 Arizona
16 Monmouth
1 Villanova
15 Winthrop2 Tennessee
10 Seton Hall
7 Wichita St.
14 Murray St.3 N Carolina
11 G Mason
6 Mich St.
13 Air Force
4 Illinois
12 Utah St.
5 Washington9 UAB
8 Kentucky
16 Albany1 Connecticut
2 UCLA
10 Alabama
3 Gonzaga
6 Indiana
13 Bradley
5 Pittsburgh
9 Bucknell
1 Memphis
2 Texas
10 N.C. St
14 NW St.
6 W. Virginia
4 LSU
12 Tx A&M
8 G Wash
1 Duke
2 Ohio St.
7 Georgetown
3 Florida
11 UW Milw.
4 Boston Coll.
12 Montana
8 Arizona
1 Villanova
2 Tennessee
7 Wichita St.
3 N Carolina
11 G Mason
4 Illinois
5 Washington
8 Kentucky
1 Connecticut
2 UCLA
3 Gonzaga
13 Bradley
1 Memphis
2 Texas
6 W. Virginia
4 LSU
1 Duke
7 Georgetown
3 Florida
4 Boston Coll.
1 Villanova
7 Wichita St.
11 G Mason
5 Washington
1 Connecticut
2 UCLA
1 Memphis
2 Texas
4 LSU
3 Florida
1 Villanova
11 G Mason
1 Connecticut
2 UCLA
4 LSU
3 Florida
11 G Mason
3 Florida
2 UCLA
3 Florida
2

Chapter 2
Opponent Perceptions
We had data available from Yahoo, which published the percentage of players picking eachteam to reach each round, P (i → r), for all i and r (see Table 2.3). Our values weretaken on Wednesday, March 15 at 9:30pm. All perceived values in this report use Yahoo’sround-by-round pick data.
Also available was ESPN’s “National Bracket” which is somehow a consensus bracketbased on player picks, and most likely reperesents simply a selection of 63 head-to-headprobabilities. We did not use the ESPN information.
To compute means, sd’s and covariances, P (i → r) is enough for all but the opponentscore sd. For this, we computed approximate head-to-head perceived probabilites for eachpair of teams. We used the formula:
P (i beats j) =12
+12
(P (i→ r)
P (i→ r − 1)− P (j → r)
P (j → r − 1)
)(2.1)
for teams i and j which meet in round r. Note that this gives the known correct value forteams that meet in round 1.
We also show, in Tables 2.1 and 2.2, some statistics on opponent scores as predicted byour model with various choices for actual probabilities.
Table 2.1: Opponent Statistics, ESPN ScoringLetscher Sagarin History
opponent score mean 608.95 637.86 665.90oppenent score s.d. 177.07 189.18 177.21correlation between 2 opponents 0.402 0.407 0.356
3

Table 2.2: Opponent Statistics, Yahoo ScoringLetscher Sagarin History
opponent score mean 63.69 67.61 69.65oppenent score s.d. 22.21 24.27 22.41correlation between 2 opponents 0.370 0.368 0.335
Table 2.3: % of Players picking teams in each round, 2006 Yahoo Pick’em
First Round Sweet 16 Elite 8 Final Four Semis Champ
1 Connecticut 97.7 94.4 85.1 68.2 54.3 36.31 Duke 99.7 97.4 85.5 70.5 57.0 26.61 Villanova 97.6 90.6 50.5 36.3 14.7 8.73 N. Carolina 97.1 75.2 66.2 18.5 9.5 4.12 Texas 98.3 88.5 62.4 17.0 11.2 3.44 Boston Coll. 94.5 84.7 43.2 30.8 7.5 3.33 Gonzaga 93.5 79.3 46.9 28.1 7.6 3.01 Memphis 97.8 87.7 42.1 19.0 6.1 2.5
2 Ohio St. 96.9 70.6 45.1 17.2 5.1 2.22 UCLA 97.9 82.3 42.9 25.4 6.4 2.14 Kansas 95.2 57.6 35.1 16.2 3.9 1.44 Illinois 95.5 74.6 9.6 4.8 2.3 1.15 Syracuse 79.1 49.6 6.2 3.4 1.9 0.93 Florida 94.3 73.6 34.0 9.4 2.3 0.86 Michigan St. 87.9 22.1 17.7 2.5 1.1 0.55 Pittsburgh 88.9 39.1 19.3 7.4 1.5 0.4
3 Iowa 95.8 53.4 19.2 3.0 1.2 0.42 Tennessee 93.4 71.8 12.7 2.8 1.2 0.44 LSU 93.1 44.1 6.5 2.7 1.1 0.36 W. Virginia 77.0 40.8 13.1 1.8 0.8 0.27 Georgetown 81.2 25.7 13.5 2.0 0.5 0.28 Kentucky 51.6 2.7 1.4 0.6 0.4 0.26 Indiana 68.3 14.5 4.2 1.1 0.3 0.15 Washington 77.5 20.7 1.6 0.6 0.3 0.1
6 Oklahoma 63.2 16.6 4.2 0.9 0.2 0.18 Arizona 45.5 3.8 1.6 0.7 0.2 0.1
10 N.C. State 61.9 6.3 2.3 0.3 0.1 0.18 Arkansas 49.8 7.1 1.1 0.3 0.1 0.18 G Washington 69.7 1.8 0.8 0.3 0.1 0.17 Marquette 56.7 10.8 2.8 0.5 0.1 05 Nevada 84.3 11.3 1.6 0.4 0.1 09 Wisconsin 51.8 3.5 1.0 0.3 0.1 0
7 California 37.1 4.1 1.5 0.2 0.1 010 Alabama 41.2 5.3 1.1 0.2 0.1 012 Texas A&M 20.1 4.7 0.3 0.1 0.1 010 Seton Hall 61.9 14.0 0.8 0.1 0 011 UW-Milwaukee 34.2 6.9 0.6 0.1 0 07 Wichita St. 35.7 11.0 0.5 0.1 0 09 Bucknell 48.2 3.3 0.5 0.1 0 0
11 South. Ill. 22.0 4.2 0.4 0.1 0 0
14 Xavier 4.9 2.0 0.4 0.1 0 011 San Diego St 29.8 2.7 0.3 0.1 0 012 Kent St. 9.3 1.2 0.3 0.1 0 09 UAB 46.0 0.9 0.3 0.1 0 0
13 Air Force 2.4 0.8 0.1 0.1 0 016 Oral Roberts 0.8 0.2 0.1 0.1 0 016 Albany 0.4 0.2 0.1 0.1 0 010 N. Iowa 16.3 1.5 0.3 0 0 0
14 Nwestern St. 3.4 0.8 0.2 0 0 011 George Mason 9.8 0.6 0.2 0 0 015 Pennsylvania 1.2 0.4 0.2 0 0 012 Utah St. 20.1 1.9 0.1 0 0 015 Winthrop 4.5 1.2 0.1 0 0 013 Pacific 3.3 1.2 0.1 0 0 014 S. Alabama 3.3 0.8 0.1 0 0 012 Montana 13.1 0.6 0.1 0 0 0
13 Bradley 3.2 0.5 0.1 0 0 09 NC Wilmngton 29.3 0.2 0.1 0 0 0
14 Murray St. 0.9 0.2 0.1 0 0 015 Davidson 0.9 0.2 0.1 0 0 015 Belmont 0.6 0.2 0.1 0 0 016 Monmouth 0.3 0.1 0.1 0 0 013 Iona 6.1 0.8 0 0 0 016 Southern 0.2 0.1 0 0 0 0
4

Chapter 3
Letscher Ratings
Our primary source of actual probabilities was a rating system developed by one of theauthors. There is more discussion of this at http://dehn.slu.edu/sports.
The Letscher ratings are shown in Table 3.2. To interpret these ratings, for a head tohead matchup take the difference of the ratings. This gives the expected winning margin.To convert to a probability, we assume game scores are normally distributed with a standarddeviation of σ = 16.7, computed from games over the past few seasons. That is,
P (A beats B) = Φ(r(A)− r(B)
σ)
where Φ is the normal cumulative distribution function.All picks with Letscher ratings used the 2n scoring (1,2,4,8,16,32). Using Letscher actu-
als, we predicted mean scores, correlation with opponent scores, and expected returns forthe optimal picks shown below, as well as other canonical picks. This data is shown in Table3.1.
Table 3.1: Statistics for picks (using Letscher actuals)Mean Opp. Expected ReturnsScore Corr. n=50 n=5,000 n=500,000
Most likely picked 67.2 0.55 0.2 0 0Favorites 78.2 0.43 6.1 30.4 124Maximum expected score 78.9 0.48 5.5 18.6 46.1Optimal picks, n = 50 76.4 0.06 9.1 165 2988.9Optimal picks, n = 5,000 73.4 -0.04 8.7 177.1 3751.2Optimal picks, n = 500,000 73.2 -0.05 8.6 176.9 3775.6
5
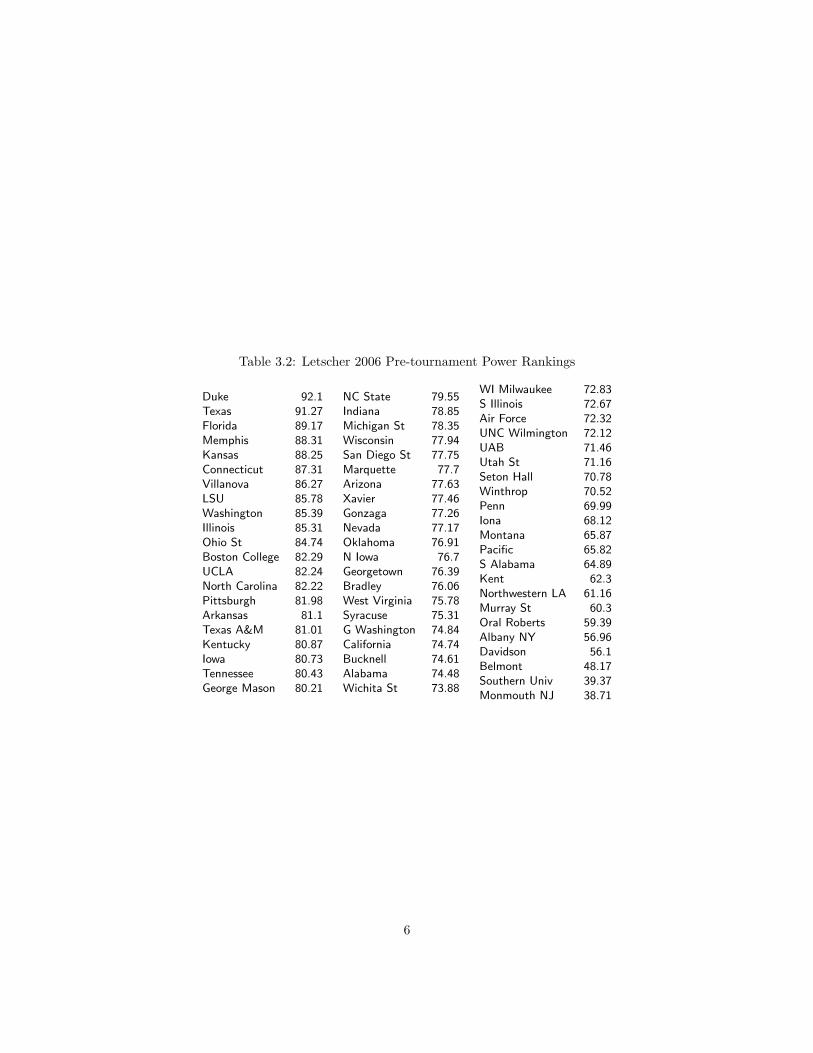
Table 3.2: Letscher 2006 Pre-tournament Power Rankings
Duke 92.1Texas 91.27Florida 89.17Memphis 88.31Kansas 88.25Connecticut 87.31Villanova 86.27LSU 85.78Washington 85.39Illinois 85.31Ohio St 84.74Boston College 82.29UCLA 82.24North Carolina 82.22Pittsburgh 81.98Arkansas 81.1Texas A&M 81.01Kentucky 80.87Iowa 80.73Tennessee 80.43George Mason 80.21
NC State 79.55Indiana 78.85Michigan St 78.35Wisconsin 77.94San Diego St 77.75Marquette 77.7Arizona 77.63Xavier 77.46Gonzaga 77.26Nevada 77.17Oklahoma 76.91N Iowa 76.7Georgetown 76.39Bradley 76.06West Virginia 75.78Syracuse 75.31G Washington 74.84California 74.74Bucknell 74.61Alabama 74.48Wichita St 73.88
WI Milwaukee 72.83S Illinois 72.67Air Force 72.32UNC Wilmington 72.12UAB 71.46Utah St 71.16Seton Hall 70.78Winthrop 70.52Penn 69.99Iona 68.12Montana 65.87Pacific 65.82S Alabama 64.89Kent 62.3Northwestern LA 61.16Murray St 60.3Oral Roberts 59.39Albany NY 56.96Davidson 56.1Belmont 48.17Southern Univ 39.37Monmouth NJ 38.71
6

3.1 Letscher Favorites
These picks scored 87 out of 192 using 2r scoring.
15 Belmont
2 UCLA
10 Alabama
7 Marquette
14 Xavier
3 Gonzaga
11 S Diego St
6 Indiana
13 Bradley
4 Kansas
12 Kent St.
5 Pittsburgh
9 Bucknell
8 Arkansas
16 O Roberts
1 Memphis
15 Penn
2 Texas
10 N.C. St
7 California
14 NW St.
3 Iowa
11 South. Ill.
6 W. Virginia
13 Iona
4 LSU
12 Tx A&M
5 Syracuse
9 NC Wilm
8 G Wash
16 Southern
1 Duke
15 Davidson
2 Ohio St.
10 N. Iowa
7 Georgetown14 S. Alabama
3 Florida
11 UW Milw.
6 Oklahoma
13 Pacific
4 Boston Coll.
12 Montana
5 Nevada
9 Wisconsin
8 Arizona
16 Monmouth
1 Villanova
15 Winthrop2 Tennessee
10 Seton Hall
7 Wichita St.
14 Murray St.3 N Carolina
11 G Mason
6 Mich St.
13 Air Force
4 Illinois
12 Utah St.
5 Washington9 UAB
8 Kentucky
16 Albany1 Connecticut
2 UCLA
7 Marquette
14 Xavier
6 Indiana
4 Kansas
5 Pittsburgh
8 Arkansas
1 Memphis
2 Texas
10 N.C. St
3 Iowa
6 W. Virginia
4 LSU
12 Tx A&M
8 G Wash
1 Duke
2 Ohio St.
7 Georgetown
3 Florida
6 Oklahoma
4 Boston Coll.
5 Nevada
8 Arizona
1 Villanova
2 Tennessee
7 Wichita St.
3 N Carolina
11 G Mason
4 Illinois
5 Washington
8 Kentucky
1 Connecticut
2 UCLA
6 Indiana
4 Kansas
1 Memphis
2 Texas
3 Iowa
4 LSU
1 Duke
2 Ohio St.
3 Florida
4 Boston Coll.
1 Villanova
2 Tennessee
3 N Carolina
4 Illinois
1 Connecticut
2 UCLA
4 Kansas
2 Texas
1 Duke
3 Florida
1 Villanova
3 N Carolina
1 Connecticut
4 Kansas
1 Duke
3 Florida
1 Connecticut
1 Duke
1 Duke
3 Florida
7

3.2 Letscher for n = 50, 2r scoring
These picks scored 91 out of 192.
15 Belmont
2 UCLA
10 Alabama
7 Marquette
14 Xavier
3 Gonzaga
11 S Diego St
6 Indiana
13 Bradley
4 Kansas
12 Kent St.
5 Pittsburgh
9 Bucknell
8 Arkansas
16 O Roberts
1 Memphis
15 Penn
2 Texas
10 N.C. St
7 California
14 NW St.
3 Iowa
11 South. Ill.
6 W. Virginia
13 Iona
4 LSU
12 Tx A&M
5 Syracuse
9 NC Wilm
8 G Wash
16 Southern
1 Duke
15 Davidson
2 Ohio St.
10 N. Iowa
7 Georgetown14 S. Alabama
3 Florida
11 UW Milw.
6 Oklahoma
13 Pacific
4 Boston Coll.
12 Montana
5 Nevada
9 Wisconsin
8 Arizona
16 Monmouth
1 Villanova
15 Winthrop2 Tennessee
10 Seton Hall
7 Wichita St.
14 Murray St.3 N Carolina
11 G Mason
6 Mich St.
13 Air Force
4 Illinois
12 Utah St.
5 Washington9 UAB
8 Kentucky
16 Albany1 Connecticut
2 UCLA
7 Marquette
14 Xavier
6 Indiana
4 Kansas
5 Pittsburgh
8 Arkansas
1 Memphis
2 Texas
10 N.C. St
3 Iowa
6 W. Virginia
4 LSU
12 Tx A&M
8 G Wash
1 Duke
2 Ohio St.
7 Georgetown
3 Florida
6 Oklahoma
4 Boston Coll.
5 Nevada
8 Arizona
1 Villanova
2 Tennessee
7 Wichita St.
3 N Carolina
11 G Mason
4 Illinois
5 Washington
8 Kentucky
1 Connecticut
2 UCLA
6 Indiana
4 Kansas
1 Memphis
2 Texas
3 Iowa
4 LSU
1 Duke
2 Ohio St.
3 Florida
4 Boston Coll.
1 Villanova
2 Tennessee
3 N Carolina
4 Illinois
1 Connecticut
2 UCLA
1 Memphis
2 Texas
1 Duke
3 Florida
1 Villanova
3 N Carolina
1 Connecticut
1 Memphis
2 Texas
3 Florida
1 Connecticut
2 Texas
2 Texas
3 Florida
8

3.3 Letscher for n = 5000, 2r scoring
These picks scored 91 out of 192.
15 Belmont
2 UCLA
10 Alabama
7 Marquette
14 Xavier
3 Gonzaga
11 S Diego St
6 Indiana
13 Bradley
4 Kansas
12 Kent St.
5 Pittsburgh
9 Bucknell
8 Arkansas
16 O Roberts
1 Memphis
15 Penn
2 Texas
10 N.C. St
7 California
14 NW St.
3 Iowa
11 South. Ill.
6 W. Virginia
13 Iona
4 LSU
12 Tx A&M
5 Syracuse
9 NC Wilm
8 G Wash
16 Southern
1 Duke
15 Davidson
2 Ohio St.
10 N. Iowa
7 Georgetown14 S. Alabama
3 Florida
11 UW Milw.
6 Oklahoma
13 Pacific
4 Boston Coll.
12 Montana
5 Nevada
9 Wisconsin
8 Arizona
16 Monmouth
1 Villanova
15 Winthrop2 Tennessee
10 Seton Hall
7 Wichita St.
14 Murray St.3 N Carolina
11 G Mason
6 Mich St.
13 Air Force
4 Illinois
12 Utah St.
5 Washington9 UAB
8 Kentucky
16 Albany1 Connecticut
2 UCLA
7 Marquette
14 Xavier
6 Indiana
4 Kansas
5 Pittsburgh
8 Arkansas
1 Memphis
2 Texas
10 N.C. St
3 Iowa
6 W. Virginia
4 LSU
12 Tx A&M
8 G Wash
1 Duke
2 Ohio St.
7 Georgetown
3 Florida
6 Oklahoma
4 Boston Coll.
5 Nevada
8 Arizona
1 Villanova
2 Tennessee
7 Wichita St.
3 N Carolina
11 G Mason
4 Illinois
5 Washington
8 Kentucky
1 Connecticut
2 UCLA
6 Indiana
4 Kansas
1 Memphis
2 Texas
3 Iowa
4 LSU
1 Duke
2 Ohio St.
3 Florida
4 Boston Coll.
1 Villanova
2 Tennessee
3 N Carolina
4 Illinois
1 Connecticut
2 UCLA
1 Memphis
2 Texas
4 LSU
3 Florida
1 Villanova
3 N Carolina
4 Illinois
1 Memphis
2 Texas
3 Florida
3 N Carolina
2 Texas
2 Texas
3 Florida
9

3.4 Letscher for n = 500000, 2r scoring
We entered these picks into ESPN’s pool. They scored 870 (of 1680) points and finished48,998th in the 98.2 percentile. (With 2r scoring, these picks score 91 out of 192.)
15 Belmont
2 UCLA
10 Alabama
7 Marquette
14 Xavier
3 Gonzaga
11 S Diego St
6 Indiana
13 Bradley
4 Kansas
12 Kent St.
5 Pittsburgh
9 Bucknell
8 Arkansas
16 O Roberts
1 Memphis
15 Penn
2 Texas
10 N.C. St
7 California
14 NW St.
3 Iowa
11 South. Ill.
6 W. Virginia
13 Iona
4 LSU
12 Tx A&M
5 Syracuse
9 NC Wilm
8 G Wash
16 Southern
1 Duke
15 Davidson
2 Ohio St.
10 N. Iowa
7 Georgetown14 S. Alabama
3 Florida
11 UW Milw.
6 Oklahoma
13 Pacific
4 Boston Coll.
12 Montana
5 Nevada
9 Wisconsin
8 Arizona
16 Monmouth
1 Villanova
15 Winthrop2 Tennessee
10 Seton Hall
7 Wichita St.
14 Murray St.3 N Carolina
11 G Mason
6 Mich St.
13 Air Force
4 Illinois
12 Utah St.
5 Washington9 UAB
8 Kentucky
16 Albany1 Connecticut
2 UCLA
7 Marquette
14 Xavier
6 Indiana
4 Kansas
5 Pittsburgh
8 Arkansas
1 Memphis
2 Texas
10 N.C. St
3 Iowa
6 W. Virginia
4 LSU
12 Tx A&M
8 G Wash
1 Duke
2 Ohio St.
7 Georgetown
3 Florida
6 Oklahoma
4 Boston Coll.
5 Nevada
8 Arizona
1 Villanova
2 Tennessee
7 Wichita St.
3 N Carolina
11 G Mason
4 Illinois
5 Washington
8 Kentucky
1 Connecticut
2 UCLA
6 Indiana
4 Kansas
1 Memphis
2 Texas
3 Iowa
4 LSU
1 Duke
2 Ohio St.
3 Florida
4 Boston Coll.
1 Villanova
2 Tennessee
3 N Carolina
4 Illinois
1 Connecticut
2 UCLA
1 Memphis
2 Texas
4 LSU
3 Florida
1 Villanova
3 N Carolina
4 Illinois
1 Memphis
2 Texas
3 Florida
4 Illinois
2 Texas
2 Texas
3 Florida
10

Chapter 4
Sagarin Ratings
Our second source of actual probabilities was Jeff Sagarin’s computer rankings. To interpretthese ratings, for a head to head matchup take the difference of the ratings. This gives theexpected winning margin. To convert to a probability, we assume game scores are normallydistributed with a standard deviation of σ = 16.7, computed from games over the past fewseasons. That is,
P (A beats B) = Φ(r(A)− r(B)
σ)
where Φ is the normal cumulative distribution function.Table 4.1 shows mean scores, correlations with opponent scores, and expected return for
various picks in various pool sizes. Also note the last column uses ESPN scoring. The picksare all based off of 2n scoring except for the last row, which is optimized for ESPN scoring.The mean score column is the mean score with 2n scoring.
Table 4.1: Statistics for picks using Sagarin actualsExpected Returns
Mean Opp. 2n scoring ESPNScore Corr. n=50 n=100K n=3M n=3M
Most likely picked 73.7 0.54 0.6 0.01 0 0Favorites∗ 83.4 0.53 3.3 2.0 1.1 0.26Optimal picks, n = 50 80.6 0.31 4.9 59.2 163 74.3Optimal picks, n = 100K & 1M 70.0 0.007 4.3 230 1427 1575Optimal picks, n = 3M, ESPN 69.5 -0.001 4.3 226 1406 1578
* The picks for favorites and maximum expected score are identical
11

Table 4.2: Sagarin 2006 Pre-tournament Power Rankings
Duke 95.09Connecticut 93.95Villanova 93.18Texas 91.40Memphis 90.96North Carolina 89.60Illinois 89.48Florida 89.45Ohio State 89.38Kansas 88.13Pittsburgh 88.06LSU 87.84Tennessee 87.12Iowa 87.11UCLA 87.04Boston College 86.86Georgetown 86.58Gonzaga 86.05Arkansas 86.04Washington 85.83George Washington 85.80West Virginia 85.71
NC State 85.58Indiana 85.21Michigan State 84.77Syracuse 84.70Nevada 84.68Marquette 84.46Northern Iowa 84.31Kentucky 84.26Wichita State 84.21Wisconsin 84.19Oklahoma 84.15Bradley 83.90George Mason 83.77Texas A&M 83.67Arizona 83.32Bucknell 83.05Southern Illinois 82.92UAB 82.92NC Wilmington 82.76California 82.40Air Force 82.06Xavier-Ohio 81.85
Alabama 81.85Seton Hall 81.54Iona 81.30San Diego State 81.14Kent State 80.97Wis.-Milwaukee 80.74Utah State 80.74Winthrop 80.30Pacific 79.75Northwestern St 78.70South Alabama 78.57Montana 78.47Murray State 78.46Pennsylvania 78.40Oral Roberts 75.94Davidson 75.76Albany-NY 73.12Belmont 71.26Monmouth-NJ 70.70Southern U. 69.45Hampton 65.01
12

4.1 Sagarin Favorites
These picks would have scored 67 out of 192 points with 2r scoring.
15 Belmont
2 UCLA
10 Alabama
7 Marquette
14 Xavier
3 Gonzaga
11 S Diego St
6 Indiana
13 Bradley
4 Kansas
12 Kent St.
5 Pittsburgh
9 Bucknell
8 Arkansas
16 O Roberts
1 Memphis
15 Penn
2 Texas
10 N.C. St
7 California
14 NW St.
3 Iowa
11 South. Ill.
6 W. Virginia
13 Iona
4 LSU
12 Tx A&M
5 Syracuse
9 NC Wilm
8 G Wash
16 Southern
1 Duke
15 Davidson
2 Ohio St.
10 N. Iowa
7 Georgetown14 S. Alabama
3 Florida
11 UW Milw.
6 Oklahoma
13 Pacific
4 Boston Coll.
12 Montana
5 Nevada
9 Wisconsin
8 Arizona
16 Monmouth
1 Villanova
15 Winthrop2 Tennessee
10 Seton Hall
7 Wichita St.
14 Murray St.3 N Carolina
11 G Mason
6 Mich St.
13 Air Force
4 Illinois
12 Utah St.
5 Washington9 UAB
8 Kentucky
16 Albany1 Connecticut
2 UCLA
7 Marquette
3 Gonzaga
6 Indiana
4 Kansas
5 Pittsburgh
8 Arkansas
1 Memphis
2 Texas
10 N.C. St
3 Iowa
6 W. Virginia
4 LSU
5 Syracuse
8 G Wash
1 Duke
2 Ohio St.
7 Georgetown
3 Florida
6 Oklahoma
4 Boston Coll.
5 Nevada
9 Wisconsin
1 Villanova
2 Tennessee
7 Wichita St.
3 N Carolina
6 Mich St.
4 Illinois
5 Washington
8 Kentucky
1 Connecticut
2 UCLA
3 Gonzaga
4 Kansas
1 Memphis
2 Texas
3 Iowa
4 LSU
1 Duke
2 Ohio St.
3 Florida
4 Boston Coll.
1 Villanova
2 Tennessee
3 N Carolina
4 Illinois
1 Connecticut
2 UCLA
1 Memphis
2 Texas
1 Duke
3 Florida
1 Villanova
3 N Carolina
1 Connecticut
1 Memphis
1 Duke
1 Villanova
1 Connecticut
1 Duke
1 Duke
1 Connecticut
13
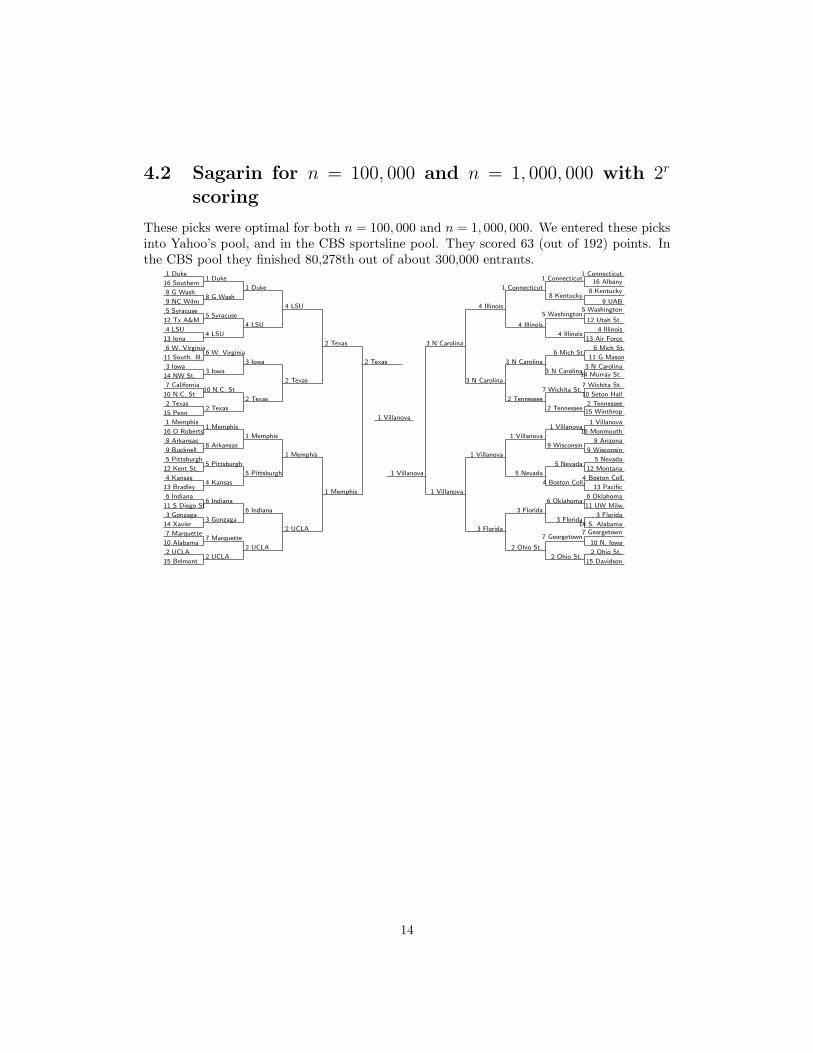
4.2 Sagarin for n = 100, 000 and n = 1, 000, 000 with 2r
scoring
These picks were optimal for both n = 100, 000 and n = 1, 000, 000. We entered these picksinto Yahoo’s pool, and in the CBS sportsline pool. They scored 63 (out of 192) points. Inthe CBS pool they finished 80,278th out of about 300,000 entrants.
15 Belmont
2 UCLA
10 Alabama
7 Marquette
14 Xavier
3 Gonzaga
11 S Diego St
6 Indiana
13 Bradley
4 Kansas
12 Kent St.
5 Pittsburgh
9 Bucknell
8 Arkansas
16 O Roberts
1 Memphis
15 Penn
2 Texas
10 N.C. St
7 California
14 NW St.
3 Iowa
11 South. Ill.
6 W. Virginia
13 Iona
4 LSU
12 Tx A&M
5 Syracuse
9 NC Wilm
8 G Wash
16 Southern
1 Duke
15 Davidson
2 Ohio St.
10 N. Iowa
7 Georgetown14 S. Alabama
3 Florida
11 UW Milw.
6 Oklahoma
13 Pacific
4 Boston Coll.
12 Montana
5 Nevada
9 Wisconsin
8 Arizona
16 Monmouth
1 Villanova
15 Winthrop2 Tennessee
10 Seton Hall
7 Wichita St.
14 Murray St.3 N Carolina
11 G Mason
6 Mich St.
13 Air Force
4 Illinois
12 Utah St.
5 Washington9 UAB
8 Kentucky
16 Albany1 Connecticut
2 UCLA
7 Marquette
3 Gonzaga
6 Indiana
4 Kansas
5 Pittsburgh
8 Arkansas
1 Memphis
2 Texas
10 N.C. St
3 Iowa
6 W. Virginia
4 LSU
5 Syracuse
8 G Wash
1 Duke
2 Ohio St.
7 Georgetown
3 Florida
6 Oklahoma
4 Boston Coll.
5 Nevada
9 Wisconsin
1 Villanova
2 Tennessee
7 Wichita St.
3 N Carolina
6 Mich St.
4 Illinois
5 Washington
8 Kentucky
1 Connecticut
2 UCLA
6 Indiana
5 Pittsburgh
1 Memphis
2 Texas
3 Iowa
4 LSU
1 Duke
2 Ohio St.
3 Florida
5 Nevada
1 Villanova
2 Tennessee
3 N Carolina
4 Illinois
1 Connecticut
2 UCLA
1 Memphis
2 Texas
4 LSU
3 Florida
1 Villanova
3 N Carolina
4 Illinois
1 Memphis
2 Texas
1 Villanova
3 N Carolina
1 Villanova
2 Texas
1 Villanova
14

4.3 Sagarin for n = 3, 000, 000, ESPN scoring
We entered these picks into ESPN’s pool. They scored 650 (out of 1680) points and finished587,112th in the 78th percentile.
15 Belmont
2 UCLA
10 Alabama
7 Marquette
14 Xavier
3 Gonzaga
11 S Diego St
6 Indiana
13 Bradley
4 Kansas
12 Kent St.
5 Pittsburgh
9 Bucknell
8 Arkansas
16 O Roberts
1 Memphis
15 Penn
2 Texas
10 N.C. St
7 California
14 NW St.
3 Iowa
11 South. Ill.
6 W. Virginia
13 Iona
4 LSU
12 Tx A&M
5 Syracuse
9 NC Wilm
8 G Wash
16 Southern
1 Duke
15 Davidson
2 Ohio St.
10 N. Iowa
7 Georgetown14 S. Alabama
3 Florida
11 UW Milw.
6 Oklahoma
13 Pacific
4 Boston Coll.
12 Montana
5 Nevada
9 Wisconsin
8 Arizona
16 Monmouth
1 Villanova
15 Winthrop2 Tennessee
10 Seton Hall
7 Wichita St.
14 Murray St.3 N Carolina
11 G Mason
6 Mich St.
13 Air Force
4 Illinois
12 Utah St.
5 Washington9 UAB
8 Kentucky
16 Albany1 Connecticut
2 UCLA
7 Marquette
3 Gonzaga
6 Indiana
4 Kansas
5 Pittsburgh
8 Arkansas
1 Memphis
2 Texas
10 N.C. St
3 Iowa
6 W. Virginia
4 LSU
12 Tx A&M
8 G Wash
1 Duke
2 Ohio St.
7 Georgetown
3 Florida
6 Oklahoma
4 Boston Coll.
5 Nevada
9 Wisconsin
1 Villanova
2 Tennessee
7 Wichita St.
3 N Carolina
11 G Mason
4 Illinois
5 Washington
8 Kentucky
1 Connecticut
2 UCLA
6 Indiana
5 Pittsburgh
1 Memphis
2 Texas
3 Iowa
4 LSU
1 Duke
2 Ohio St.
3 Florida
5 Nevada
1 Villanova
2 Tennessee
3 N Carolina
4 Illinois
1 Connecticut
2 UCLA
1 Memphis
2 Texas
4 LSU
3 Florida
1 Villanova
3 N Carolina
4 Illinois
1 Memphis
2 Texas
1 Villanova
4 Illinois
1 Villanova
2 Texas
1 Villanova
15
Chapter 5
NCAA Historical
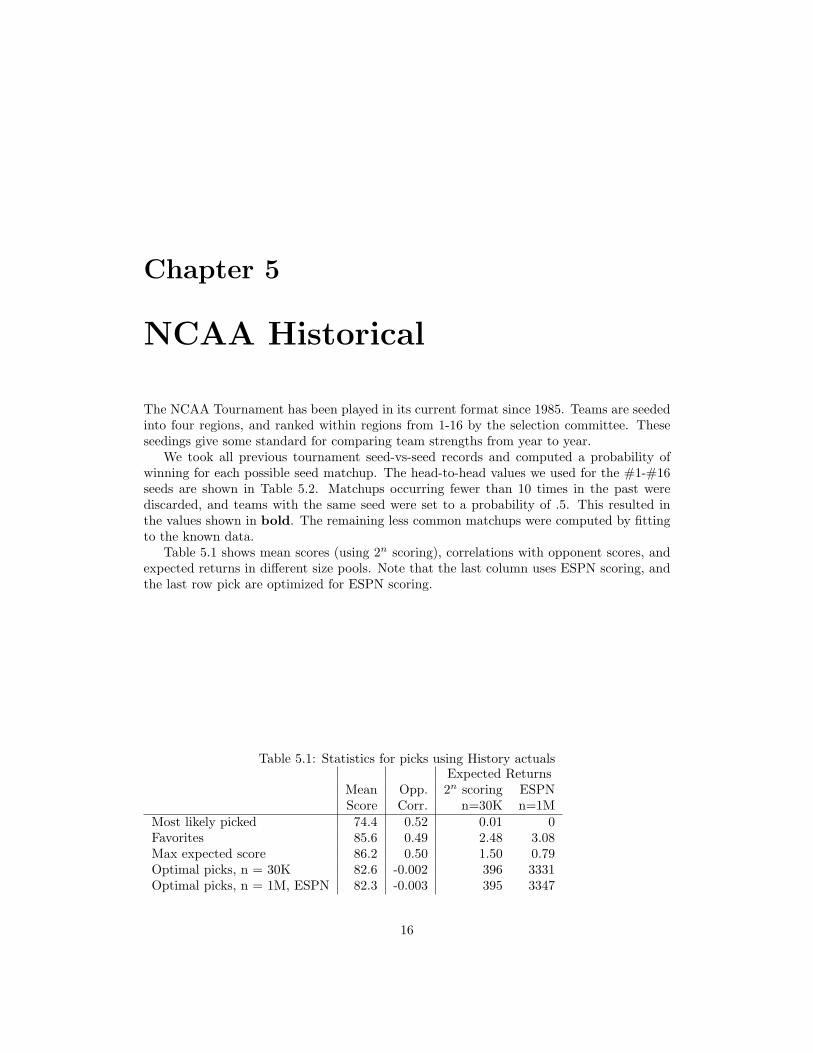
The NCAA Tournament has been played in its current format since 1985. Teams are seededinto four regions, and ranked within regions from 1-16 by the selection committee. Theseseedings give some standard for comparing team strengths from year to year.
We took all previous tournament seed-vs-seed records and computed a probability ofwinning for each possible seed matchup. The head-to-head values we used for the #1-#16seeds are shown in Table 5.2. Matchups occurring fewer than 10 times in the past werediscarded, and teams with the same seed were set to a probability of .5. This resulted inthe values shown in bold. The remaining less common matchups were computed by fittingto the known data.
Table 5.1 shows mean scores (using 2n scoring), correlations with opponent scores, andexpected returns in different size pools. Note that the last column uses ESPN scoring, andthe last row pick are optimized for ESPN scoring.
Table 5.1: Statistics for picks using History actualsExpected Returns
Mean Opp. 2n scoring ESPNScore Corr. n=30K n=1M
Most likely picked 74.4 0.52 0.01 0Favorites 85.6 0.49 2.48 3.08Max expected score 86.2 0.50 1.50 0.79Optimal picks, n = 30K 82.6 -0.002 396 3331Optimal picks, n = 1M, ESPN 82.3 -0.003 395 3347
16

Table 5.2: Historical head-to-head percentages
# 1 # 2 # 3 # 4 # 5 # 6 # 7 # 8 # 9 #10 #11 #12 #13 #14 #15 #16#1 0.50 0.56 0.44 0.70 0.83 0.70 0.73 0.75 0.93 0.77 0.83 1.00 0.93 0.93 0.96 1.00#2 0.44 0.50 0.64 0.65 0.70 0.74 0.74 0.72 0.72 0.53 0.72 0.82 0.86 0.89 0.95 0.95#3 0.56 0.36 0.50 0.56 0.58 0.50 0.62 0.66 0.68 0.70 0.68 0.71 0.80 0.83 0.88 0.89#4 0.30 0.35 0.44 0.50 0.58 0.55 0.59 0.62 0.64 0.66 0.64 0.55 0.80 0.82 0.84 0.85#5 0.17 0.30 0.42 0.42 0.50 0.53 0.56 0.59 0.61 0.64 0.67 0.68 0.83 0.82 0.82 0.82#6 0.30 0.26 0.50 0.45 0.47 0.50 0.53 0.56 0.59 0.63 0.70 0.70 0.77 0.82 0.79 0.78#7 0.27 0.26 0.38 0.41 0.44 0.47 0.50 0.52 0.54 0.61 0.64 0.67 0.71 0.73 0.74 0.73#8 0.25 0.28 0.34 0.38 0.41 0.44 0.48 0.50 0.45 0.54 0.59 0.63 0.66 0.68 0.69 0.69#9 0.07 0.28 0.32 0.36 0.39 0.41 0.46 0.55 0.50 0.53 0.56 0.59 0.61 0.63 0.64 0.65#10 0.23 0.47 0.30 0.34 0.36 0.37 0.39 0.46 0.47 0.50 0.53 0.55 0.58 0.59 0.60 0.61#11 0.17 0.28 0.32 0.36 0.33 0.30 0.36 0.41 0.44 0.47 0.50 0.53 0.55 0.56 0.57 0.58#12 0.00 0.18 0.29 0.45 0.32 0.30 0.33 0.37 0.41 0.45 0.47 0.50 0.52 0.54 0.55 0.55#13 0.07 0.14 0.20 0.20 0.17 0.23 0.29 0.34 0.39 0.42 0.45 0.48 0.50 0.52 0.53 0.53#14 0.07 0.11 0.17 0.18 0.18 0.18 0.27 0.32 0.37 0.41 0.44 0.46 0.48 0.50 0.51 0.52#15 0.04 0.05 0.12 0.16 0.18 0.21 0.26 0.31 0.36 0.40 0.43 0.45 0.47 0.49 0.50 0.51#16 0.00 0.05 0.11 0.15 0.18 0.22 0.27 0.31 0.35 0.39 0.42 0.45 0.47 0.48 0.49 0.50
(Fixed values in bold, others are computed)
17
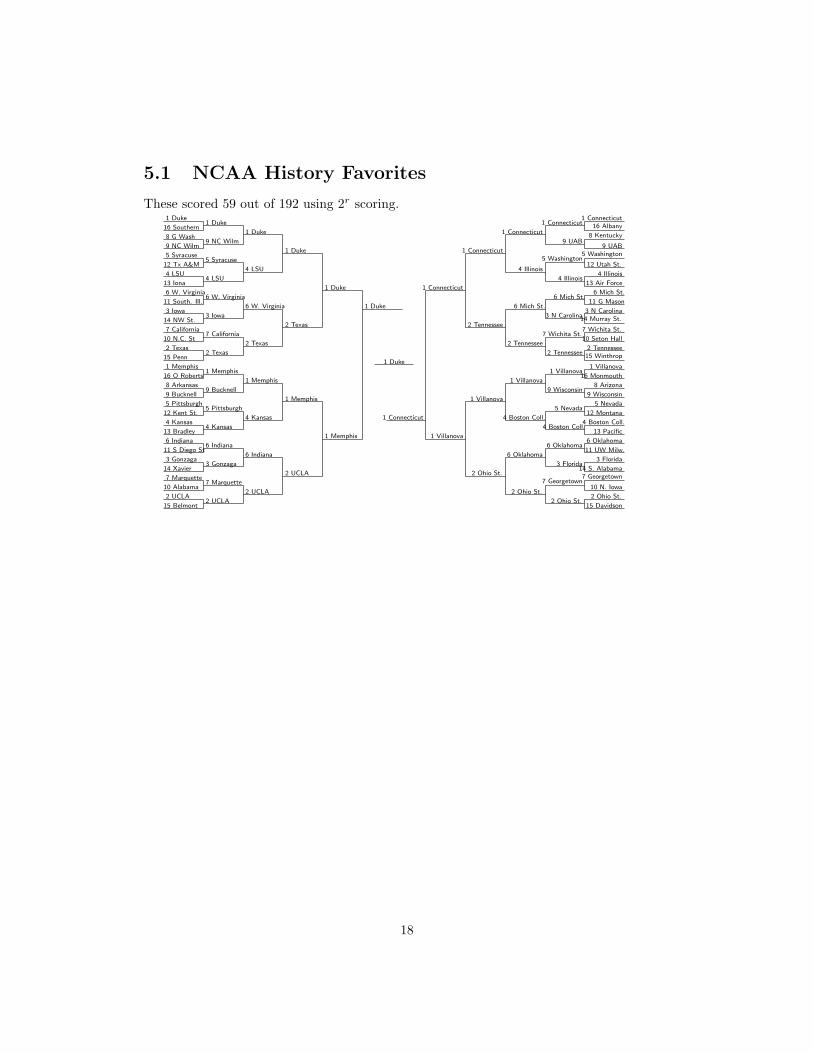
5.1 NCAA History Favorites
These scored 59 out of 192 using 2r scoring.
15 Belmont
2 UCLA
10 Alabama
7 Marquette
14 Xavier
3 Gonzaga
11 S Diego St
6 Indiana
13 Bradley
4 Kansas
12 Kent St.
5 Pittsburgh
9 Bucknell
8 Arkansas
16 O Roberts
1 Memphis
15 Penn
2 Texas
10 N.C. St
7 California
14 NW St.
3 Iowa
11 South. Ill.
6 W. Virginia
13 Iona
4 LSU
12 Tx A&M
5 Syracuse
9 NC Wilm
8 G Wash
16 Southern
1 Duke
15 Davidson
2 Ohio St.
10 N. Iowa
7 Georgetown14 S. Alabama
3 Florida
11 UW Milw.
6 Oklahoma
13 Pacific
4 Boston Coll.
12 Montana
5 Nevada
9 Wisconsin
8 Arizona
16 Monmouth
1 Villanova
15 Winthrop2 Tennessee
10 Seton Hall
7 Wichita St.
14 Murray St.3 N Carolina
11 G Mason
6 Mich St.
13 Air Force
4 Illinois
12 Utah St.
5 Washington9 UAB
8 Kentucky
16 Albany1 Connecticut
2 UCLA
7 Marquette
3 Gonzaga
6 Indiana
4 Kansas
5 Pittsburgh
9 Bucknell
1 Memphis
2 Texas
7 California
3 Iowa
6 W. Virginia
4 LSU
5 Syracuse
9 NC Wilm
1 Duke
2 Ohio St.
7 Georgetown
3 Florida
6 Oklahoma
4 Boston Coll.
5 Nevada
9 Wisconsin
1 Villanova
2 Tennessee
7 Wichita St.
3 N Carolina
6 Mich St.
4 Illinois
5 Washington
9 UAB
1 Connecticut
2 UCLA
6 Indiana
4 Kansas
1 Memphis
2 Texas
6 W. Virginia
4 LSU
1 Duke
2 Ohio St.
6 Oklahoma
4 Boston Coll.
1 Villanova
2 Tennessee
6 Mich St.
4 Illinois
1 Connecticut
2 UCLA
1 Memphis
2 Texas
1 Duke
2 Ohio St.
1 Villanova
2 Tennessee
1 Connecticut
1 Memphis
1 Duke
1 Villanova
1 Connecticut
1 Duke
1 Duke
1 Connecticut
18

5.2 NCAA History for n = 1, 000, 000, ESPN scoring
We entered these picks into ESPN’s pool. They scored 550 (out of 1680) points and finished1,496,138th in the 44th percentile.
15 Belmont
2 UCLA
10 Alabama
7 Marquette
14 Xavier
3 Gonzaga
11 S Diego St
6 Indiana
13 Bradley
4 Kansas
12 Kent St.
5 Pittsburgh
9 Bucknell
8 Arkansas
16 O Roberts
1 Memphis
15 Penn
2 Texas
10 N.C. St
7 California
14 NW St.
3 Iowa
11 South. Ill.
6 W. Virginia
13 Iona
4 LSU
12 Tx A&M
5 Syracuse
9 NC Wilm
8 G Wash
16 Southern
1 Duke
15 Davidson
2 Ohio St.
10 N. Iowa
7 Georgetown14 S. Alabama
3 Florida
11 UW Milw.
6 Oklahoma
13 Pacific
4 Boston Coll.
12 Montana
5 Nevada
9 Wisconsin
8 Arizona
16 Monmouth
1 Villanova
15 Winthrop2 Tennessee
10 Seton Hall
7 Wichita St.
14 Murray St.3 N Carolina
11 G Mason
6 Mich St.
13 Air Force
4 Illinois
12 Utah St.
5 Washington9 UAB
8 Kentucky
16 Albany1 Connecticut
2 UCLA
7 Marquette
3 Gonzaga
6 Indiana
4 Kansas
5 Pittsburgh
9 Bucknell
1 Memphis
2 Texas
7 California
3 Iowa
6 W. Virginia
4 LSU
5 Syracuse
9 NC Wilm
1 Duke
2 Ohio St.
7 Georgetown
3 Florida
6 Oklahoma
4 Boston Coll.
5 Nevada
9 Wisconsin
1 Villanova
2 Tennessee
7 Wichita St.
3 N Carolina
6 Mich St.
4 Illinois
5 Washington
9 UAB
1 Connecticut
2 UCLA
6 Indiana
5 Pittsburgh
1 Memphis
2 Texas
3 Iowa
4 LSU
1 Duke
2 Ohio St.
6 Oklahoma
5 Nevada
1 Villanova
2 Tennessee
6 Mich St.
4 Illinois
1 Connecticut
2 UCLA
1 Memphis
2 Texas
1 Duke
2 Ohio St.
1 Villanova
2 Tennessee
1 Connecticut
1 Memphis
2 Texas
1 Villanova
2 Tennessee
1 Memphis
1 Memphis
1 Villanova
19

5.3 NCAA History for n = 30, 000, 2r scoring
We entered these picks into the CBS sportsline pool. They scored 55 (out of 192) points.
15 Belmont
2 UCLA
10 Alabama
7 Marquette
14 Xavier
3 Gonzaga
11 S Diego St
6 Indiana
13 Bradley
4 Kansas
12 Kent St.
5 Pittsburgh
9 Bucknell
8 Arkansas
16 O Roberts
1 Memphis
15 Penn
2 Texas
10 N.C. St
7 California
14 NW St.
3 Iowa
11 South. Ill.
6 W. Virginia
13 Iona
4 LSU
12 Tx A&M
5 Syracuse
9 NC Wilm
8 G Wash
16 Southern
1 Duke
15 Davidson
2 Ohio St.
10 N. Iowa
7 Georgetown14 S. Alabama
3 Florida
11 UW Milw.
6 Oklahoma
13 Pacific
4 Boston Coll.
12 Montana
5 Nevada
9 Wisconsin
8 Arizona
16 Monmouth
1 Villanova
15 Winthrop2 Tennessee
10 Seton Hall
7 Wichita St.
14 Murray St.3 N Carolina
11 G Mason
6 Mich St.
13 Air Force
4 Illinois
12 Utah St.
5 Washington9 UAB
8 Kentucky
16 Albany1 Connecticut
2 UCLA
7 Marquette
3 Gonzaga
6 Indiana
4 Kansas
5 Pittsburgh
9 Bucknell
1 Memphis
2 Texas
7 California
3 Iowa
6 W. Virginia
4 LSU
5 Syracuse
9 NC Wilm
1 Duke
2 Ohio St.
7 Georgetown
3 Florida
6 Oklahoma
4 Boston Coll.
5 Nevada
9 Wisconsin
1 Villanova
2 Tennessee
7 Wichita St.
3 N Carolina
6 Mich St.
4 Illinois
5 Washington
9 UAB
1 Connecticut
2 UCLA
6 Indiana
4 Kansas
1 Memphis
2 Texas
3 Iowa
4 LSU
1 Duke
2 Ohio St.
6 Oklahoma
5 Nevada
1 Villanova
2 Tennessee
6 Mich St.
4 Illinois
1 Connecticut
2 UCLA
1 Memphis
2 Texas
1 Duke
2 Ohio St.
1 Villanova
2 Tennessee
1 Connecticut
1 Memphis
2 Texas
1 Villanova
2 Tennessee
1 Memphis
1 Memphis
1 Villanova
20