200420032005 s1 30 minute warmup 15 minute calibration pcal standards 3 minute scan 200120002002...
TRANSCRIPT


20042003 2005
S130 MINUTE WARMUP15 MINUTE CALIBRATIONpCAL STANDARDS3 MINUTE SCAN
20012000 2002
FIRST SCANNERUNIVERSITY OF UTAH10’ X 10’LIQUID NITROGEN REQUIRED

20072006 2008
S25 MINUTE WARMUP90 SECOND SCANELIMINATE pCAL WITH EVEREST VERSIONLAPTOP AND BARCODE READER REQUIRED
20042003 2005
S130 MINUTE WARMUP15 MINUTE CALIBRATION3 MINUTE SCANpCAL STANDARDS

FASTER
PORTABLE
SMALLER
DIGITAL
INTRODUCING20082007 2009
S2
5 MINUTE WARMUP90 SECOND SCANELIMINATE pCAL WITH EVEREST VERSIONLAPTOP AND BARCODE READER REQUIRED

0:30S3
1:30 S2
3:00 S1
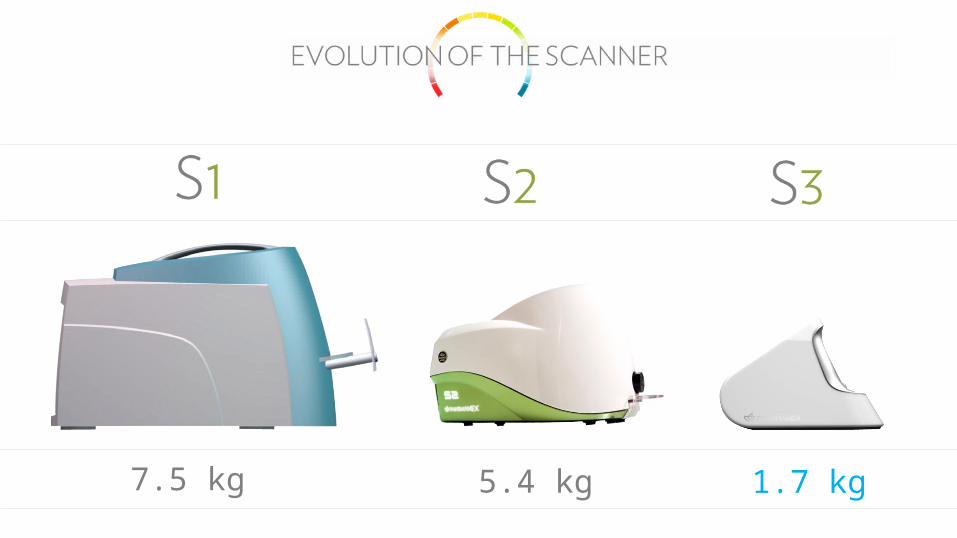
7.5 kg 5.4 kg 1.7 kg
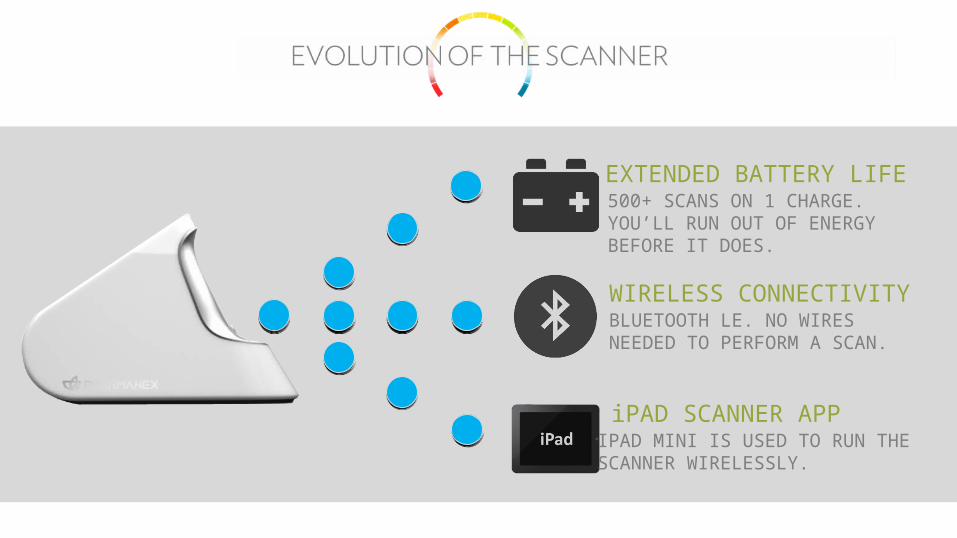
EXTENDED BATTERY LIFE500+ SCANS ON 1 CHARGE.YOU’LL RUN OUT OF ENERGY BEFORE IT DOES.
WIRELESS CONNECTIVITYBLUETOOTH LE. NO WIRES NEEDED TO PERFORM A SCAN.
iPAD SCANNER APP IPAD MINI IS USED TO RUN THESCANNER WIRELESSLY.

DIGITAL SCANSNEW OPTION TO BUY AND USE DIGITALSCANS
SCAN CARDSUSE OF PHYSICAL SCAN CARDS WILL CONTINUE TO BE AN OPTION
ELIMINATES THE NEED FOR PHYSICAL CARDS

213
Scanner Plant Calibrates Scanner Using Same Methods as S2
Scanner Plant Performs QA Inspection on Each Scanner
Scanner Plant Ships Scanner to Market

54Upon Receipt, Market Performs QA Check on Every Scanner Before Packaging for Shipment to Distributor—Using Same Criteria as Scanner Plant
Scanners that Fail QA Tests in Market Return to Scanner Plant for Rework

ZEAXANTHIN
ASTAXANTHIN
BETA-CAROTENE
LUTEIN
LYCOPENE

ZEAXANTHIN
ASTAXANTHIN
BETA-CAROTENE
LUTEIN
LYCOPENE
The National Academy of Sciences concluded “Tissue concentrations of carotenoids are the best biological markers for
consumption of fruit and vegetables.”
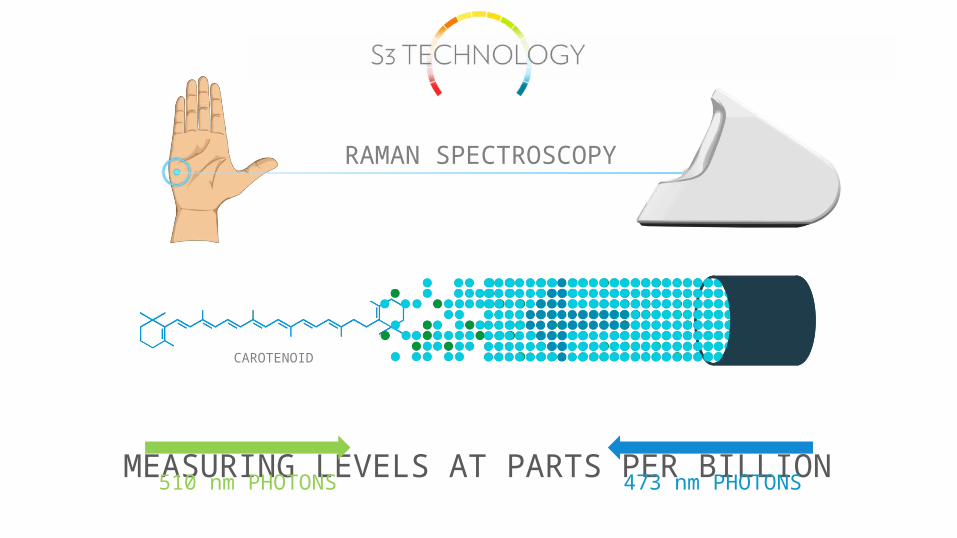
MEASURING LEVELS AT PARTS PER BILLION
CAROTENOID
473 nm PHOTONS
RAMAN SPECTROSCOPY
510 nm PHOTONS

If we were to liken a carotenoid to a grain of sand, a typical scan session would be like searching for 40 “special” grains of sand in an
area covered with 2.4 trillion grains of normal sand.
If you lined up every grain of that sand, then it would cover the Dune of Pilat in France, twice!—with a 1mm deep layer of sand.
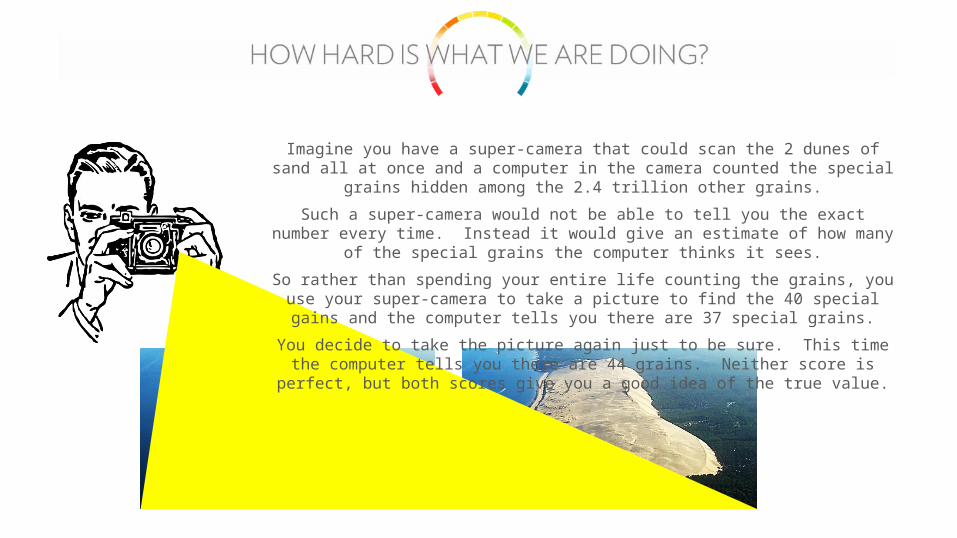
Imagine you have a super-camera that could scan the 2 dunes of sand all at once and a computer in the camera counted the special grains hidden among the 2.4 trillion other grains.
Such a super-camera would not be able to tell you the exact number every time. Instead it would give an estimate of how many of the special grains the computer thinks it sees.
So rather than spending your entire life counting the grains, you use your super-camera to take a picture to find the 40 special gains and the computer tells you there are 37 special grains.
You decide to take the picture again just to be sure. This time the computer tells you there are 44 grains. Neither score is perfect, but both scores give you a good idea of the true value.
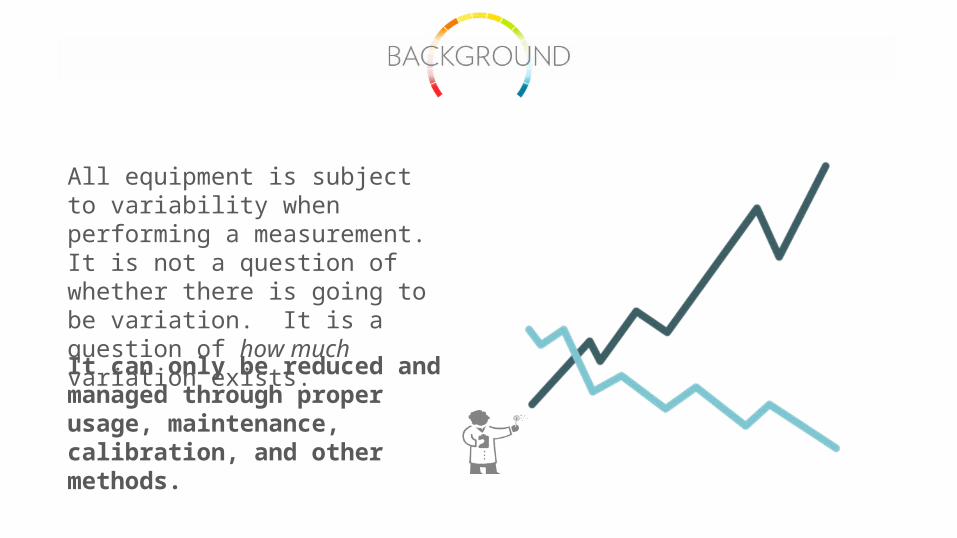
All equipment is subject to variability when performing a measurement. It is not a question of whether there is going to be variation. It is a question of how much variation exists.It can only be reduced and managed through proper usage, maintenance, calibration, and other methods.
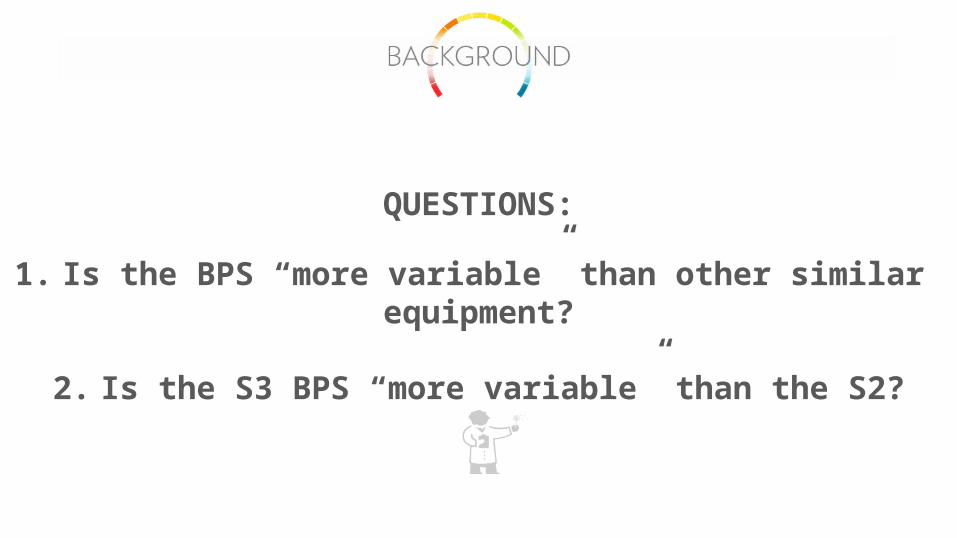
1. Is the BPS “more variable” than other similar equipment?
2. Is the S3 BPS “more variable” than the S2?
QUESTIONS:

Pharmanex R&D conducted a research project to evaluate S3 device variability.
3,600 total scans
10 different S3 devices
30 scans on each device per session
3 different scan sessions per subject in a 7 day period
4 different subjects
The S3 is marketed to have an acceptable device variability of 9,000 points (or 3 ‘color shades’). This is roughly a 15% variability. Testing of the device shows that the S3 performs at or above this expectation in 85% of all cases. Other experiments have shown the S3 regularly outperforms this standard.
AVERAGE S3 TEST RESULT VARIABILITY:
1,975 POINTS OR 3.29%

AVERAGE S3 TEST RESULT VARIABILITY:
1,975 POINTS OR 3.29%
High or low temperatures Inconsistent hand placement
Improper hand placement S3 not allowed to acclimate
Improper hand pressure S3 stored in extreme temperatures
Poor posture while scanning Poor arm positioning while scanning
SOME THINGS THAT CAN GIVE YOU A “BAD READING”
41,000
43,000
39,000
40,000
43,000
45,000
38,000
37,000
41,000
36,000
44,000
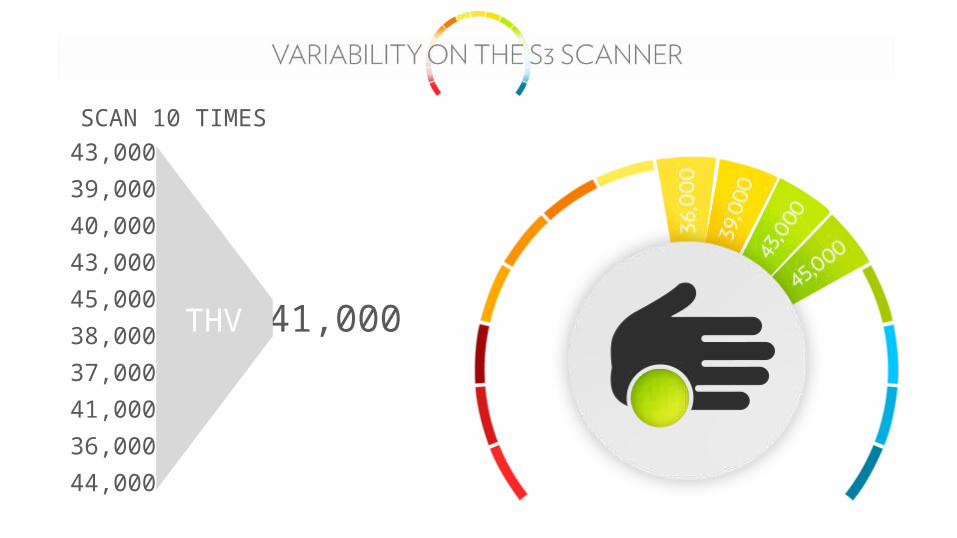
THV
SCAN 10 TIMES

41,000
43,000
39,000
40,000
43,000
45,000
38,000
37,000
41,000
36,000
44,000
THV
SCAN 10 TIMES
ONE COLOR SHADE
+
-ONE COLOR SHADE
85% of the Time
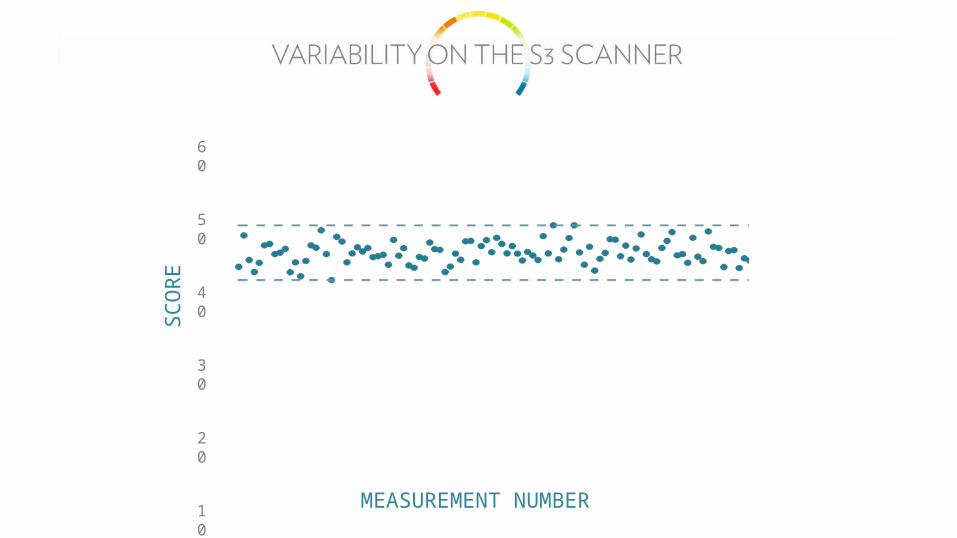
SC
OR
E
MEASUREMENT NUMBER
60
50
40
30
20
10
0

Pharmanex R&D conducted a research project to evaluate S2 device variability.
•450 total scans
•5 different S2 devices
•30 scans on each device per session
•3 different scan sessions per subject in a 7 day period
The S2 is marketed to have an acceptable device variability of 9,000 points (or 3 ‘color shades’). This is roughly a 15% variability. Testing of the device shows that the S2 performs at or above this expectation in 85% of all cases. Other experiments have shown the S2 regularly outperforms this standard.
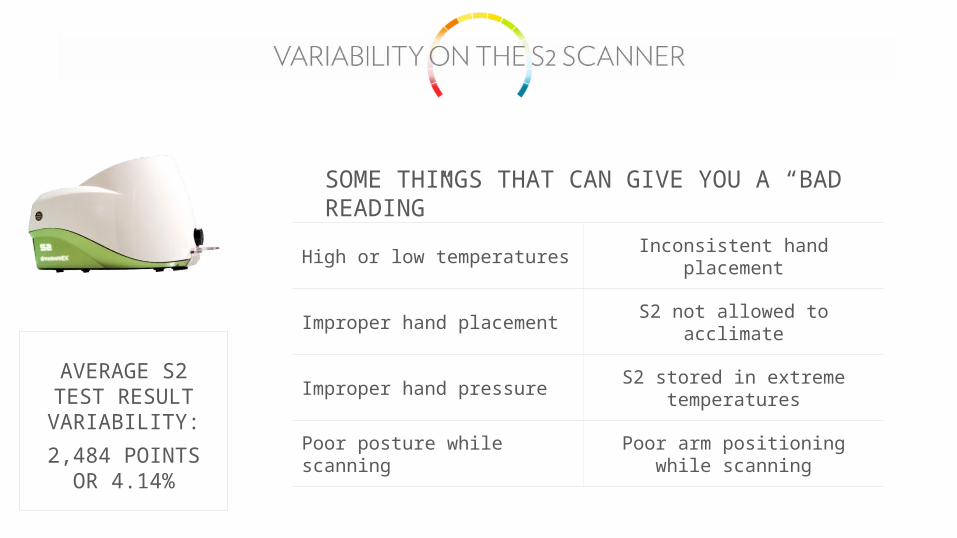
AVERAGE S2 TEST RESULT VARIABILITY:
2,484 POINTS OR 4.14%
AVERAGE S2 TEST RESULT VARIABILITY:
2,484 POINTS OR 4.14%
High or low temperatures Inconsistent hand placement
Improper hand placement S2 not allowed to acclimate
Improper hand pressure S2 stored in extreme temperatures
Poor posture while scanning Poor arm positioning while scanning
SOME THINGS THAT CAN GIVE YOU A “BAD READING”
An important way to reduce BPS variability is to be as repeatable and consistent as possible in hand placement on the scanner probe. Inconsistent hand placement is a known variable that can increase score fluctuation.
The experiment below tests the variability of a subject when moving the hand only 0.5 cm (5mm) away from the target hand point for scanning.
Hand placement Scan 1 Scan 2 Scan 3 AVERAGE VARIABILITY
Proper Placement 1 41,416 42,820 42,202 42,146 N/A
0.5 cm left 47,227 46,983 49,737 47,982 +5,800
0.5 cm right 43,188 41,608 45,021 43,272 +1,100
0.5 cm up 54,701 56,359 54,440 55,167 +13,000
0.5 cm down 47,853 47,101 47,117 47,357 +5,200
Proper Placement 2 42,351 43,196 43,257 42,935 +800
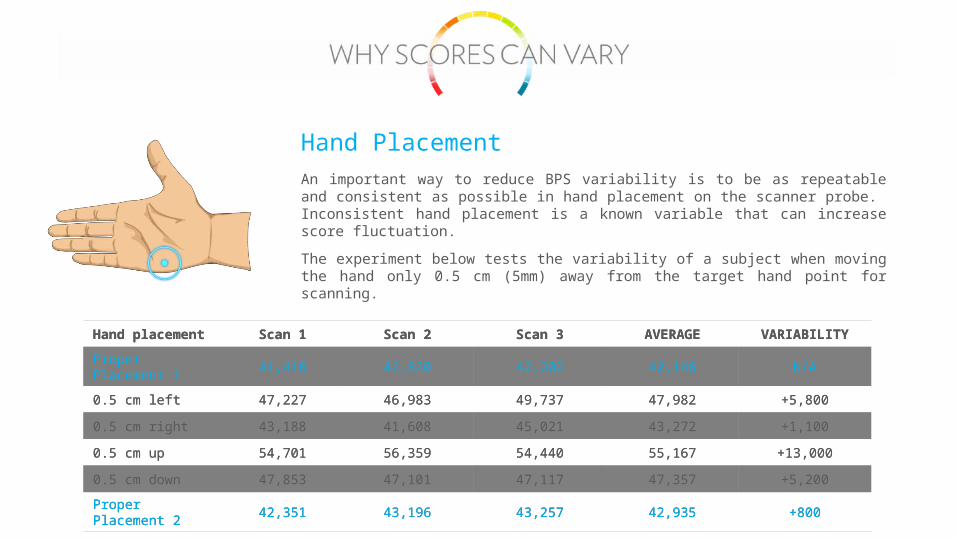
Hand Placement
Hand placement Scan 1 Scan 2 Scan 3 AVERAGE VARIABILITY
Proper Placement 1 41,416 42,820 42,202 42,146 N/A
0.5 cm left 47,227 46,983 49,737 47,982 +5,800
0.5 cm right 43,188 41,608 45,021 43,272 +1,100
0.5 cm up 54,701 56,359 54,440 55,167 +13,000
0.5 cm down 47,853 47,101 47,117 47,357 +5,200
Proper Placement 2 42,351 43,196 43,257 42,935 +800

An important way to reduce BPS variability is to be as repeatable and consistent as possible in hand placement on the scanner probe. Inconsistent hand placement is a known variable that can increase score fluctuation.
The experiment below tests the variability of a subject when moving the hand only 0.5 cm (5mm) away from the target hand point for scanning.
Hand Placement

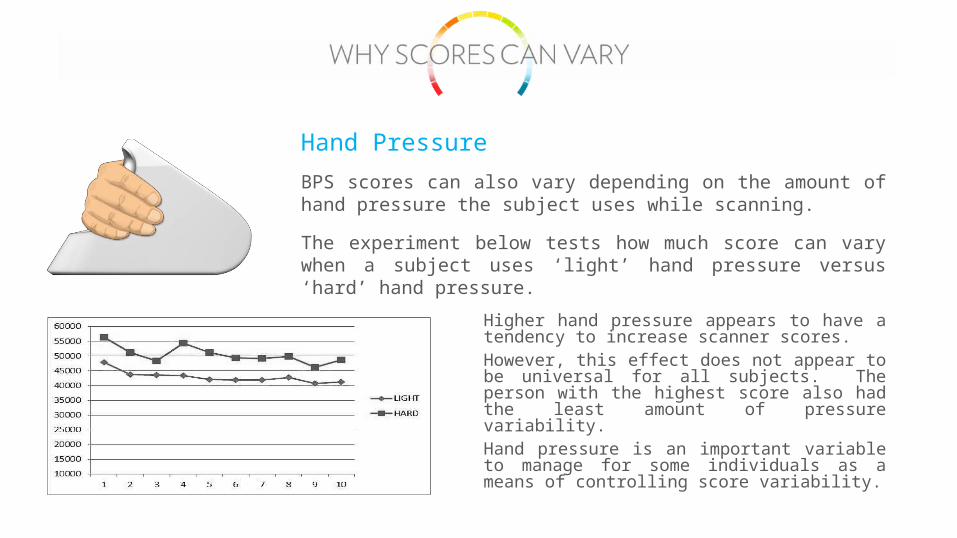
BPS scores can also vary depending on the amount of hand pressure the subject uses while scanning.
The experiment below tests how much score can vary when a subject uses ‘light’ hand pressure versus ‘hard’ hand pressure.
Hand Pressure
SubjectLight pressure
10 scan averageHard pressure
10 scan averageVariation due tohand pressure
Subject 1 42,927.2 50,474.5 +7,547.3
Subject 2 34,932.8 39,062.9 +4,130.1
Subject 3 73,074.2 74,882.9 +1,808.7
BPS scores can also vary depending on the amount of hand pressure the subject uses while scanning.
The experiment below tests how much score can vary when a subject uses ‘light’ hand pressure versus ‘hard’ hand pressure.
Hand Pressure
Higher hand pressure appears to have a tendency to increase scanner scores.However, this effect does not appear to be universal for all subjects. The person with the highest score also had the least amount of pressure variability.Hand pressure is an important variable to manage for some individuals as a means of controlling score variability.
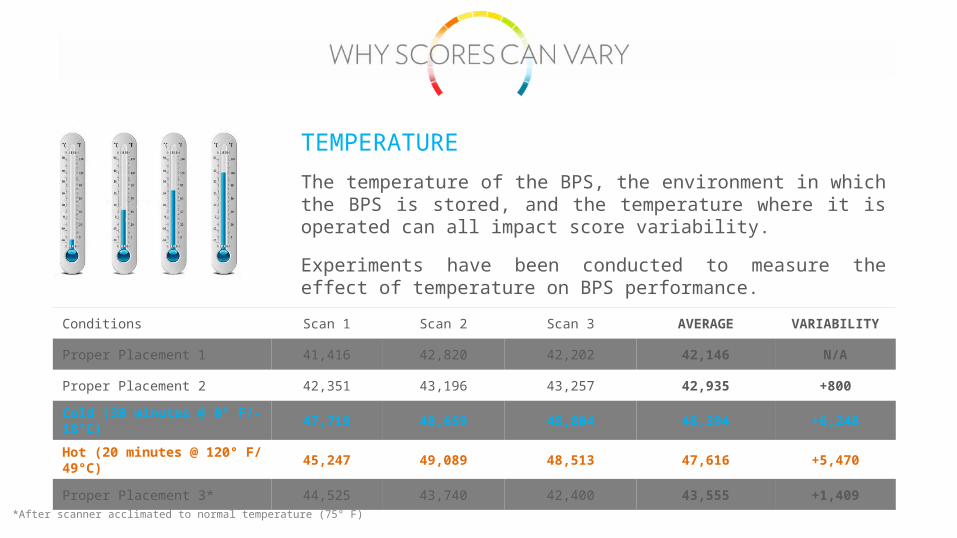
The temperature of the BPS, the environment in which the BPS is stored, and the temperature where it is operated can all impact score variability.
Experiments have been conducted to measure the effect of temperature on BPS performance.
TEMPERATURE
Conditions Scan 1 Scan 2 Scan 3 AVERAGE VARIABILITY
Proper Placement 1 41,416 42,820 42,202 42,146 N/A
Proper Placement 2 42,351 43,196 43,257 42,935 +800
Cold (30 minutes @ 0° F/-18°C)
47,719 48,659 48,804 48,394 +6,248
Hot (20 minutes @ 120° F/ 49°C)
45,247 49,089 48,513 47,616 +5,470
Proper Placement 3* 44,525 43,740 42,400 43,555 +1,409
*After scanner acclimated to normal temperature (75° F)

What to do if someone’s score seems to be “too high” or “too low:
1.Scan three times or more
2.Take an average to determine an estimate for the THV (True Hand Value)
3.Explain the scanner variability
SC
OR
E
SINGLE SCAN DISTRIBUTION
60
50
40
30
20
10
3-SCAN AVERAGE

• Both the S2 and the S3 devices have variability levels that are superior or comparable to other similar devices.
• There are other existing carotenoid tools which have less variability than the S2 or S3. This includes High Performance Liquid Chromatography (HPLC). These tools are considered to fall outside the scope of the S3 device (laboratory analysis).
• The S3 is not more variable than the S2. Repeated experiments have shown a tendency for the S3 to be slightly less variable than the S2.
Great improvements have been made over the years, making the scanner faster, portable, and more convenient.
The S3, like other devices, is subject to variability which, with proper care, can be managed and also taught to customers.
With proper treatment, best practices, and timely calibration, the S3 can be a very effective tool to assess the amount of carotenoids
incorporated in the skin and promote one’s business.
