2004 irp update - main document
TRANSCRIPT
2004Integrated Resource Plan Update
for our customersAssuring a
This 2004 Integrated Resource Plan (IRP) Update Report is based upon the best available information at the time of preparation. The updated Action Plan will be implemented as described herein, but is subject to change as new information becomes available or as circumstances change. It is PacifiCorp’s intention to revisit and refresh the Action Plan no less frequently than annually. Any refreshed Action Plan will be submitted to the State Commissions for their information. For more information, contact: PacifiCorp IRP Resource Planning 825 N.E. Multnomah, Suite 600 Portland, Oregon 97232 (503) 813-5245 [email protected] http://www.PacifiCorp.com
PacifiCorp – 2004 IRP Update Table Of Contents
- i -
TABLE OF CONTENTS Executive Summary .................................................................................................................................... 1 1. Changes in The Marketplace and Fundamentals.............................................................................. 3
Natural Gas and Power Market Update.................................................................................................. 3 Western Supply/Demand Balance ..................................................................................................... 3 Natural Gas Markets.......................................................................................................................... 3
Climate Change Policy Update .............................................................................................................. 4 Impacts of the Energy Policy Act of 2005 ............................................................................................. 5
Transmission Siting ........................................................................................................................... 5 Renewable Energy Production Tax Credit ........................................................................................ 6 Clean Coal Incentives........................................................................................................................ 6 Hydropower....................................................................................................................................... 7 Mandatory Reliability Standards ....................................................................................................... 8 Conclusion......................................................................................................................................... 8
2. Resource Needs Assessment ................................................................................................................. 9 Introduction ............................................................................................................................................ 9 Load Forecast ......................................................................................................................................... 9 Resource Situation.................................................................................................................................. 9
Changes to Existing Resources.......................................................................................................... 9 New Contracts .............................................................................................................................. 9 Treatment of Qualifying Facilities and Interruptible Load Contracts .......................................... 9 Hydroelectric Resources............................................................................................................. 10 Demand Side Management......................................................................................................... 10 Renewable Resources ................................................................................................................. 10
Changes to Planned Resources ........................................................................................................ 11 Front Office Transactions ........................................................................................................... 11 RFP Wind ................................................................................................................................... 11
Topology Updates and Transmission Changes .................................................................................... 12 Load and Resource Balance ................................................................................................................. 13
Summary of Resource Changes Affecting the Load & Resource Balance...................................... 13 Capacity Charts ............................................................................................................................... 15 Updated Firm Capacity Position Charts .......................................................................................... 18 Summary Load & Resource Balance Observations......................................................................... 21
3. Integrated Gasification Combined Cycle Resource Update............................................................ 23 Technical Update.................................................................................................................................. 23 Effects of Energy Policy Act Incentives............................................................................................... 26 IGCC State Policy Developments ........................................................................................................ 26 Challenges to IGCC Development ....................................................................................................... 28 Conclusion............................................................................................................................................ 29
4. Portfolio Analysis ................................................................................................................................ 31 Introduction .......................................................................................................................................... 31 Portfolio Descriptions........................................................................................................................... 31
2004 IRP Preferred Portfolio........................................................................................................... 31 Portfolio 1: Deferral and Removal of Preferred Portfolio Resources.............................................. 33 Portfolio 2: Path-C Upgrade and Increased Share of Wyoming Coal Plant .................................... 33 Portfolio 3: Portfolio 2 with a Share of the Utah Coal Plant ........................................................... 34 Portfolio 4: Portfolio 3 with Path-C Upgrade Removed ................................................................. 35
Portfolio Evaluation Results................................................................................................................. 36 Deterministic Simulations ............................................................................................................... 36
PacifiCorp – 2004 IRP Update Table Of Contents
- ii -
Preferred Portfolio Evaluation.................................................................................................... 37 Portfolio 1 Evaluation................................................................................................................. 37 Portfolio 2 Evaluation................................................................................................................. 38 Portfolio 3 Evaluation................................................................................................................. 39 Portfolio 4 Evaluation................................................................................................................. 40 Deterministic Evaluation Conclusions ....................................................................................... 41
Stochastic Simulation Results ......................................................................................................... 41 Conclusions .......................................................................................................................................... 44
5. Action Plan Update ............................................................................................................................. 45 Summary of Updated Portfolio ............................................................................................................ 45 Action Plan Update .............................................................................................................................. 45 Action Plan Implementation................................................................................................................. 47
Demand Side Procurement Program ............................................................................................... 47 Supply Side Procurement Program.................................................................................................. 47
Supply Side RFP (formerly RFP 2009) ...................................................................................... 47 Renewables RFP......................................................................................................................... 48
Summary .............................................................................................................................................. 48 Appendix A – Main Assumptions ............................................................................................................ 49
Study Period and Calendar Year Reporting Basis................................................................................ 49 Inflation Rates ...................................................................................................................................... 49 Natural Gas and Wholesale Electric Price Projection Components ..................................................... 49 Gas and Power Price Forecasts............................................................................................................. 50
Wholesale Electricity Prices............................................................................................................ 51 Coal Price Forecasts ............................................................................................................................. 52 Contracts............................................................................................................................................... 53 Stochastic Assumptions........................................................................................................................ 56
Input Values Based on 100 Iterations.............................................................................................. 56 Updated Supply Side Options .............................................................................................................. 59
Appendix B – Portfolio Tables................................................................................................................. 65 Updated Portfolio Capital Costs ........................................................................................................... 65 Updated Portfolio Load and Resource Balances .................................................................................. 66 Portfolio Resource Addition Summary ................................................................................................ 67 Portfolio Scorecard Results .................................................................................................................. 68
Appendix C – IRP Benchmarking Study................................................................................................ 69 Introduction .......................................................................................................................................... 69 Study Methodology .............................................................................................................................. 69 IRP Stakeholder Survey ....................................................................................................................... 72 IRP Common Practices ........................................................................................................................ 72 IRP Practices of Interest ....................................................................................................................... 80 Hydro Hedging Strategy Comparison .................................................................................................. 88 Conclusions .......................................................................................................................................... 90
PacifiCorp – 2004 IRP Update Index of Tables
- iii -
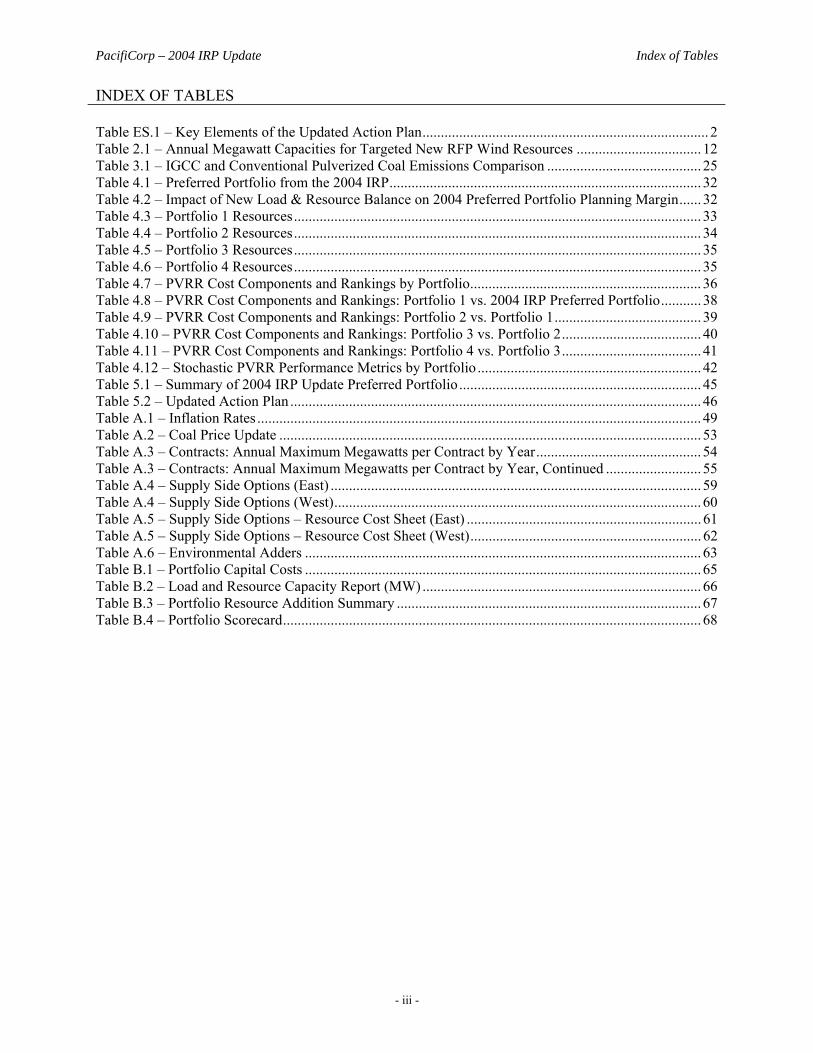
INDEX OF TABLES Table ES.1 – Key Elements of the Updated Action Plan.............................................................................. 2 Table 2.1 – Annual Megawatt Capacities for Targeted New RFP Wind Resources .................................. 12 Table 3.1 – IGCC and Conventional Pulverized Coal Emissions Comparison .......................................... 25 Table 4.1 – Preferred Portfolio from the 2004 IRP..................................................................................... 32 Table 4.2 – Impact of New Load & Resource Balance on 2004 Preferred Portfolio Planning Margin...... 32 Table 4.3 – Portfolio 1 Resources............................................................................................................... 33 Table 4.4 – Portfolio 2 Resources............................................................................................................... 34 Table 4.5 – Portfolio 3 Resources............................................................................................................... 35 Table 4.6 – Portfolio 4 Resources............................................................................................................... 35 Table 4.7 – PVRR Cost Components and Rankings by Portfolio............................................................... 36 Table 4.8 – PVRR Cost Components and Rankings: Portfolio 1 vs. 2004 IRP Preferred Portfolio........... 38 Table 4.9 – PVRR Cost Components and Rankings: Portfolio 2 vs. Portfolio 1........................................ 39 Table 4.10 – PVRR Cost Components and Rankings: Portfolio 3 vs. Portfolio 2...................................... 40 Table 4.11 – PVRR Cost Components and Rankings: Portfolio 4 vs. Portfolio 3...................................... 41 Table 4.12 – Stochastic PVRR Performance Metrics by Portfolio ............................................................. 42 Table 5.1 – Summary of 2004 IRP Update Preferred Portfolio.................................................................. 45 Table 5.2 – Updated Action Plan ................................................................................................................ 46 Table A.1 – Inflation Rates ......................................................................................................................... 49 Table A.2 – Coal Price Update ................................................................................................................... 53 Table A.3 – Contracts: Annual Maximum Megawatts per Contract by Year............................................. 54 Table A.3 – Contracts: Annual Maximum Megawatts per Contract by Year, Continued .......................... 55 Table A.4 – Supply Side Options (East) ..................................................................................................... 59 Table A.4 – Supply Side Options (West).................................................................................................... 60 Table A.5 – Supply Side Options – Resource Cost Sheet (East) ................................................................ 61 Table A.5 – Supply Side Options – Resource Cost Sheet (West)............................................................... 62 Table A.6 – Environmental Adders ............................................................................................................ 63 Table B.1 – Portfolio Capital Costs ............................................................................................................ 65 Table B.2 – Load and Resource Capacity Report (MW)............................................................................ 66 Table B.3 – Portfolio Resource Addition Summary ................................................................................... 67 Table B.4 – Portfolio Scorecard.................................................................................................................. 68
PacifiCorp – 2004 IRP Update Index of Figures
- iv -
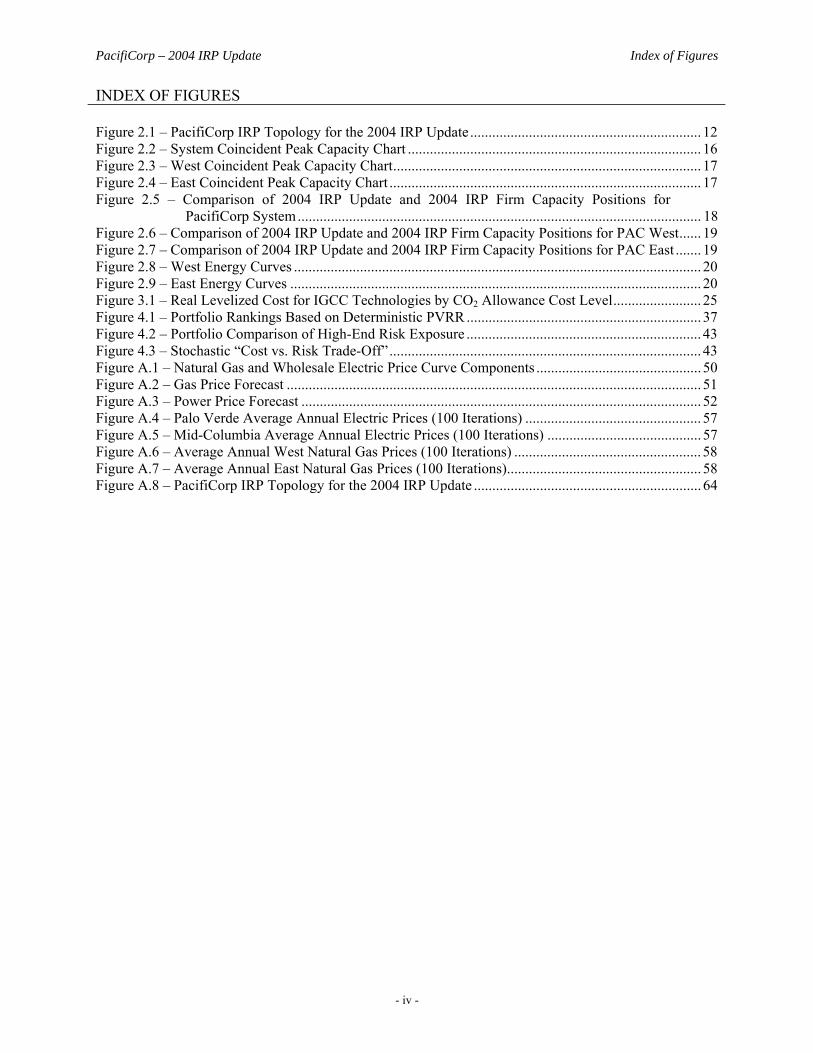
INDEX OF FIGURES Figure 2.1 – PacifiCorp IRP Topology for the 2004 IRP Update ............................................................... 12 Figure 2.2 – System Coincident Peak Capacity Chart ................................................................................ 16 Figure 2.3 – West Coincident Peak Capacity Chart.................................................................................... 17 Figure 2.4 – East Coincident Peak Capacity Chart ..................................................................................... 17 Figure 2.5 – Comparison of 2004 IRP Update and 2004 IRP Firm Capacity Positions for
PacifiCorp System.............................................................................................................. 18 Figure 2.6 – Comparison of 2004 IRP Update and 2004 IRP Firm Capacity Positions for PAC West...... 19 Figure 2.7 – Comparison of 2004 IRP Update and 2004 IRP Firm Capacity Positions for PAC East ....... 19 Figure 2.8 – West Energy Curves ............................................................................................................... 20 Figure 2.9 – East Energy Curves ................................................................................................................ 20 Figure 3.1 – Real Levelized Cost for IGCC Technologies by CO2 Allowance Cost Level........................ 25 Figure 4.1 – Portfolio Rankings Based on Deterministic PVRR ................................................................ 37 Figure 4.2 – Portfolio Comparison of High-End Risk Exposure ................................................................ 43 Figure 4.3 – Stochastic “Cost vs. Risk Trade-Off”..................................................................................... 43 Figure A.1 – Natural Gas and Wholesale Electric Price Curve Components ............................................. 50 Figure A.2 – Gas Price Forecast ................................................................................................................. 51 Figure A.3 – Power Price Forecast ............................................................................................................. 52 Figure A.4 – Palo Verde Average Annual Electric Prices (100 Iterations) ................................................ 57 Figure A.5 – Mid-Columbia Average Annual Electric Prices (100 Iterations) .......................................... 57 Figure A.6 – Average Annual West Natural Gas Prices (100 Iterations) ................................................... 58 Figure A.7 – Average Annual East Natural Gas Prices (100 Iterations)..................................................... 58 Figure A.8 – PacifiCorp IRP Topology for the 2004 IRP Update .............................................................. 64
PacifiCorp – 2004 IRP Update Executive Summary
- 1 -
EXECUTIVE SUMMARY The integrated resource planning process supports PacifiCorp’s objective of providing reliable and least cost electric service to all of its customers while minimizing the substantial risks inherent in the electric utility business. PacifiCorp’s 2004 Integrated Resource Plan (“2004 IRP”, “IRP” or “Plan”) was filed on January 20, 2005. It described prudent future actions to fulfill this objective, based on the best information known at the time. The 2004 IRP was developed with considerable public involvement from customer interest groups, regulatory staff, regulators and other stakeholders. The IRP was submitted to all 6 States that regulate PacifiCorp and was acknowledged in Idaho, Utah, and Washington which are three of the states with IRP Standards and Guidelines containing an acknowledgement process. PacifiCorp has not yet received an acknowledgement order in Oregon. PacifiCorp recognizes that integrated resource planning is a continuous process rather than a one-time or occasional event. The Plan stated (pg. 180) that it is “PacifiCorp’s intention to revisit and refresh the Action Plan no less frequently than annually.” This IRP Update (“Update”) satisfies that commitment. The 2004 IRP proposed the addition of significant new resources over the first 10 years of the 20-year study horizon. These new resources were identified in the 2004 IRP as the Preferred Portfolio, and represented the best balanced mix of resource additions to meet future customer needs. The 2004 IRP identified ten actions that include supply side, demand side, transmission, strategy and policy. The 2004 IRP Preferred Portfolio proposed the addition of 177 Megawatts (MW) of Class 1 DSM and 2,629 MW of thermal generation capacity. In addition to the resources identified in the Plan’s Preferred Portfolio, PacifiCorp also committed to procuring up to 1,200 MW of electricity market purchases. The Company may acquire up to 100 MW of capacity through Qualified Facilities (QF) contracts, and will continue to procure the 1,400 MW of economic renewable resources that were first identified in the 2003 IRP (this includes the 1,100 MW in RFP 2003-B). Finally, 250 average MW (MWa) of energy efficiency will be acquired through identified programs and an additional 200 MWa will be sought through the 2005 DSM RFP which was issued on September 1, 2005. Since filing the 2004 IRP in January 2005, PacifiCorp has updated inputs and assumptions. Updates to the latest resource forecast reveal that the gap between loads and resources is diminishing. This reduction is primarily due to updates in the resource assumptions. With an updated load and resource balance, the Preferred Portfolio now results in an average planning margin of greater than 20 percent from CY 2009–2015. The target planning margin for this time period is 15 percent. Portfolio modifications are necessary to align resources with requirements and the targeted planning margin of 15 percent. This IRP Update includes a comparison of the results of an updated Preferred Portfolio analysis which adjusts resources to maintain a 15 percent planning margin. The changes in the Preferred Portfolio will result in resource modifications, including delays in the online dates for resources currently in the 2004 IRP Preferred Portfolio, elimination of some IRP resources, and the addition of new IRP resource alternatives. The changes in the
PacifiCorp – 2004 IRP Update Executive Summary
- 2 -
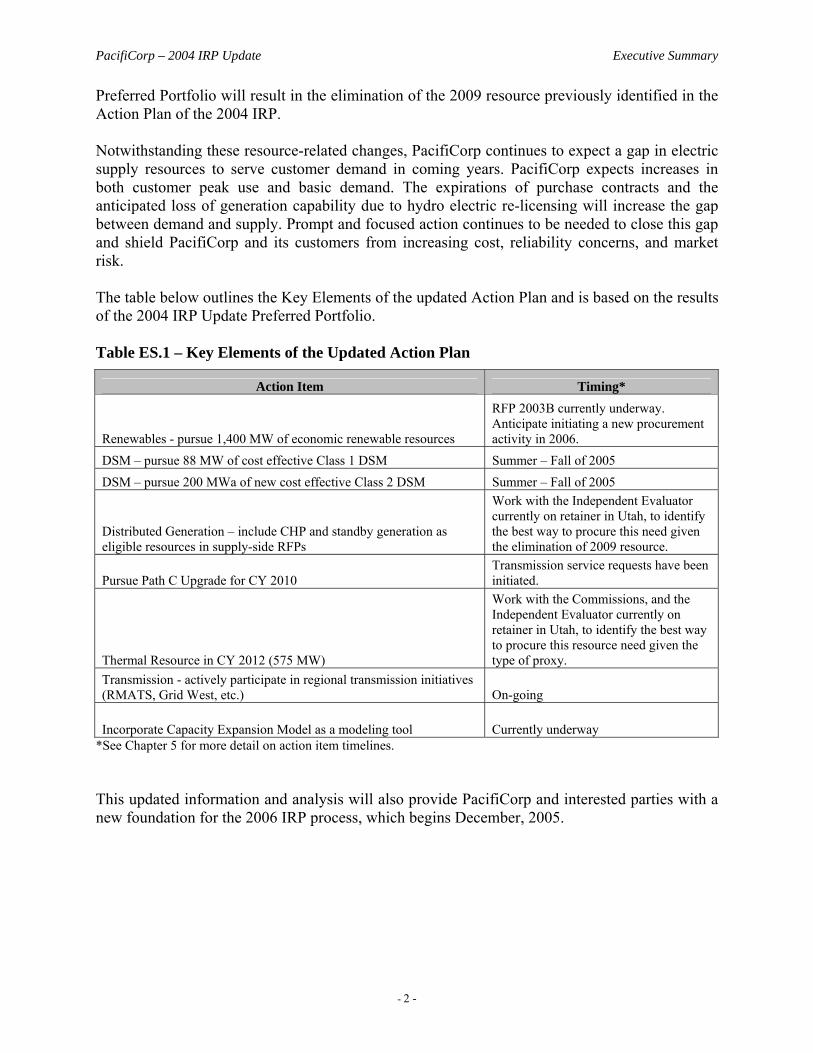
Preferred Portfolio will result in the elimination of the 2009 resource previously identified in the Action Plan of the 2004 IRP. Notwithstanding these resource-related changes, PacifiCorp continues to expect a gap in electric supply resources to serve customer demand in coming years. PacifiCorp expects increases in both customer peak use and basic demand. The expirations of purchase contracts and the anticipated loss of generation capability due to hydro electric re-licensing will increase the gap between demand and supply. Prompt and focused action continues to be needed to close this gap and shield PacifiCorp and its customers from increasing cost, reliability concerns, and market risk. The table below outlines the Key Elements of the updated Action Plan and is based on the results of the 2004 IRP Update Preferred Portfolio. Table ES.1 – Key Elements of the Updated Action Plan
Action Item Timing*
Renewables - pursue 1,400 MW of economic renewable resources
RFP 2003B currently underway. Anticipate initiating a new procurement activity in 2006.
DSM – pursue 88 MW of cost effective Class 1 DSM Summer – Fall of 2005 DSM – pursue 200 MWa of new cost effective Class 2 DSM Summer – Fall of 2005
Distributed Generation – include CHP and standby generation as eligible resources in supply-side RFPs
Work with the Independent Evaluator currently on retainer in Utah, to identify the best way to procure this need given the elimination of 2009 resource.
Pursue Path C Upgrade for CY 2010 Transmission service requests have been initiated.
Thermal Resource in CY 2012 (575 MW)
Work with the Commissions, and the Independent Evaluator currently on retainer in Utah, to identify the best way to procure this resource need given the type of proxy.
Transmission - actively participate in regional transmission initiatives (RMATS, Grid West, etc.) On-going
Incorporate Capacity Expansion Model as a modeling tool Currently underway *See Chapter 5 for more detail on action item timelines. This updated information and analysis will also provide PacifiCorp and interested parties with a new foundation for the 2006 IRP process, which begins December, 2005.
PacifiCorp – 2004 IRP Update Chapter 1 – Changes in the Marketplace and Fundamentals
- 3 -
1. CHANGES IN THE MARKETPLACE AND FUNDAMENTALS
NATURAL GAS AND POWER MARKET UPDATE
Since the 2004 IRP was completed, supply additions in the Western Interconnect have continued apace with aggregate demand growth in the west. Although natural gas fired generation continues to dominate recent supply additions, development of other generation sources is beginning to take shape.
Western Supply/Demand Balance New generation additions in 2005 of about 6,300 MW exceeded estimated aggregate demand growth in the Western Interconnect. Projections of supply and demand growth by the Western Electricity Coordinating Council (WECC) and others show a sufficient margin of generation over demand through the end of this decade. About 83% of 2005 supply additions were natural gas fired generation, as compared with about 94% gas since 2001. New coal-fired generation in the Western Interconnect is gaining momentum, with 740 MW of additions under construction and expected in the next three years, plus 7,900 MW of coal generation in various stages of development. Adding to the balance of supply additions are renewable resource generation projects, primarily wind, spurred by incentives and portfolio standards; 5,350 MW of renewable capacity are in various stages of development with target online dates by 2010.
Natural Gas Markets North American natural gas markets grew tighter during 2005. A series of unfortunate events over the last year have contributed to that tightness by reducing supply of natural gas and increasing demand. These include hurricanes disrupting Gulf of Mexico production in 2004 and 2005 and hotter than normal weather increasing power generation demand for gas during the summer of 2005. Also, an extreme dry water year in Spain resulted in lower hydroelectric generation that increased natural gas power generation requirements and resulted in the diversion of spot cargos of liquefied natural gas (LNG) that otherwise would have supplied the North American market. Tight global crude oil and petroleum product markets continue to support high short term natural gas prices. The gas price forecasts used for this 2004 Update are presented in Appendix A. The medium-term prospects for easing of North American natural gas markets continue to be linked to the development of a robust LNG supply chain for North America. Steady progress continues on development of upstream liquefaction facilities, a large fleet of LNG tankers, and development and expansion of North American regasification capacity. As of mid-August 2005, 19 new LNG regasification facilities or expansions have been permitted, with construction underway on at least six of those. An additional 21 facilities are in the permitting stage and another 19 in pre-permitting stages of development. The US Department of Energy’s Energy Information Administration forecasts LNG imports growing four-fold by 2010 (over 2004) and almost doubling again by 2015, providing much-needed supply relief to North American markets.
PacifiCorp – 2004 IRP Update Chapter 1 – Changes in the Marketplace and Fundamentals
- 4 -
Passage of major federal energy legislation and additional development of federal power plant emissions regulations are two other market related events of the last year. These are described elsewhere in this IRP Update. The developments described above are generally supportive of the continued functioning of healthy wholesale power markets, consistent with the broad assumptions of the 2004 IRP and are reflected in the market price forecasts used in this IRP Update. These power market price forecasts are presented in Appendix A.
CLIMATE CHANGE POLICY UPDATE
Since the 2004 IRP was issued, policies related to climate change have continued to develop within the regional, national, and global arenas. Internationally, the Kyoto Protocol took effect on February 16, 2005 after Russian ratification in November. Without U.S. involvement, Russia remained the final nation with the ability to push cumulative emissions over the 55% threshold required to trigger the protocol’s enactment. The 126 nations involved will now work to reduce carbon dioxide emissions to 7% below 1990 levels by 2012. The United States will not participate, and instead has joined the Asia-Pacific Partnership for Clean Development. This partnership between Australia, Japan, China, India, and South Korea works to ease the transfer of clean energy technologies, but lacks specific targets on greenhouse gases. At the federal level, three major proposals were considered by Congress leading up to passage of the energy bill. Once again, Senators McCain and Lieberman proposed a cap on emissions along with a permit trading system. However, inclusion of incentives for nuclear energy eroded support garnered in earlier votes, leading to a 38-60 defeat of the Climate Stewardship Act. A similar, but less stringent, proposal came from Senator Jeff Bingaman. Originally offered as an amendment to the energy bill, this proposal was based on work by the National Commission on Energy Policy and would establish an economy wide greenhouse gas emissions intensity rate cap starting in 2010. The proposal included a $7 per ton “safety valve” carbon price cap. Though the Bingaman proposal did not reach a vote, it is expected to resurface in the future, as some bipartisan support was evident. Through hearings and discussions on climate change, the Senate acknowledged for the first time that greenhouse gases are contributing to global warming. In another first, a subcommittee on climate change was created by Senator Ted Stevens, chair of the Commerce Committee. A third proposal led by Senator Chuck Hagel and cosponsored by Senator Mark Pryor offers financial incentives for research and investments, as well as improvements in the transfer of technology to developing countries, similar to the Asia-Pacific Partnership. Hagel’s bill passed the senate 66-29, but is not expected to alter the climate landscape for utilities. In the absence of strong federal guidance on the issue, policies at some regional and local levels have matured over the past year. A Renewable Portfolios Standard was passed by initiative in Colorado that requires 10% of state energy needs to be met by renewable energy by 2015. Oregon developed a plan to reduce greenhouse gases, while California continued to investigate a cap and trade system. A nine state partnership in the northeast, the Regional Greenhouse Gas Initiative (RGGI), came closer to agreement on a plan to cap utility emissions of carbon dioxide
PacifiCorp – 2004 IRP Update Chapter 1 – Changes in the Marketplace and Fundamentals
- 5 -
at 150 million tons starting in 2009, with reductions beginning in 2015. Oregon, Washington, and California are discussing a similar regional structure for the west coast. North Carolina is poised to become the first southern state to act on global warming after both chambers of congress passed a bill to commission a state climate impact study. While climate change policy continues to develop, the most likely policy scenarios continue to support the timing and magnitude of PacifiCorp’s existing carbon adder. The adder values, updated for the new inflation forecast, are reported in Appendix A.
IMPACTS OF THE ENERGY POLICY ACT OF 2005
Congress passed the Energy Policy Act of 2005 (EPACT2005, or the Act) in July and the President signed the bill on August 8th, 2005. The new Act, the first omnibus energy policy legislation passed since 1992, includes a number of provisions that may impact generation, facility siting, hydropower relicensing, and emerging energy technologies. Many of the provisions of EPACT2005 will require rulemakings by various federal agencies (such as the Department of Energy and the Federal Energy Regulatory Commission) before the impacts of the Act can be fully assessed. While EPACT2005 sets a policy framework, many of the incentives require appropriations from Congress in order to take affect. The availability of appropriations to fund these provisions is highly uncertain given the reality of increasing federal deficits and pending budget priorities such as the federal response to Hurricane Katrina. However, a number of provisions contained in the EPACT2005 clearly have the potential to affect PacifiCorp’s resource planning and are discussed below.
Transmission Siting Designation of National Interest Electric Transmission Corridors. The EPACT2005 requires the Department of Energy (“DOE”) to periodically report on transmission congestion and designate, as a “national interest electric transmission corridor”, an area with inadequate transmission that is adversely affecting consumers. The Federal Energy Regulatory Commission (“FERC”) is empowered to grant one or more permits for the construction of a new transmission facility or the modification of an existing facility within in a national interest electric transmission corridor, provided the FERC finds that state approval has been withheld or is not possible, or that a state-granted approval is conditioned such that the construction or modification will not significantly reduce transmission congestion in interstate commerce or is not economically feasible. In addition, the FERC must determine that the facilities to be authorized will be used for the transmission of electricity in interstate commerce, the construction or modification is consistent with the public interest, will significantly reduce transmission congestion in interstate commerce and protect or benefit consumers, will enhance energy independence, and will maximize the transmission capabilities of existing towers or structures. Rights-Of-Way. If FERC grants a permit for the construction or modification of existing transmission facilities within a national interest electric transmission corridor, the permit holder can, where necessary, acquire a right of way over private lands within that corridor pursuant to
PacifiCorp – 2004 IRP Update Chapter 1 – Changes in the Marketplace and Fundamentals
- 6 -
eminent domain. Once acquired, the right of way cannot be used for any other purpose and will terminate upon the termination of the use for which it was acquired. Coordination of Federal Authorizations. The EPACT2005 also tasks the DOE with the responsibility of coordinating all applicable Federal authorizations, including such permits, special use authorizations, certifications, opinions, or other approvals as may be required under Federal law, in order to ensure timely and efficient review and permit decisions for siting a transmission facility. Such coordination would also include any related environmental reviews. Each Federal land use authorization granted for an electricity transmission facility shall be issued for a period of time commensurate with the anticipated use of the facility and with appropriate authority to manage the right-of-way for reliability and environmental protection. Interstate Compacts. EPACT 2005 also suggests that three or more contiguous states may enter into an interstate compact (subject to further congressional authorization) to establish a regional transmission siting agency, and facilitate siting of future electric transmission facilities within those states, other than those on Federal property. Typically, FERC will have no authority to approve the siting of a transmission facility in a state that is a member of a regional transmission siting agency, unless the members of the compact are in disagreement and certain conditions are met. Third-Party Financing of Transmission Facilities. Under certain circumstance, the Secretary of Energy, acting through the Western Area Power Administration (“WAPA”) and/or the Southwestern Power Administration (“SWPA”) may acquire existing facilities or construct new facilities in the WAPA and SWPA service areas, if the Department of Energy determines that the proposed project is located in a national interest electric transmission corridor and will alleviate transmission congestion. EPACT2005 also requires FERC to provide incentives (presumably in the form of increased return on equity) for investments in new transmission facilities.
Renewable Energy Production Tax Credit The renewable energy production tax credit (PTC), which was set to expire at the end of 2005, has been extended for another two years. Additionally, the eligibility period for power production from open-loop biomass, geothermal, small irrigation, landfill gas and municipal solid waste projects is increased from 5 to 10 years. Finally, incremental hydropower production resulting from efficiency improvements or capacity expansion at existing dams was added to the list of production technologies eligible for the PTC. PacifiCorp expects that extension of the PTC should aid the procurement of new wind and other renewable resources since uncertainty about the availability of the PTC has been a significant challenge for renewable energy suppliers.
Clean Coal Incentives Title IV, Subtitle A of EPACT2005 authorizes up to $200 million per year for fiscal years 2006 through 2014 to be appropriated for the Clean Coal Power Initiative, with 70 percent of the funds to be expended on coal-based gasification technologies, including Integrated Gasification Combined Cycle (IGCC). The bill requires the DOE to set technical milestones to reach the efficiency and emissions levels spelled out for qualifying clean coal projects and upgrades to existing projects. The Secretary of Energy is required to report on the progress of funded projects in meeting the established milestones.
PacifiCorp – 2004 IRP Update Chapter 1 – Changes in the Marketplace and Fundamentals
- 7 -
Specific language requires the Department of Energy, subject to the availability of appropriated funds, to establish an IGCC project located in a western state at an altitude of at least 4,000 feet to demonstrate the use of coal with an energy content of not more than 9,000 Btu/lb. If economically feasible, the project can also demonstrate the ability to use coal mined in the west of up to 13,000 Btu/lb. The project must also be capable of removing and sequestering CO2 emissions. Either loan guarantees or federal cost sharing would be available, subject to appropriations. Additionally, the act reauthorizes the Clean Air Coal Program and authorizes the Secretary of Energy to expend up to $3 billion, subject to appropriations, to facilitate production and generation of coal-based power, including gasification, and advance the deployment of pollution control equipment to meet current and future obligations of coal-fired generation units regulated under the Clean Air Act. Title XVII of the Act provides loan guarantees for up to 80 percent of qualifying gasification and other eligible technologies. Projects must meet certain emissions performance criteria in order to qualify for the guarantees. Qualifying projects must have an assured revenue stream to cover project capital and operating costs that is approved by the Secretary of Energy and relevant state Public Utility Commissions (PUCs), and be designed to accommodate carbon capture equipment. The title also provides an option for the project owner to pay for the federal cost of scoring their loan guarantee, which will enable the program to provide guarantees even in the absence of appropriations. There is no cap on the amount of loan guarantees available. Title XII of the Act creates investment tax credits (ITC) available for IGCC, industrial gasification, and advanced combustion facilities. IGCC projects may receive a 20 percent ITC and the program may provide up to $800 million of credits. The available credits are to be allocated roughly equally between projects that use bituminous, subbituminous, and lignite coal. Other advanced coal-based projects may receive a 15 percent ITC and the program may provide up to $500 million of credits. All projects must be certified by the Secretary of Treasury in consultation with the Secretary of Energy. These incentives and their potential impact on IGCC as a resource choice are discussed in Chapter 3.
Hydropower The bill contains a number of provisions relating to the hydro relicensing process. The bill establishes a hearing process in which mandatory license conditions may be challenged and provides applicants with the ability to propose alternative environmental conditions that provide resource protection while reducing costs and/or improving electricity production. Additionally, the bill authorizes incentives for new turbine installations at existing dam sites where no modification to the impoundment or diversion structure is necessary as well as for projects that improve efficiency at existing dams. These new installations or improvements must occur within ten years of enactment of the bill and incentive payments are available for up to ten years, subject to certain limitations and restrictions.
PacifiCorp – 2004 IRP Update Chapter 1 – Changes in the Marketplace and Fundamentals
- 8 -
Mandatory Reliability Standards EPACT2005 seeks to improve electrical reliability by authorizing FERC to designate an independent Electric Reliability Organization (ERO) to develop and enforce bulk power system reliability standards. The ERO will propose reliability standards or modifications to existing FERC standards to FERC, which will approve the standard if the Commission finds the standards to be “just, reasonable, and not unduly discriminatory or preferential, and in the public interest.” The ERO will also conduct periodic assessments of the reliability and adequacy of the North American bulk power system. FERC can authorize the ERO to delegate authority to propose and enforce reliability standards to a regional entity. Additionally, a regional advisory body may be formed to advise the ERO, regional entity, or FERC. FERC must establish a regional advisory body if at least two-thirds of the states within a region accounting for more than one-half of the load within that region petition the Commission to do so. The language in the Act specifically states that the provision does not authorize the ERO or FERC to require the construction of additional generation or transmission facilities. States retain the authority to take action to ensure the safety, adequacy, and reliability of electric service. State reliability regulations will not be preempted unless a state action is inconsistent with a federal reliability standard. The effect of this provision on PacifiCorp’s resource planning effort is unknown at this time. It is likely that reliability standards promulgated under this provision may impact the planning reserve margin used by PacifiCorp or may affect the operation of the transmission system in a manner that affects resource decisions, plant siting, or transmission requirements.
Conclusion PacifiCorp is currently evaluating the provisions of the recently passed EPACT2005 in order to determine the impacts the new law may have on the economics of new resource alternatives. As many of the incentive provisions of the law are subject to the availability of appropriations it is not yet known if they will actually impact the economics of new resource options, and if so, to what degree. PacifiCorp will continue to follow these policy developments and federal appropriations to ensure that the IRP process is well-informed with the most accurate assumptions about infrastructure availability and resource costs.
PacifiCorp – 2004 IRP Update Chapter 2 – Resource Needs Assessment
- 9 -
2. RESOURCE NEEDS ASSESSMENT
INTRODUCTION
This chapter presents the results of the updated analysis of PacifiCorp’s Load & Resource (L&R) Balance. This information serves as the basis for evaluating the sufficiency of the 2004 IRP Preferred Portfolio to meet any changes in the resource deficit outlook for the IRP planning horizon. The chapter first covers the load and resource status, presenting revisions to system modeling assumptions that impact the L&R Balance. Modeling assumptions related to existing PacifiCorp resources are covered first, followed by assumptions for Planned Resources; that is, resources included in the L&R Balance that PacifiCorp is currently taking actions to acquire. Finally, updated L&R Balance results are presented showing modifications to resource requirement forecasts, along with observations concerning how the 2004 IRP Preferred Portfolio is impacted. (Note that all data in the 2004 IRP Update are reported on a Calendar Year basis unless noted otherwise.)
LOAD FORECAST
The load forecast used in the IRP is updated every two years and is a 20-year hourly forecast of expected loads. This forecast represents energy and demand use by customers for each load center on PacifiCorp’s system. The last forecast was prepared in March 2004, and was used for both the 2004 IRP and this 2004 IRP Update. The next load forecast is scheduled for release in March 2006. PacifiCorp is in the process of adopting new end-use forecasting models to support the IRP and other forecasting requirements: the Residential End-Use Energy Planning System (REEPS) and the Commercial End-Use Planning System (COMMEND), both developed by the Electric Power Research Institute (EPRI).
RESOURCE SITUATION
Changes to Existing Resources Existing Resources are defined as resources currently in operation or for which procurement contracts have been signed.
New Contracts There have been several new contract procurements since the 2004 IRP filing, totaling 354 MW of capacity. Of this total, 164 MW are Qualifying Facility (QF) contracts, and 65 MW are renewables. Details concerning these new contracts are provided in Table A.3 of Appendix A. The total amount of new Front Office Transactions for the 2006 – 2009 period is 1,000 MW.
Treatment of Qualifying Facilities and Interruptible Load Contracts In response to public comments received on the 2004 IRP, PacifiCorp changed its assumption regarding the handling of QF and interruptible contract extensions. All QF and interruptible contracts are now assumed to be extended to the end of the study period. The impact is discussed in the loads and resources section of the report. This assumption better reflects the expectation that QF and interruptible contracts will likely be renewed once they expire.
PacifiCorp – 2004 IRP Update Chapter 2 – Resource Needs Assessment
- 10 -
Most of the QF contracts were considered firm resources and thus were included in calculation of both the capacity and energy positions of the L&R Balance. However, the Tesoro, Kennecott and MagCorp QF contracts are considered non-firm and, as such, were omitted from the capacity position calculation because they cannot be relied upon at the peak periods. However, these three contracts were included in the calculation of the monthly energy positions for the L&R Balance. At the time of the 2004 IRP filing, these planned contracts were represented as firm since the service type (firm or non-firm) of the contracts was unknown. Since it is now known that these contracts are non-firm, omitting them from the capacity position of the L&R Balance is appropriate and prudent.
Thermal Plant Lives PacifiCorp changed its assumption regarding retirement dates for most of PacifiCorp’s thermal stations. PacifiCorp is now using plant life extension as a proxy for resource replacement. Thermal plants are modeled to operate past the IRP’s 2006–2025 study period, with the exception of the following units: • Carbon 1 & 2 – retirement at year-end 2020; no change from the 2004 IRP • Little Mountain 1 – retirement in 2012 pending evaluation of steam contract expiration; the
2004 IRP assumed retirement in 2006 • Gadsby 1, 2, 3 – retirement at year-end 2017; no change from the 2004 IRP Note this new assumption is not meant to presume a particular replacement strategy based on economics or regulatory factors, or to establish different extension dates from what was reported in PacifiCorp’s 2002 Depreciation Study. Changes at plants intended to prolong their lives will be done in accordance with applicable law.
Hydroelectric Resources The hydro forecast is officially updated semi-annually. The IRP has been updated for the May, 2005 forecast which, over the 20 year study period, reflects an approximate 7% decline in generation. This was mainly attributed to improved Mid-C information, a better understanding of the updated Grant contract, and updated operational constraints.
Demand Side Management A new Class 1 DSM program for Utah, called Load Lightener, has been added as an Existing Resource. This 10-year program starts in 2005, and is forecasted to build to a total of 30 MW of curtailable load by summer of 2008. The program is targeted to commercial and industrial customers with significant lighting requirements, and provides steady electricity energy savings in addition to the ability to curtail load further during system peak load conditions. The load reduction uses EnergySaver™ technology to decrease the power supplied to ballasted lighting systems without abrupt voltage changes or noticeably affecting visible light. For modeling purposes, the curtailable load is available for 250 hours during the daily peak period (2 – 8 pm on weekdays) for the summer months.
Renewable Resources A line item for renewable resources was added to the load and resource balance for this 2004 IRP Update (Appendix B). Resources included in this category include the Blundell geothermal plant and wind projects for which PacifiCorp owns or holds the output rights to: Foote Creek 1,
PacifiCorp – 2004 IRP Update Chapter 2 – Resource Needs Assessment
- 11 -
Rock River and Combine Hills. In addition, it includes the wind energy storage contracts such as Foote Creek 2-4 and Stateline. Adding to this list of renewable resources is a newly signed power purchase agreement for the output of a 64.5 MW wind-powered electric generating project to be built about 10 miles southeast of Idaho Falls, Idaho. The 20-year agreement is with Wolverine Creek Energy LLC, owned and operated by Invenergy, a developer, owner and operator of power generation and energy delivery assets headquartered in Chicago. This 64.5 MW wind resource is modeled in the Goshen bubble for the IRP Update model topology. Applying the 20% peak capacity credit assumption for wind resources, the Wolverine Creek resource will add 13 MW of firm capacity during peak load hours. The Planned Resources section below will describe how the “RFP Wind” resources were adjusted to reflect the addition of this planned wind resource.
Changes to Planned Resources The second resource group in the resource base data is referred to as Planned Resources. This group is comprised of resources that PacifiCorp has firmly decided to pursue and is taking actions to acquire. For the 2004 IRP Update, they include 1,300 MW of RFP Wind from the 2003 IRP (adjusted downward from 1,400 MW to account for the Wolverine Creek wind contract), up to 1,200 MW of Front Office Transactions and 100 MW of Utah Qualifying Facility contracts.
Front Office Transactions No change was made to the annual maximum Front Office Transactions (FOT) amount for the 2004 IRP Update; it remains up to 1,200 MW. However, for 2006 through 2009, the transaction amounts have been adjusted to account for completed transactions (See Table B.2 in Appendix B for the annual FOT planning targets). In addition, they were adjusted down slightly in the west in the early years because the new L&R Balance did not require the same level of transactions. In addition to the change in the amount of Front Office Transactions, the modeling methodology has been updated. In the 2004 IRP, Front Office Transactions were dispatched only if all of the capacity was needed; that is, if the system was long, zero energy was dispatched, and if the system was short, full capacity was dispatched. PacifiCorp has changed the modeling of these transactions to reflect dispatching in 50 MW increments to represent market price interaction with incremental dispatch decisions.
RFP Wind RFP Wind resources were modeled as Planned Resources that serve as proxies for PacifiCorp’s expected acquisition of 1,400 MW of wind resources through 2012. As discussed in the section on Existing Resources, PacifiCorp recently signed a 20-year agreement to purchase the output of the 64.5 MW Wolverine Creek wind project. This was modeled for the IRP Update as an Existing Resource, and thus a 100 MW block of the RFP Wind resources was removed to reflect this addition. The adjustment of 100 MW (vs. 64.5 MW) was necessary because the RFP Wind resources were modeled in 100 MW increments. As further adjustments are made to reflect future wind acquisitions, it is expected that the total adjustments will closely reflect total
PacifiCorp – 2004 IRP Update Chapter 2 – Resource Needs Assessment
- 12 -
acquisitions. Table 2.1 below shows the annual capacities of the RFP Wind resources as modeled for both the 2004 IRP and the 2004 IRP Update. Table 2.1 – Annual Megawatt Capacities for Targeted New RFP Wind Resources
2005 2006 2007 2008 2009 2010 2011 2012 2013 2014 2015 2004 IRP 100 300 500 700 900 1,100 1,300 1,400 1,400 1,400 1,400 2004 Update 0 200 400 600 800 1,000 1,100 1,300 1,300 1,300 1,300
TOPOLOGY UPDATES AND TRANSMISSION CHANGES
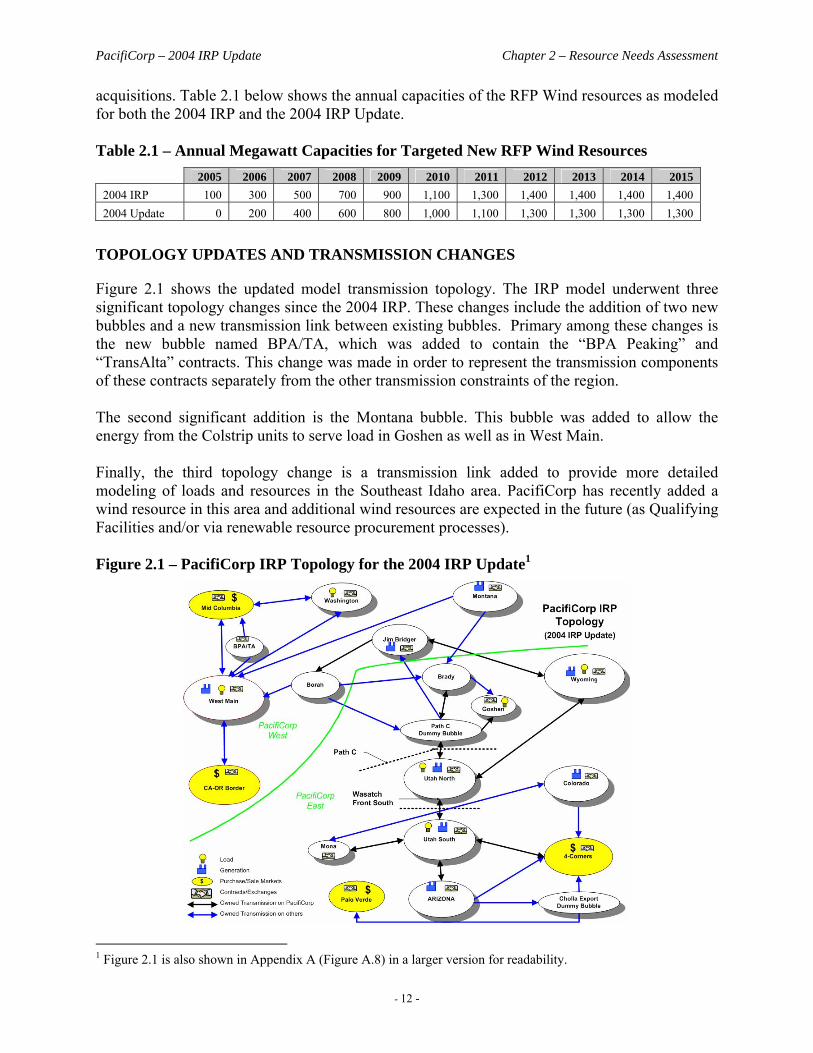
Figure 2.1 shows the updated model transmission topology. The IRP model underwent three significant topology changes since the 2004 IRP. These changes include the addition of two new bubbles and a new transmission link between existing bubbles. Primary among these changes is the new bubble named BPA/TA, which was added to contain the “BPA Peaking” and “TransAlta” contracts. This change was made in order to represent the transmission components of these contracts separately from the other transmission constraints of the region. The second significant addition is the Montana bubble. This bubble was added to allow the energy from the Colstrip units to serve load in Goshen as well as in West Main. Finally, the third topology change is a transmission link added to provide more detailed modeling of loads and resources in the Southeast Idaho area. PacifiCorp has recently added a wind resource in this area and additional wind resources are expected in the future (as Qualifying Facilities and/or via renewable resource procurement processes). Figure 2.1 – PacifiCorp IRP Topology for the 2004 IRP Update1
1 Figure 2.1 is also shown in Appendix A (Figure A.8) in a larger version for readability.
PacifiCorp – 2004 IRP Update Chapter 2 – Resource Needs Assessment
- 13 -
LOAD AND RESOURCE BALANCE
This section presents the changes that have occurred to the PacifiCorp Load & Resource Balance since the 2004 IRP was filed. The factors causing the changes are discussed first, followed by charts showing the degree and timing of the L&R changes. Finally, the implications of these L&R changes for this IRP Update are discussed.
Summary of Resource Changes Affecting the Load & Resource Balance There are several resource changes that were made to the L&R Balance and which, in aggregate, provide a different outlook concerning PacifiCorp’s resource situation relative to that of the 2004 IRP. The resource changes can be classified into the following four categories: • Counting differences. In response to regional planning initiatives, PacifiCorp reevaluated
the way that it treats Hydro resources in the calculation of capacity positions for this IRP Update. However, its treatment in calculating the monthly energy positions did not change.
• Resource additions. As outlined above, new Planned Resources were added to the L&R
Balance, such as the Wolverine Creek wind contract. These had a direct effect on both the capacity and energy positions of the L&R position.
• Changes due to public comments. A number of suggestions were received from the public
in the course of the 2004 IRP, and were incorporated into the assumptions underlying this L&R Balance. Notable among these was the suggestion that existing Interruptible and QF contracts be extended to the end of the IRP study period. Extending the Interruptible resources affects the capacity position significantly, but has a lesser effect on the energy position. Extending the firm QF resources affects both. Extending the non-firm QF resources only impacts the energy position.
• Reconciliation to PacifiCorp’s GRID model. Earlier this year a detailed reconciliation
between the IRP and GRID models was performed.2 The reconciliation resulted in a number of long-term sales and purchase contracts being reconfigured in both models in order to keep the two models synchronized. These contract changes affect both the capacity and energy positions of the L&R Balance.
Below are summaries on the change status of the capacity positions of each L&R Balance line item relative to that of the 2004 IRP. The associated average MW amount differences are shown for most line items. These average differences cover the ten-year period from 2006 through 2015. Thermal – There were no changes to the aggregate total capacity. On the east, the Desert Power QF was taken out and put into the new QF line item so that the annual MW values are less by 90 MW. (Desert Power was rated at 90 MW in the 2004 IRP; for this IRP Update, it is rated at 95 MW.) 2 The GRID model is PacifiCorp’s in-house regulatory decision support model. Its main function is to generate Net Power Cost estimates for rate case filings and other purposes.
PacifiCorp – 2004 IRP Update Chapter 2 – Resource Needs Assessment
- 14 -
Hydro – Hydro resources changed in this L&R Balance. As mentioned above, this is due to the change in how hydro resource capacities were counted. For the 2004 IRP, they were counted by expected generation which is computed by the VISTA model prior to being entered into the IRP model. For this IRP Update, this assumption was changed to count Hydro by the maximum capacity that is operationally sustainable for one hour before reserves (Hydro Availability). This resulted in a slight increase in the east of 6 MW. In the west, owned hydro (mostly Swift 1 and Merwin) increased by 239 MW while Mid-C contracts increased by 84 MW. This change in how Hydro resources are counted impacts capacity positions but has no impact on the energy positions of the L&R Balance. DSM – DSM increased in the east by 28 MW due to the addition of the new Utah Class 1 DSM program (Load Lightener).3 There were no DSM changes in the west. These changes impact both the capacity and energy positions of the L&R Balance. Renewable – Renewable resources increased in the east due to the addition of the 64.5 MW Wolverine Creek wind contract. Applying the assumed 20% capacity credit for wind resources this contract added 13 MW of peak load carrying capacity for the capacity L&R balance. Energy position was affected by amounts reflecting the nameplate capability. This addition resulted in a reduction of the RFP Wind resources, which will be described shortly. There were no changes in this line item on the west. Purchase – Long-term purchases and exchanges increased in the east in the early years due to the completion of Front Office Transactions. However, there were decreases in the east (83 MW) and west (59 MW) in the later years due to the IRP/GRID model reconciliation. These changes had a similar impact on the monthly energy positions as they did on the annual capacity positions. QF – Since the 2004 IRP, one firm QF resource (ExxonMobil) was added to the L&R Balance. In response to public comments PacifiCorp changed IRP modeling assumptions and extended all QF contracts to the end of the study period. The firm QF contract additions and extensions increased QF capacity by 122 MW in the east and 15 MW in the west. This has an impact on both the annual capacity and monthly energy positions since the QF contracts are flat annual products. Additionally, there were three QF contracts (Kennecott, Tesoro and USMag) that were considered non-firm and thus did not count towards the annual capacity positions. However, they did impact the monthly energy positions. Interruptible – There was a 185 MW increase in Interruptible resources in the east due to the assumed contract extensions, as well as the inclusion of the 125 MW MagCorp contract that, for the 2004 IRP, was assumed to expire in 2004. There were no Interruptible resource changes in the west. As with QF resources, this assumption change was made in response to public feedback during the 2004 IRP process. This assumption change had a significant impact on annual capacity positions but had a comparatively small impact on monthly energy positions since Interruptible load contracts are executed over a relatively small number of hours. Transfers – There was no change in the assumption of a net west-to-east transfer of 454 MW. 3 The 28 MW average reflects the phase-in of the capacity, reaching the annual peak of 30 MW by 2008.
PacifiCorp – 2004 IRP Update Chapter 2 – Resource Needs Assessment
- 15 -
RFP Wind – There was no change in RFP Wind resources in the east. However, in the west, amounts were adjusted based on the Wolverine Creek wind purchase. It is noteworthy that the Wolverine Creek purchase is executed in the east (Goshen). RFP Wind was adjusted in the west because the west is where the earliest blocks of the planned wind resources were modeled in the 2004 IRP and the 2004 IRP Update. This change had a larger impact on monthly energy positions than annual capacity positions because of the 20% capacity contribution assumption for wind resources. Front Office Transactions – These were reduced in the early years in the east since transactions have been executed. They were adjusted down slightly in the west in the early years because the new L&R Balance did not require the same level of transactions. These changes impacted monthly energy positions and annual capacity positions similarly in the west because they are flat annual products. In the east the third-quarter energy positions were affected similarly to the annual capacity positions since they are third-quarter products. QF Planned – There were no changes to the Planned QF resources on either side of the PacifiCorp system. Load – This IRP Update uses the same March 2004 load forecast as was used in the 2004 IRP. Thus, there were no changes to these line items. Sale – Due to the IRP/GRID model reconciliation, there was a decrease in sales (50 MW) in the east and an increase (17 MW) in the west. These changes impact the annual capacity positions and monthly energy positions in a similar way. It can be seen from the foregoing discussion that the trend of the net changes in the various resource categories is towards a longer position on both sides of the PacifiCorp system. This will be illustrated in the next section where peak-hour obligations and resources are compared to reveal the new annual resource positions for this IRP Update.
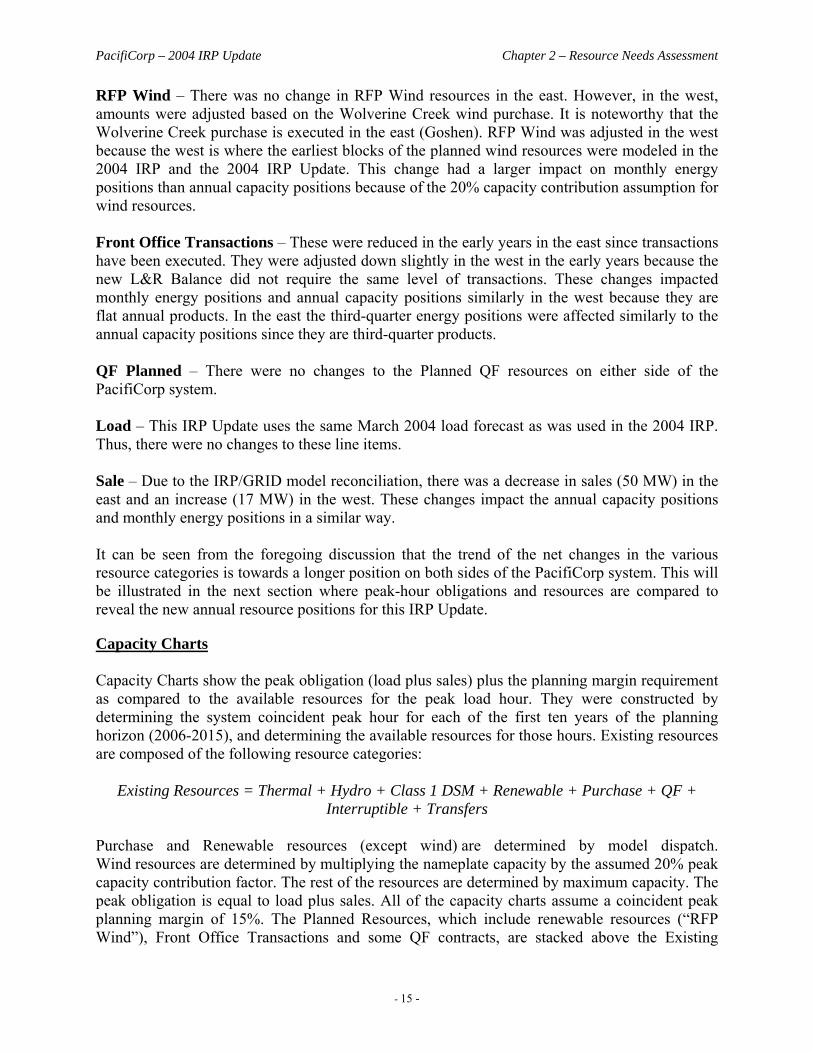
Capacity Charts Capacity Charts show the peak obligation (load plus sales) plus the planning margin requirement as compared to the available resources for the peak load hour. They were constructed by determining the system coincident peak hour for each of the first ten years of the planning horizon (2006-2015), and determining the available resources for those hours. Existing resources are composed of the following resource categories:
Existing Resources = Thermal + Hydro + Class 1 DSM + Renewable + Purchase + QF + Interruptible + Transfers
Purchase and Renewable resources (except wind) are determined by model dispatch. Wind resources are determined by multiplying the nameplate capacity by the assumed 20% peak capacity contribution factor. The rest of the resources are determined by maximum capacity. The peak obligation is equal to load plus sales. All of the capacity charts assume a coincident peak planning margin of 15%. The Planned Resources, which include renewable resources (“RFP Wind”), Front Office Transactions and some QF contracts, are stacked above the Existing
PacifiCorp – 2004 IRP Update Chapter 2 – Resource Needs Assessment
- 16 -
Resources at the top of each chart. The gap between the peak obligation and PacifiCorp’s total available resources represents the annual capacity deficit. Figures 2.2 through 2.4 present the various capacity charts developed for the updated Load & Resource Balance. In the System and West Capacity Charts there are a few noticeable declines in resources and loads in the 10-year period, mostly caused by the expiration of existing contracts. For example, the BPA Peaking contract expires August 2011 and thus causes the decline in capacity in 2012. Similarly, the expiration of the Clark County Load Service contract causes the drop in capacity and obligation in 2008. Figure 2.2 – System Coincident Peak Capacity Chart
0
2,000
4,000
6,000
8,000
10,000
12,000
14,000
2006 2007 2008 2009 2010 2011 2012 2013 2014 2015Calendar Year
MW
Existing Resources
Resource Deficit
Peak Obligation + Planning Margin
Planned Resources
Resources 11,996 12,331 11,642 12,085 12,206 12,253 11,579 11,603 11,428 11,487
Obligation+15% 11,603 11,887 11,552 11,838 12,107 12,427 12,675 13,061 13,454 13,840
PacifiCorp – 2004 IRP Update Chapter 2 – Resource Needs Assessment
- 17 -
Figure 2.3 – West Coincident Peak Capacity Chart
0
1,000
2,000
3,000
4,000
5,000
6,000
7,000
8,000
9,000
10,000
2006 2007 2008 2009 2010 2011 2012 2013 2014 2015Calendar Year
MW
Existing Resources
Resource Deficit
Peak Obligation + Planning Margin
Planned Resources
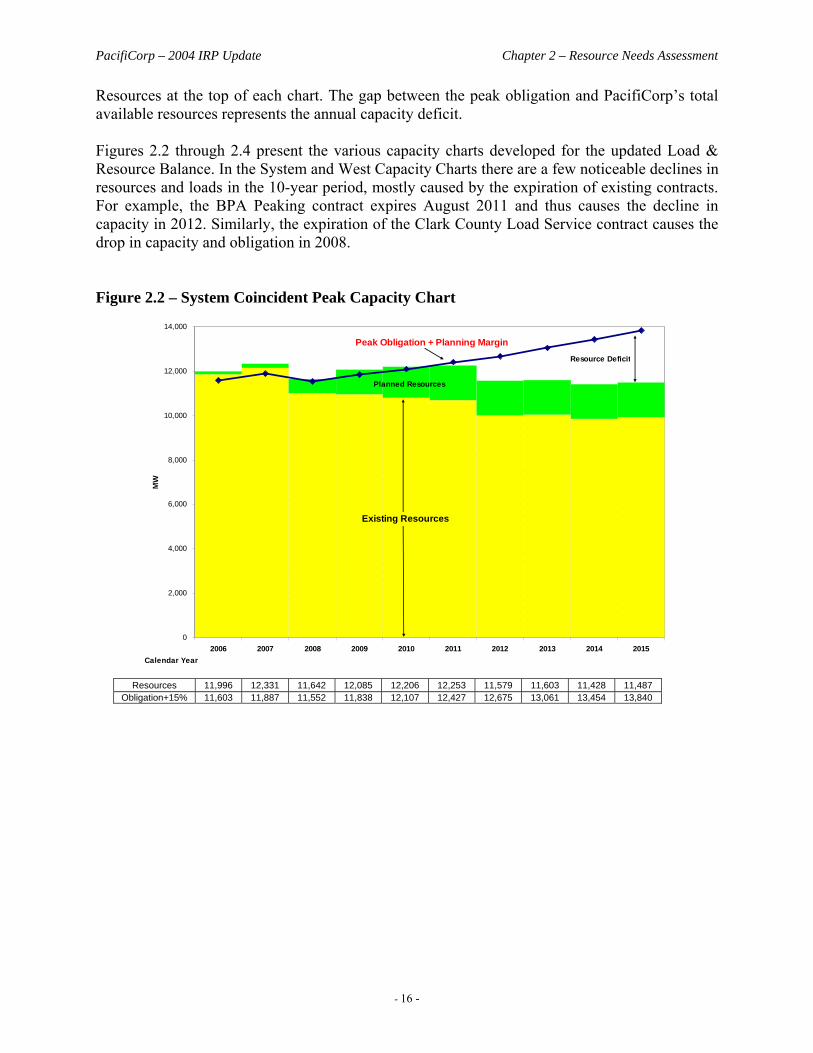
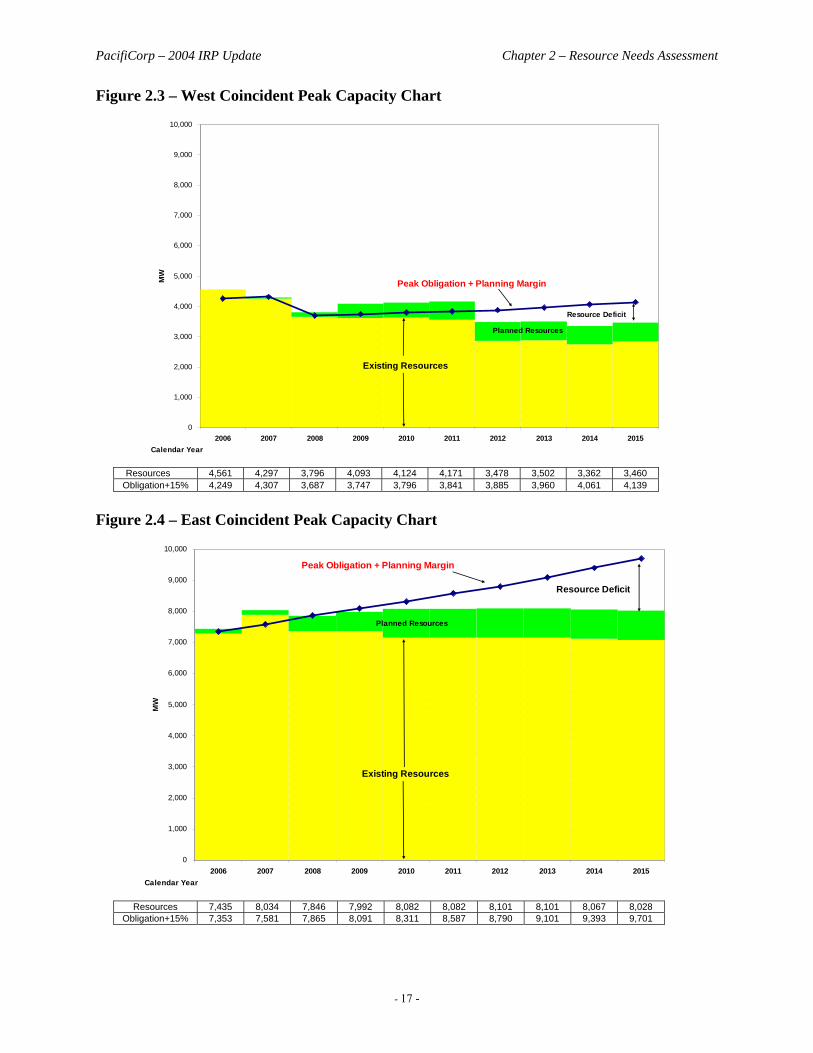
Resources 4,561 4,297 3,796 4,093 4,124 4,171 3,478 3,502 3,362 3,460
Obligation+15% 4,249 4,307 3,687 3,747 3,796 3,841 3,885 3,960 4,061 4,139
Figure 2.4 – East Coincident Peak Capacity Chart
0
1,000
2,000
3,000
4,000
5,000
6,000
7,000
8,000
9,000
10,000
2006 2007 2008 2009 2010 2011 2012 2013 2014 2015Calendar Year
MW
Existing Resources
Resource Deficit
Peak Obligation + Planning Margin
Planned Resources
Resources 7,435 8,034 7,846 7,992 8,082 8,082 8,101 8,101 8,067 8,028
Obligation+15% 7,353 7,581 7,865 8,091 8,311 8,587 8,790 9,101 9,393 9,701
PacifiCorp – 2004 IRP Update Chapter 2 – Resource Needs Assessment
- 18 -
In Figure 2.4, the increase in existing resources in 2007 is due to the startup of the Lake Side project. The decrease in capacity in 2008 is caused by the expiration of the West Valley Lease.
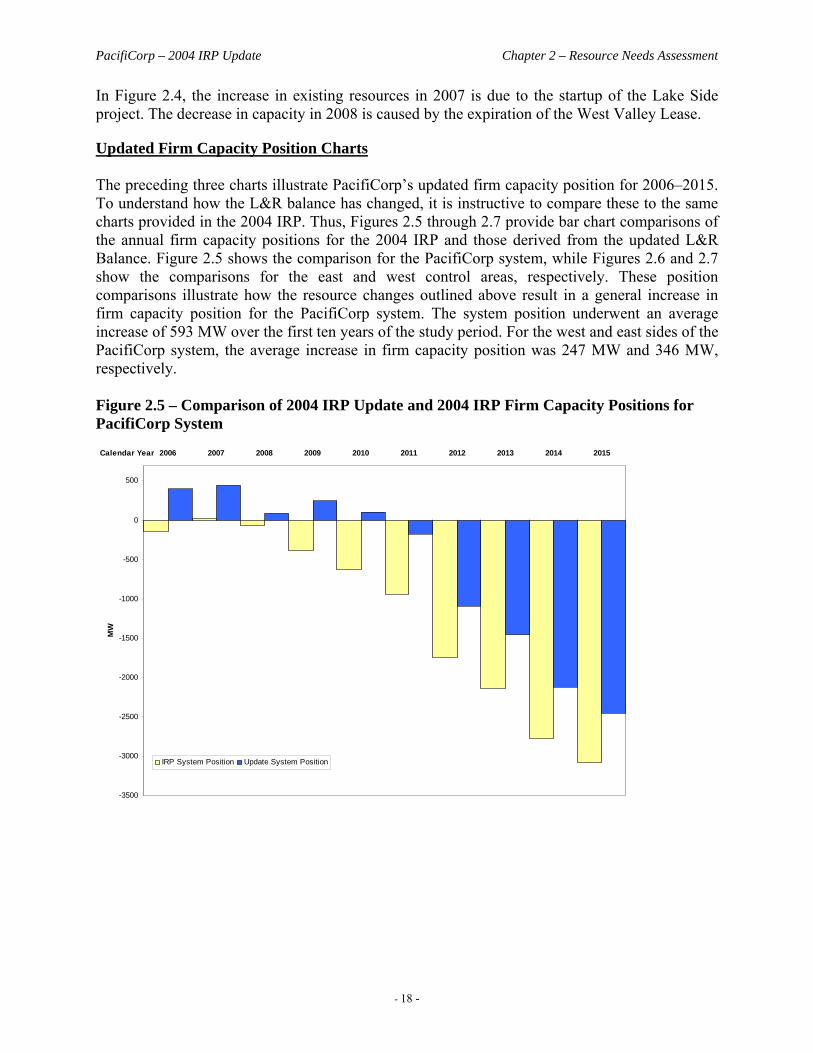
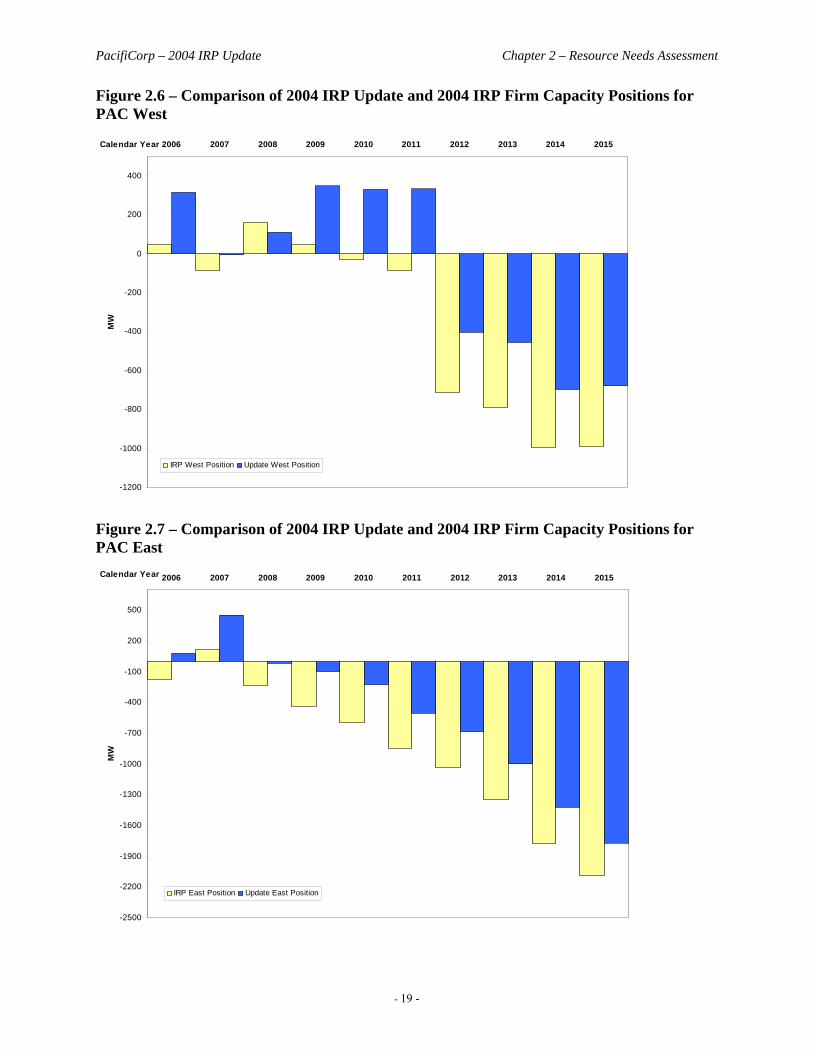
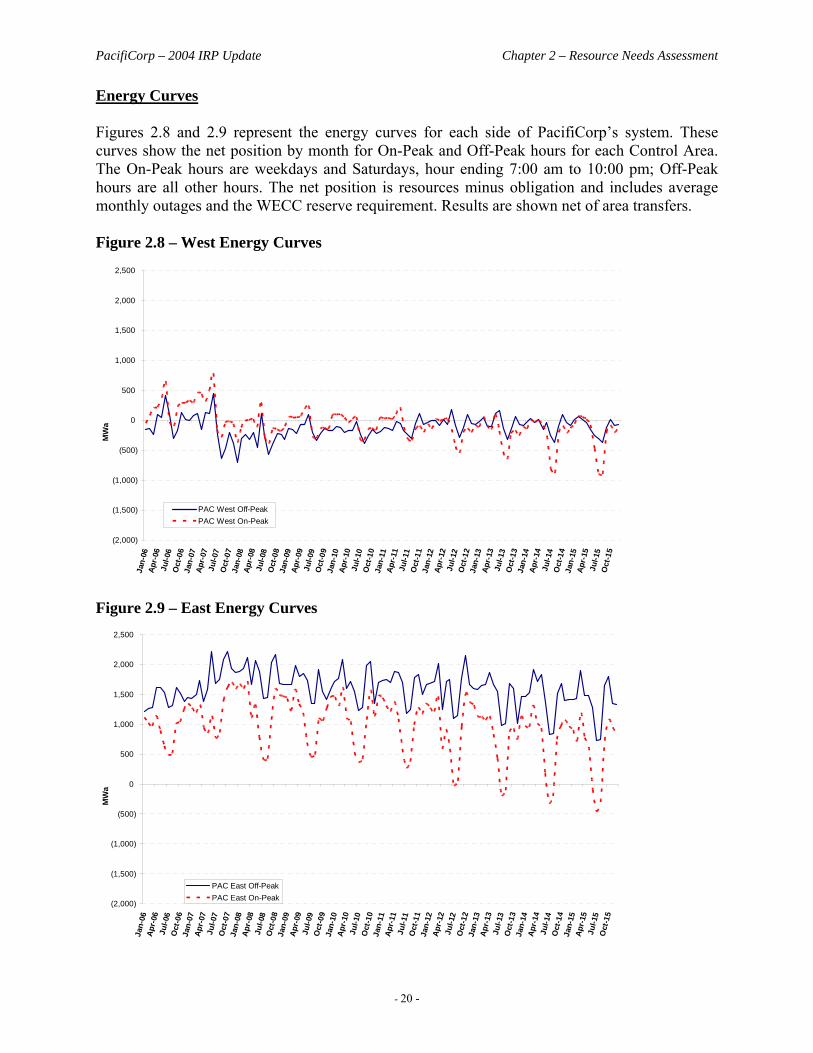
Updated Firm Capacity Position Charts The preceding three charts illustrate PacifiCorp’s updated firm capacity position for 2006–2015. To understand how the L&R balance has changed, it is instructive to compare these to the same charts provided in the 2004 IRP. Thus, Figures 2.5 through 2.7 provide bar chart comparisons of the annual firm capacity positions for the 2004 IRP and those derived from the updated L&R Balance. Figure 2.5 shows the comparison for the PacifiCorp system, while Figures 2.6 and 2.7 show the comparisons for the east and west control areas, respectively. These position comparisons illustrate how the resource changes outlined above result in a general increase in firm capacity position for the PacifiCorp system. The system position underwent an average increase of 593 MW over the first ten years of the study period. For the west and east sides of the PacifiCorp system, the average increase in firm capacity position was 247 MW and 346 MW, respectively. Figure 2.5 – Comparison of 2004 IRP Update and 2004 IRP Firm Capacity Positions for PacifiCorp System
-3500
-3000
-2500
-2000
-1500
-1000
-500
0
500
2006 2007 2008 2009 2010 2011 2012 2013 2014 2015Calendar Year
MW
IRP System Position Update System Position
PacifiCorp – 2004 IRP Update Chapter 2 – Resource Needs Assessment
- 19 -
Figure 2.6 – Comparison of 2004 IRP Update and 2004 IRP Firm Capacity Positions for PAC West
-1200
-1000
-800
-600
-400
-200
0
200
400
2006 2007 2008 2009 2010 2011 2012 2013 2014 2015Calendar Year
MW
IRP West Position Update West Position
Figure 2.7 – Comparison of 2004 IRP Update and 2004 IRP Firm Capacity Positions for PAC East
-2500
-2200
-1900
-1600
-1300
-1000
-700
-400
-100
200
500
2006 2007 2008 2009 2010 2011 2012 2013 2014 2015Calendar Year
MW
IRP East Position Update East Position
PacifiCorp – 2004 IRP Update Chapter 2 – Resource Needs Assessment
- 20 -
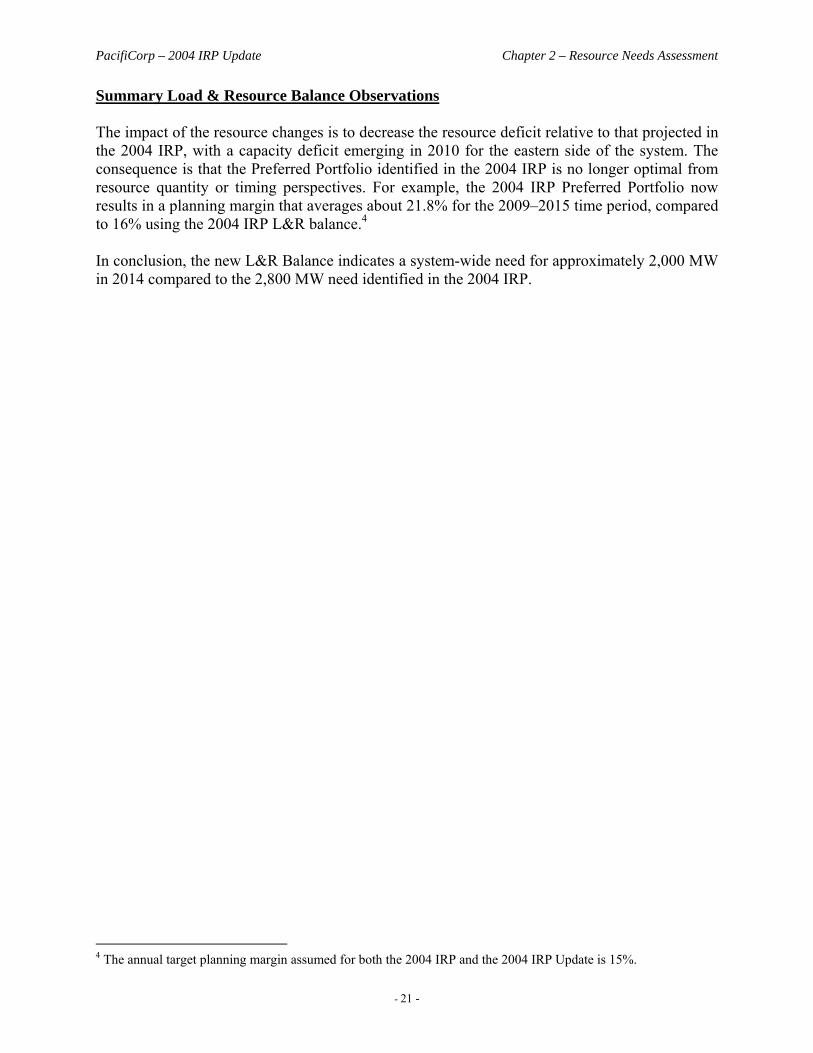
Energy Curves Figures 2.8 and 2.9 represent the energy curves for each side of PacifiCorp’s system. These curves show the net position by month for On-Peak and Off-Peak hours for each Control Area. The On-Peak hours are weekdays and Saturdays, hour ending 7:00 am to 10:00 pm; Off-Peak hours are all other hours. The net position is resources minus obligation and includes average monthly outages and the WECC reserve requirement. Results are shown net of area transfers. Figure 2.8 – West Energy Curves
(2,000)
(1,500)
(1,000)
(500)
0
500
1,000
1,500
2,000
2,500
Jan-
06Ap
r-06
Jul-0
6O
ct-0
6Ja
n-07
Apr-
07Ju
l-07
Oct
-07
Jan-
08Ap
r-08
Jul-0
8O
ct-0
8Ja
n-09
Apr-
09Ju
l-09
Oct
-09
Jan-
10Ap
r-10
Jul-1
0O
ct-1
0Ja
n-11
Apr-
11Ju
l-11
Oct
-11
Jan-
12Ap
r-12
Jul-1
2O
ct-1
2Ja
n-13
Apr-
13Ju
l-13
Oct
-13
Jan-
14Ap
r-14
Jul-1
4O
ct-1
4Ja
n-15
Apr-
15Ju
l-15
Oct
-15
MW
a
PAC West Off-PeakPAC West On-Peak
Figure 2.9 – East Energy Curves
(2,000)
(1,500)
(1,000)
(500)
0
500
1,000
1,500
2,000
2,500
Jan-
06Ap
r-06
Jul-0
6O
ct-0
6Ja
n-07
Apr-
07Ju
l-07
Oct
-07
Jan-
08Ap
r-08
Jul-0
8O
ct-0
8Ja
n-09
Apr-
09Ju
l-09
Oct
-09
Jan-
10Ap
r-10
Jul-1
0O
ct-1
0Ja
n-11
Apr-
11Ju
l-11
Oct
-11
Jan-
12Ap
r-12
Jul-1
2O
ct-1
2Ja
n-13
Apr-
13Ju
l-13
Oct
-13
Jan-
14Ap
r-14
Jul-1
4O
ct-1
4Ja
n-15
Apr-
15Ju
l-15
Oct
-15
MW
a
PAC East Off-PeakPAC East On-Peak
PacifiCorp – 2004 IRP Update Chapter 2 – Resource Needs Assessment
- 21 -
Summary Load & Resource Balance Observations The impact of the resource changes is to decrease the resource deficit relative to that projected in the 2004 IRP, with a capacity deficit emerging in 2010 for the eastern side of the system. The consequence is that the Preferred Portfolio identified in the 2004 IRP is no longer optimal from resource quantity or timing perspectives. For example, the 2004 IRP Preferred Portfolio now results in a planning margin that averages about 21.8% for the 2009–2015 time period, compared to 16% using the 2004 IRP L&R balance.4 In conclusion, the new L&R Balance indicates a system-wide need for approximately 2,000 MW in 2014 compared to the 2,800 MW need identified in the 2004 IRP.
4 The annual target planning margin assumed for both the 2004 IRP and the 2004 IRP Update is 15%.

PacifiCorp – 2004 IRP Update Chapter 3 – IGCC Resource Update
- 23 -
3. INTEGRATED GASIFICATION COMBINED CYCLE RESOURCE UPDATE
Emerging clean coal technology continues to gain attention as a potential means to add new coal-based generating resources while offering reduced emissions compared to a new conventional coal plant. These emerging technologies also offer the potential to more economically capture carbon dioxide (CO2) for beneficial reuse or geologic sequestration than conventional coal technology. Recent developments in the power supply industry related to Integrated Gasification Combined Cycle (IGCC) technology have created a groundswell of interest in this clean coal technology. In addition, incentives for IGCC and other clean coal technologies included in the Energy Policy Act of 2005 have the potential to reduce the cost differential between IGCC and other generation sources. Within its 2004 IRP, PacifiCorp considered IGCC as a resource option in numerous candidate resource portfolios and included the best information available at that time on expected cost and performance. However, based on cost projections for IGCC as compared to other resource alternatives, such as conventional coal generation, the resulting Preferred Portfolio did not include IGCC. Recognizing the potential of IGCC, PacifiCorp has continued to explore IGCC technology since the 2004 IRP was filed through discussions with suppliers and completion of a preliminary engineering study of the expected costs of an IGCC plant located at the Hunter site. The study results indicate that IGCC remains more costly than conventional pulverized coal, though the estimated cost gap has narrowed since the 2004 IRP. The results of PacifiCorp’s preliminary IGCC study are presented below, along with discussions on EPACT2005 investment incentives, state IGCC policy developments, and the technical and regulatory challenges faced by emerging technology such as IGCC.
TECHNICAL UPDATE
PacifiCorp contracted with Parsons E&C in late 2004 to perform a preliminary engineering study of the expected cost of installing an IGCC plant on the Hunter site. This study represents Parsons’ conceptual level analysis of the expected cost and performance of the two commercial gasifier options available at that time, GE-Texaco and ConocoPhillips E-Gas. The study is not equivalent to a Feasibility Study, which would develop the most reliable engineering and cost information necessary to make a decision regarding selection of the best IGCC technology. The study used Utah coal with an identical quality to the coal used in previous Hunter pulverized coal technology studies. This coal is a Utah bituminous low-sulfur coal with an average heat content of 11,500 Btu/lb (HHV). The Parsons study developed a conceptual engineering, procurement and construction (EPC) price estimate for an IGCC plant. PacifiCorp then adjusted these costs to include other site-specific costs as derived from previous Hunter 4 studies of the cost of a new pulverized coal unit. These adjusted cost estimates included allowances for additional coal handling, construction management, water, spare parts, PacifiCorp personnel, and financing charges. Based on these adders the projected cost to install a 519 MW gasification system on the Hunter site was expected to be approximately $1,957/kW in 2005 dollars. This compares to the subcritical
PacifiCorp – 2004 IRP Update Chapter 3 – IGCC Resource Update
- 24 -
pulverized coal boiler estimate of $1,687/kW and the supercritical boiler cost estimate of $1,735/kW used in the 2004 IRP. This IGCC estimate does not include provisions for future inclusion of carbon capture equipment. The additional costs of making an IGCC facility “carbon capture ready” consist of providing space for the installation of future CO2 separation process steps and providing larger equipment sizing to accommodate these future additions. Larger equipment sizing is necessary to enable the plant to produce the same electricity output as a plant without carbon capture equipment installed. While equipment to capture carbon can be added to an IGCC facility in the future without these up-front provisions, the overall cost of such a facility is expected to be lower with the initial planning of these additions. Including these costs would increase the initial IGCC cost estimate to $2,153/kW. An IGCC facility at the Hunter site would have a projected design heat rate of 8,405 Btu/kWh HHV. Converting this design heat rate to an average annual heat rate yields a value of 8,657 Btu/kWh. A coal-based design that uses a supercritical boiler would have an estimated annual average heat rate of 9,129 Btu/kWh. Operation and maintenance (O&M) estimates for an IGCC were also developed for comparison with those for a pulverized coal unit. A supercritical unit would be expected to have a fixed O&M cost of $33.77/kW-yr with a variable O&M cost of $0.99/MWh, while the IGCC would be expected to have a fixed O&M cost of $62.01/kW-yr with a variable O&M cost of $0.27/MWh. Overall, this results in an O&M cost for IGCC of about 1.5 times the expected cost of supercritical pulverized coal technology. Based on the above results, the Total Resource Cost in 2005 dollars (as calculated for the IRP) to produce power from a supercritical pulverized coal boiler is estimated at approximately $39.35/MWh. By comparison, the Total Resource Cost of power for an IGCC plant, without carbon capture provisions, is estimated at about $43.90/MWh (11.6 percent higher) and $46.00/MWh (16.9 percent higher) if carbon-capture provisions (but not carbon separation or sequestration) are included in the initial project. The cost differential between the technologies is particularly important since the consistent, primary policy direction of the states in which PacifiCorp operates is to procure resources with the lowest reasonable cost. For example, in the recently-passed Utah Energy Resource Procurement Act, although the Utah Public Service Commission may take into consideration factors such as long- and short-term impacts, risks, reliability, financial impacts on the utility, or other factors determined relevant by the commission when deciding whether to approve a resource, “lowest reasonable cost” is the first criterion listed. Figure 3.1 illustrates the Total Resource Cost in 2012 dollars of different generation technologies under different assumptions of potential future carbon-related costs. The graph illustrates that if a CO2 allowance cost of approximately $35 per ton is imposed, IGCC (with carbon capture and sequestration) becomes “least cost” under an assumed cost for sequestration of $10/MWh. It is important to note that accurate cost estimates for CO2 sequestration do not exist and that the $10/MWh figure reflects a carbon sequestration research program goal established by the Department of Energy.5 5 Carbon Sequestration Technology Roadmap and Project Plan 2005, U.S. Department of Energy, National Energy Technology Laboratory, May 2005.
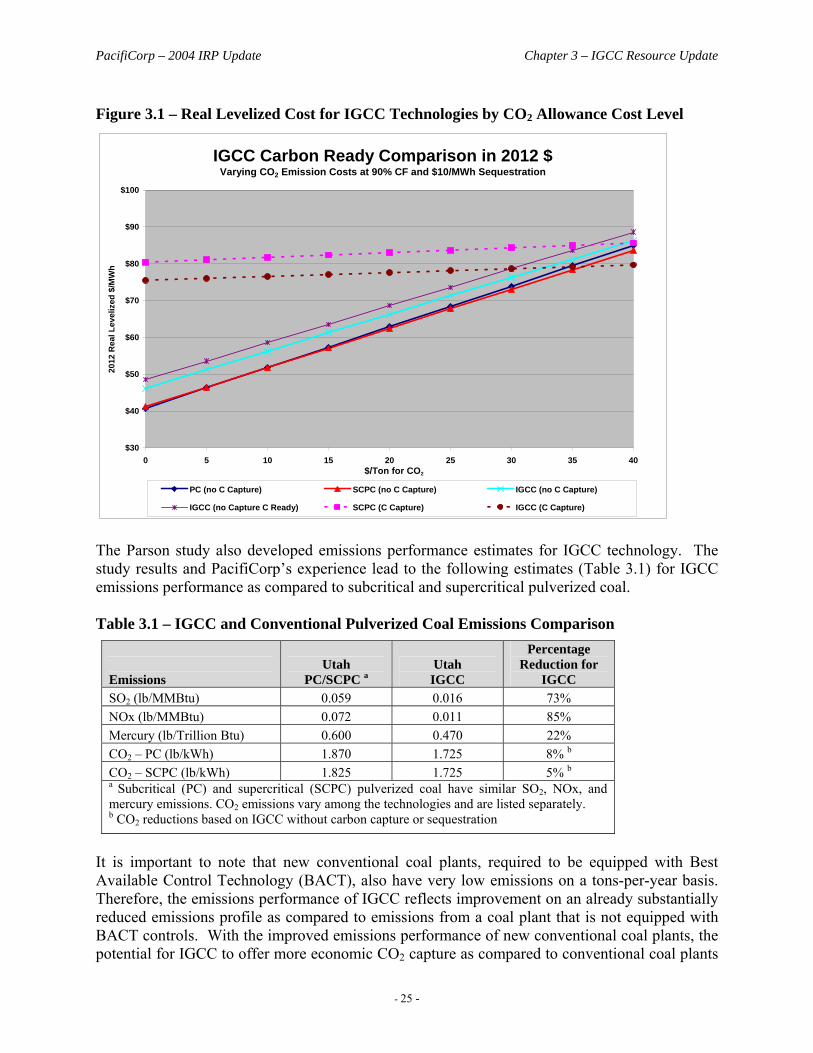
PacifiCorp – 2004 IRP Update Chapter 3 – IGCC Resource Update
- 25 -
Figure 3.1 – Real Levelized Cost for IGCC Technologies by CO2 Allowance Cost Level
IGCC Carbon Ready Comparison in 2012 $Varying CO2 Emission Costs at 90% CF and $10/MWh Sequestration
$30
$40
$50
$60
$70
$80
$90
$100
0 5 10 15 20 25 30 35 40$/Ton for CO2
2012
Rea
l Lev
eliz
ed $
/MW
h
PC (no C Capture) SCPC (no C Capture) IGCC (no C Capture)
IGCC (no Capture C Ready) SCPC (C Capture) IGCC (C Capture)
The Parson study also developed emissions performance estimates for IGCC technology. The study results and PacifiCorp’s experience lead to the following estimates (Table 3.1) for IGCC emissions performance as compared to subcritical and supercritical pulverized coal. Table 3.1 – IGCC and Conventional Pulverized Coal Emissions Comparison
Emissions
Utah PC/SCPC a
Utah IGCC
Percentage Reduction for
IGCC SO2 (lb/MMBtu) 0.059 0.016 73% NOx (lb/MMBtu) 0.072 0.011 85% Mercury (lb/Trillion Btu) 0.600 0.470 22% CO2 – PC (lb/kWh) 1.870 1.725 8% b CO2 – SCPC (lb/kWh) 1.825 1.725 5% b a Subcritical (PC) and supercritical (SCPC) pulverized coal have similar SO2, NOx, and mercury emissions. CO2 emissions vary among the technologies and are listed separately. b CO2 reductions based on IGCC without carbon capture or sequestration
It is important to note that new conventional coal plants, required to be equipped with Best Available Control Technology (BACT), also have very low emissions on a tons-per-year basis. Therefore, the emissions performance of IGCC reflects improvement on an already substantially reduced emissions profile as compared to emissions from a coal plant that is not equipped with BACT controls. With the improved emissions performance of new conventional coal plants, the potential for IGCC to offer more economic CO2 capture as compared to conventional coal plants
PacifiCorp – 2004 IRP Update Chapter 3 – IGCC Resource Update
- 26 -
represents the most compelling environmental reason to employ the technology for power generation. PacifiCorp’s next steps for IGCC analysis will include an update of the Parsons (now WorleyParsons) study to investigate the cost of an IGCC plant using Powder River Basin (PRB) and Jim Bridger coals. Current engineering understanding suggests that gasifier systems for lower rank coals would most efficiently use a dry coal feed instead of the slurry feed systems of GE and E-Gas. Additionally, PRB coals would most likely be used at plant sites at greater elevation than the Hunter site and this effect should also be studied. If the conceptual level studies indicate that IGCC merits further consideration, feasibility studies would be necessary to further refine the estimated cost and performance characteristics of the competing commercial offerings. Feasibility studies would be undertaken by the commercial vendors and would take a minimum of between 4 to 6 months to complete. Each vendor feasibility study would cost approximately $300,000 to $500,000. These studies would focus on technology comparisons and indicative pricing in order to determine which commercial vendor offers the most attractive technology and price for PacifiCorp's specific sites and coals. Whereas detailed engineering design and construction cost estimates for conventional coal plants can be obtained through studies that cost approximately $500,000 to $1 million, a similar level of detail for an IGCC plant currently requires a Front End Engineering Design (FEED) study to be conducted. Due to the developmental nature of IGCC, such a study would currently cost between $10-$15 million dollars and require 10 to 14 months to complete. The expected end result would be a firm money EPC cost estimate suitable for contract execution. Due to its high cost, a FEED study would only be undertaken after a decision to move ahead with a specific IGCC project was reached.
EFFECTS OF ENERGY POLICY ACT INCENTIVES
The Energy Policy Act of 2005 contains Investment Tax Credit (ITC) provisions and loan guarantees for qualifying IGCC facilities. Since PacifiCorp currently holds a relatively strong credit rating, loan guarantees provide little incentive. The ITC, although only applicable to the gasifier portion of the IGCC plant, therefore is the key economic subsidy available. The exact impact of the investment tax credits is difficult to assess due to uncertainty regarding the availability of the credits (other projects further along could exhaust the available pool of $800 million of tax credits) and PacifiCorp’s tax position. Oregon’s passage of Senate Bill 408 creates additional uncertainty about how to incorporate these tax incentives into an evaluation. However, as an example, if an IGCC project at the Hunter site could take full advantage of the ITC, the estimated cost of energy for IGCC in 2012 could be reduced by approximately $3.00/MWh—about half the currently estimated price differential between carbon capture-ready IGCC and supercritical boilers.
IGCC STATE POLICY DEVELOPMENTS
Some power providers have announced their interest in developing IGCC facilities and have begun preliminary activities towards that end. Companies with projects that have been publicly
PacifiCorp – 2004 IRP Update Chapter 3 – IGCC Resource Update
- 27 -
announced with a reported substantial level of commitment include American Electric Power (through its subsidiaries Ohio Power and Columbus Southern Power), Excelsior Energy, Steelhead Energy, and Cinergy (through its subsidiary Public Service of Indiana) in partnership with Vectren Corporation. As detailed above, IGCC remains a higher-cost option than either subcritical or supercritical pulverized coal generation. The cost gap is even greater for IGCC that is configured to accommodate future CO2 separation processes and greater still when adding the estimated costs of carbon separation and sequestration operations. This cost gap presents a challenge for the technology that is difficult to overcome in a “least-cost/least-risk” planning framework—even one that includes a methodology that assumes a future cost for CO2 emissions. The projects that are advancing at this time appear to be doing so for reasons related to public policy support for the technology that deviates from the least cost/risk-balanced requirement as currently applied in PacifiCorp’s planning process. In the case of American Electric Power (AEP), which is considering a 600 MW IGCC plant, the technology offers the state of Ohio the opportunity for local economic development through the ability to use high-sulfur eastern coal. Through a probabilistic analysis, AEP made a case to its regulators that IGCC may be least-cost compared to pulverized coal when considering a range of possible carbon regulatory regimes. AEP is seeking assured cost recovery for the project and accelerated cost recovery of engineering and financing costs.6 AEP has indicated that cost recovery must be assured before it will proceed with construction. The Ohio PUC is expected to rule on the application by the end of the year and AEP has initiated a FEED study with GE-Bechtel. The development of Excelsior Energy’s Mesaba Energy Project, a 531 MW IGCC plant scheduled to come online in 2011, has been furthered by legislation (MS 216B.1693-1694) passed in Minnesota in 2003 that provides significant support for the project. This support includes tax incentives, streamlined development, and regulatory benefits that incorporate an exemption from certificate-of-need proceedings and the right to a long-term power purchase agreement from Xcel Energy. In addition, $10 million in renewable development funds have been provided by the State and the project is receiving $36 million in Federal grant money through the Department of Energy’s Clean Coal Power Initiative. Steelhead Energy’s Southern Illinois Clean Energy Center is a combined 615 MW power and 86 MMSCFD synthetic natural gas plant scheduled to come on line 2010. The first phase of a two part FEED study was launched in April 2005 and was completed in October. The development of the project has been supported by $5 million in funding from the State of Illinois to perform the first phase of the FEED study. Additionally, the project benefits from legislation passed in Illinois this summer (SB 90) that sets a price for synthesis gas produced from a coal gasification facility using Illinois coal and permits gas utilities to enter into 20-year supply contracts with any synthesis gas producer. The legislation declares those synthesis gas contracts to be prudent and recoverable subject to certain price constraints. Additional Illinois legislation (SB 1814) passed
6 Application and Direct Testimony of Bruce H. Braine on behalf of Columbus Southern Power Company and Ohio Power Company before the Public Utilities Commission of Ohio, Case No. 05-376-EL-UNC, March 18, 2005 and May 5, 2005, respectively.
PacifiCorp – 2004 IRP Update Chapter 3 – IGCC Resource Update
- 28 -
concurrently with SB 90 provides economic incentives, including tax exemptions and credits, and low-cost financing for innovative coal gasification projects. Cinergy and Vectren Corporation have been working on Feasibility Studies for a 600 MW IGCC plant in Southwestern Indiana. This project benefits from legislation passed in Indiana this year (HB 1245) that establishes an investment tax credit for an IGCC facility that primarily serves Indiana customers. In addition to providing needed power, the project is viewed as an economic development opportunity that will encourage the use of Indiana coal. Cinergy recently announced their intention to proceed with a FEED study with GE-Bechtel. Other states are encouraging the development of IGCC through legislation that provides incentives for the technology. West Virginia passed legislation (HB 2813) earlier this year that allows power companies to file for PSC certificates of public convenience and necessity for new plants concurrently with applications for other required permits and licenses. The legislation was designed to speed up the regulatory process for approving new power plants in the hope of luring AEP’s proposed IGCC facility. In each of these examples above the proposed IGCC project would use eastern bituminous coals. Interest in eastern bituminous coal arises, in part, because Clean Air Act requirements since 1990 have encouraged the use of low-sulfur western coals even in eastern plants with a resulting chilling effect on the coal extraction industry in the mid-west and east. The status of IGCC development for eastern coals is also more advanced than applications for western coals and substantial engineering and design work on the gasifier and coal feed must be completed for IGCC applications on western coals. This potentially introduces additional technology risk. The Energy Policy Act provision for a western coal facility demonstrates the less advanced state of development for IGCC using western fuels. Additionally, for each of the projects referenced above, there has been no final commitment to build a facility. This commitment typically is not considered until after the completion of a FEED study.
CHALLENGES TO IGCC DEVELOPMENT
While IGCC has gained much attention, there are many issues that remain to be resolved before a definitive cost, risk and technology comparison can be made to conventional coal-fired generation. Additionally, the least-cost/least-risk regulatory framework presents challenges for near-term development of the technology. A few of these issues and challenges to development are listed below:
• A very dynamic environment exists around IGCC and many claims about the technology’s cost and performance are being made that cannot be verified until FEED studies are completed and the first reference plants are in operation. FEED studies typically take 10–14 months. For example, AEP’s FEED study will take 12 months, cost millions of dollars, and will not be completed before late 2006.
• A number of consortia have publicly stated that they are prepared to provide performance
guarantees or "wraps" covering the entire IGCC generating island. However, at the present time no final, signed contracts have been entered into for the construction of IGCC plants, so the precise terms of those wraps are yet to be made available. Thus, it is
PacifiCorp – 2004 IRP Update Chapter 3 – IGCC Resource Update
- 29 -
difficult to assess the risk posed by this newer technology. The information presented above includes an inherent assumption that such wraps are available and/or the technology performs as advertised.
• Because of the developing nature of IGCC technology, considerable up-front engineering
must be performed through a FEED study to develop detailed cost and performance estimates necessary to make a final decision to proceed and award an EPC or other contract. As indicated, a FEED study necessary to develop an EPC price costs around 10-15 million dollars which, absent cost-recovery assurances, a utility may be unable to justify without knowing if those costs are recoverable.
• As discussed earlier, perhaps the most compelling environmental reason to pursue IGCC
is its potential to economically capture CO2. Within the current planning framework, the following information is needed to determine if IGCC is the clear choice as compared to other generation resources:
– valid and accurate cost estimates for future CO2 sequestration (which currently do not exist), and
– sufficient estimates of the probability, timing, and stringency of potential future carbon constraints.
Without this information, it is difficult to assess the currently estimated additional costs of IGCC on a risk-adjusted basis to determine if the technology is least-cost/least-risk as required by the current regulatory framework.
• Schemes for commercial-scale carbon sequestration are unproven, and a regulatory framework has yet to be developed for certifying and indemnifying permanent sequestration.
In order for IGCC technology to advance in the near term, cost recovery schemes must be developed that will provide an assured future cash flow to pay for the required engineering design studies and, ultimately, demonstration of the technology. This will reduce the risk that must be shouldered by the utility compared to the risk borne when it chooses a proven technology. Alternatively, there must be clear and consistent policy direction from states and regulators that emerging technology such as IGCC, despite its higher cost and uncertainty about its performance, is preferred over conventional coal generation technology due to its environmental attributes and/or potential to economically capture CO2.
CONCLUSION
As indicated, announced IGCC projects appear to be advancing as a result of state policy decisions that support IGCC technology even though it may not be least cost. These state policy decisions are intended to advance state-specific energy and environmental goals as well as economic development interests. These incentives have been necessary because IGCC is more expensive than conventional coal generation and remains unproven at the scale proposed for these commercial power production applications. This presents technology risk, financing difficulties, and other attendant risks within current regulatory frameworks. Significantly, for PacifiCorp and its customers, additional technical challenges remain to be addressed for the application of IGCC using western coals.

PacifiCorp – 2004 IRP Update Chapter 3 – IGCC Resource Update
- 30 -
PacifiCorp recognizes the significant potential of IGCC to help mitigate fuel price risk and reduce carbon risk while also offering reduced emissions of criteria pollutants. In light of this, PacifiCorp will continue its efforts to closely follow the technology development and available commercial offerings. Additionally, PacifiCorp will initiate a preliminary engineering study of an IGCC facility located at the Jim Bridger site using PRB coal. This study will provide updated information about the cost, performance, and viability of IGCC application at the Jim Bridger site. However, until IGCC technology is more fully developed and becomes more cost competitive, as documented by a publicly available detailed FEED or actual commercial installation, the absence of consistent state policy and cost recovery direction among PacifiCorp’s states in favor of emerging clean coal technology, such as IGCC, will likely retard its development. In the interim, the integrated resource planning process must follow currently established standards and guidelines set forth by the states and, as a result, will continue to prefer a least-cost/least-risk portfolio based on established commercial technologies. At present, based on information currently available, PacifiCorp’s planned portfolio incorporates conventional coal-fired generation.
PacifiCorp – 2004 IRP Update Chapter 4 – Portfolio Analysis
- 31 -
4. PORTFOLIO ANALYSIS
INTRODUCTION
The purpose of this chapter is to describe the resource portfolios developed to address the updated system capacity positions outlined in the previous chapter, and present the deterministic and stochastic simulation results for the new portfolios. The general analytic approach used for the 2004 IRP Update consists of the following steps: • Update the IRP model database to reflect updated base assumptions and characteristics for
existing and IRP candidate resources. • Determine the impact of the updated Load & Resource Balance on the size and timing of
2004 IRP Preferred Portfolio resources. • Develop a set of alternative portfolios that better align with the updated L&R Balance and
thereby meet or exceed the associated 15% annual system-wide Planning Margin targets.7 • Conduct both deterministic and stochastic 20-year simulations for the original 2004 IRP
Preferred Portfolio and the alternative resource portfolios. The simulation study period was from January 1, 2006 through December 31, 2025.
• Derive Present Value of Revenue Requirements (PVRR) results for the simulations, and rank the portfolios according to PVRR performance and stochastic risk metrics.
PORTFOLIO DESCRIPTIONS
This section describes the original 2004 Preferred Portfolio—highlighting changes to resource assumptions and the impact of the new L&R Balance—and introduces four alternative portfolios that address the new capacity position requirements. PacifiCorp considered alternative mixtures of gas, coal, and Front Office purchase transactions that represented appropriate Action Plan resource acquisition paths and reflected the latest information regarding resource opportunities. The rationale for structuring the portfolios in this way was to define alternative resource solutions in the event that the path to one portfolio does not materialize.
2004 IRP Preferred Portfolio Table 4.1 shows the resource type, location, MW capacity, and timing of the 2004 IRP’s Preferred Portfolio proxy resources. Due to updated resource assumptions used for the portfolio analysis, attributes of some of the proxy resources used in the original Preferred Portfolio were modified. Nevertheless, the modified Preferred Portfolio will still be referred to as the “Preferred Portfolio” in subsequent discussions. Table 4.1 reflects the relevant resource type and capacity modifications for the 2004 IRP Preferred Portfolio (Resource characteristics for all candidate IRP resources are reflected in Tables A.4 and A.5 of Appendix A.) The major modifications associated with the Preferred Portfolio include the following: • Pulverized coal resources in the Preferred Portfolio and alternative portfolios model a
supercritical boiler design as opposed to a subcritical design specified for resources in the 7 No changes were made to the DSM proxy resources included in the Preferred Portfolio.)
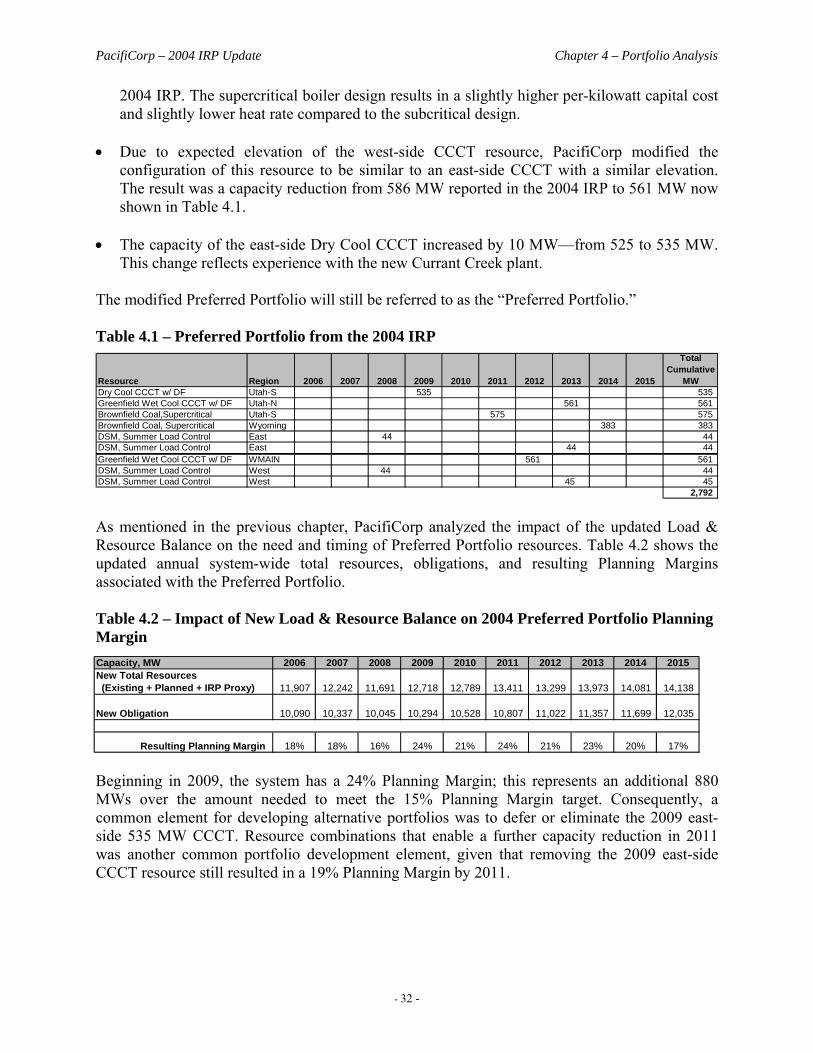
PacifiCorp – 2004 IRP Update Chapter 4 – Portfolio Analysis
- 32 -
2004 IRP. The supercritical boiler design results in a slightly higher per-kilowatt capital cost and slightly lower heat rate compared to the subcritical design.
• Due to expected elevation of the west-side CCCT resource, PacifiCorp modified the
configuration of this resource to be similar to an east-side CCCT with a similar elevation. The result was a capacity reduction from 586 MW reported in the 2004 IRP to 561 MW now shown in Table 4.1.
• The capacity of the east-side Dry Cool CCCT increased by 10 MW—from 525 to 535 MW.
This change reflects experience with the new Currant Creek plant. The modified Preferred Portfolio will still be referred to as the “Preferred Portfolio.” Table 4.1 – Preferred Portfolio from the 2004 IRP
Resource Region 2006 2007 2008 2009 2010 2011 2012 2013 2014 2015
Total Cumulative
MWDry Cool CCCT w/ DF Utah-S 535 535 Greenfield Wet Cool CCCT w/ DF Utah-N 561 561 Brownfield Coal,Supercritical Utah-S 575 575 Brownfield Coal, Supercritical Wyoming 383 383 DSM, Summer Load Control East 44 44 DSM, Summer Load Control East 44 44 Greenfield Wet Cool CCCT w/ DF WMAIN 561 561 DSM, Summer Load Control West 44 44 DSM, Summer Load Control West 45 45
2,792 As mentioned in the previous chapter, PacifiCorp analyzed the impact of the updated Load & Resource Balance on the need and timing of Preferred Portfolio resources. Table 4.2 shows the updated annual system-wide total resources, obligations, and resulting Planning Margins associated with the Preferred Portfolio. Table 4.2 – Impact of New Load & Resource Balance on 2004 Preferred Portfolio Planning Margin
Beginning in 2009, the system has a 24% Planning Margin; this represents an additional 880 MWs over the amount needed to meet the 15% Planning Margin target. Consequently, a common element for developing alternative portfolios was to defer or eliminate the 2009 east-side 535 MW CCCT. Resource combinations that enable a further capacity reduction in 2011 was another common portfolio development element, given that removing the 2009 east-side CCCT resource still resulted in a 19% Planning Margin by 2011.
Capacity, MW 2006 2007 2008 2009 2010 2011 2012 2013 2014 2015New Total Resources (Existing + Planned + IRP Proxy) 11,907 12,242 11,691 12,718 12,789 13,411 13,299 13,973 14,081 14,138
New Obligation 10,090 10,337 10,045 10,294 10,528 10,807 11,022 11,357 11,699 12,035
Resulting Planning Margin 18% 18% 16% 24% 21% 24% 21% 23% 20% 17%
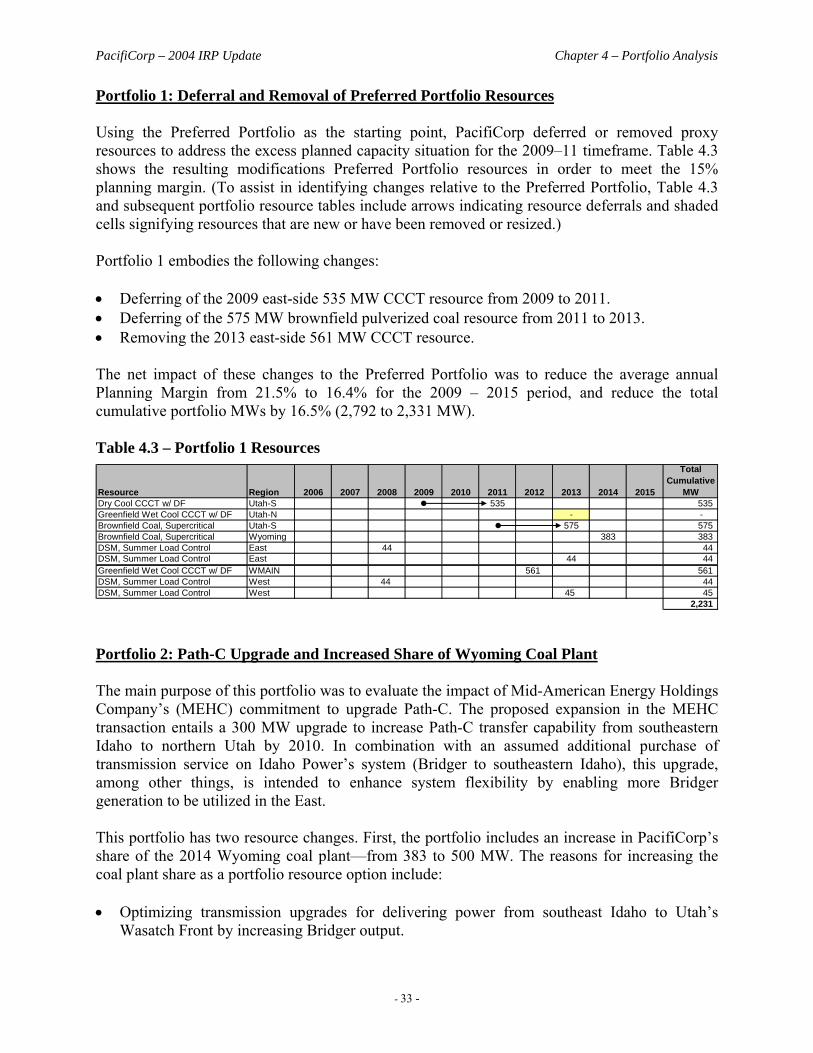
PacifiCorp – 2004 IRP Update Chapter 4 – Portfolio Analysis
- 33 -
Portfolio 1: Deferral and Removal of Preferred Portfolio Resources Using the Preferred Portfolio as the starting point, PacifiCorp deferred or removed proxy resources to address the excess planned capacity situation for the 2009–11 timeframe. Table 4.3 shows the resulting modifications Preferred Portfolio resources in order to meet the 15% planning margin. (To assist in identifying changes relative to the Preferred Portfolio, Table 4.3 and subsequent portfolio resource tables include arrows indicating resource deferrals and shaded cells signifying resources that are new or have been removed or resized.) Portfolio 1 embodies the following changes: • Deferring of the 2009 east-side 535 MW CCCT resource from 2009 to 2011. • Deferring of the 575 MW brownfield pulverized coal resource from 2011 to 2013. • Removing the 2013 east-side 561 MW CCCT resource. The net impact of these changes to the Preferred Portfolio was to reduce the average annual Planning Margin from 21.5% to 16.4% for the 2009 – 2015 period, and reduce the total cumulative portfolio MWs by 16.5% (2,792 to 2,331 MW). Table 4.3 – Portfolio 1 Resources
Resource Region 2006 2007 2008 2009 2010 2011 2012 2013 2014 2015
Total Cumulative
MWDry Cool CCCT w/ DF Utah-S 535 535 Greenfield Wet Cool CCCT w/ DF Utah-N - - Brownfield Coal, Supercritical Utah-S 575 575 Brownfield Coal, Supercritical Wyoming 383 383 DSM, Summer Load Control East 44 44 DSM, Summer Load Control East 44 44 Greenfield Wet Cool CCCT w/ DF WMAIN 561 561 DSM, Summer Load Control West 44 44 DSM, Summer Load Control West 45 45
2,231
Portfolio 2: Path-C Upgrade and Increased Share of Wyoming Coal Plant The main purpose of this portfolio was to evaluate the impact of Mid-American Energy Holdings Company’s (MEHC) commitment to upgrade Path-C. The proposed expansion in the MEHC transaction entails a 300 MW upgrade to increase Path-C transfer capability from southeastern Idaho to northern Utah by 2010. In combination with an assumed additional purchase of transmission service on Idaho Power’s system (Bridger to southeastern Idaho), this upgrade, among other things, is intended to enhance system flexibility by enabling more Bridger generation to be utilized in the East. This portfolio has two resource changes. First, the portfolio includes an increase in PacifiCorp’s share of the 2014 Wyoming coal plant—from 383 to 500 MW. The reasons for increasing the coal plant share as a portfolio resource option include: • Optimizing transmission upgrades for delivering power from southeast Idaho to Utah’s
Wasatch Front by increasing Bridger output.

PacifiCorp – 2004 IRP Update Chapter 4 – Portfolio Analysis
- 34 -
• Accommodating Idaho Power’s interest (as reported in their most recent IRP) in expanding its coal resources in 250 MW increments.
• Using the advantage of scale economies in building a larger coal plant. Second, the portfolio includes the phase-in of a 300 MW west-side seasonal resource (100 MW increments in 2011, 2013, and 2014). The seasonal resource, modeled as a must-run product priced at California-Oregon Border (COB) market prices, is intended to compensate for increased west-to-east transfers resulting from the Path-C transmission upgrade, thus avoiding a capacity-short situation in the west beginning in 2011. These resource additions enable removal of both east-side CCCT resources as well as the deferral of the Utah coal resource (modeled as a Hunter 4 brownfield unit) from 2011 to 2012. Total cumulative portfolio capacity is 2,113 MW, and results in an average annual Planning Margin of 15.3% for the 2009 – 2015 period. Table 4.4 shows the size and installation timing of the Portfolio 2 resources.
Table 4.4 – Portfolio 2 Resources
Resource Region 2006 2007 2008 2009 2010 2011 2012 2013 2014 2015
Total Cumulative
MWDry Cool CCCT w/ DF Utah-S - - Greenfield Wet Cool CCCT w/ DF Utah-N - - Brownfield Coal, Supercritical Utah-S 575 575 Brownfield Coal, Supercritical Wyoming 500 500 DSM, Summer Load Control East 44 44 DSM, Summer Load Control East 44 44 Greenfield Wet Cool CCCT w/ DF WMAIN 561 561 Seasonal Resource* WMAIN 100 100 100 300 DSM, Summer Load Control West 44 44 DSM, Summer Load Control West 45 45 * Includes Path C transmission upgrade in 2010 2,113
Portfolio 3: Portfolio 2 with a Share of the Utah Coal Plant Portfolio 3 represents an incremental modification to Portfolio 2 in order to evaluate the impact of PacifiCorp acquiring a partial share of an east-side 2012 pulverized coal resource. The Utah coal resource was reduced from 575 to 340 MW. To offset the reduced capacity, three 87 MW IC Intercooled aero-derivative Single-Cycle Combustion Turbine (IC Aero SCCT) units were added in 2013. These changes result in a total cumulative portfolio capacity of 2,139 MW by 2015 and an average annual Planning Margin of 15.1% for the 2009 – 2015 period. Table 4.5 shows the sizes and installation timing of the Portfolio 3 resources.
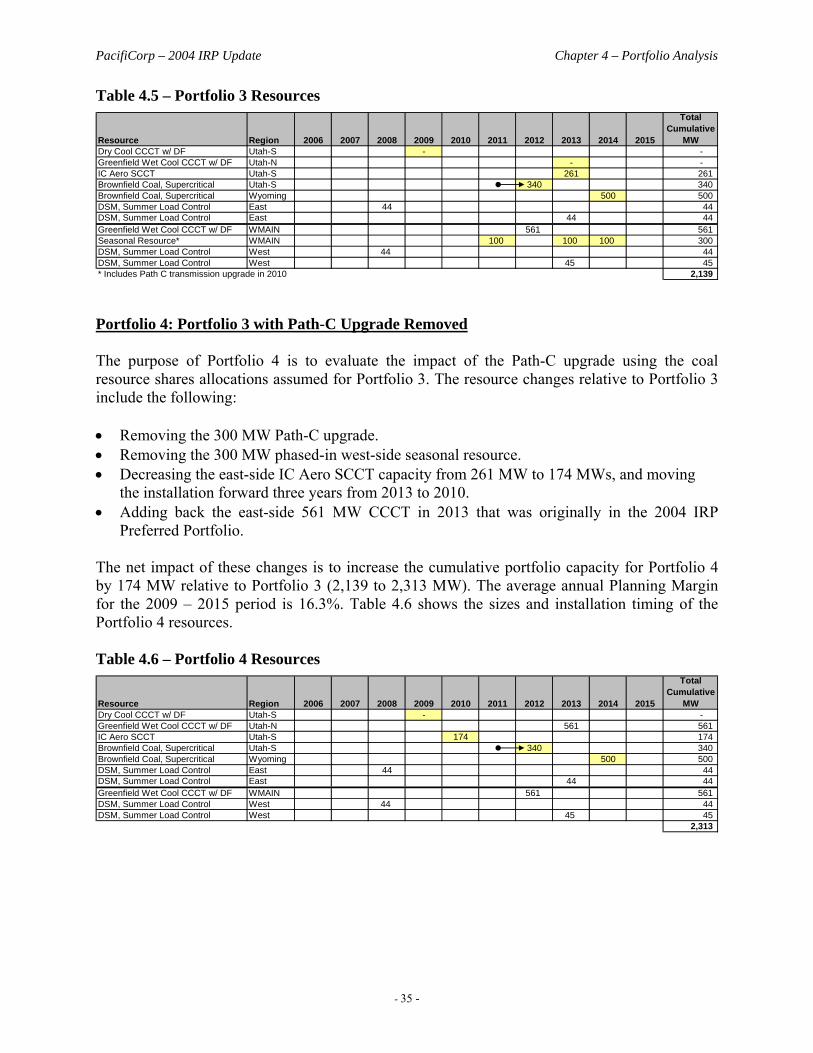
PacifiCorp – 2004 IRP Update Chapter 4 – Portfolio Analysis
- 35 -
Table 4.5 – Portfolio 3 Resources
Resource Region 2006 2007 2008 2009 2010 2011 2012 2013 2014 2015
Total Cumulative
MWDry Cool CCCT w/ DF Utah-S - - Greenfield Wet Cool CCCT w/ DF Utah-N - - IC Aero SCCT Utah-S 261 261 Brownfield Coal, Supercritical Utah-S 340 340 Brownfield Coal, Supercritical Wyoming 500 500 DSM, Summer Load Control East 44 44 DSM, Summer Load Control East 44 44 Greenfield Wet Cool CCCT w/ DF WMAIN 561 561 Seasonal Resource* WMAIN 100 100 100 300 DSM, Summer Load Control West 44 44 DSM, Summer Load Control West 45 45 * Includes Path C transmission upgrade in 2010 2,139
Portfolio 4: Portfolio 3 with Path-C Upgrade Removed The purpose of Portfolio 4 is to evaluate the impact of the Path-C upgrade using the coal resource shares allocations assumed for Portfolio 3. The resource changes relative to Portfolio 3 include the following: • Removing the 300 MW Path-C upgrade. • Removing the 300 MW phased-in west-side seasonal resource. • Decreasing the east-side IC Aero SCCT capacity from 261 MW to 174 MWs, and moving
the installation forward three years from 2013 to 2010. • Adding back the east-side 561 MW CCCT in 2013 that was originally in the 2004 IRP
Preferred Portfolio. The net impact of these changes is to increase the cumulative portfolio capacity for Portfolio 4 by 174 MW relative to Portfolio 3 (2,139 to 2,313 MW). The average annual Planning Margin for the 2009 – 2015 period is 16.3%. Table 4.6 shows the sizes and installation timing of the Portfolio 4 resources. Table 4.6 – Portfolio 4 Resources
Resource Region 2006 2007 2008 2009 2010 2011 2012 2013 2014 2015
Total Cumulative
MWDry Cool CCCT w/ DF Utah-S - - Greenfield Wet Cool CCCT w/ DF Utah-N 561 561 IC Aero SCCT Utah-S 174 174 Brownfield Coal, Supercritical Utah-S 340 340 Brownfield Coal, Supercritical Wyoming 500 500 DSM, Summer Load Control East 44 44 DSM, Summer Load Control East 44 44 Greenfield Wet Cool CCCT w/ DF WMAIN 561 561 DSM, Summer Load Control West 44 44 DSM, Summer Load Control West 45 45
2,313
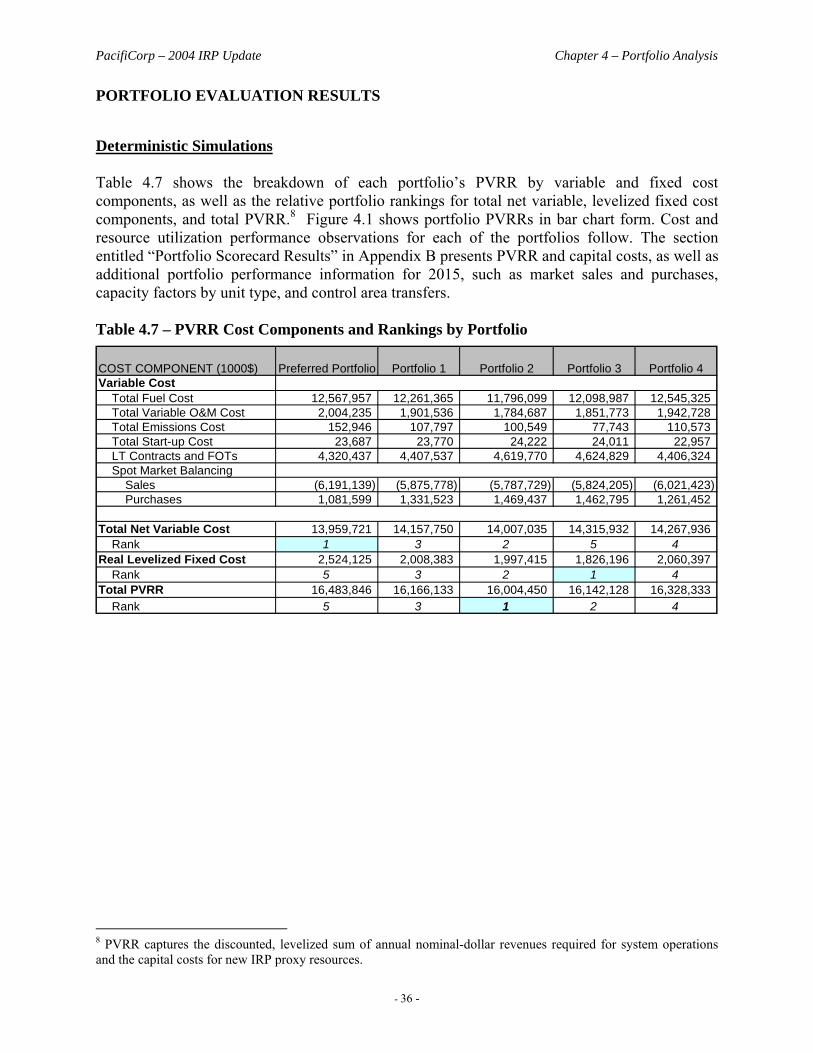
PacifiCorp – 2004 IRP Update Chapter 4 – Portfolio Analysis
- 36 -
PORTFOLIO EVALUATION RESULTS
Deterministic Simulations Table 4.7 shows the breakdown of each portfolio’s PVRR by variable and fixed cost components, as well as the relative portfolio rankings for total net variable, levelized fixed cost components, and total PVRR.8 Figure 4.1 shows portfolio PVRRs in bar chart form. Cost and resource utilization performance observations for each of the portfolios follow. The section entitled “Portfolio Scorecard Results” in Appendix B presents PVRR and capital costs, as well as additional portfolio performance information for 2015, such as market sales and purchases, capacity factors by unit type, and control area transfers. Table 4.7 – PVRR Cost Components and Rankings by Portfolio
COST COMPONENT (1000$) Preferred Portfolio Portfolio 1 Portfolio 2 Portfolio 3 Portfolio 4Variable Cost Total Fuel Cost 12,567,957 12,261,365 11,796,099 12,098,987 12,545,325 Total Variable O&M Cost 2,004,235 1,901,536 1,784,687 1,851,773 1,942,728 Total Emissions Cost 152,946 107,797 100,549 77,743 110,573 Total Start-up Cost 23,687 23,770 24,222 24,011 22,957 LT Contracts and FOTs 4,320,437 4,407,537 4,619,770 4,624,829 4,406,324 Spot Market Balancing Sales (6,191,139) (5,875,778) (5,787,729) (5,824,205) (6,021,423) Purchases 1,081,599 1,331,523 1,469,437 1,462,795 1,261,452
Total Net Variable Cost 13,959,721 14,157,750 14,007,035 14,315,932 14,267,936 Rank 1 3 2 5 4Real Levelized Fixed Cost 2,524,125 2,008,383 1,997,415 1,826,196 2,060,397 Rank 5 3 2 1 4Total PVRR 16,483,846 16,166,133 16,004,450 16,142,128 16,328,333 Rank 5 3 1 2 4
8 PVRR captures the discounted, levelized sum of annual nominal-dollar revenues required for system operations and the capital costs for new IRP proxy resources.
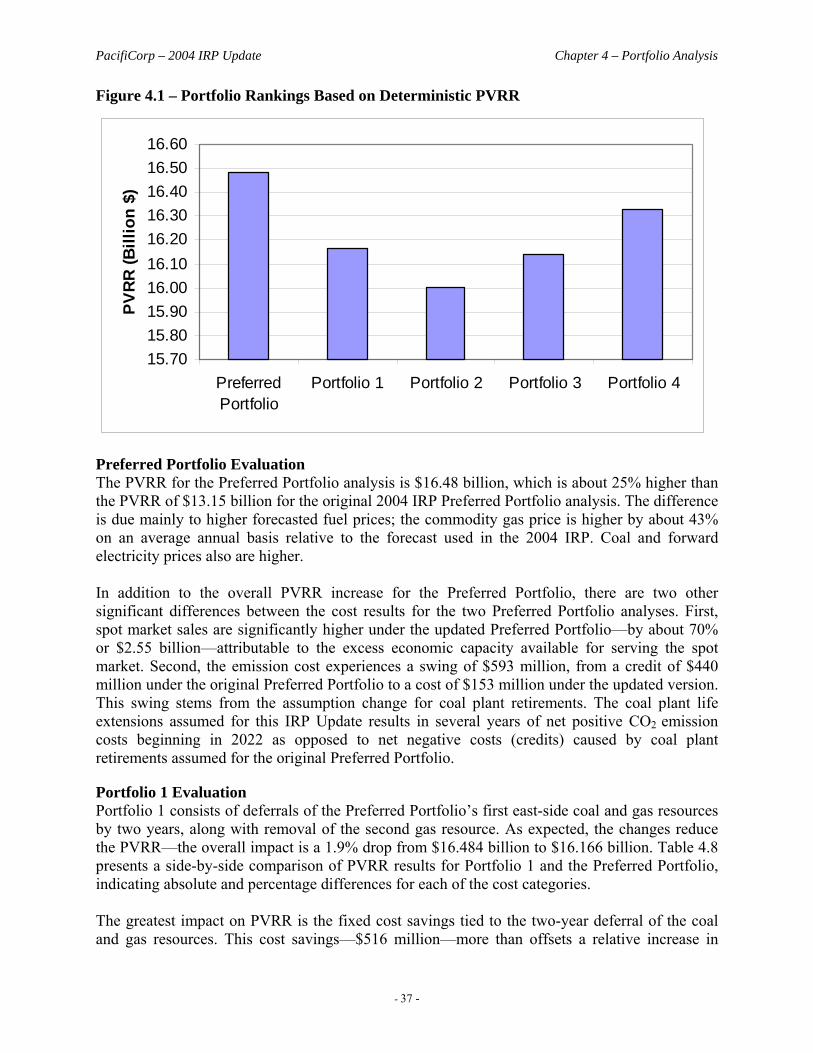
PacifiCorp – 2004 IRP Update Chapter 4 – Portfolio Analysis
- 37 -
Figure 4.1 – Portfolio Rankings Based on Deterministic PVRR
15.7015.8015.9016.0016.1016.2016.3016.4016.5016.60
PreferredPortfolio
Portfolio 1 Portfolio 2 Portfolio 3 Portfolio 4
PVRR
(Bill
ion
$)
Preferred Portfolio Evaluation The PVRR for the Preferred Portfolio analysis is $16.48 billion, which is about 25% higher than the PVRR of $13.15 billion for the original 2004 IRP Preferred Portfolio analysis. The difference is due mainly to higher forecasted fuel prices; the commodity gas price is higher by about 43% on an average annual basis relative to the forecast used in the 2004 IRP. Coal and forward electricity prices also are higher. In addition to the overall PVRR increase for the Preferred Portfolio, there are two other significant differences between the cost results for the two Preferred Portfolio analyses. First, spot market sales are significantly higher under the updated Preferred Portfolio—by about 70% or $2.55 billion—attributable to the excess economic capacity available for serving the spot market. Second, the emission cost experiences a swing of $593 million, from a credit of $440 million under the original Preferred Portfolio to a cost of $153 million under the updated version. This swing stems from the assumption change for coal plant retirements. The coal plant life extensions assumed for this IRP Update results in several years of net positive CO2 emission costs beginning in 2022 as opposed to net negative costs (credits) caused by coal plant retirements assumed for the original Preferred Portfolio.
Portfolio 1 Evaluation Portfolio 1 consists of deferrals of the Preferred Portfolio’s first east-side coal and gas resources by two years, along with removal of the second gas resource. As expected, the changes reduce the PVRR—the overall impact is a 1.9% drop from $16.484 billion to $16.166 billion. Table 4.8 presents a side-by-side comparison of PVRR results for Portfolio 1 and the Preferred Portfolio, indicating absolute and percentage differences for each of the cost categories. The greatest impact on PVRR is the fixed cost savings tied to the two-year deferral of the coal and gas resources. This cost savings—$516 million—more than offsets a relative increase in
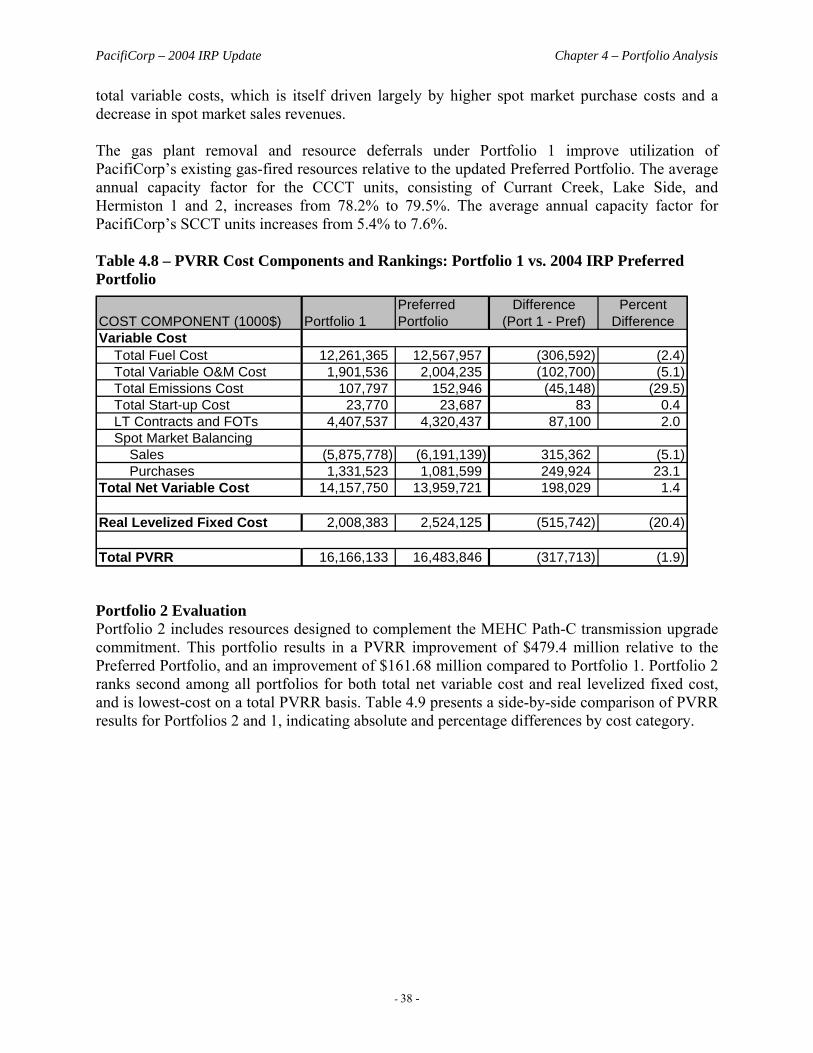
PacifiCorp – 2004 IRP Update Chapter 4 – Portfolio Analysis
- 38 -
total variable costs, which is itself driven largely by higher spot market purchase costs and a decrease in spot market sales revenues. The gas plant removal and resource deferrals under Portfolio 1 improve utilization of PacifiCorp’s existing gas-fired resources relative to the updated Preferred Portfolio. The average annual capacity factor for the CCCT units, consisting of Currant Creek, Lake Side, and Hermiston 1 and 2, increases from 78.2% to 79.5%. The average annual capacity factor for PacifiCorp’s SCCT units increases from 5.4% to 7.6%. Table 4.8 – PVRR Cost Components and Rankings: Portfolio 1 vs. 2004 IRP Preferred Portfolio
COST COMPONENT (1000$) Portfolio 1Preferred Portfolio
Difference(Port 1 - Pref)
Percent Difference
Variable Cost Total Fuel Cost 12,261,365 12,567,957 (306,592) (2.4) Total Variable O&M Cost 1,901,536 2,004,235 (102,700) (5.1) Total Emissions Cost 107,797 152,946 (45,148) (29.5) Total Start-up Cost 23,770 23,687 83 0.4 LT Contracts and FOTs 4,407,537 4,320,437 87,100 2.0 Spot Market Balancing Sales (5,875,778) (6,191,139) 315,362 (5.1) Purchases 1,331,523 1,081,599 249,924 23.1Total Net Variable Cost 14,157,750 13,959,721 198,029 1.4
Real Levelized Fixed Cost 2,008,383 2,524,125 (515,742) (20.4)
Total PVRR 16,166,133 16,483,846 (317,713) (1.9)
Portfolio 2 Evaluation Portfolio 2 includes resources designed to complement the MEHC Path-C transmission upgrade commitment. This portfolio results in a PVRR improvement of $479.4 million relative to the Preferred Portfolio, and an improvement of $161.68 million compared to Portfolio 1. Portfolio 2 ranks second among all portfolios for both total net variable cost and real levelized fixed cost, and is lowest-cost on a total PVRR basis. Table 4.9 presents a side-by-side comparison of PVRR results for Portfolios 2 and 1, indicating absolute and percentage differences by cost category.
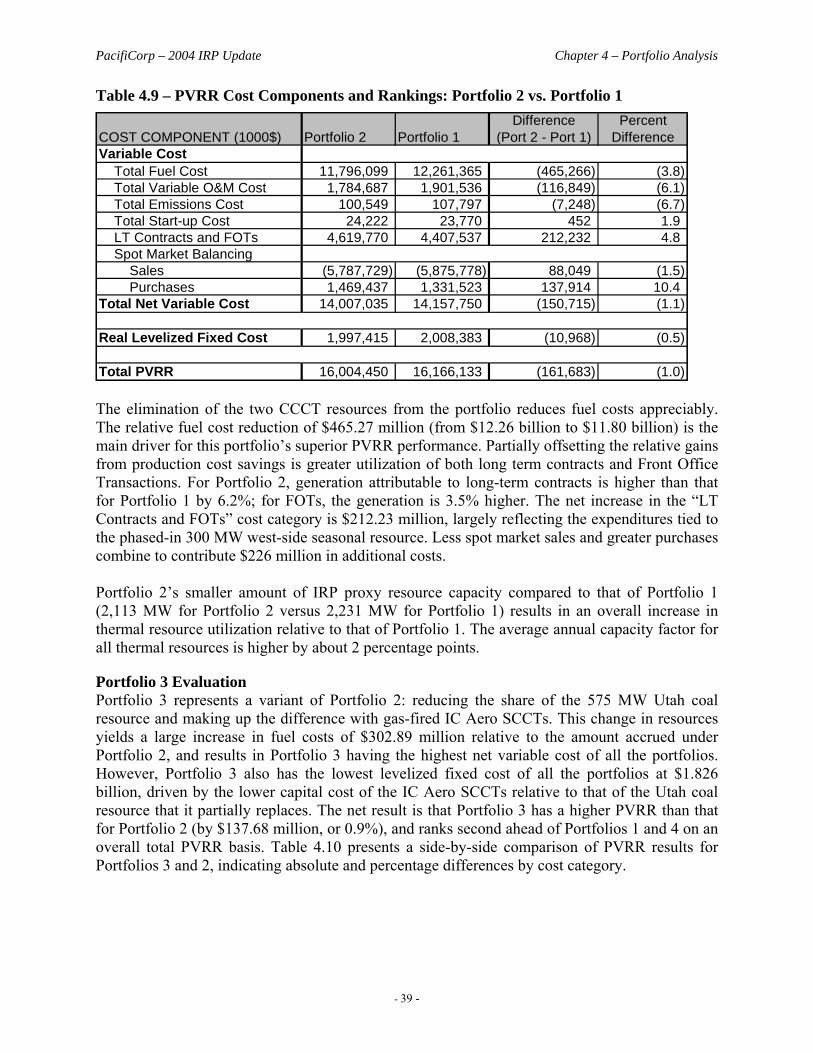
PacifiCorp – 2004 IRP Update Chapter 4 – Portfolio Analysis
- 39 -
Table 4.9 – PVRR Cost Components and Rankings: Portfolio 2 vs. Portfolio 1
COST COMPONENT (1000$) Portfolio 2 Portfolio 1Difference
(Port 2 - Port 1)Percent
DifferenceVariable Cost Total Fuel Cost 11,796,099 12,261,365 (465,266) (3.8) Total Variable O&M Cost 1,784,687 1,901,536 (116,849) (6.1) Total Emissions Cost 100,549 107,797 (7,248) (6.7) Total Start-up Cost 24,222 23,770 452 1.9 LT Contracts and FOTs 4,619,770 4,407,537 212,232 4.8 Spot Market Balancing Sales (5,787,729) (5,875,778) 88,049 (1.5) Purchases 1,469,437 1,331,523 137,914 10.4Total Net Variable Cost 14,007,035 14,157,750 (150,715) (1.1)
Real Levelized Fixed Cost 1,997,415 2,008,383 (10,968) (0.5)
Total PVRR 16,004,450 16,166,133 (161,683) (1.0) The elimination of the two CCCT resources from the portfolio reduces fuel costs appreciably. The relative fuel cost reduction of $465.27 million (from $12.26 billion to $11.80 billion) is the main driver for this portfolio’s superior PVRR performance. Partially offsetting the relative gains from production cost savings is greater utilization of both long term contracts and Front Office Transactions. For Portfolio 2, generation attributable to long-term contracts is higher than that for Portfolio 1 by 6.2%; for FOTs, the generation is 3.5% higher. The net increase in the “LT Contracts and FOTs” cost category is $212.23 million, largely reflecting the expenditures tied to the phased-in 300 MW west-side seasonal resource. Less spot market sales and greater purchases combine to contribute $226 million in additional costs. Portfolio 2’s smaller amount of IRP proxy resource capacity compared to that of Portfolio 1 (2,113 MW for Portfolio 2 versus 2,231 MW for Portfolio 1) results in an overall increase in thermal resource utilization relative to that of Portfolio 1. The average annual capacity factor for all thermal resources is higher by about 2 percentage points.
Portfolio 3 Evaluation Portfolio 3 represents a variant of Portfolio 2: reducing the share of the 575 MW Utah coal resource and making up the difference with gas-fired IC Aero SCCTs. This change in resources yields a large increase in fuel costs of $302.89 million relative to the amount accrued under Portfolio 2, and results in Portfolio 3 having the highest net variable cost of all the portfolios. However, Portfolio 3 also has the lowest levelized fixed cost of all the portfolios at $1.826 billion, driven by the lower capital cost of the IC Aero SCCTs relative to that of the Utah coal resource that it partially replaces. The net result is that Portfolio 3 has a higher PVRR than that for Portfolio 2 (by $137.68 million, or 0.9%), and ranks second ahead of Portfolios 1 and 4 on an overall total PVRR basis. Table 4.10 presents a side-by-side comparison of PVRR results for Portfolios 3 and 2, indicating absolute and percentage differences by cost category.

PacifiCorp – 2004 IRP Update Chapter 4 – Portfolio Analysis
- 40 -
Table 4.10 – PVRR Cost Components and Rankings: Portfolio 3 vs. Portfolio 2
COST COMPONENT (1000$) Portfolio 3 Portfolio 2Difference
(Port 3 - Port 2)Percent
DifferenceVariable Cost Total Fuel Cost 12,098,987 11,796,099 302,888 2.6 Total Variable O&M Cost 1,851,773 1,784,687 67,086 3.8 Total Emissions Cost 77,743 100,549 (22,807) (22.7) Total Start-up Cost 24,011 24,222 (211) (0.9) LT Contracts and FOTs 4,624,829 4,619,770 5,059 0.1 Spot Market Balancing Sales (5,824,205) (5,787,729) (36,477) 0.6 Purchases 1,462,795 1,469,437 (6,642) (0.5)Total Net Variable Cost 14,315,932 14,007,035 308,897 2.2
Real Levelized Fixed Cost 1,826,196 1,997,415 (171,219) (8.6)
Total PVRR 16,142,128 16,004,450 137,678 0.9 The increase in Portfolio 3’s fuel cost relative to that of Portfolio 2 parallels higher relative utilization of gas resources; the average annual capacity factor for all gas resources is 1.5 percentage points higher for Portfolio 3. (Recall that 261 MWs of IC Aero SCCT capacity is displacing coal-based capacity.)
Portfolio 4 Evaluation Portfolio 4 represents a variant of Portfolio 3 in which the Path-C transmission upgrade is removed, and the associated 300 MW west-side seasonal resource is replaced with both CCCT and IC Aero SCCT capacity. The PVRR results indicate that the Path-C-related generation and transmission resources of Portfolio 3 produce a net benefit of $186.21 million relative to the gas resource mix and associated transmission employed for Portfolio 4. Table 4.11 presents a side-by-side comparison of PVRR results for Portfolios 4 and 3, indicating absolute and percentage differences by cost category. As shown in Table 4.11, the replacement of the west-side seasonal resource with the gas plants increases fuel costs by $446.34 million, and increases variable O&M and emission costs as well. However, a decrease in contract-related variable costs and spot market purchase costs, combined with an increase in spot market sales revenues, results in a net $48 million reduction in total net variable costs. The driving factor for Portfolio 4’s higher overall PVRR is the levelized fixed cost, which is $234.2 million greater than that for Portfolio 3, mainly a result of adding back the 561 MW east-side CCCT. Portfolio 3 ranks fourth among the five portfolios for both net variable costs and real levelized fixed costs. Regarding comparative resource utilization with respect to Portfolio 3, Portfolio 4 has a slightly lower average annual capacity factor for both existing SCCT and CCCT resources. The capacity factors for existing coal plants are nearly identical.
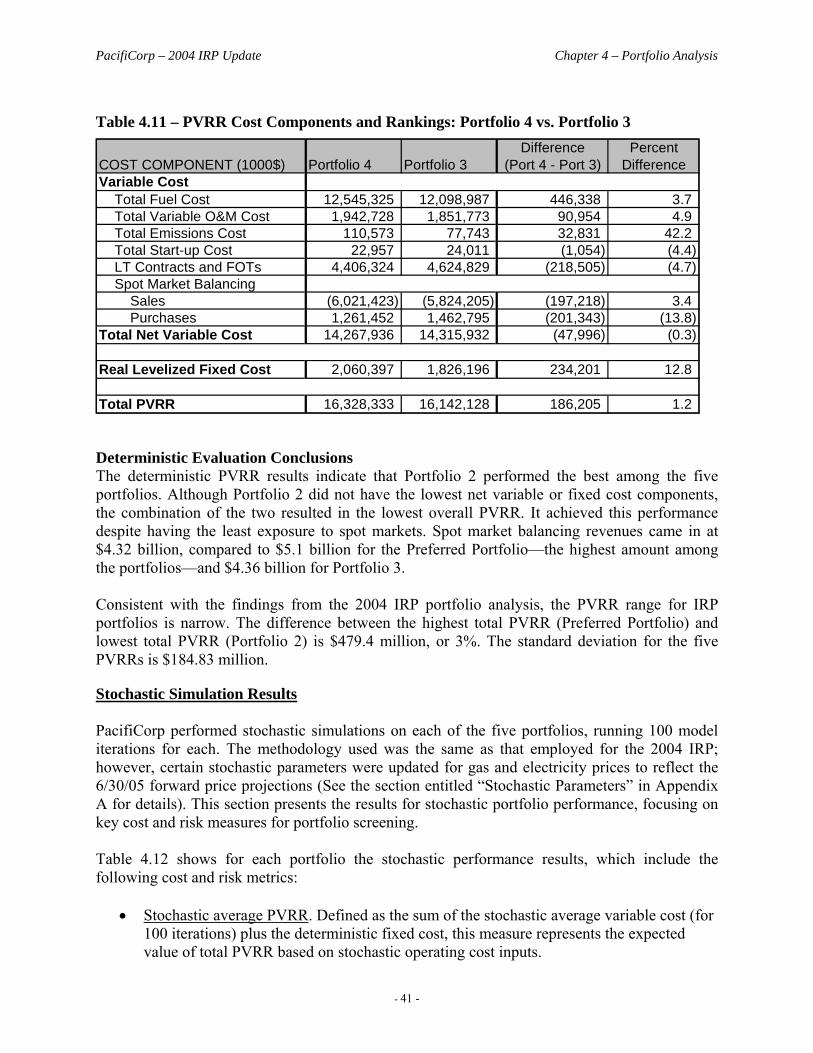
PacifiCorp – 2004 IRP Update Chapter 4 – Portfolio Analysis
- 41 -
Table 4.11 – PVRR Cost Components and Rankings: Portfolio 4 vs. Portfolio 3
COST COMPONENT (1000$) Portfolio 4 Portfolio 3Difference
(Port 4 - Port 3)Percent
DifferenceVariable Cost Total Fuel Cost 12,545,325 12,098,987 446,338 3.7 Total Variable O&M Cost 1,942,728 1,851,773 90,954 4.9 Total Emissions Cost 110,573 77,743 32,831 42.2 Total Start-up Cost 22,957 24,011 (1,054) (4.4) LT Contracts and FOTs 4,406,324 4,624,829 (218,505) (4.7) Spot Market Balancing Sales (6,021,423) (5,824,205) (197,218) 3.4 Purchases 1,261,452 1,462,795 (201,343) (13.8)Total Net Variable Cost 14,267,936 14,315,932 (47,996) (0.3)
Real Levelized Fixed Cost 2,060,397 1,826,196 234,201 12.8
Total PVRR 16,328,333 16,142,128 186,205 1.2
Deterministic Evaluation Conclusions The deterministic PVRR results indicate that Portfolio 2 performed the best among the five portfolios. Although Portfolio 2 did not have the lowest net variable or fixed cost components, the combination of the two resulted in the lowest overall PVRR. It achieved this performance despite having the least exposure to spot markets. Spot market balancing revenues came in at $4.32 billion, compared to $5.1 billion for the Preferred Portfolio—the highest amount among the portfolios—and $4.36 billion for Portfolio 3. Consistent with the findings from the 2004 IRP portfolio analysis, the PVRR range for IRP portfolios is narrow. The difference between the highest total PVRR (Preferred Portfolio) and lowest total PVRR (Portfolio 2) is $479.4 million, or 3%. The standard deviation for the five PVRRs is $184.83 million.
Stochastic Simulation Results PacifiCorp performed stochastic simulations on each of the five portfolios, running 100 model iterations for each. The methodology used was the same as that employed for the 2004 IRP; however, certain stochastic parameters were updated for gas and electricity prices to reflect the 6/30/05 forward price projections (See the section entitled “Stochastic Parameters” in Appendix A for details). This section presents the results for stochastic portfolio performance, focusing on key cost and risk measures for portfolio screening. Table 4.12 shows for each portfolio the stochastic performance results, which include the following cost and risk metrics:
• Stochastic average PVRR. Defined as the sum of the stochastic average variable cost (for 100 iterations) plus the deterministic fixed cost, this measure represents the expected value of total PVRR based on stochastic operating cost inputs.
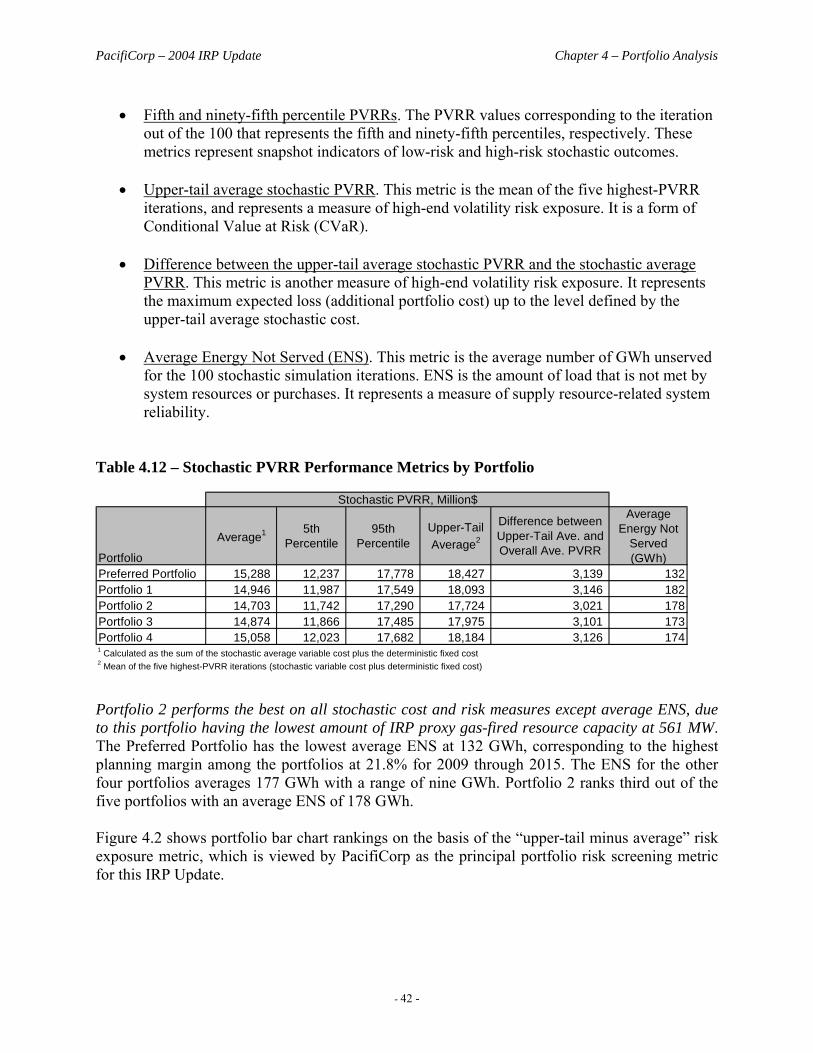
PacifiCorp – 2004 IRP Update Chapter 4 – Portfolio Analysis
- 42 -
• Fifth and ninety-fifth percentile PVRRs. The PVRR values corresponding to the iteration
out of the 100 that represents the fifth and ninety-fifth percentiles, respectively. These metrics represent snapshot indicators of low-risk and high-risk stochastic outcomes.
• Upper-tail average stochastic PVRR. This metric is the mean of the five highest-PVRR
iterations, and represents a measure of high-end volatility risk exposure. It is a form of Conditional Value at Risk (CVaR).
• Difference between the upper-tail average stochastic PVRR and the stochastic average
PVRR. This metric is another measure of high-end volatility risk exposure. It represents the maximum expected loss (additional portfolio cost) up to the level defined by the upper-tail average stochastic cost.
• Average Energy Not Served (ENS). This metric is the average number of GWh unserved
for the 100 stochastic simulation iterations. ENS is the amount of load that is not met by system resources or purchases. It represents a measure of supply resource-related system reliability.
Table 4.12 – Stochastic PVRR Performance Metrics by Portfolio
Portfolio
Average1 5th Percentile
95th Percentile
Upper-Tail Average2
Difference between Upper-Tail Ave. and Overall Ave. PVRR
Average Energy Not
Served(GWh)
Preferred Portfolio 15,288 12,237 17,778 18,427 3,139 132Portfolio 1 14,946 11,987 17,549 18,093 3,146 182Portfolio 2 14,703 11,742 17,290 17,724 3,021 178Portfolio 3 14,874 11,866 17,485 17,975 3,101 173Portfolio 4 15,058 12,023 17,682 18,184 3,126 1741 Calculated as the sum of the stochastic average variable cost plus the deterministic fixed cost2 Mean of the five highest-PVRR iterations (stochastic variable cost plus deterministic fixed cost)
Stochastic PVRR, Million$
Portfolio 2 performs the best on all stochastic cost and risk measures except average ENS, due to this portfolio having the lowest amount of IRP proxy gas-fired resource capacity at 561 MW. The Preferred Portfolio has the lowest average ENS at 132 GWh, corresponding to the highest planning margin among the portfolios at 21.8% for 2009 through 2015. The ENS for the other four portfolios averages 177 GWh with a range of nine GWh. Portfolio 2 ranks third out of the five portfolios with an average ENS of 178 GWh. Figure 4.2 shows portfolio bar chart rankings on the basis of the “upper-tail minus average” risk exposure metric, which is viewed by PacifiCorp as the principal portfolio risk screening metric for this IRP Update.
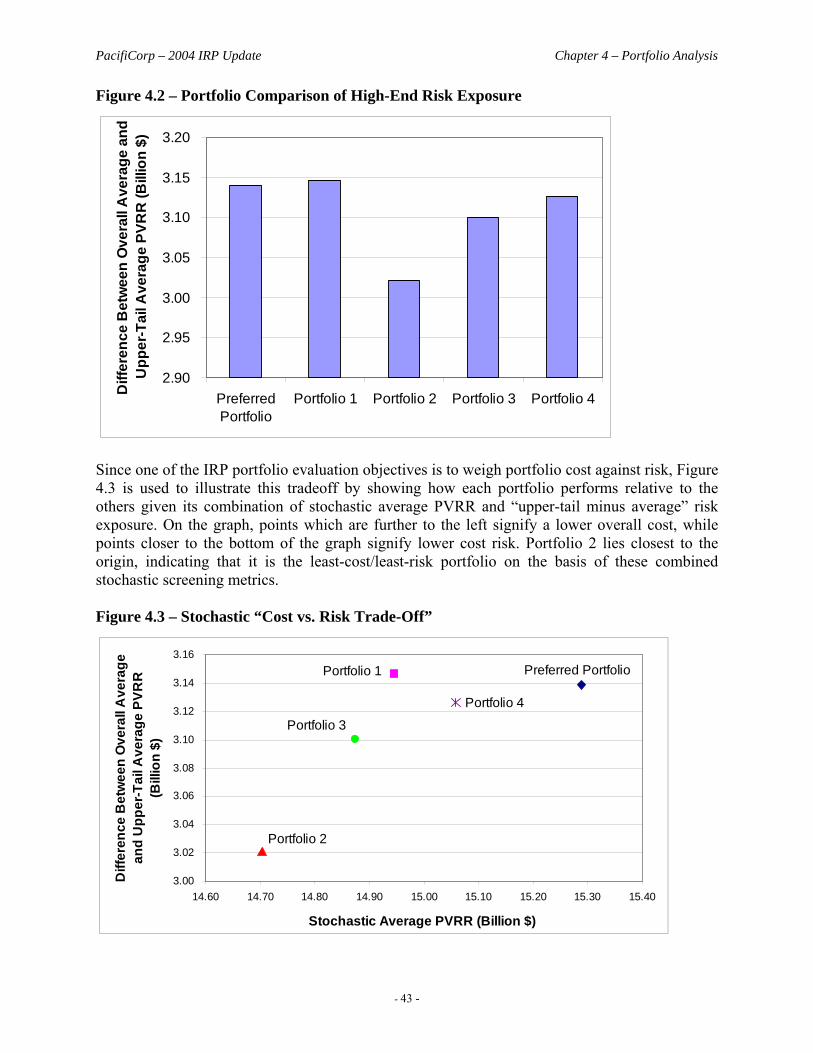
PacifiCorp – 2004 IRP Update Chapter 4 – Portfolio Analysis
- 43 -
Figure 4.2 – Portfolio Comparison of High-End Risk Exposure
2.90
2.95
3.00
3.05
3.10
3.15
3.20
PreferredPortfolio
Portfolio 1 Portfolio 2 Portfolio 3 Portfolio 4Diff
eren
ce B
etw
een
Ove
rall
Ave
rage
and
U
pper
-Tai
l Ave
rage
PVR
R (B
illio
n $)
Since one of the IRP portfolio evaluation objectives is to weigh portfolio cost against risk, Figure 4.3 is used to illustrate this tradeoff by showing how each portfolio performs relative to the others given its combination of stochastic average PVRR and “upper-tail minus average” risk exposure. On the graph, points which are further to the left signify a lower overall cost, while points closer to the bottom of the graph signify lower cost risk. Portfolio 2 lies closest to the origin, indicating that it is the least-cost/least-risk portfolio on the basis of these combined stochastic screening metrics. Figure 4.3 – Stochastic “Cost vs. Risk Trade-Off”
Portfolio 4
Preferred PortfolioPortfolio 1
Portfolio 2
Portfolio 3
3.00
3.02
3.04
3.06
3.08
3.10
3.12
3.14
3.16
14.60 14.70 14.80 14.90 15.00 15.10 15.20 15.30 15.40
Stochastic Average PVRR (Billion $)
Diff
eren
ce B
etw
een
Ove
rall
Ave
rage
an
d U
pper
-Tai
l Ave
rage
PVR
R
(Bill
ion
$)

PacifiCorp – 2004 IRP Update Chapter 4 – Portfolio Analysis
- 44 -
To confirm whether these cost/risk tradeoff results are statistically valid, paired-difference statistical tests were performed on the stochastic average PVRR and the upper-tail/overall average PVRR difference. For the stochastic average PVRR, the t-statistics for the paired differences indicate that all portfolios have statistically different values.9 For the upper-tail/overall average PVRR difference, the paired-difference tests were also conducted. The test results indicate that most of the differences are not statistically significant. The statistically significant differences were between portfolios 1 and 2 and portfolios 2 and 4. The other pairings with portfolio 2 were close, but not significant at the 5% confidence level.
CONCLUSIONS
Portfolio 2 has been deemed as having the lowest combination of overall cost and risk based on the PVRR and risk screening metrics selected for this portfolio analysis. As discussed above, the deterministic PVRRs of the portfolios are all relatively close—within a range of 3%. Consequently, the IRP proxy resources used in the other alternative portfolios still remain viable portfolio resource options if needed.
9 The t-statistic determines to what degree two means are statistically different. The smallest t-statistic value, 5.8, was for the Portfolio 1/Portfolio 3 pair. The difference in the stochastic average PVRRs for these two portfolios is statistically significant with a confidence level greater than 99.9%.
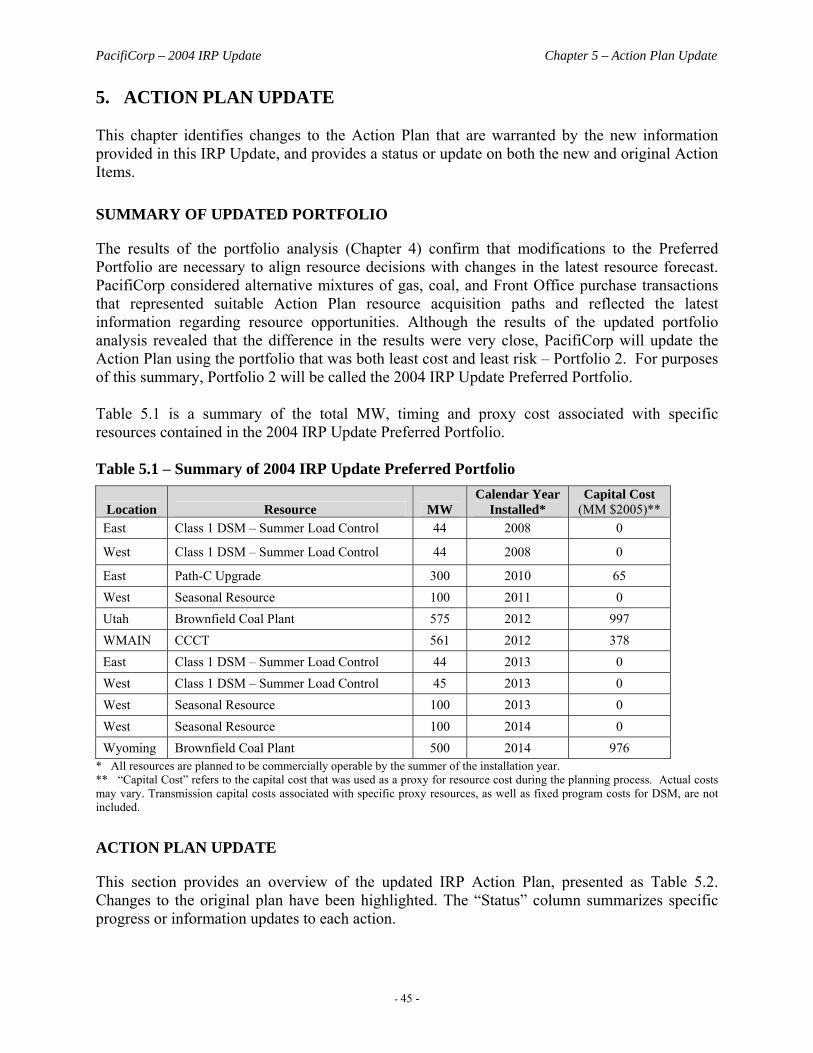
PacifiCorp – 2004 IRP Update Chapter 5 – Action Plan Update
- 45 -
5. ACTION PLAN UPDATE This chapter identifies changes to the Action Plan that are warranted by the new information provided in this IRP Update, and provides a status or update on both the new and original Action Items.
SUMMARY OF UPDATED PORTFOLIO
The results of the portfolio analysis (Chapter 4) confirm that modifications to the Preferred Portfolio are necessary to align resource decisions with changes in the latest resource forecast. PacifiCorp considered alternative mixtures of gas, coal, and Front Office purchase transactions that represented suitable Action Plan resource acquisition paths and reflected the latest information regarding resource opportunities. Although the results of the updated portfolio analysis revealed that the difference in the results were very close, PacifiCorp will update the Action Plan using the portfolio that was both least cost and least risk – Portfolio 2. For purposes of this summary, Portfolio 2 will be called the 2004 IRP Update Preferred Portfolio. Table 5.1 is a summary of the total MW, timing and proxy cost associated with specific resources contained in the 2004 IRP Update Preferred Portfolio. Table 5.1 – Summary of 2004 IRP Update Preferred Portfolio
Location Resource MW Calendar Year
Installed* Capital Cost
(MM $2005)** East Class 1 DSM – Summer Load Control 44 2008 0
West Class 1 DSM – Summer Load Control 44 2008 0
East Path-C Upgrade 300 2010 65 West Seasonal Resource 100 2011 0 Utah Brownfield Coal Plant 575 2012 997 WMAIN CCCT 561 2012 378 East Class 1 DSM – Summer Load Control 44 2013 0 West Class 1 DSM – Summer Load Control 45 2013 0 West Seasonal Resource 100 2013 0 West Seasonal Resource 100 2014 0 Wyoming Brownfield Coal Plant 500 2014 976
* All resources are planned to be commercially operable by the summer of the installation year. ** “Capital Cost” refers to the capital cost that was used as a proxy for resource cost during the planning process. Actual costs may vary. Transmission capital costs associated with specific proxy resources, as well as fixed program costs for DSM, are not included.
ACTION PLAN UPDATE
This section provides an overview of the updated IRP Action Plan, presented as Table 5.2. Changes to the original plan have been highlighted. The “Status” column summarizes specific progress or information updates to each action.
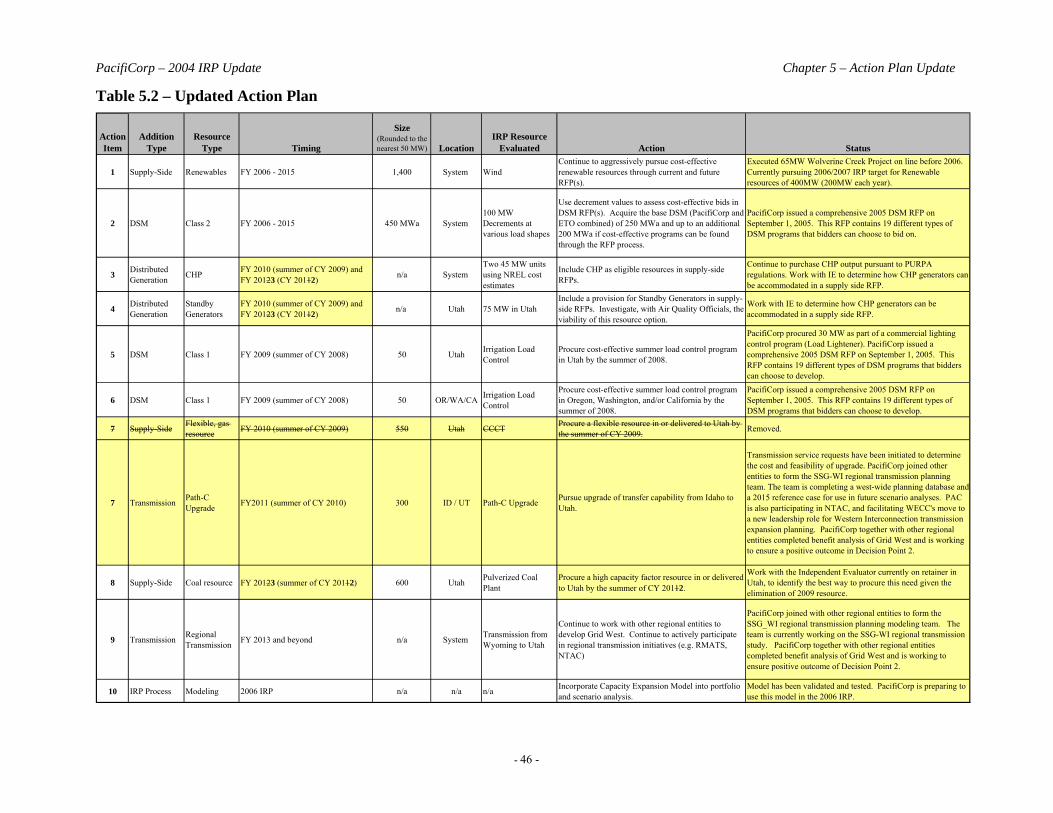
PacifiCorp – 2004 IRP Update Chapter 5 – Action Plan Update
- 46 -
Table 5.2 – Updated Action Plan
Action Item
Addition Type
Resource Type Timing
Size (Rounded to the nearest 50 MW) Location
IRP Resource Evaluated Action Status
1 Supply-Side Renewables FY 2006 - 2015 1,400 System WindContinue to aggressively pursue cost-effective renewable resources through current and future RFP(s).
Executed 65MW Wolverine Creek Project on line before 2006. Currently pursuing 2006/2007 IRP target for Renewable resources of 400MW (200MW each year).
2 DSM Class 2 FY 2006 - 2015 450 MWa System 100 MW Decrements at various load shapes
Use decrement values to assess cost-effective bids in DSM RFP(s). Acquire the base DSM (PacifiCorp and ETO combined) of 250 MWa and up to an additional 200 MWa if cost-effective programs can be found through the RFP process.
PacifiCorp issued a comprehensive 2005 DSM RFP on September 1, 2005. This RFP contains 19 different types of DSM programs that bidders can choose to bid on.
3 Distributed Generation CHP FY 2010 (summer of CY 2009) and
FY 20123 (CY 20112) n/a System Two 45 MW units using NREL cost estimates
Include CHP as eligible resources in supply-side RFPs.
Continue to purchase CHP output pursuant to PURPA regulations. Work with IE to determine how CHP generators can be accommodated in a supply side RFP.
4 Distributed Generation
Standby Generators
FY 2010 (summer of CY 2009) and FY 20123 (CY 20112) n/a Utah 75 MW in Utah
Include a provision for Standby Generators in supply-side RFPs. Investigate, with Air Quality Officials, the viability of this resource option.
Work with IE to determine how CHP generators can be accommodated in a supply side RFP.
5 DSM Class 1 FY 2009 (summer of CY 2008) 50 Utah Irrigation Load Control
Procure cost-effective summer load control program in Utah by the summer of 2008.
PacifiCorp procured 30 MW as part of a commercial lighting control program (Load Lightener). PacifiCorp issued a comprehensive 2005 DSM RFP on September 1, 2005. This RFP contains 19 different types of DSM programs that bidders can choose to develop.
6 DSM Class 1 FY 2009 (summer of CY 2008) 50 OR/WA/CA Irrigation Load Control
Procure cost-effective summer load control program in Oregon, Washington, and/or California by the summer of 2008.
PacifiCorp issued a comprehensive 2005 DSM RFP on September 1, 2005. This RFP contains 19 different types of DSM programs that bidders can choose to develop.
7 Supply-Side Flexible, gas resource FY 2010 (summer of CY 2009) 550 Utah CCCT Procure a flexible resource in or delivered to Utah by
the summer of CY 2009. Removed.
7 Transmission Path-C Upgrade FY2011 (summer of CY 2010) 300 ID / UT Path-C Upgrade Pursue upgrade of transfer capability from Idaho to
Utah.
Transmission service requests have been initiated to determine the cost and feasibility of upgrade. PacifiCorp joined other entities to form the SSG-WI regional transmission planning team. The team is completing a west-wide planning database and a 2015 reference case for use in future scenario analyses. PAC is also participating in NTAC, and facilitating WECC's move to a new leadership role for Western Interconnection transmission expansion planning. PacifiCorp together with other regional entities completed benefit analysis of Grid West and is working to ensure a positive outcome in Decision Point 2.
8 Supply-Side Coal resource FY 20123 (summer of CY 20112) 600 Utah Pulverized Coal Plant
Procure a high capacity factor resource in or delivered to Utah by the summer of CY 20112.
Work with the Independent Evaluator currently on retainer in Utah, to identify the best way to procure this need given the elimination of 2009 resource.
9 Transmission Regional Transmission FY 2013 and beyond n/a System Transmission from
Wyoming to Utah
Continue to work with other regional entities to develop Grid West. Continue to actively participate in regional transmission initiatives (e.g. RMATS, NTAC)
PacifiCorp joined with other regional entities to form the SSG_WI regional transmission planning modeling team. The team is currently working on the SSG-WI regional transmission study. PacifiCorp together with other regional entities completed benefit analysis of Grid West and is working to ensure positive outcome of Decision Point 2.
10 IRP Process Modeling 2006 IRP n/a n/a n/a Incorporate Capacity Expansion Model into portfolio and scenario analysis.
Model has been validated and tested. PacifiCorp is preparing to use this model in the 2006 IRP.
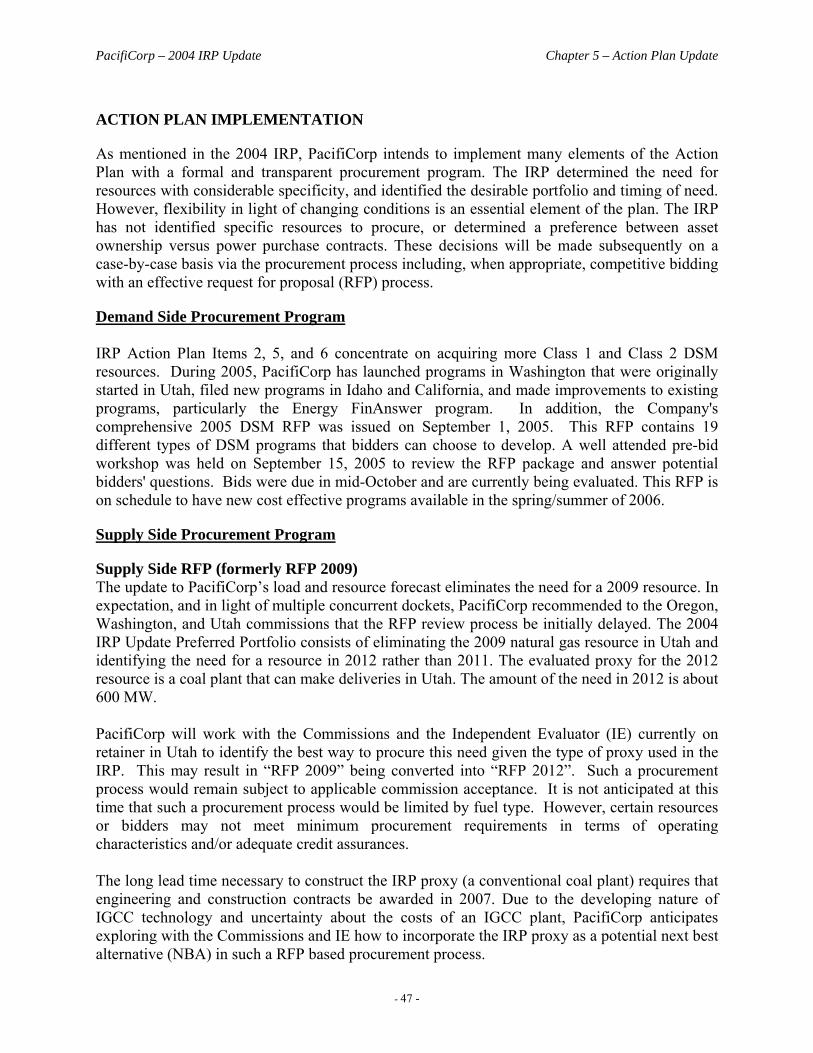
PacifiCorp – 2004 IRP Update Chapter 5 – Action Plan Update
- 47 -
ACTION PLAN IMPLEMENTATION
As mentioned in the 2004 IRP, PacifiCorp intends to implement many elements of the Action Plan with a formal and transparent procurement program. The IRP determined the need for resources with considerable specificity, and identified the desirable portfolio and timing of need. However, flexibility in light of changing conditions is an essential element of the plan. The IRP has not identified specific resources to procure, or determined a preference between asset ownership versus power purchase contracts. These decisions will be made subsequently on a case-by-case basis via the procurement process including, when appropriate, competitive bidding with an effective request for proposal (RFP) process.
Demand Side Procurement Program IRP Action Plan Items 2, 5, and 6 concentrate on acquiring more Class 1 and Class 2 DSM resources. During 2005, PacifiCorp has launched programs in Washington that were originally started in Utah, filed new programs in Idaho and California, and made improvements to existing programs, particularly the Energy FinAnswer program. In addition, the Company's comprehensive 2005 DSM RFP was issued on September 1, 2005. This RFP contains 19 different types of DSM programs that bidders can choose to develop. A well attended pre-bid workshop was held on September 15, 2005 to review the RFP package and answer potential bidders' questions. Bids were due in mid-October and are currently being evaluated. This RFP is on schedule to have new cost effective programs available in the spring/summer of 2006.
Supply Side Procurement Program
Supply Side RFP (formerly RFP 2009) The update to PacifiCorp’s load and resource forecast eliminates the need for a 2009 resource. In expectation, and in light of multiple concurrent dockets, PacifiCorp recommended to the Oregon, Washington, and Utah commissions that the RFP review process be initially delayed. The 2004 IRP Update Preferred Portfolio consists of eliminating the 2009 natural gas resource in Utah and identifying the need for a resource in 2012 rather than 2011. The evaluated proxy for the 2012 resource is a coal plant that can make deliveries in Utah. The amount of the need in 2012 is about 600 MW. PacifiCorp will work with the Commissions and the Independent Evaluator (IE) currently on retainer in Utah to identify the best way to procure this need given the type of proxy used in the IRP. This may result in “RFP 2009” being converted into “RFP 2012”. Such a procurement process would remain subject to applicable commission acceptance. It is not anticipated at this time that such a procurement process would be limited by fuel type. However, certain resources or bidders may not meet minimum procurement requirements in terms of operating characteristics and/or adequate credit assurances. The long lead time necessary to construct the IRP proxy (a conventional coal plant) requires that engineering and construction contracts be awarded in 2007. Due to the developing nature of IGCC technology and uncertainty about the costs of an IGCC plant, PacifiCorp anticipates exploring with the Commissions and IE how to incorporate the IRP proxy as a potential next best alternative (NBA) in such a RFP based procurement process.
PacifiCorp – 2004 IRP Update Chapter 5 – Action Plan Update
- 48 -
Renewables RFP The Renewable Request for Proposal (RFP) was initially issued in February 2004. The Company received a strong response to the RFP, with more than 50 proposals totaling over 6,000 MW of capability. About 2,000 MW fell to the shortlist. Events moved rapidly after the Production Tax Credit (PTC) passed in October 2004. Wind turbine costs took a sharp jump due to increases in steel prices, the falling dollar, and ultimately a scarcity of the turbines themselves. At the same time, oil and natural gas prices put significant upward pressures on wholesale electric prices. PacifiCorp’s goal is to move forward on projects that are determined to be cost effective as measured against forward price projections (adjusted on a project-specific basis) and that are consistent with 2004 IRP assumptions. Of the eight short listed proposals for 2005, four fell away within a few weeks with two being withdrawn at the bidders’ request. The remaining four soon became two due to the inability of bidders to complete projects in 2005. One of the remaining two projects experienced extreme difficulty obtaining wind turbines and ultimately could not proffer an economic offer, even with support from the Energy Trust of Oregon. As discussed in Chapter 2, PacifiCorp completed negotiations on a 64.5 MW wind project to be completed by the end of 2005 in southeastern Idaho. The project was originally to be larger, but was limited due to wind turbine availability. The new project, Wolverine Creek wind farm, is to be built and financed by Invenergy. With the extension of the PTC, to include 2006 and 2007, negotiations with bidders continue with a focus on Projects that can be on line prior to December 31, 2007. Current discussions with short listed bidders continue. The feasibility of these Projects will depend on their economics, turbine availability and transmission. Following completion of negotiations for 2006 and 2007 projects, and barring some unanticipated market event (such as new or revised production tax credit provisions), PacifiCorp currently anticipates bringing RFP 2003B to a close and starting a new renewable resource procurement process.
SUMMARY
This IRP Update is based on the best information available at the time of the filing. It will be implemented as described, but is subject to change as new information becomes available or as circumstances change. The IRP Action Plan is the primary driver for PacifiCorp’s resource procurement going forward. In implementing the Plan, all resource options will be compared to alternative resource options (either from the market or from other existing potential electricity suppliers). The proposed Procurement Program will also ensure consistency with anticipated ratemaking requirements, including industry restructuring implementation in Oregon.
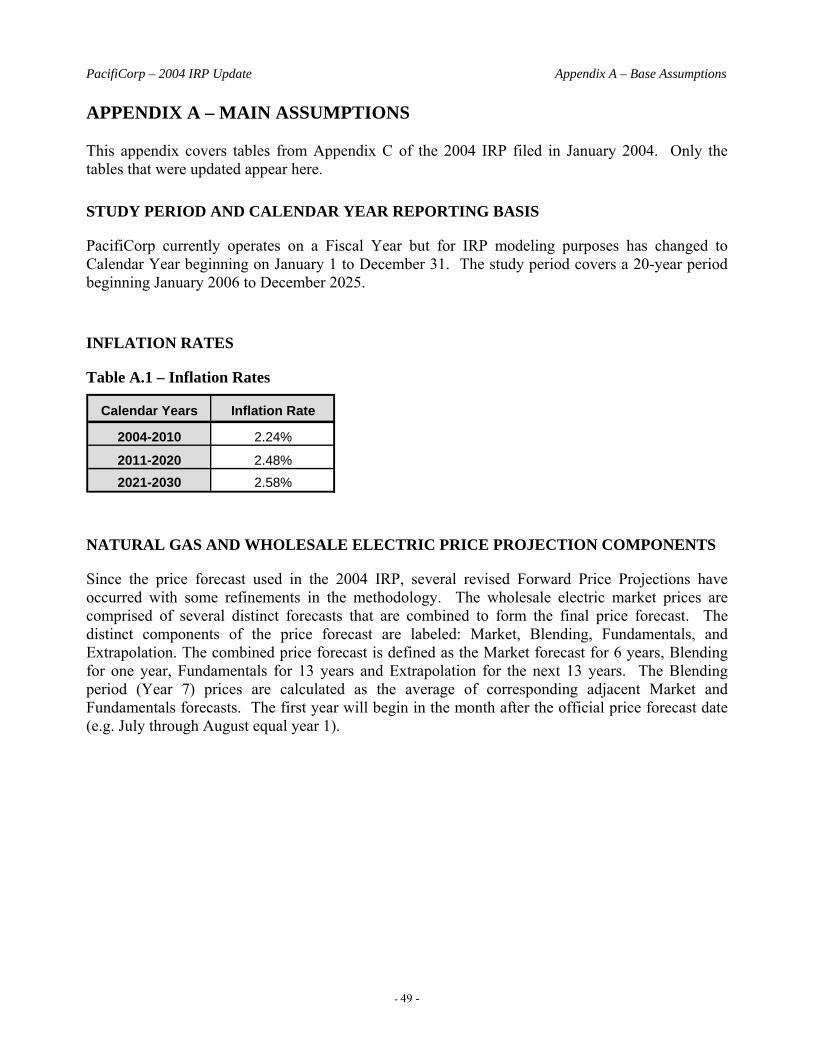
PacifiCorp – 2004 IRP Update Appendix A – Base Assumptions
- 49 -
APPENDIX A – MAIN ASSUMPTIONS This appendix covers tables from Appendix C of the 2004 IRP filed in January 2004. Only the tables that were updated appear here.
STUDY PERIOD AND CALENDAR YEAR REPORTING BASIS
PacifiCorp currently operates on a Fiscal Year but for IRP modeling purposes has changed to Calendar Year beginning on January 1 to December 31. The study period covers a 20-year period beginning January 2006 to December 2025.
INFLATION RATES
Table A.1 – Inflation Rates
NATURAL GAS AND WHOLESALE ELECTRIC PRICE PROJECTION COMPONENTS
Since the price forecast used in the 2004 IRP, several revised Forward Price Projections have occurred with some refinements in the methodology. The wholesale electric market prices are comprised of several distinct forecasts that are combined to form the final price forecast. The distinct components of the price forecast are labeled: Market, Blending, Fundamentals, and Extrapolation. The combined price forecast is defined as the Market forecast for 6 years, Blending for one year, Fundamentals for 13 years and Extrapolation for the next 13 years. The Blending period (Year 7) prices are calculated as the average of corresponding adjacent Market and Fundamentals forecasts. The first year will begin in the month after the official price forecast date (e.g. July through August equal year 1).
Calendar Years Inflation Rate
2004-2010 2.24%
2011-2020 2.48%2021-2030 2.58%
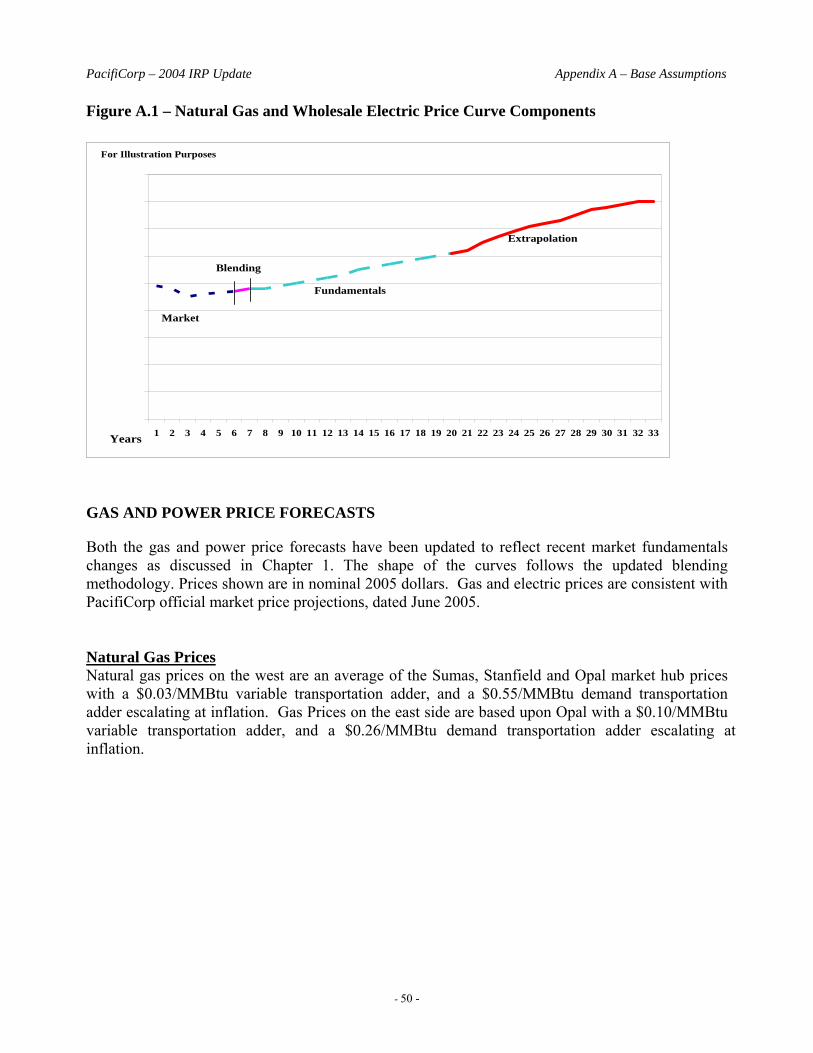
PacifiCorp – 2004 IRP Update Appendix A – Base Assumptions
- 50 -
Figure A.1 – Natural Gas and Wholesale Electric Price Curve Components
GAS AND POWER PRICE FORECASTS
Both the gas and power price forecasts have been updated to reflect recent market fundamentals changes as discussed in Chapter 1. The shape of the curves follows the updated blending methodology. Prices shown are in nominal 2005 dollars. Gas and electric prices are consistent with PacifiCorp official market price projections, dated June 2005. Natural Gas Prices Natural gas prices on the west are an average of the Sumas, Stanfield and Opal market hub prices with a $0.03/MMBtu variable transportation adder, and a $0.55/MMBtu demand transportation adder escalating at inflation. Gas Prices on the east side are based upon Opal with a $0.10/MMBtu variable transportation adder, and a $0.26/MMBtu demand transportation adder escalating at inflation.
For Illustration Purposes
0
10
20
30
40
50
60
70
80
90
1 2 3 4 5 6 7 8 9 10 11 12 13 14 15 16 17 18 19 20 21 22 23 24 25 26 27 28 29 30 31 32 33Years
Blending
Fundamentals
Extrapolation
Market
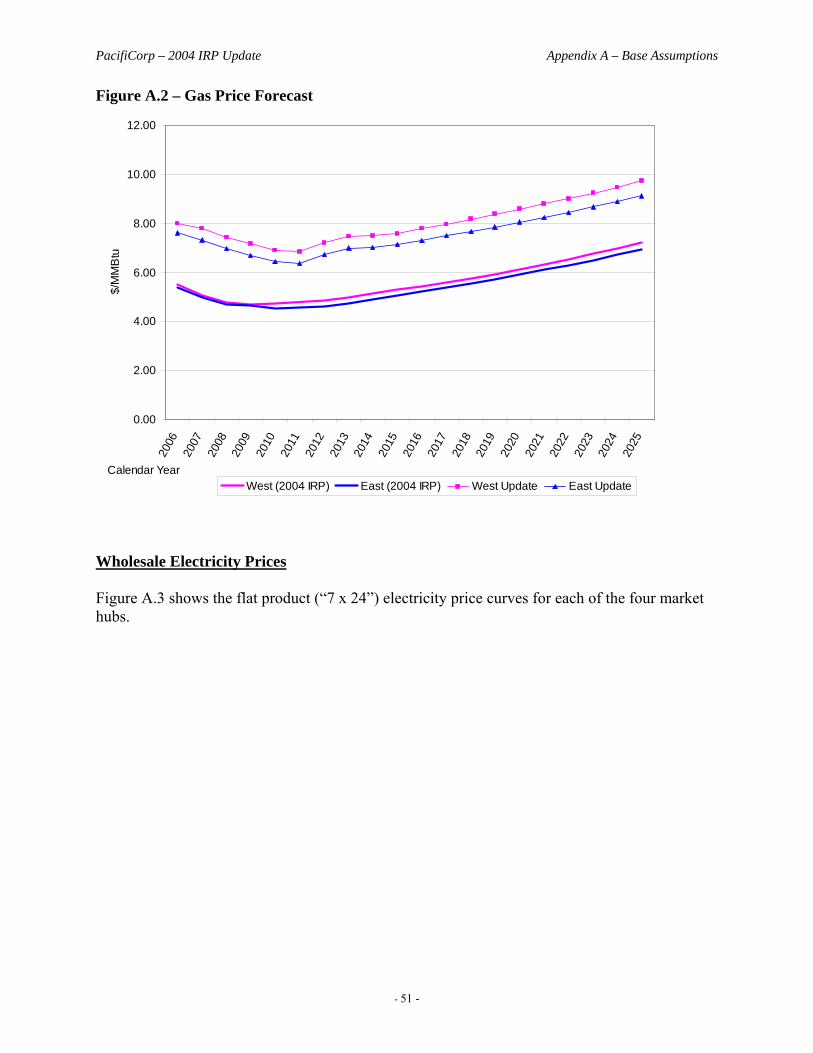
PacifiCorp – 2004 IRP Update Appendix A – Base Assumptions
- 51 -
Figure A.2 – Gas Price Forecast
Wholesale Electricity Prices Figure A.3 shows the flat product (“7 x 24”) electricity price curves for each of the four market hubs.
0.00
2.00
4.00
6.00
8.00
10.00
12.00
2006
2007
2008
2009
2010
2011
2012
2013
2014
2015
2016
2017
2018
2019
2020
2021
2022
2023
2024
2025
Calendar Year
$/M
MB
tu
West (2004 IRP) East (2004 IRP) West Update East Update
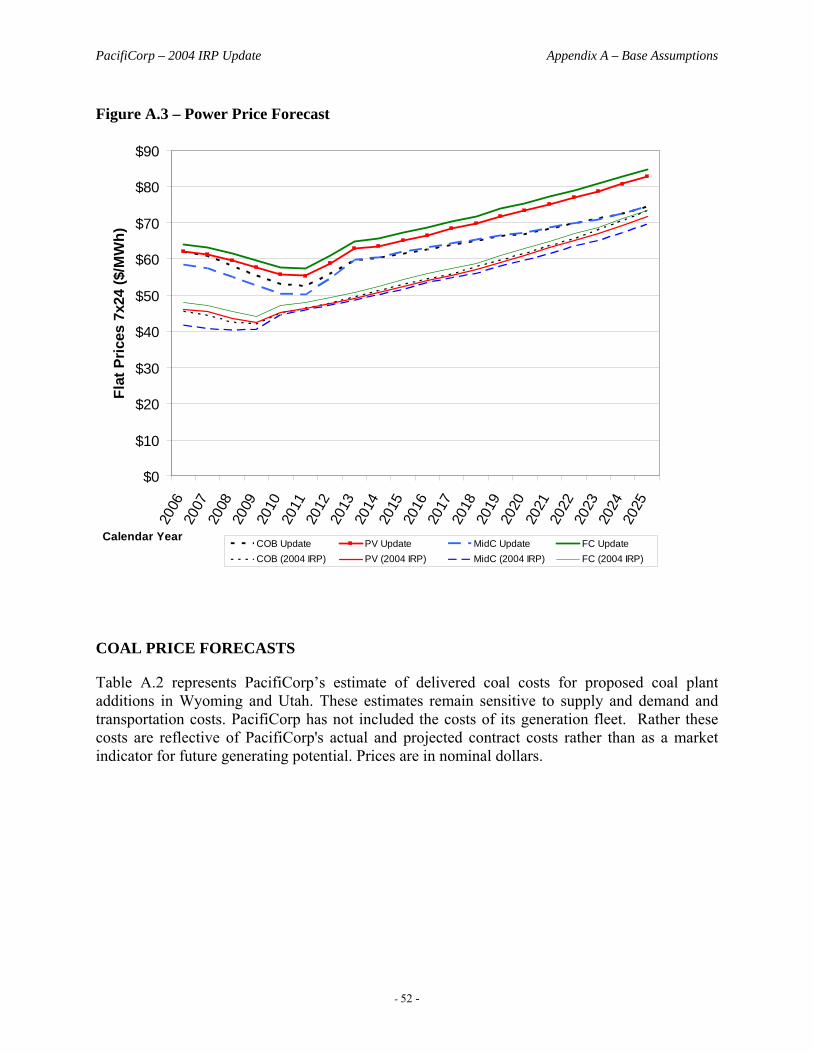
PacifiCorp – 2004 IRP Update Appendix A – Base Assumptions
- 52 -
Figure A.3 – Power Price Forecast
COAL PRICE FORECASTS
Table A.2 represents PacifiCorp’s estimate of delivered coal costs for proposed coal plant additions in Wyoming and Utah. These estimates remain sensitive to supply and demand and transportation costs. PacifiCorp has not included the costs of its generation fleet. Rather these costs are reflective of PacifiCorp's actual and projected contract costs rather than as a market indicator for future generating potential. Prices are in nominal dollars.
$0
$10
$20
$30
$40
$50
$60
$70
$80
$9020
0620
0720
0820
0920
1020
1120
1220
1320
1420
1520
1620
1720
1820
1920
2020
2120
2220
2320
2420
25
Calendar Year
Flat
Pric
es 7
x24
($/M
Wh)
COB Update PV Update MidC Update FC UpdateCOB (2004 IRP) PV (2004 IRP) MidC (2004 IRP) FC (2004 IRP)
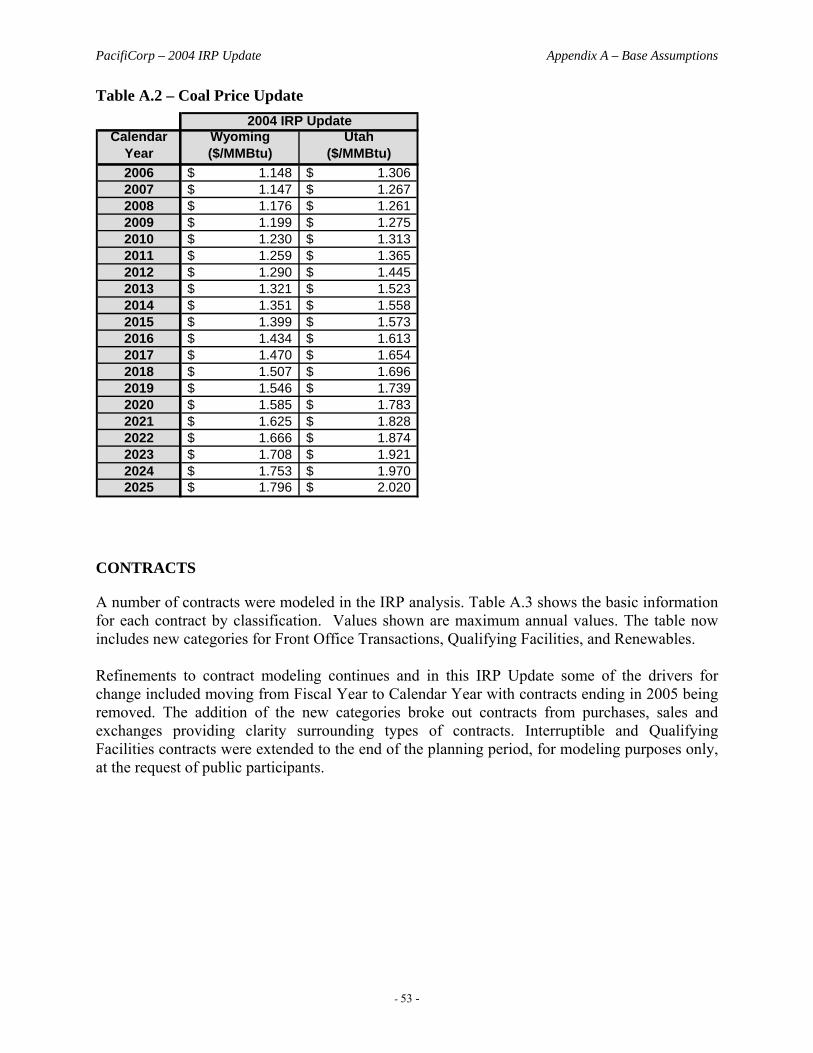
PacifiCorp – 2004 IRP Update Appendix A – Base Assumptions
- 53 -
Table A.2 – Coal Price Update
CONTRACTS
A number of contracts were modeled in the IRP analysis. Table A.3 shows the basic information for each contract by classification. Values shown are maximum annual values. The table now includes new categories for Front Office Transactions, Qualifying Facilities, and Renewables. Refinements to contract modeling continues and in this IRP Update some of the drivers for change included moving from Fiscal Year to Calendar Year with contracts ending in 2005 being removed. The addition of the new categories broke out contracts from purchases, sales and exchanges providing clarity surrounding types of contracts. Interruptible and Qualifying Facilities contracts were extended to the end of the planning period, for modeling purposes only, at the request of public participants.
Calendar Year
Wyoming($/MMBtu)
Utah($/MMBtu)
2006 1.148$ 1.306$ 2007 1.147$ 1.267$ 2008 1.176$ 1.261$ 2009 1.199$ 1.275$ 2010 1.230$ 1.313$ 2011 1.259$ 1.365$ 2012 1.290$ 1.445$ 2013 1.321$ 1.523$ 2014 1.351$ 1.558$ 2015 1.399$ 1.573$ 2016 1.434$ 1.613$ 2017 1.470$ 1.654$ 2018 1.507$ 1.696$ 2019 1.546$ 1.739$ 2020 1.585$ 1.783$ 2021 1.625$ 1.828$ 2022 1.666$ 1.874$ 2023 1.708$ 1.921$ 2024 1.753$ 1.970$ 2025 1.796$ 2.020$
2004 IRP Update
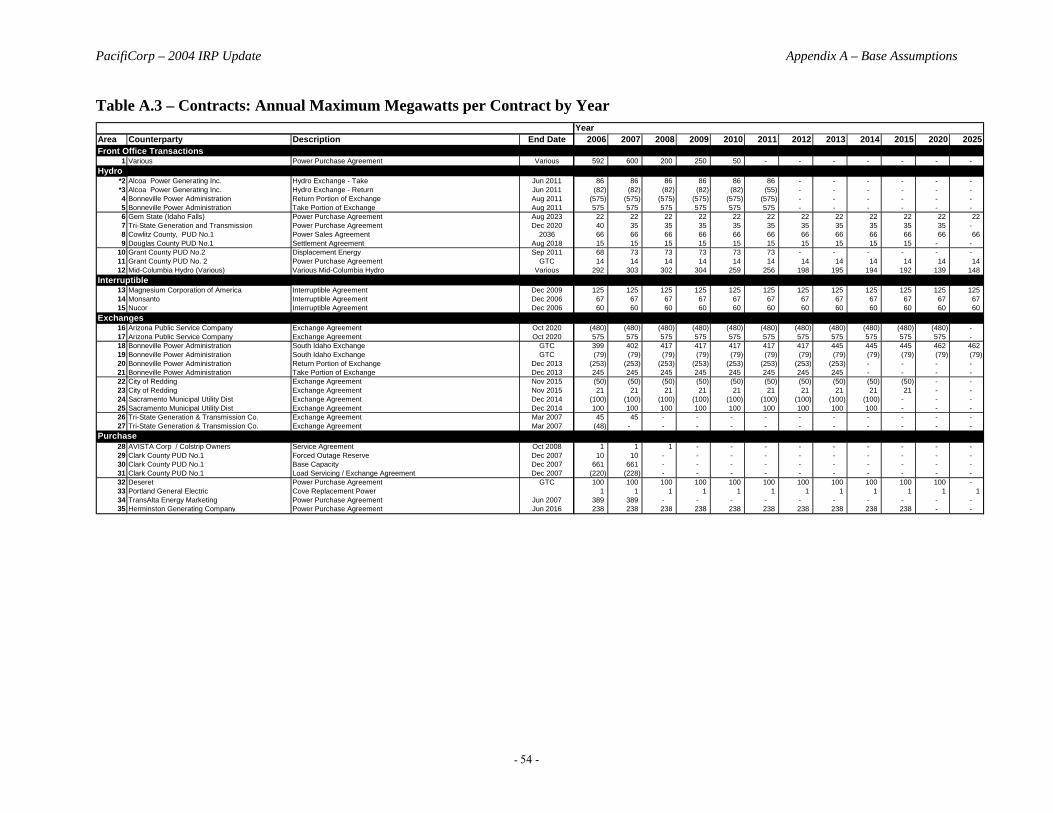
PacifiCorp – 2004 IRP Update Appendix A – Base Assumptions
- 54 -
Table A.3 – Contracts: Annual Maximum Megawatts per Contract by Year Year
Area Counterparty Description End Date 2006 2007 2008 2009 2010 2011 2012 2013 2014 2015 2020 2025Front Office Transactions
1 Various Power Purchase Agreement Various 592 600 200 250 50 - - - - - - - Hydro
*2 Alcoa Power Generating Inc. Hydro Exchange - Take Jun 2011 86 86 86 86 86 86 - - - - - - *3 Alcoa Power Generating Inc. Hydro Exchange - Return Jun 2011 (82) (82) (82) (82) (82) (55) - - - - - - 4 Bonneville Power Administration Return Portion of Exchange Aug 2011 (575) (575) (575) (575) (575) (575) - - - - - - 5 Bonneville Power Administration Take Portion of Exchange Aug 2011 575 575 575 575 575 575 - - - - - - 6 Gem State (Idaho Falls) Power Purchase Agreement Aug 2023 22 22 22 22 22 22 22 22 22 22 22 22 7 Tri-State Generation and Transmission Power Purchase Agreement Dec 2020 40 35 35 35 35 35 35 35 35 35 35 - 8 Cowlitz County, PUD No.1 Power Sales Agreement 2036 66 66 66 66 66 66 66 66 66 66 66 66 9 Douglas County PUD No.1 Settlement Agreement Aug 2018 15 15 15 15 15 15 15 15 15 15 - -
10 Grant County PUD No.2 Displacement Energy Sep 2011 68 73 73 73 73 73 - - - - - - 11 Grant County PUD No. 2 Power Purchase Agreement GTC 14 14 14 14 14 14 14 14 14 14 14 14 12 Mid-Columbia Hydro (Various) Various Mid-Columbia Hydro Various 292 303 302 304 259 256 198 195 194 192 139 148
Interruptible13 Magnesium Corporation of America Interruptible Agreement Dec 2009 125 125 125 125 125 125 125 125 125 125 125 125 14 Monsanto Interruptible Agreement Dec 2006 67 67 67 67 67 67 67 67 67 67 67 67 15 Nucor Interruptible Agreement Dec 2006 60 60 60 60 60 60 60 60 60 60 60 60
Exchanges16 Arizona Public Service Company Exchange Agreement Oct 2020 (480) (480) (480) (480) (480) (480) (480) (480) (480) (480) (480) - 17 Arizona Public Service Company Exchange Agreement Oct 2020 575 575 575 575 575 575 575 575 575 575 575 - 18 Bonneville Power Administration South Idaho Exchange GTC 399 402 417 417 417 417 417 445 445 445 462 462 19 Bonneville Power Administration South Idaho Exchange GTC (79) (79) (79) (79) (79) (79) (79) (79) (79) (79) (79) (79) 20 Bonneville Power Administration Return Portion of Exchange Dec 2013 (253) (253) (253) (253) (253) (253) (253) (253) - - - - 21 Bonneville Power Administration Take Portion of Exchange Dec 2013 245 245 245 245 245 245 245 245 - - - - 22 City of Redding Exchange Agreement Nov 2015 (50) (50) (50) (50) (50) (50) (50) (50) (50) (50) - - 23 City of Redding Exchange Agreement Nov 2015 21 21 21 21 21 21 21 21 21 21 - - 24 Sacramento Municipal Utility Dist Exchange Agreement Dec 2014 (100) (100) (100) (100) (100) (100) (100) (100) (100) - - - 25 Sacramento Municipal Utility Dist Exchange Agreement Dec 2014 100 100 100 100 100 100 100 100 100 - - - 26 Tri-State Generation & Transmission Co. Exchange Agreement Mar 2007 45 45 - - - - - - - - - - 27 Tri-State Generation & Transmission Co. Exchange Agreement Mar 2007 (48) - - - - - - - - - - -
Purchase28 AVISTA Corp / Colstrip Owners Service Agreement Oct 2008 1 1 1 - - - - - - - - - 29 Clark County PUD No.1 Forced Outage Reserve Dec 2007 10 10 - - - - - - - - - - 30 Clark County PUD No.1 Base Capacity Dec 2007 661 661 - - - - - - - - - - 31 Clark County PUD No.1 Load Servicing / Exchange Agreement Dec 2007 (220) (228) - - - - - - - - - - 32 Deseret Power Purchase Agreement GTC 100 100 100 100 100 100 100 100 100 100 100 - 33 Portland General Electric Cove Replacement Power 1 1 1 1 1 1 1 1 1 1 1 1 34 TransAlta Energy Marketing Power Purchase Agreement Jun 2007 389 389 - - - - - - - - - - 35 Herminston Generating Company Power Purchase Agreement Jun 2016 238 238 238 238 238 238 238 238 238 238 - -
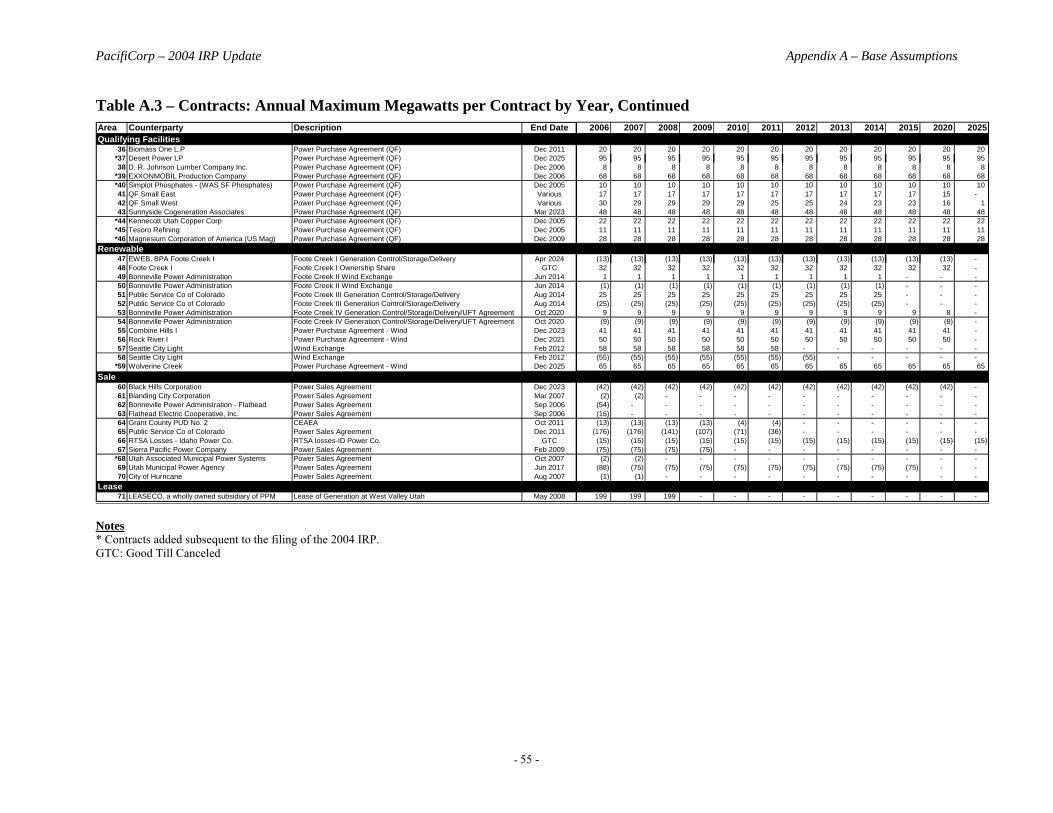
PacifiCorp – 2004 IRP Update Appendix A – Base Assumptions
- 55 -
Table A.3 – Contracts: Annual Maximum Megawatts per Contract by Year, Continued Area Counterparty Description End Date 2006 2007 2008 2009 2010 2011 2012 2013 2014 2015 2020 2025Qualifying Facilities
36 Biomass One L.P Power Purchase Agreement (QF) Dec 2011 20 20 20 20 20 20 20 20 20 20 20 20 *37 Desert Power LP Power Purchase Agreement (QF) Dec 2025 95 95 95 95 95 95 95 95 95 95 95 95 38 D. R. Johnson Lumber Company Inc. Power Purchase Agreement (QF) Dec 2006 8 8 8 8 8 8 8 8 8 8 8 8
*39 EXXONMOBIL Production Company Power Purchase Agreement (QF) Dec 2006 68 68 68 68 68 68 68 68 68 68 68 68 *40 Simplot Phosphates - (WAS SF Phosphates) Power Purchase Agreement (QF) Dec 2005 10 10 10 10 10 10 10 10 10 10 10 10 41 QF Small East Power Purchase Agreement (QF) Various 17 17 17 17 17 17 17 17 17 17 15 - 42 QF Small West Power Purchase Agreement (QF) Various 30 29 29 29 29 25 25 24 23 23 16 1 43 Sunnyside Cogeneration Associates Power Purchase Agreement (QF) Mar 2023 48 48 48 48 48 48 48 48 48 48 48 48
*44 Kennecott Utah Copper Corp Power Purchase Agreement (QF) Dec 2005 22 22 22 22 22 22 22 22 22 22 22 22 *45 Tesoro Refining Power Purchase Agreement (QF) Dec 2005 11 11 11 11 11 11 11 11 11 11 11 11 *46 Magnesium Corporation of America (US Mag) Power Purchase Agreement (QF) Dec 2009 28 28 28 28 28 28 28 28 28 28 28 28
Renewable47 EWEB, BPA Foote Creek I Foote Creek I Generation Control/Storage/Delivery Apr 2024 (13) (13) (13) (13) (13) (13) (13) (13) (13) (13) (13) - 48 Foote Creek I Foote Creek I Ownership Share GTC 32 32 32 32 32 32 32 32 32 32 32 - 49 Bonneville Power Administration Foote Creek II Wind Exchange Jun 2014 1 1 1 1 1 1 1 1 1 - - - 50 Bonneville Power Administration Foote Creek II Wind Exchange Jun 2014 (1) (1) (1) (1) (1) (1) (1) (1) (1) - - - 51 Public Service Co of Colorado Foote Creek III Generation Control/Storage/Delivery Aug 2014 25 25 25 25 25 25 25 25 25 - - - 52 Public Service Co of Colorado Foote Creek III Generation Control/Storage/Delivery Aug 2014 (25) (25) (25) (25) (25) (25) (25) (25) (25) - - - 53 Bonneville Power Administration Foote Creek IV Generation Control/Storage/Delivery/UFT Agreement Oct 2020 9 9 9 9 9 9 9 9 9 9 8 - 54 Bonneville Power Administration Foote Creek IV Generation Control/Storage/Delivery/UFT Agreement Oct 2020 (9) (9) (9) (9) (9) (9) (9) (9) (9) (9) (8) - 55 Combine Hills I Power Purchase Agreement - Wind Dec 2023 41 41 41 41 41 41 41 41 41 41 41 - 56 Rock River I Power Purchase Agreement - Wind Dec 2021 50 50 50 50 50 50 50 50 50 50 50 - 57 Seattle City Light Wind Exchange Feb 2012 58 58 58 58 58 58 - - - - - - 58 Seattle City Light Wind Exchange Feb 2012 (55) (55) (55) (55) (55) (55) (55) - - - - -
*59 Wolverine Creek Power Purchase Agreement - Wind Dec 2025 65 65 65 65 65 65 65 65 65 65 65 65 Sale
60 Black Hills Corporation Power Sales Agreement Dec 2023 (42) (42) (42) (42) (42) (42) (42) (42) (42) (42) (42) - 61 Blanding City Corporation Power Sales Agreement Mar 2007 (2) (2) - - - - - - - - - - 62 Bonneville Power Administration - Flathead Power Sales Agreement Sep 2006 (54) - - - - - - - - - - - 63 Flathead Electric Cooperative, Inc. Power Sales Agreement Sep 2006 (16) - - - - - - - - - - - 64 Grant County PUD No. 2 CEAEA Oct 2011 (13) (13) (13) (13) (4) (4) - - - - - - 65 Public Service Co of Colorado Power Sales Agreement Dec 2011 (176) (176) (141) (107) (71) (36) - - - - - - 66 RTSA Losses - Idaho Power Co. RTSA losses-ID Power Co. GTC (15) (15) (15) (15) (15) (15) (15) (15) (15) (15) (15) (15) 67 Sierra Pacific Power Company Power Sales Agreement Feb 2009 (75) (75) (75) (75) - - - - - - - -
*68 Utah Associated Municipal Power Systems Power Sales Agreement Oct 2007 (2) (2) - - - - - - - - - - 69 Utah Municipal Power Agency Power Sales Agreement Jun 2017 (88) (75) (75) (75) (75) (75) (75) (75) (75) (75) - - 70 City of Hurricane Power Sales Agreement Aug 2007 (1) (1) - - - - - - - - - -
Lease71 LEASECO, a wholly owned subsidiary of PPM Lease of Generation at West Valley Utah May 2008 199 199 199 - - - - - - - - -
Notes * Contracts added subsequent to the filing of the 2004 IRP. GTC: Good Till Canceled
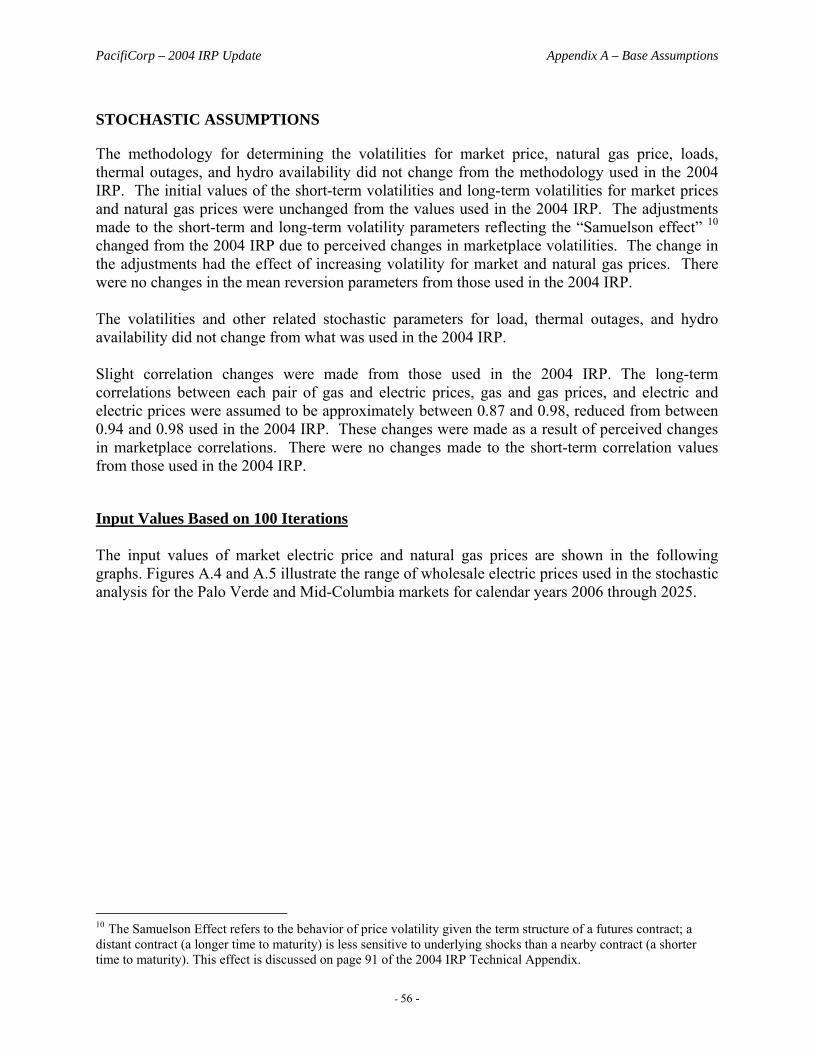
PacifiCorp – 2004 IRP Update Appendix A – Base Assumptions
- 56 -
STOCHASTIC ASSUMPTIONS
The methodology for determining the volatilities for market price, natural gas price, loads, thermal outages, and hydro availability did not change from the methodology used in the 2004 IRP. The initial values of the short-term volatilities and long-term volatilities for market prices and natural gas prices were unchanged from the values used in the 2004 IRP. The adjustments made to the short-term and long-term volatility parameters reflecting the “Samuelson effect” 10 changed from the 2004 IRP due to perceived changes in marketplace volatilities. The change in the adjustments had the effect of increasing volatility for market and natural gas prices. There were no changes in the mean reversion parameters from those used in the 2004 IRP. The volatilities and other related stochastic parameters for load, thermal outages, and hydro availability did not change from what was used in the 2004 IRP. Slight correlation changes were made from those used in the 2004 IRP. The long-term correlations between each pair of gas and electric prices, gas and gas prices, and electric and electric prices were assumed to be approximately between 0.87 and 0.98, reduced from between 0.94 and 0.98 used in the 2004 IRP. These changes were made as a result of perceived changes in marketplace correlations. There were no changes made to the short-term correlation values from those used in the 2004 IRP.
Input Values Based on 100 Iterations The input values of market electric price and natural gas prices are shown in the following graphs. Figures A.4 and A.5 illustrate the range of wholesale electric prices used in the stochastic analysis for the Palo Verde and Mid-Columbia markets for calendar years 2006 through 2025.
10 The Samuelson Effect refers to the behavior of price volatility given the term structure of a futures contract; a distant contract (a longer time to maturity) is less sensitive to underlying shocks than a nearby contract (a shorter time to maturity). This effect is discussed on page 91 of the 2004 IRP Technical Appendix.
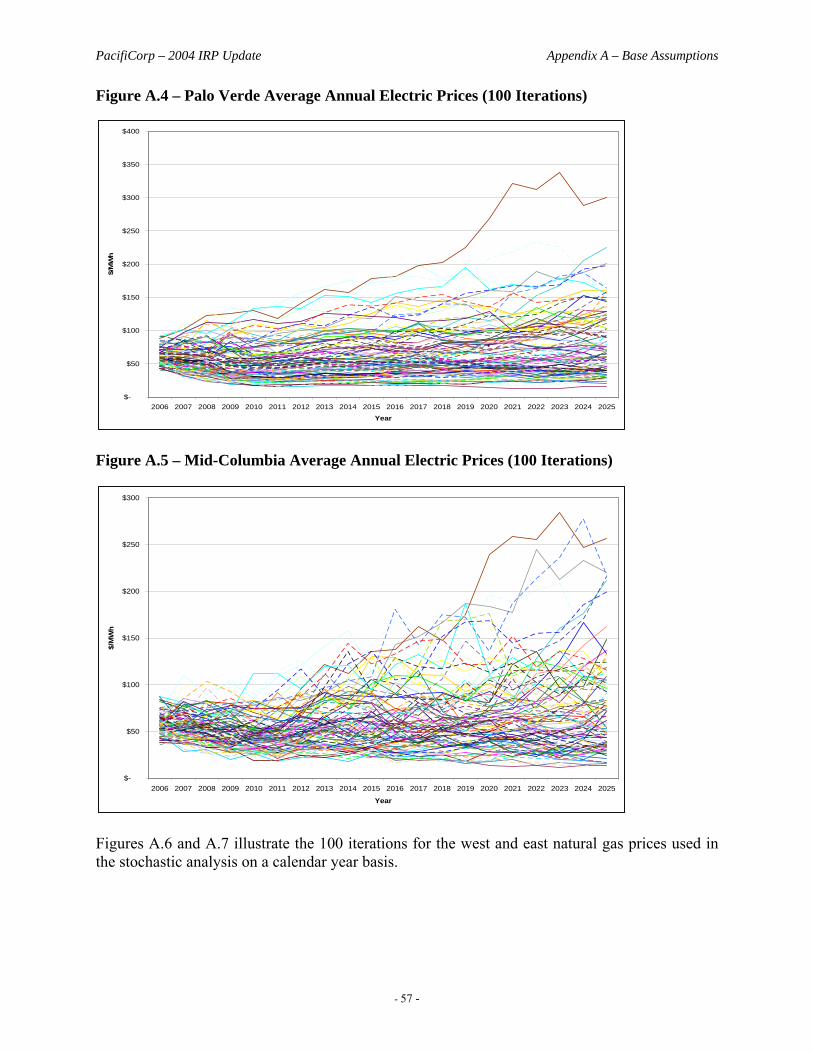
PacifiCorp – 2004 IRP Update Appendix A – Base Assumptions
- 57 -
Figure A.4 – Palo Verde Average Annual Electric Prices (100 Iterations)
Figure A.5 – Mid-Columbia Average Annual Electric Prices (100 Iterations)
Figures A.6 and A.7 illustrate the 100 iterations for the west and east natural gas prices used in the stochastic analysis on a calendar year basis.
$-
$50
$100
$150
$200
$250
$300
$350
$400
2006 2007 2008 2009 2010 2011 2012 2013 2014 2015 2016 2017 2018 2019 2020 2021 2022 2023 2024 2025
Year
$/M
Wh
$-
$50
$100
$150
$200
$250
$300
2006 2007 2008 2009 2010 2011 2012 2013 2014 2015 2016 2017 2018 2019 2020 2021 2022 2023 2024 2025
Year
$/M
Wh
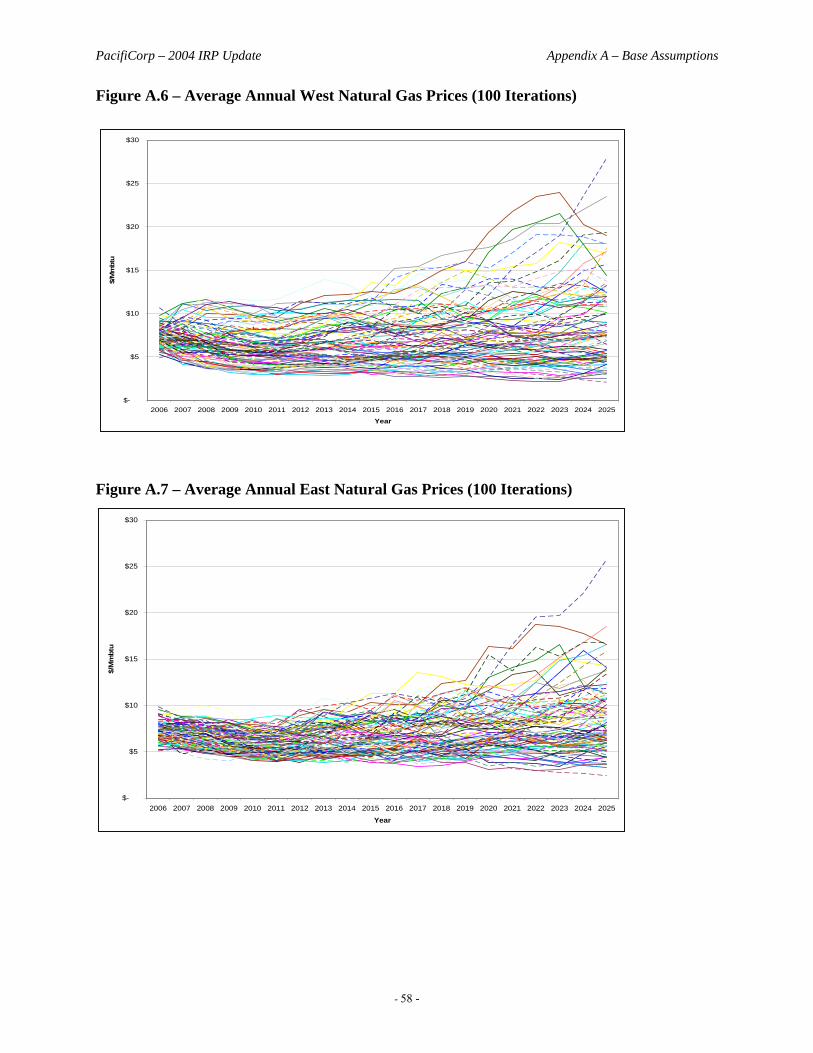
PacifiCorp – 2004 IRP Update Appendix A – Base Assumptions
- 58 -
Figure A.6 – Average Annual West Natural Gas Prices (100 Iterations)
Figure A.7 – Average Annual East Natural Gas Prices (100 Iterations)
$-
$5
$10
$15
$20
$25
$30
2006 2007 2008 2009 2010 2011 2012 2013 2014 2015 2016 2017 2018 2019 2020 2021 2022 2023 2024 2025
Year
$/M
mbt
u
$-
$5
$10
$15
$20
$25
$30
2006 2007 2008 2009 2010 2011 2012 2013 2014 2015 2016 2017 2018 2019 2020 2021 2022 2023 2024 2025
Year
$/M
mbt
u
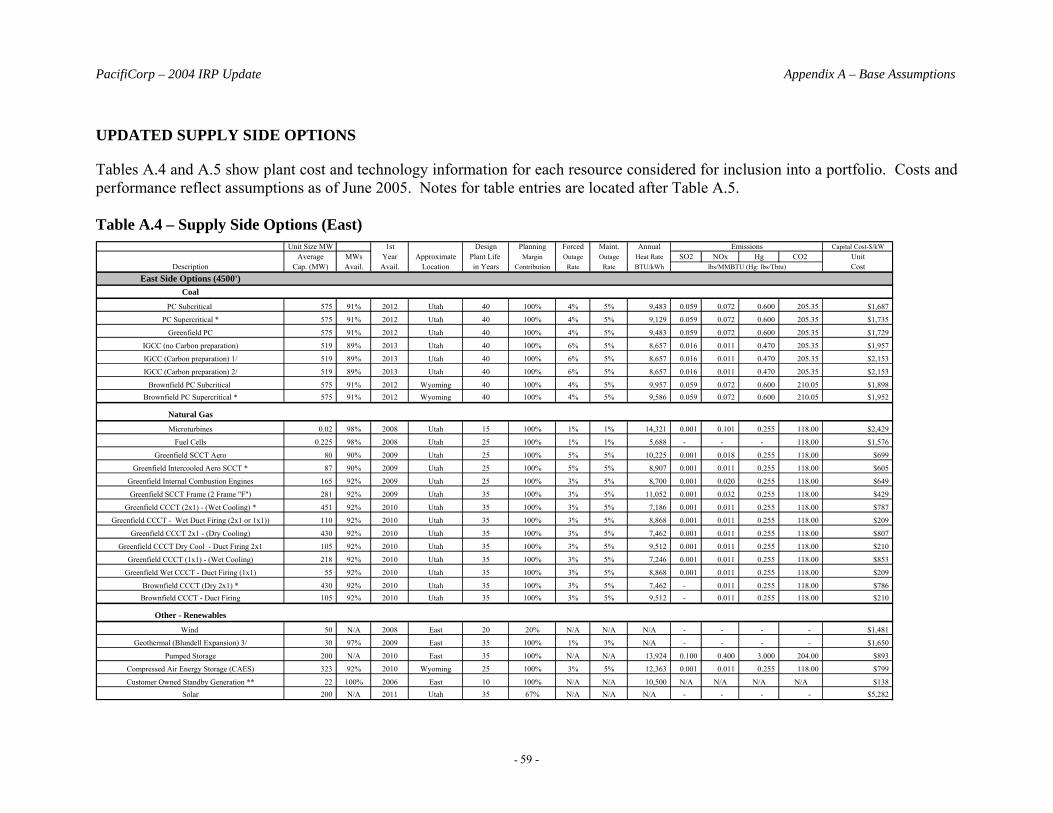
PacifiCorp – 2004 IRP Update Appendix A – Base Assumptions
- 59 -
UPDATED SUPPLY SIDE OPTIONS
Tables A.4 and A.5 show plant cost and technology information for each resource considered for inclusion into a portfolio. Costs and performance reflect assumptions as of June 2005. Notes for table entries are located after Table A.5. Table A.4 – Supply Side Options (East)
Unit Size MW 1st Design Planning Forced Maint. Annual Emissions Capital Cost-$/kWAverage MWs Year Approximate Plant Life Margin Outage Outage Heat Rate SO2 NOx Hg CO2 Unit
Description Cap. (MW) Avail. Avail. Location in Years Contribution Rate Rate BTU/kWh lbs/MMBTU (Hg: lbs/Tbtu) CostEast Side Options (4500')
Coal
PC Subcritical 575 91% 2012 Utah 40 100% 4% 5% 9,483 0.059 0.072 0.600 205.35 $1,687
PC Supercritical * 575 91% 2012 Utah 40 100% 4% 5% 9,129 0.059 0.072 0.600 205.35 $1,735
Greenfield PC 575 91% 2012 Utah 40 100% 4% 5% 9,483 0.059 0.072 0.600 205.35 $1,729
IGCC (no Carbon preparation) 519 89% 2013 Utah 40 100% 6% 5% 8,657 0.016 0.011 0.470 205.35 $1,957
IGCC (Carbon preparation) 1/ 519 89% 2013 Utah 40 100% 6% 5% 8,657 0.016 0.011 0.470 205.35 $2,153
IGCC (Carbon preparation) 2/ 519 89% 2013 Utah 40 100% 6% 5% 8,657 0.016 0.011 0.470 205.35 $2,153
Brownfield PC Subcritical 575 91% 2012 Wyoming 40 100% 4% 5% 9,957 0.059 0.072 0.600 210.05 $1,898Brownfield PC Supercritical * 575 91% 2012 Wyoming 40 100% 4% 5% 9,586 0.059 0.072 0.600 210.05 $1,952
Natural Gas
Microturbines 0.02 98% 2008 Utah 15 100% 1% 1% 14,321 0.001 0.101 0.255 118.00 $2,429
Fuel Cells 0.225 98% 2008 Utah 25 100% 1% 1% 5,688 - - - 118.00 $1,576
Greenfield SCCT Aero 80 90% 2009 Utah 25 100% 5% 5% 10,225 0.001 0.018 0.255 118.00 $699
Greenfield Intercooled Aero SCCT * 87 90% 2009 Utah 25 100% 5% 5% 8,907 0.001 0.011 0.255 118.00 $605
Greenfield Internal Combustion Engines 165 92% 2009 Utah 25 100% 3% 5% 8,700 0.001 0.020 0.255 118.00 $649
Greenfield SCCT Frame (2 Frame "F") 281 92% 2009 Utah 35 100% 3% 5% 11,052 0.001 0.032 0.255 118.00 $429
Greenfield CCCT (2x1) - (Wet Cooling) * 451 92% 2010 Utah 35 100% 3% 5% 7,186 0.001 0.011 0.255 118.00 $787
Greenfield CCCT - Wet Duct Firing (2x1 or 1x1)) 110 92% 2010 Utah 35 100% 3% 5% 8,868 0.001 0.011 0.255 118.00 $209
Greenfield CCCT 2x1 - (Dry Cooling) 430 92% 2010 Utah 35 100% 3% 5% 7,462 0.001 0.011 0.255 118.00 $807
Greenfield CCCT Dry Cool - Duct Firing 2x1 105 92% 2010 Utah 35 100% 3% 5% 9,512 0.001 0.011 0.255 118.00 $210
Greenfield CCCT (1x1) - (Wet Cooling) 218 92% 2010 Utah 35 100% 3% 5% 7,246 0.001 0.011 0.255 118.00 $853
Greenfield Wet CCCT - Duct Firing (1x1) 55 92% 2010 Utah 35 100% 3% 5% 8,868 0.001 0.011 0.255 118.00 $209
Brownfield CCCT (Dry 2x1) * 430 92% 2010 Utah 35 100% 3% 5% 7,462 - 0.011 0.255 118.00 $786Brownfield CCCT - Duct Firing 105 92% 2010 Utah 35 100% 3% 5% 9,512 - 0.011 0.255 118.00 $210
Other - Renewables
Wind 50 N/A 2008 East 20 20% N/A N/A N/A - - - - $1,481
Geothermal (Blundell Expansion) 3/ 30 97% 2009 East 35 100% 1% 3% N/A - - - - $1,650
Pumped Storage 200 N/A 2010 East 35 100% N/A N/A 13,924 0.100 0.400 3.000 204.00 $893
Compressed Air Energy Storage (CAES) 323 92% 2010 Wyoming 25 100% 3% 5% 12,363 0.001 0.011 0.255 118.00 $799
Customer Owned Standby Generation ** 22 100% 2006 East 10 100% N/A N/A 10,500 N/A N/A N/A N/A $138Solar 200 N/A 2011 Utah 35 67% N/A N/A N/A - - - - $5,282
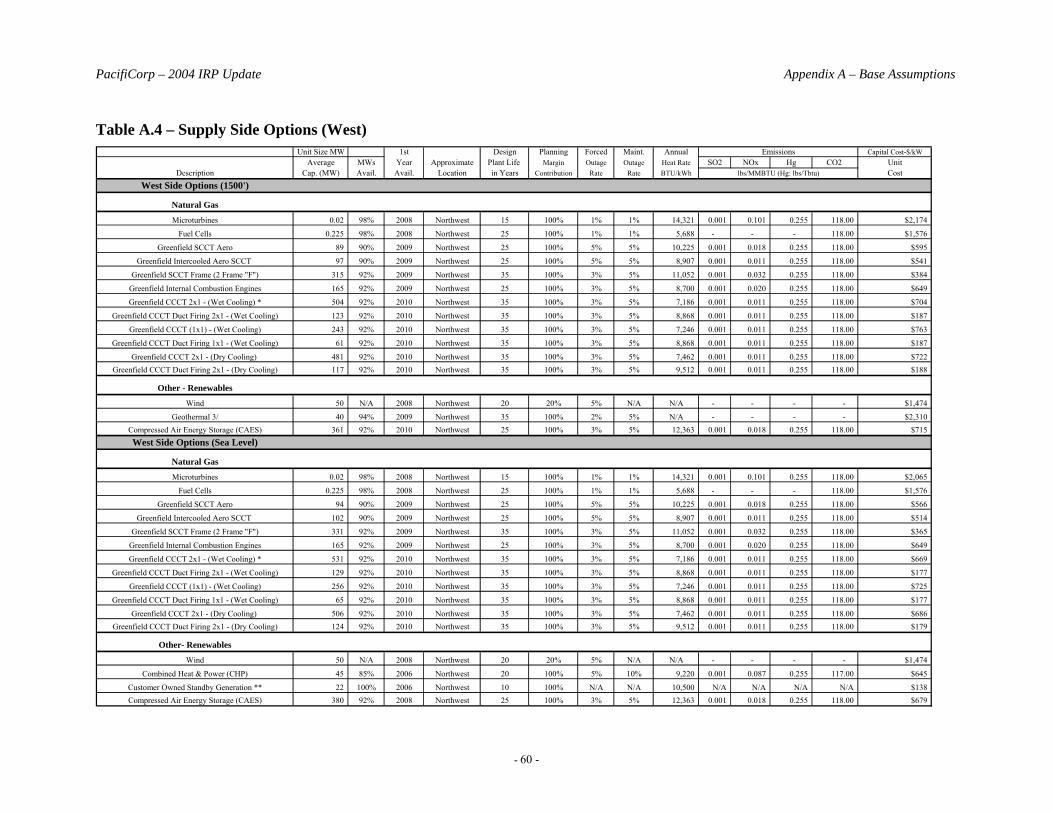
PacifiCorp – 2004 IRP Update Appendix A – Base Assumptions
- 60 -
Table A.4 – Supply Side Options (West)
Unit Size MW 1st Design Planning Forced Maint. Annual Emissions Capital Cost-$/kWAverage MWs Year Approximate Plant Life Margin Outage Outage Heat Rate SO2 NOx Hg CO2 Unit
Description Cap. (MW) Avail. Avail. Location in Years Contribution Rate Rate BTU/kWh lbs/MMBTU (Hg: lbs/Tbtu) CostWest Side Options (1500')
Natural Gas
Microturbines 0.02 98% 2008 Northwest 15 100% 1% 1% 14,321 0.001 0.101 0.255 118.00 $2,174
Fuel Cells 0.225 98% 2008 Northwest 25 100% 1% 1% 5,688 - - - 118.00 $1,576
Greenfield SCCT Aero 89 90% 2009 Northwest 25 100% 5% 5% 10,225 0.001 0.018 0.255 118.00 $595
Greenfield Intercooled Aero SCCT 97 90% 2009 Northwest 25 100% 5% 5% 8,907 0.001 0.011 0.255 118.00 $541
Greenfield SCCT Frame (2 Frame "F") 315 92% 2009 Northwest 35 100% 3% 5% 11,052 0.001 0.032 0.255 118.00 $384
Greenfield Internal Combustion Engines 165 92% 2009 Northwest 25 100% 3% 5% 8,700 0.001 0.020 0.255 118.00 $649
Greenfield CCCT 2x1 - (Wet Cooling) * 504 92% 2010 Northwest 35 100% 3% 5% 7,186 0.001 0.011 0.255 118.00 $704
Greenfield CCCT Duct Firing 2x1 - (Wet Cooling) 123 92% 2010 Northwest 35 100% 3% 5% 8,868 0.001 0.011 0.255 118.00 $187
Greenfield CCCT (1x1) - (Wet Cooling) 243 92% 2010 Northwest 35 100% 3% 5% 7,246 0.001 0.011 0.255 118.00 $763
Greenfield CCCT Duct Firing 1x1 - (Wet Cooling) 61 92% 2010 Northwest 35 100% 3% 5% 8,868 0.001 0.011 0.255 118.00 $187
Greenfield CCCT 2x1 - (Dry Cooling) 481 92% 2010 Northwest 35 100% 3% 5% 7,462 0.001 0.011 0.255 118.00 $722Greenfield CCCT Duct Firing 2x1 - (Dry Cooling) 117 92% 2010 Northwest 35 100% 3% 5% 9,512 0.001 0.011 0.255 118.00 $188
Other - Renewables
Wind 50 N/A 2008 Northwest 20 20% 5% N/A N/A - - - - $1,474
Geothermal 3/ 40 94% 2009 Northwest 35 100% 2% 5% N/A - - - - $2,310Compressed Air Energy Storage (CAES) 361 92% 2010 Northwest 25 100% 3% 5% 12,363 0.001 0.018 0.255 118.00 $715West Side Options (Sea Level)
Natural Gas
Microturbines 0.02 98% 2008 Northwest 15 100% 1% 1% 14,321 0.001 0.101 0.255 118.00 $2,065
Fuel Cells 0.225 98% 2008 Northwest 25 100% 1% 1% 5,688 - - - 118.00 $1,576
Greenfield SCCT Aero 94 90% 2009 Northwest 25 100% 5% 5% 10,225 0.001 0.018 0.255 118.00 $566
Greenfield Intercooled Aero SCCT 102 90% 2009 Northwest 25 100% 5% 5% 8,907 0.001 0.011 0.255 118.00 $514
Greenfield SCCT Frame (2 Frame "F") 331 92% 2009 Northwest 35 100% 3% 5% 11,052 0.001 0.032 0.255 118.00 $365
Greenfield Internal Combustion Engines 165 92% 2009 Northwest 25 100% 3% 5% 8,700 0.001 0.020 0.255 118.00 $649
Greenfield CCCT 2x1 - (Wet Cooling) * 531 92% 2010 Northwest 35 100% 3% 5% 7,186 0.001 0.011 0.255 118.00 $669
Greenfield CCCT Duct Firing 2x1 - (Wet Cooling) 129 92% 2010 Northwest 35 100% 3% 5% 8,868 0.001 0.011 0.255 118.00 $177
Greenfield CCCT (1x1) - (Wet Cooling) 256 92% 2010 Northwest 35 100% 3% 5% 7,246 0.001 0.011 0.255 118.00 $725
Greenfield CCCT Duct Firing 1x1 - (Wet Cooling) 65 92% 2010 Northwest 35 100% 3% 5% 8,868 0.001 0.011 0.255 118.00 $177
Greenfield CCCT 2x1 - (Dry Cooling) 506 92% 2010 Northwest 35 100% 3% 5% 7,462 0.001 0.011 0.255 118.00 $686Greenfield CCCT Duct Firing 2x1 - (Dry Cooling) 124 92% 2010 Northwest 35 100% 3% 5% 9,512 0.001 0.011 0.255 118.00 $179
Other- Renewables
Wind 50 N/A 2008 Northwest 20 20% 5% N/A N/A - - - - $1,474
Combined Heat & Power (CHP) 45 85% 2006 Northwest 20 100% 5% 10% 9,220 0.001 0.087 0.255 117.00 $645
Customer Owned Standby Generation ** 22 100% 2006 Northwest 10 100% N/A N/A 10,500 N/A N/A N/A N/A $138Compressed Air Energy Storage (CAES) 380 92% 2008 Northwest 25 100% 3% 5% 12,363 0.001 0.018 0.255 118.00 $679
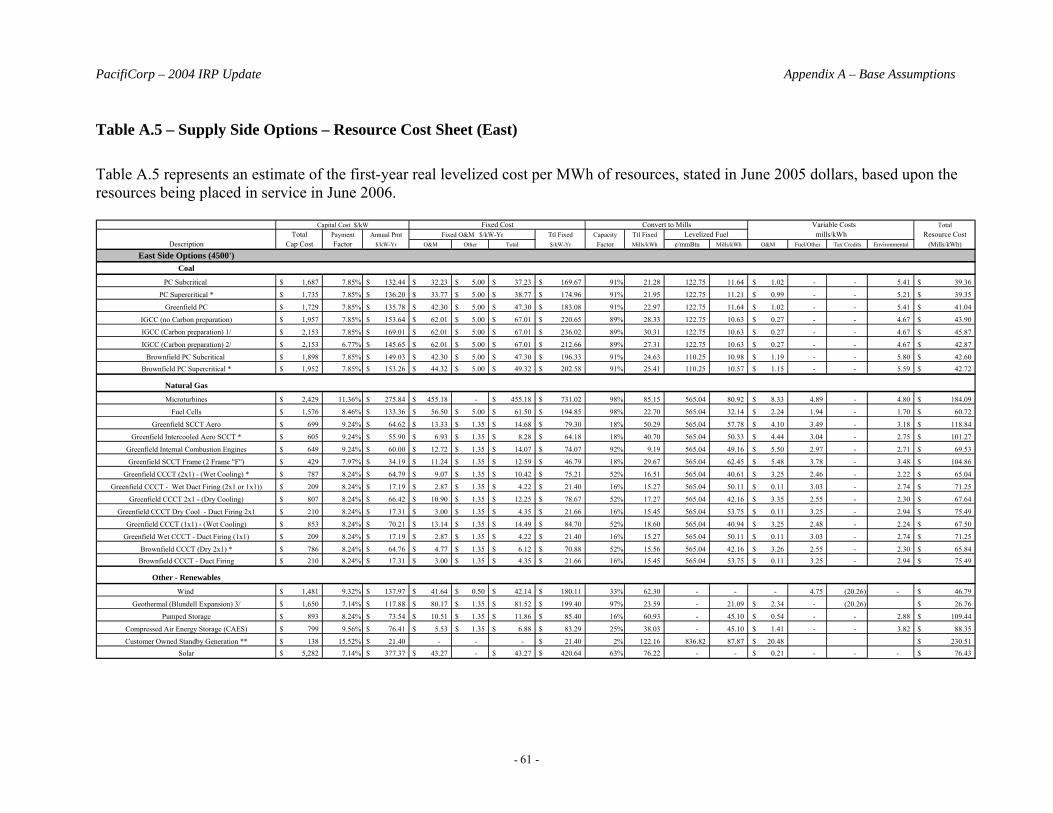
PacifiCorp – 2004 IRP Update Appendix A – Base Assumptions
- 61 -
Table A.5 – Supply Side Options – Resource Cost Sheet (East) Table A.5 represents an estimate of the first-year real levelized cost per MWh of resources, stated in June 2005 dollars, based upon the resources being placed in service in June 2006.
Capital Cost $/kW Fixed Cost Convert to Mills Variable Costs TotalTotal Payment Annual Pmt Fixed O&M $/kW-Yr Ttl Fixed Capacity Ttl Fixed Levelized Fuel mills/kWh Resource Cost
Description Cap Cost Factor $/kW-Yr O&M Other Total $/kW-Yr Factor Mills/kWh ¢/mmBtu Mills/kWh O&M Fuel/Other Tax Credits Environmental (Mills/kWh)
East Side Options (4500')Coal
PC Subcritical 1,687$ 7.85% 132.44$ 32.23$ 5.00$ 37.23$ 169.67$ 91% 21.28 122.75 11.64 1.02$ - - 5.41 39.36$
PC Supercritical * 1,735$ 7.85% 136.20$ 33.77$ 5.00$ 38.77$ 174.96$ 91% 21.95 122.75 11.21 0.99$ - - 5.21 39.35$
Greenfield PC 1,729$ 7.85% 135.78$ 42.30$ 5.00$ 47.30$ 183.08$ 91% 22.97 122.75 11.64 1.02$ - - 5.41 41.04$
IGCC (no Carbon preparation) 1,957$ 7.85% 153.64$ 62.01$ 5.00$ 67.01$ 220.65$ 89% 28.33 122.75 10.63 0.27$ - - 4.67 43.90$
IGCC (Carbon preparation) 1/ 2,153$ 7.85% 169.01$ 62.01$ 5.00$ 67.01$ 236.02$ 89% 30.31 122.75 10.63 0.27$ - - 4.67 45.87$
IGCC (Carbon preparation) 2/ 2,153$ 6.77% 145.65$ 62.01$ 5.00$ 67.01$ 212.66$ 89% 27.31 122.75 10.63 0.27$ - - 4.67 42.87$
Brownfield PC Subcritical 1,898$ 7.85% 149.03$ 42.30$ 5.00$ 47.30$ 196.33$ 91% 24.63 110.25 10.98 1.19$ - - 5.80 42.60$ Brownfield PC Supercritical * 1,952$ 7.85% 153.26$ 44.32$ 5.00$ 49.32$ 202.58$ 91% 25.41 110.25 10.57 1.15$ - - 5.59 42.72$
Natural Gas
Microturbines 2,429$ 11.36% 275.84$ 455.18$ - 455.18$ 731.02$ 98% 85.15 565.04 80.92 8.33$ 4.89 - 4.80 184.09$
Fuel Cells 1,576$ 8.46% 133.36$ 56.50$ 5.00$ 61.50$ 194.85$ 98% 22.70 565.04 32.14 2.24$ 1.94 - 1.70 60.72$
Greenfield SCCT Aero 699$ 9.24% 64.62$ 13.33$ 1.35$ 14.68$ 79.30$ 18% 50.29 565.04 57.78 4.10$ 3.49 - 3.18 118.84$
Greenfield Intercooled Aero SCCT * 605$ 9.24% 55.90$ 6.93$ 1.35$ 8.28$ 64.18$ 18% 40.70 565.04 50.33 4.44$ 3.04 - 2.75 101.27$
Greenfield Internal Combustion Engines 649$ 9.24% 60.00$ 12.72$ 1.35$ 14.07$ 74.07$ 92% 9.19 565.04 49.16 5.50$ 2.97 - 2.71 69.53$
Greenfield SCCT Frame (2 Frame "F") 429$ 7.97% 34.19$ 11.24$ 1.35$ 12.59$ 46.79$ 18% 29.67 565.04 62.45 5.48$ 3.78 - 3.48 104.86$
Greenfield CCCT (2x1) - (Wet Cooling) * 787$ 8.24% 64.79$ 9.07$ 1.35$ 10.42$ 75.21$ 52% 16.51 565.04 40.61 3.25$ 2.46 - 2.22 65.04$
Greenfield CCCT - Wet Duct Firing (2x1 or 1x1)) 209$ 8.24% 17.19$ 2.87$ 1.35$ 4.22$ 21.40$ 16% 15.27 565.04 50.11 0.11$ 3.03 - 2.74 71.25$
Greenfield CCCT 2x1 - (Dry Cooling) 807$ 8.24% 66.42$ 10.90$ 1.35$ 12.25$ 78.67$ 52% 17.27 565.04 42.16 3.35$ 2.55 - 2.30 67.64$
Greenfield CCCT Dry Cool - Duct Firing 2x1 210$ 8.24% 17.31$ 3.00$ 1.35$ 4.35$ 21.66$ 16% 15.45 565.04 53.75 0.11$ 3.25 - 2.94 75.49$
Greenfield CCCT (1x1) - (Wet Cooling) 853$ 8.24% 70.21$ 13.14$ 1.35$ 14.49$ 84.70$ 52% 18.60 565.04 40.94 3.25$ 2.48 - 2.24 67.50$
Greenfield Wet CCCT - Duct Firing (1x1) 209$ 8.24% 17.19$ 2.87$ 1.35$ 4.22$ 21.40$ 16% 15.27 565.04 50.11 0.11$ 3.03 - 2.74 71.25$
Brownfield CCCT (Dry 2x1) * 786$ 8.24% 64.76$ 4.77$ 1.35$ 6.12$ 70.88$ 52% 15.56 565.04 42.16 3.26$ 2.55 - 2.30 65.84$ Brownfield CCCT - Duct Firing 210$ 8.24% 17.31$ 3.00$ 1.35$ 4.35$ 21.66$ 16% 15.45 565.04 53.75 0.11$ 3.25 - 2.94 75.49$
Other - Renewables
Wind 1,481$ 9.32% 137.97$ 41.64$ 0.50$ 42.14$ 180.11$ 33% 62.30 - - - 4.75 (20.26) - 46.79$
Geothermal (Blundell Expansion) 3/ 1,650$ 7.14% 117.88$ 80.17$ 1.35$ 81.52$ 199.40$ 97% 23.59 - 21.09 2.34$ - (20.26) 26.76$
Pumped Storage 893$ 8.24% 73.54$ 10.51$ 1.35$ 11.86$ 85.40$ 16% 60.93 - 45.10 0.54$ - - 2.88 109.44$
Compressed Air Energy Storage (CAES) 799$ 9.56% 76.41$ 5.53$ 1.35$ 6.88$ 83.29$ 25% 38.03 - 45.10 1.41$ - - 3.82 88.35$
Customer Owned Standby Generation ** 138$ 15.52% 21.40$ - - - 21.40$ 2% 122.16 836.82 87.87 20.48$ 230.51$ Solar 5,282$ 7.14% 377.37$ 43.27$ - 43.27$ 420.64$ 63% 76.22 - - 0.21$ - - - 76.43$
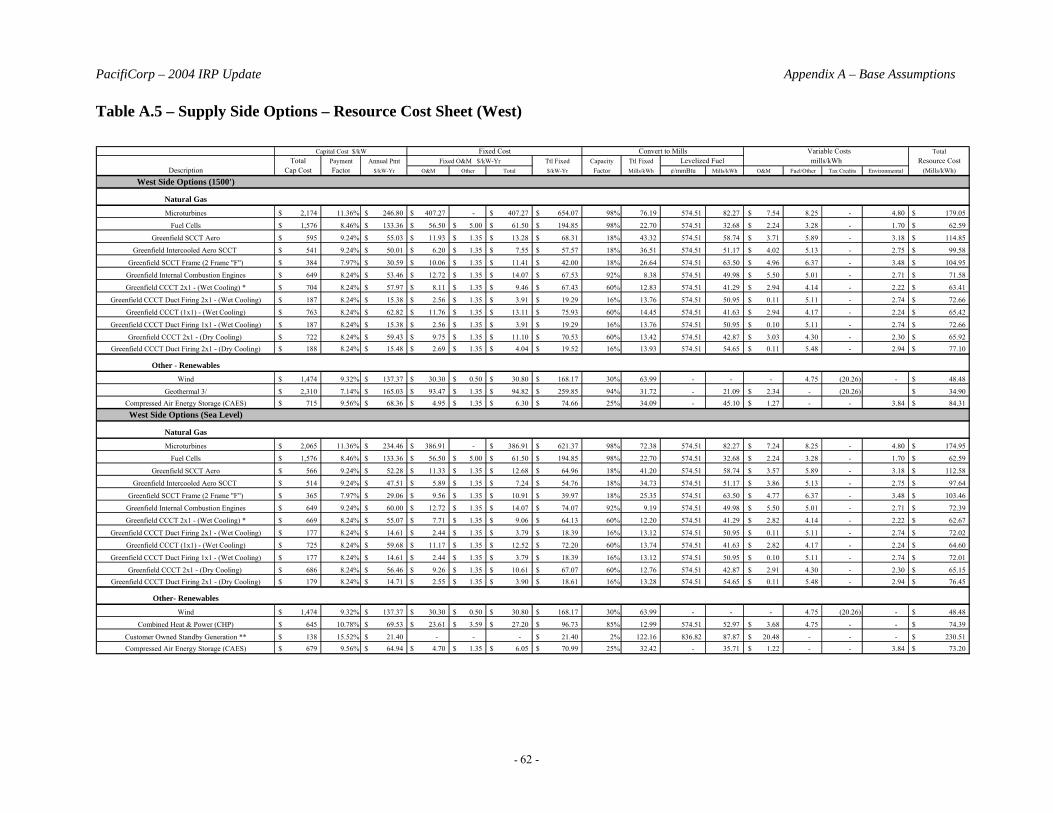
PacifiCorp – 2004 IRP Update Appendix A – Base Assumptions
- 62 -
Table A.5 – Supply Side Options – Resource Cost Sheet (West)
Capital Cost $/kW Fixed Cost Convert to Mills Variable Costs Total
Total Payment Annual Pmt Fixed O&M $/kW-Yr Ttl Fixed Capacity Ttl Fixed Levelized Fuel mills/kWh Resource CostDescription Cap Cost Factor $/kW-Yr O&M Other Total $/kW-Yr Factor Mills/kWh ¢/mmBtu Mills/kWh O&M Fuel/Other Tax Credits Environmental (Mills/kWh)
West Side Options (1500')
Natural Gas
Microturbines 2,174$ 11.36% 246.80$ 407.27$ - 407.27$ 654.07$ 98% 76.19 574.51 82.27 7.54$ 8.25 - 4.80 179.05$
Fuel Cells 1,576$ 8.46% 133.36$ 56.50$ 5.00$ 61.50$ 194.85$ 98% 22.70 574.51 32.68 2.24$ 3.28 - 1.70 62.59$
Greenfield SCCT Aero 595$ 9.24% 55.03$ 11.93$ 1.35$ 13.28$ 68.31$ 18% 43.32 574.51 58.74 3.71$ 5.89 - 3.18 114.85$
Greenfield Intercooled Aero SCCT 541$ 9.24% 50.01$ 6.20$ 1.35$ 7.55$ 57.57$ 18% 36.51 574.51 51.17 4.02$ 5.13 - 2.75 99.58$
Greenfield SCCT Frame (2 Frame "F") 384$ 7.97% 30.59$ 10.06$ 1.35$ 11.41$ 42.00$ 18% 26.64 574.51 63.50 4.96$ 6.37 - 3.48 104.95$
Greenfield Internal Combustion Engines 649$ 8.24% 53.46$ 12.72$ 1.35$ 14.07$ 67.53$ 92% 8.38 574.51 49.98 5.50$ 5.01 - 2.71 71.58$
Greenfield CCCT 2x1 - (Wet Cooling) * 704$ 8.24% 57.97$ 8.11$ 1.35$ 9.46$ 67.43$ 60% 12.83 574.51 41.29 2.94$ 4.14 - 2.22 63.41$
Greenfield CCCT Duct Firing 2x1 - (Wet Cooling) 187$ 8.24% 15.38$ 2.56$ 1.35$ 3.91$ 19.29$ 16% 13.76 574.51 50.95 0.11$ 5.11 - 2.74 72.66$
Greenfield CCCT (1x1) - (Wet Cooling) 763$ 8.24% 62.82$ 11.76$ 1.35$ 13.11$ 75.93$ 60% 14.45 574.51 41.63 2.94$ 4.17 - 2.24 65.42$
Greenfield CCCT Duct Firing 1x1 - (Wet Cooling) 187$ 8.24% 15.38$ 2.56$ 1.35$ 3.91$ 19.29$ 16% 13.76 574.51 50.95 0.10$ 5.11 - 2.74 72.66$
Greenfield CCCT 2x1 - (Dry Cooling) 722$ 8.24% 59.43$ 9.75$ 1.35$ 11.10$ 70.53$ 60% 13.42 574.51 42.87 3.03$ 4.30 - 2.30 65.92$ Greenfield CCCT Duct Firing 2x1 - (Dry Cooling) 188$ 8.24% 15.48$ 2.69$ 1.35$ 4.04$ 19.52$ 16% 13.93 574.51 54.65 0.11$ 5.48 - 2.94 77.10$
Other - Renewables
Wind 1,474$ 9.32% 137.37$ 30.30$ 0.50$ 30.80$ 168.17$ 30% 63.99 - - - 4.75 (20.26) - 48.48$
Geothermal 3/ 2,310$ 7.14% 165.03$ 93.47$ 1.35$ 94.82$ 259.85$ 94% 31.72 - 21.09 2.34$ - (20.26) 34.90$ Compressed Air Energy Storage (CAES) 715$ 9.56% 68.36$ 4.95$ 1.35$ 6.30$ 74.66$ 25% 34.09 - 45.10 1.27$ - - 3.84 84.31$ West Side Options (Sea Level)
Natural Gas
Microturbines 2,065$ 11.36% 234.46$ 386.91$ - 386.91$ 621.37$ 98% 72.38 574.51 82.27 7.24$ 8.25 - 4.80 174.95$
Fuel Cells 1,576$ 8.46% 133.36$ 56.50$ 5.00$ 61.50$ 194.85$ 98% 22.70 574.51 32.68 2.24$ 3.28 - 1.70 62.59$
Greenfield SCCT Aero 566$ 9.24% 52.28$ 11.33$ 1.35$ 12.68$ 64.96$ 18% 41.20 574.51 58.74 3.57$ 5.89 - 3.18 112.58$
Greenfield Intercooled Aero SCCT 514$ 9.24% 47.51$ 5.89$ 1.35$ 7.24$ 54.76$ 18% 34.73 574.51 51.17 3.86$ 5.13 - 2.75 97.64$
Greenfield SCCT Frame (2 Frame "F") 365$ 7.97% 29.06$ 9.56$ 1.35$ 10.91$ 39.97$ 18% 25.35 574.51 63.50 4.77$ 6.37 - 3.48 103.46$
Greenfield Internal Combustion Engines 649$ 9.24% 60.00$ 12.72$ 1.35$ 14.07$ 74.07$ 92% 9.19 574.51 49.98 5.50$ 5.01 - 2.71 72.39$
Greenfield CCCT 2x1 - (Wet Cooling) * 669$ 8.24% 55.07$ 7.71$ 1.35$ 9.06$ 64.13$ 60% 12.20 574.51 41.29 2.82$ 4.14 - 2.22 62.67$
Greenfield CCCT Duct Firing 2x1 - (Wet Cooling) 177$ 8.24% 14.61$ 2.44$ 1.35$ 3.79$ 18.39$ 16% 13.12 574.51 50.95 0.11$ 5.11 - 2.74 72.02$
Greenfield CCCT (1x1) - (Wet Cooling) 725$ 8.24% 59.68$ 11.17$ 1.35$ 12.52$ 72.20$ 60% 13.74 574.51 41.63 2.82$ 4.17 - 2.24 64.60$
Greenfield CCCT Duct Firing 1x1 - (Wet Cooling) 177$ 8.24% 14.61$ 2.44$ 1.35$ 3.79$ 18.39$ 16% 13.12 574.51 50.95 0.10$ 5.11 - 2.74 72.01$
Greenfield CCCT 2x1 - (Dry Cooling) 686$ 8.24% 56.46$ 9.26$ 1.35$ 10.61$ 67.07$ 60% 12.76 574.51 42.87 2.91$ 4.30 - 2.30 65.15$ Greenfield CCCT Duct Firing 2x1 - (Dry Cooling) 179$ 8.24% 14.71$ 2.55$ 1.35$ 3.90$ 18.61$ 16% 13.28 574.51 54.65 0.11$ 5.48 - 2.94 76.45$
Other- Renewables
Wind 1,474$ 9.32% 137.37$ 30.30$ 0.50$ 30.80$ 168.17$ 30% 63.99 - - - 4.75 (20.26) - 48.48$
Combined Heat & Power (CHP) 645$ 10.78% 69.53$ 23.61$ 3.59$ 27.20$ 96.73$ 85% 12.99 574.51 52.97 3.68$ 4.75 - - 74.39$
Customer Owned Standby Generation ** 138$ 15.52% 21.40$ - - - 21.40$ 2% 122.16 836.82 87.87 20.48$ - - - 230.51$ Compressed Air Energy Storage (CAES) 679$ 9.56% 64.94$ 4.70$ 1.35$ 6.05$ 70.99$ 25% 32.42 - 35.71 1.22$ - - 3.84 73.20$
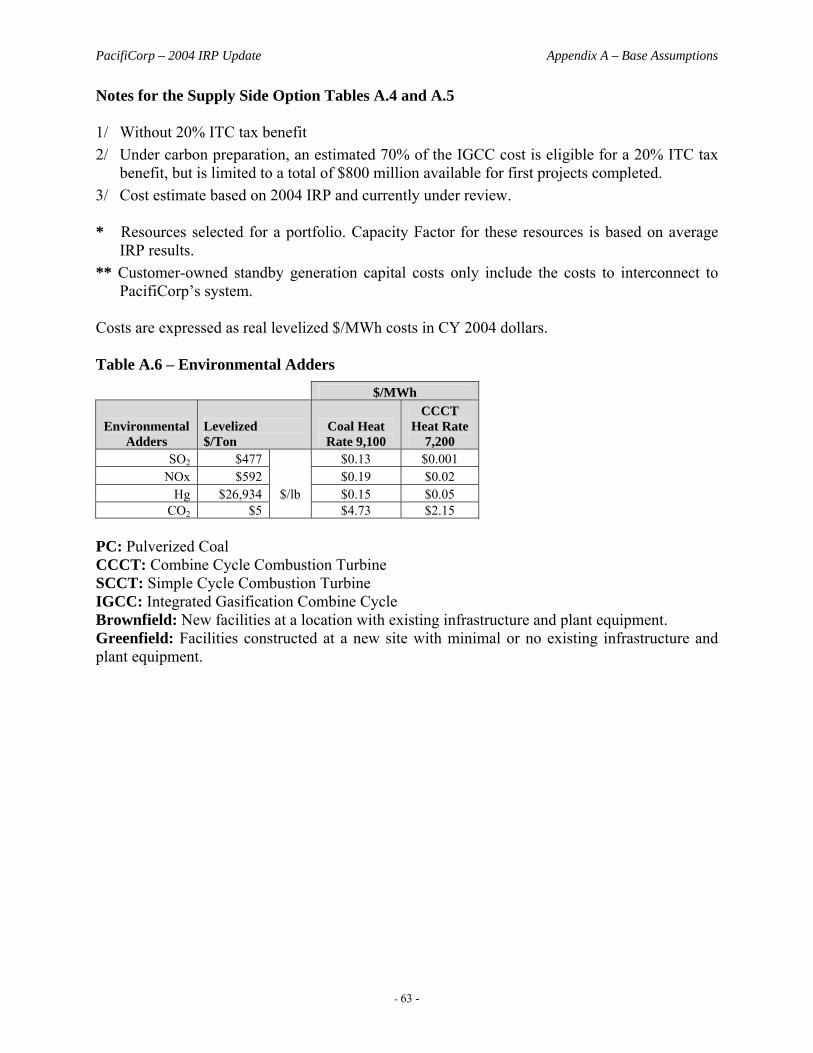
PacifiCorp – 2004 IRP Update Appendix A – Base Assumptions
- 63 -
Notes for the Supply Side Option Tables A.4 and A.5 1/ Without 20% ITC tax benefit 2/ Under carbon preparation, an estimated 70% of the IGCC cost is eligible for a 20% ITC tax
benefit, but is limited to a total of $800 million available for first projects completed. 3/ Cost estimate based on 2004 IRP and currently under review. * Resources selected for a portfolio. Capacity Factor for these resources is based on average
IRP results. ** Customer-owned standby generation capital costs only include the costs to interconnect to
PacifiCorp’s system. Costs are expressed as real levelized $/MWh costs in CY 2004 dollars. Table A.6 – Environmental Adders
$/MWh
Environmental Adders
Levelized $/Ton
Coal Heat Rate 9,100
CCCT Heat Rate
7,200 SO2 $477 $0.13 $0.001
NOx $592 $0.19 $0.02 Hg $26,934 $/lb $0.15 $0.05
CO2 $5 $4.73 $2.15 PC: Pulverized Coal CCCT: Combine Cycle Combustion Turbine SCCT: Simple Cycle Combustion Turbine IGCC: Integrated Gasification Combine Cycle Brownfield: New facilities at a location with existing infrastructure and plant equipment. Greenfield: Facilities constructed at a new site with minimal or no existing infrastructure and plant equipment.
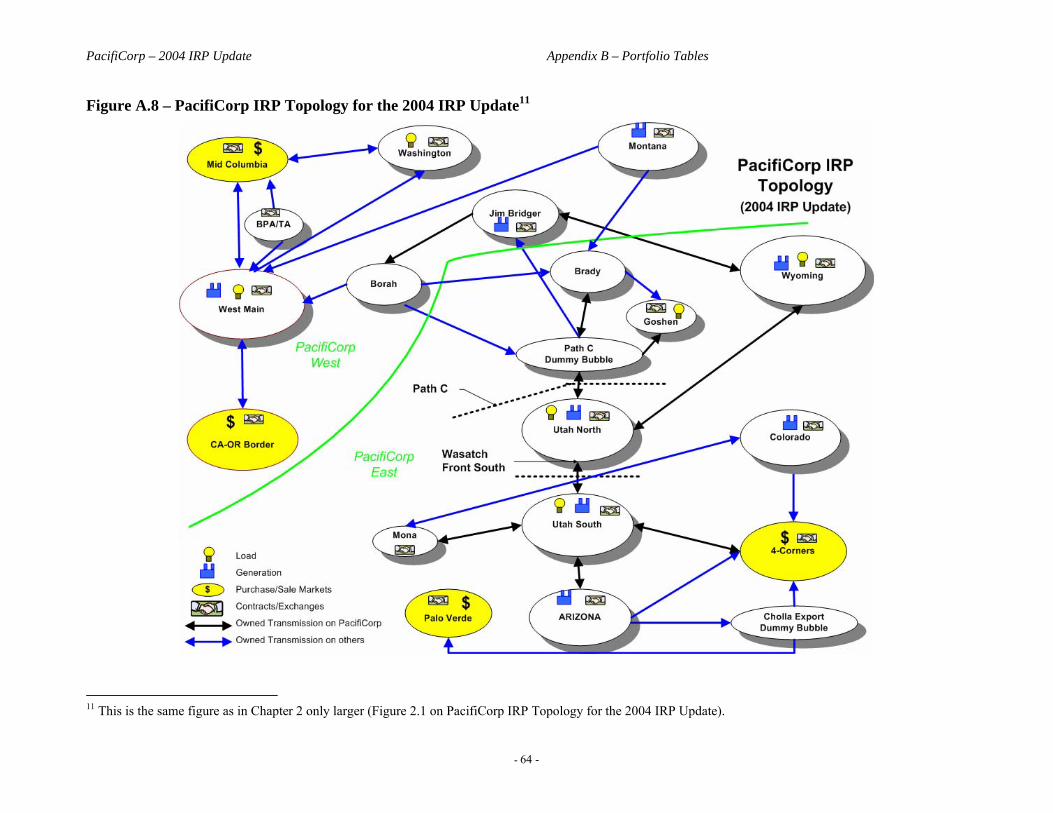
PacifiCorp – 2004 IRP Update Appendix B – Portfolio Tables
- 64 -
Figure A.8 – PacifiCorp IRP Topology for the 2004 IRP Update11
11 This is the same figure as in Chapter 2 only larger (Figure 2.1 on PacifiCorp IRP Topology for the 2004 IRP Update).
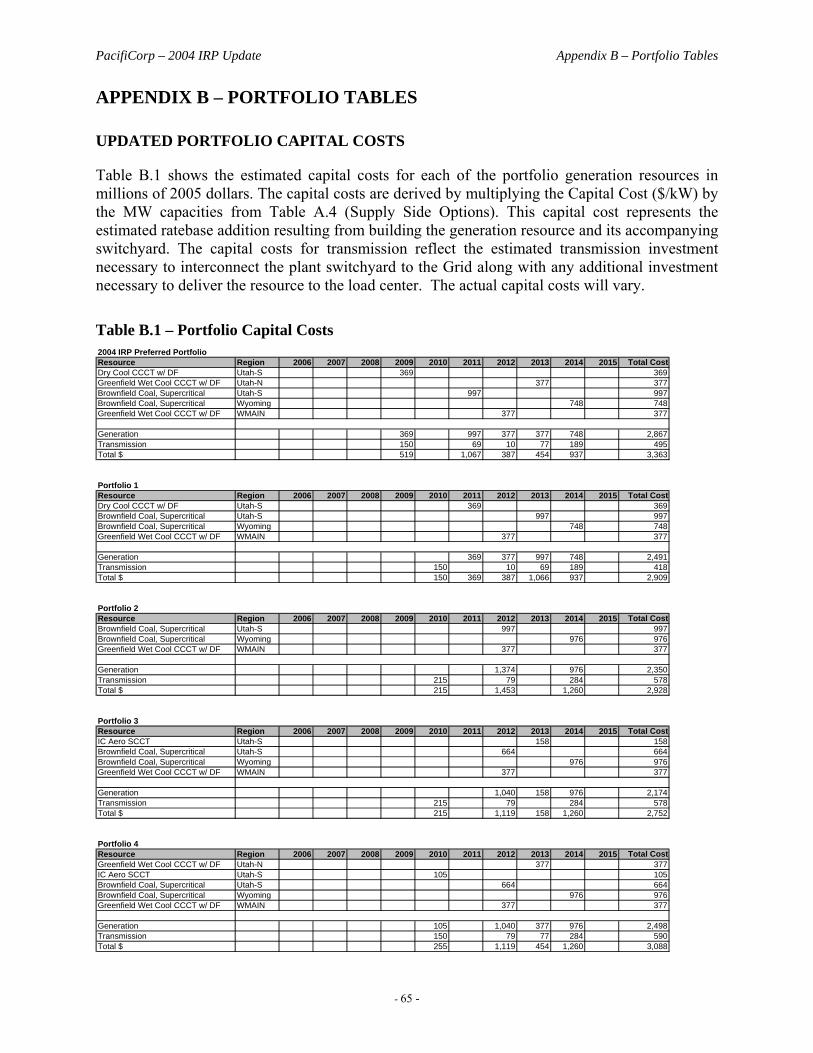
PacifiCorp – 2004 IRP Update Appendix B – Portfolio Tables
- 65 -
APPENDIX B – PORTFOLIO TABLES
UPDATED PORTFOLIO CAPITAL COSTS
Table B.1 shows the estimated capital costs for each of the portfolio generation resources in millions of 2005 dollars. The capital costs are derived by multiplying the Capital Cost ($/kW) by the MW capacities from Table A.4 (Supply Side Options). This capital cost represents the estimated ratebase addition resulting from building the generation resource and its accompanying switchyard. The capital costs for transmission reflect the estimated transmission investment necessary to interconnect the plant switchyard to the Grid along with any additional investment necessary to deliver the resource to the load center. The actual capital costs will vary.
Table B.1 – Portfolio Capital Costs 2004 IRP Preferred PortfolioResource Region 2006 2007 2008 2009 2010 2011 2012 2013 2014 2015 Total CostDry Cool CCCT w/ DF Utah-S 369 369Greenfield Wet Cool CCCT w/ DF Utah-N 377 377Brownfield Coal, Supercritical Utah-S 997 997Brownfield Coal, Supercritical Wyoming 748 748Greenfield Wet Cool CCCT w/ DF WMAIN 377 377
Generation 369 997 377 377 748 2,867Transmission 150 69 10 77 189 495Total $ 519 1,067 387 454 937 3,363
Portfolio 1Resource Region 2006 2007 2008 2009 2010 2011 2012 2013 2014 2015 Total CostDry Cool CCCT w/ DF Utah-S 369 369Brownfield Coal, Supercritical Utah-S 997 997Brownfield Coal, Supercritical Wyoming 748 748Greenfield Wet Cool CCCT w/ DF WMAIN 377 377
Generation 369 377 997 748 2,491Transmission 150 10 69 189 418Total $ 150 369 387 1,066 937 2,909
Portfolio 2Resource Region 2006 2007 2008 2009 2010 2011 2012 2013 2014 2015 Total CostBrownfield Coal, Supercritical Utah-S 997 997Brownfield Coal, Supercritical Wyoming 976 976Greenfield Wet Cool CCCT w/ DF WMAIN 377 377
Generation 1,374 976 2,350Transmission 215 79 284 578Total $ 215 1,453 1,260 2,928
Portfolio 3Resource Region 2006 2007 2008 2009 2010 2011 2012 2013 2014 2015 Total CostIC Aero SCCT Utah-S 158 158Brownfield Coal, Supercritical Utah-S 664 664Brownfield Coal, Supercritical Wyoming 976 976Greenfield Wet Cool CCCT w/ DF WMAIN 377 377
Generation 1,040 158 976 2,174Transmission 215 79 284 578Total $ 215 1,119 158 1,260 2,752
Portfolio 4Resource Region 2006 2007 2008 2009 2010 2011 2012 2013 2014 2015 Total CostGreenfield Wet Cool CCCT w/ DF Utah-N 377 377IC Aero SCCT Utah-S 105 105Brownfield Coal, Supercritical Utah-S 664 664Brownfield Coal, Supercritical Wyoming 976 976Greenfield Wet Cool CCCT w/ DF WMAIN 377 377
Generation 105 1,040 377 976 2,498Transmission 150 79 77 284 590Total $ 255 1,119 454 1,260 3,088
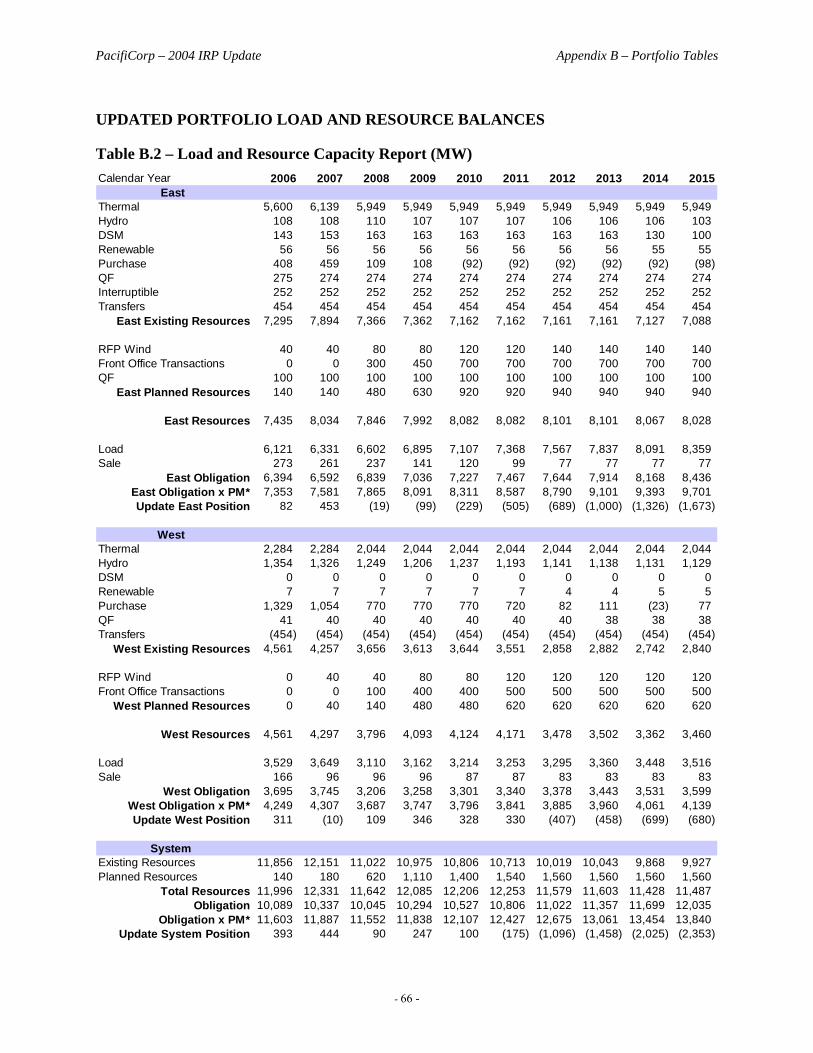
PacifiCorp – 2004 IRP Update Appendix B – Portfolio Tables
- 66 -
UPDATED PORTFOLIO LOAD AND RESOURCE BALANCES
Table B.2 – Load and Resource Capacity Report (MW) Calendar Year 2006 2007 2008 2009 2010 2011 2012 2013 2014 2015
East Thermal 5,600 6,139 5,949 5,949 5,949 5,949 5,949 5,949 5,949 5,949Hydro 108 108 110 107 107 107 106 106 106 103DSM 143 153 163 163 163 163 163 163 130 100Renewable 56 56 56 56 56 56 56 56 55 55Purchase 408 459 109 108 (92) (92) (92) (92) (92) (98)QF 275 274 274 274 274 274 274 274 274 274Interruptible 252 252 252 252 252 252 252 252 252 252Transfers 454 454 454 454 454 454 454 454 454 454
East Existing Resources 7,295 7,894 7,366 7,362 7,162 7,162 7,161 7,161 7,127 7,088
RFP Wind 40 40 80 80 120 120 140 140 140 140Front Office Transactions 0 0 300 450 700 700 700 700 700 700QF 100 100 100 100 100 100 100 100 100 100
East Planned Resources 140 140 480 630 920 920 940 940 940 940
East Resources 7,435 8,034 7,846 7,992 8,082 8,082 8,101 8,101 8,067 8,028
Load 6,121 6,331 6,602 6,895 7,107 7,368 7,567 7,837 8,091 8,359Sale 273 261 237 141 120 99 77 77 77 77
East Obligation 6,394 6,592 6,839 7,036 7,227 7,467 7,644 7,914 8,168 8,436East Obligation x PM* 7,353 7,581 7,865 8,091 8,311 8,587 8,790 9,101 9,393 9,701Update East Position 82 453 (19) (99) (229) (505) (689) (1,000) (1,326) (1,673)
West Thermal 2,284 2,284 2,044 2,044 2,044 2,044 2,044 2,044 2,044 2,044Hydro 1,354 1,326 1,249 1,206 1,237 1,193 1,141 1,138 1,131 1,129DSM 0 0 0 0 0 0 0 0 0 0Renewable 7 7 7 7 7 7 4 4 5 5Purchase 1,329 1,054 770 770 770 720 82 111 (23) 77QF 41 40 40 40 40 40 40 38 38 38Transfers (454) (454) (454) (454) (454) (454) (454) (454) (454) (454)
West Existing Resources 4,561 4,257 3,656 3,613 3,644 3,551 2,858 2,882 2,742 2,840
RFP Wind 0 40 40 80 80 120 120 120 120 120Front Office Transactions 0 0 100 400 400 500 500 500 500 500
West Planned Resources 0 40 140 480 480 620 620 620 620 620
West Resources 4,561 4,297 3,796 4,093 4,124 4,171 3,478 3,502 3,362 3,460
Load 3,529 3,649 3,110 3,162 3,214 3,253 3,295 3,360 3,448 3,516Sale 166 96 96 96 87 87 83 83 83 83
West Obligation 3,695 3,745 3,206 3,258 3,301 3,340 3,378 3,443 3,531 3,599West Obligation x PM* 4,249 4,307 3,687 3,747 3,796 3,841 3,885 3,960 4,061 4,139Update West Position 311 (10) 109 346 328 330 (407) (458) (699) (680)
System Existing Resources 11,856 12,151 11,022 10,975 10,806 10,713 10,019 10,043 9,868 9,927Planned Resources 140 180 620 1,110 1,400 1,540 1,560 1,560 1,560 1,560
Total Resources 11,996 12,331 11,642 12,085 12,206 12,253 11,579 11,603 11,428 11,487Obligation 10,089 10,337 10,045 10,294 10,527 10,806 11,022 11,357 11,699 12,035
Obligation x PM* 11,603 11,887 11,552 11,838 12,107 12,427 12,675 13,061 13,454 13,840Update System Position 393 444 90 247 100 (175) (1,096) (1,458) (2,025) (2,353)
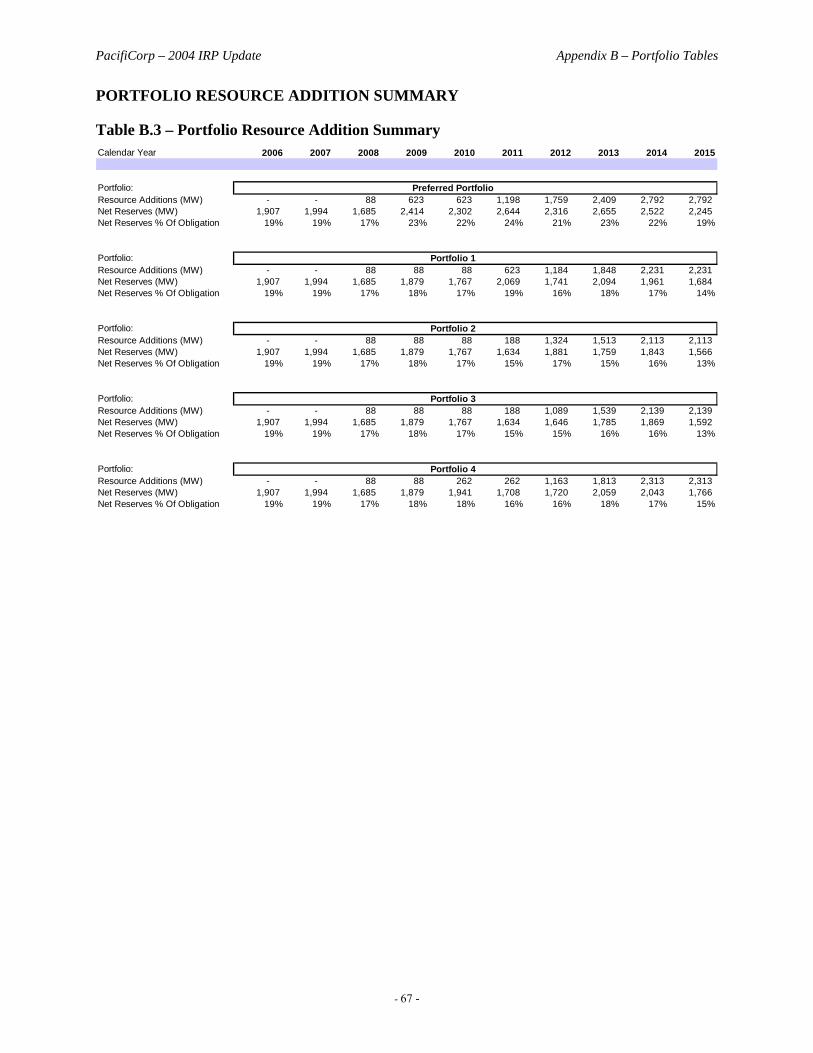
PacifiCorp – 2004 IRP Update Appendix B – Portfolio Tables
- 67 -
PORTFOLIO RESOURCE ADDITION SUMMARY
Table B.3 – Portfolio Resource Addition Summary Calendar Year 2006 2007 2008 2009 2010 2011 2012 2013 2014 2015
Portfolio: Preferred PortfolioResource Additions (MW) - - 88 623 623 1,198 1,759 2,409 2,792 2,792 Net Reserves (MW) 1,907 1,994 1,685 2,414 2,302 2,644 2,316 2,655 2,522 2,245 Net Reserves % Of Obligation 19% 19% 17% 23% 22% 24% 21% 23% 22% 19%
Portfolio: Portfolio 1Resource Additions (MW) - - 88 88 88 623 1,184 1,848 2,231 2,231 Net Reserves (MW) 1,907 1,994 1,685 1,879 1,767 2,069 1,741 2,094 1,961 1,684 Net Reserves % Of Obligation 19% 19% 17% 18% 17% 19% 16% 18% 17% 14%
Portfolio: Portfolio 2Resource Additions (MW) - - 88 88 88 188 1,324 1,513 2,113 2,113 Net Reserves (MW) 1,907 1,994 1,685 1,879 1,767 1,634 1,881 1,759 1,843 1,566 Net Reserves % Of Obligation 19% 19% 17% 18% 17% 15% 17% 15% 16% 13%
Portfolio: Portfolio 3Resource Additions (MW) - - 88 88 88 188 1,089 1,539 2,139 2,139 Net Reserves (MW) 1,907 1,994 1,685 1,879 1,767 1,634 1,646 1,785 1,869 1,592 Net Reserves % Of Obligation 19% 19% 17% 18% 17% 15% 15% 16% 16% 13%
Portfolio: Portfolio 4Resource Additions (MW) - - 88 88 262 262 1,163 1,813 2,313 2,313 Net Reserves (MW) 1,907 1,994 1,685 1,879 1,941 1,708 1,720 2,059 2,043 1,766 Net Reserves % Of Obligation 19% 19% 17% 18% 18% 16% 16% 18% 17% 15%
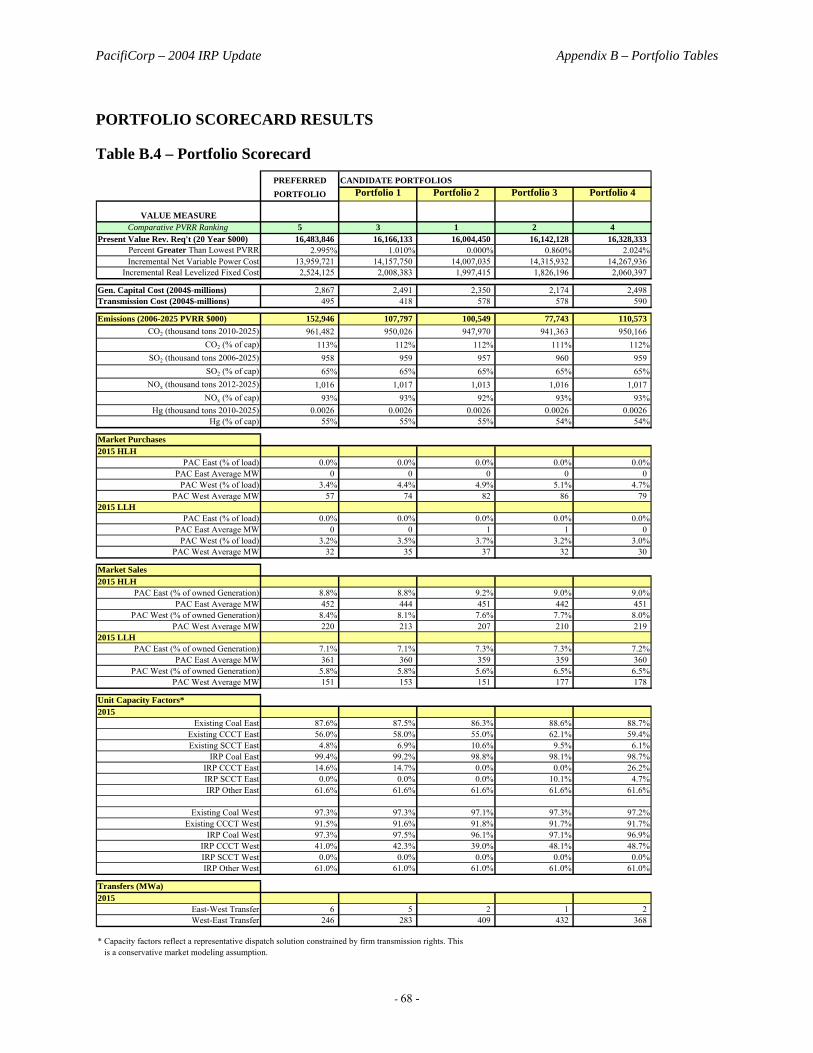
PacifiCorp – 2004 IRP Update Appendix B – Portfolio Tables
- 68 -
PORTFOLIO SCORECARD RESULTS
Table B.4 – Portfolio Scorecard PREFERRED CANDIDATE PORTFOLIOSPORTFOLIO Portfolio 1 Portfolio 2 Portfolio 3 Portfolio 4
VALUE MEASUREComparative PVRR Ranking 5 3 1 2 4
Present Value Rev. Req't (20 Year $000) 16,483,846 16,166,133 16,004,450 16,142,128 16,328,333 Percent Greater Than Lowest PVRR 2.995% 1.010% 0.000% 0.860% 2.024%Incremental Net Variable Power Cost 13,959,721 14,157,750 14,007,035 14,315,932 14,267,936
Incremental Real Levelized Fixed Cost 2,524,125 2,008,383 1,997,415 1,826,196 2,060,397
Gen. Capital Cost (2004$-millions) 2,867 2,491 2,350 2,174 2,498 Transmission Cost (2004$-millions) 495 418 578 578 590
Emissions (2006-2025 PVRR $000) 152,946 107,797 100,549 77,743 110,573 CO2 (thousand tons 2010-2025) 961,482 950,026 947,970 941,363 950,166
CO2 (% of cap) 113% 112% 112% 111% 112%SO2 (thousand tons 2006-2025) 958 959 957 960 959
SO2 (% of cap) 65% 65% 65% 65% 65%NOx (thousand tons 2012-2025) 1,016 1,017 1,013 1,016 1,017
NOx (% of cap) 93% 93% 92% 93% 93%Hg (thousand tons 2010-2025) 0.0026 0.0026 0.0026 0.0026 0.0026
Hg (% of cap) 55% 55% 55% 54% 54%
Market Purchases2015 HLH
PAC East (% of load) 0.0% 0.0% 0.0% 0.0% 0.0%PAC East Average MW 0 0 0 0 0
PAC West (% of load) 3.4% 4.4% 4.9% 5.1% 4.7%PAC West Average MW 57 74 82 86 79
2015 LLHPAC East (% of load) 0.0% 0.0% 0.0% 0.0% 0.0%
PAC East Average MW 0 0 1 1 0 PAC West (% of load) 3.2% 3.5% 3.7% 3.2% 3.0%
PAC West Average MW 32 35 37 32 30
Market Sales2015 HLH
PAC East (% of owned Generation) 8.8% 8.8% 9.2% 9.0% 9.0%PAC East Average MW 452 444 451 442 451
PAC West (% of owned Generation) 8.4% 8.1% 7.6% 7.7% 8.0%PAC West Average MW 220 213 207 210 219
2015 LLHPAC East (% of owned Generation) 7.1% 7.1% 7.3% 7.3% 7.2%
PAC East Average MW 361 360 359 359 360 PAC West (% of owned Generation) 5.8% 5.8% 5.6% 6.5% 6.5%
PAC West Average MW 151 153 151 177 178
Unit Capacity Factors*2015
Existing Coal East 87.6% 87.5% 86.3% 88.6% 88.7%Existing CCCT East 56.0% 58.0% 55.0% 62.1% 59.4%Existing SCCT East 4.8% 6.9% 10.6% 9.5% 6.1%
IRP Coal East 99.4% 99.2% 98.8% 98.1% 98.7%IRP CCCT East 14.6% 14.7% 0.0% 0.0% 26.2%IRP SCCT East 0.0% 0.0% 0.0% 10.1% 4.7%IRP Other East 61.6% 61.6% 61.6% 61.6% 61.6%
Existing Coal West 97.3% 97.3% 97.1% 97.3% 97.2%Existing CCCT West 91.5% 91.6% 91.8% 91.7% 91.7%
IRP Coal West 97.3% 97.5% 96.1% 97.1% 96.9%IRP CCCT West 41.0% 42.3% 39.0% 48.1% 48.7%IRP SCCT West 0.0% 0.0% 0.0% 0.0% 0.0%IRP Other West 61.0% 61.0% 61.0% 61.0% 61.0%
Transfers (MWa)2015
East-West Transfer 6 5 2 1 2 West-East Transfer 246 283 409 432 368
* Capacity factors reflect a representative dispatch solution constrained by firm transmission rights. This is a conservative market modeling assumption.
PacifiCorp – 2004 IRP Update Appendix C – IRP Benchmarking Study
- 69 -
APPENDIX C – IRP BENCHMARKING STUDY
INTRODUCTION
The purpose of PacifiCorp’s IRP benchmarking study, completed in July 2005, was to critique PacifiCorp’s 2004 IRP against other electric utilities’ IRPs and to form a picture of the state-of-the-art concerning IRP modeling and analysis activities. In doing so, PacifiCorp sought to identify common and notable practices among the IRPs examined, as well as current issues and challenges for long term resource planning. This study also served as the means to compile useful IRP reference material. This study is organized into six sections. The “Study Methodology” section describes the benchmarking study methodology and profiles the companies selected for detailed IRP analysis. The “IRP Stakeholder Survey” section describes the results of a benchmarking survey question given to PacifiCorp’s IRP stakeholders as part of a broader satisfaction survey conducted in the spring of 2005. The section “IRP Common Practices” presents observations on various aspects of the organizations’ IRPs, grouped by topic area. The section “IRP Practices of Interest” profiles IRP methods and reporting elements from the IRPs examined that are of interest for potential use by PacifiCorp in future IRPs. The section “Hydro Hedging Strategy Comparison” provides a detailed comparison of hydro modeling hedging strategies employed in a number of IRPs. The last section, “Conclusions”, presents an overall assessment of how PacifiCorp’s IRP fares against other utility IRPs and highlights the main areas of distinction.
STUDY METHODOLOGY
The approach taken for the study was to examine in detail eight publicly available electric utility IRPs consisting of a mix of company characteristics, and to also conduct a cursory review of other IRPs included in PacifiCorp’s IRP inventory. (IRPs were gathered mainly by downloading them from company and utility commission Web sites; direct requests were made to a number of organizations as well.) One of the findings from the IRP document search is that relatively few companies make their IRPs readily available or describe their IRP process on their company Web site. A number of criteria were applied to select IRPs for detailed review. The main goal was to analyze IRPs from a mix of utility types and regions, as well as target IRPs from the western states. Some of the specific objectives were to obtain an IRP from: • A large multi-state utility, • At least one of the California investor-owned utilities, • A utility with a size and structure similar to PacifiCorp. Although a number of resource plans from organizations other than utilities were gathered and reviewed (i.e., California Energy Commission and the Northwest Power and Conservation Council), only electric utilities were targeted for the detailed IRP reviews. Below are brief profiles of each utility selected, including the reasons for IRP selection.
PacifiCorp – 2004 IRP Update Appendix C – IRP Benchmarking Study
- 70 -
Public Service Company of Colorado (Xcel Energy), 2003 IRP Statistics: Installed Capacity - 3,847 MW; Annual Sales - 31,718 GWh; 1.3 million customers This single state utility, a subsidiary of Xcel Energy, compares to our planning practices on resource acquisition, resources considered, and the extent of deterministic/scenario modeling. Also, PacifiCorp conducts business with this utility. This company was selected for their diversified need and alternate planning methods.
Northern States Power – Minnesota (Xcel Energy), 2004 IRP Statistics: Installed Capacity - 6,255 MW; Annual Sales – 40,006 GWh; 1.4 million customers Northern States Power (NSP) was selected for its multi-state territory and similar planning objectives. It operates in five states and must file IRPs in each of these states. They also use multiple models for portfolio evaluation. Finally, NSP has a diverse mix of resources in their portfolio, including Nuclear.
Portland General Electric (2002/2004) Stats: 1,975MW; Annual Sales – 18,425 GWh; 1.5 million customers PacifiCorp’s level of interaction with Portland General Electric (PGE) and similar OPUC requirements makes this plan good for comparison purposes. PGE’s portfolio also includes similar base resources (Coal, Gas, Hydro) to PacifiCorp’s, although on a smaller overall scale.
Puget Sound Energy, 2005 IRP Statistics: Installed Capacity - 1,868 MW; Annual Sales – 19,591 GWh; 1.2 million Gas/Electric customers This April 2005 plan is the newest plan available to PacifiCorp, and therefore reflects the latest input and market assumptions. Although a smaller electric utility, Puget Sound Energy (PSE) provided an IRP document with comprehensive information. Its stakeholder process is also similar to PacifiCorp’s in that 10 formal meetings were held. Of interest is that the public process also involved two main advisory groups to cover different aspects of their least-cost planning process.
Idaho Power, 2004 IRP Statistics: Installed Capacity - 3,085 MW; Annual Sales – 12,980 GWh; 425,000 customers PacifiCorp and Idaho Power have joint ownership of plants. Idaho Power also files their IRP in multiple states (ID, OR), and has a heavy reliance on hydro
PacifiCorp – 2004 IRP Update Appendix C – IRP Benchmarking Study
- 71 -
resources. With PacifiCorp’s resource similarities and close ties, Idaho Power represents a useful IRP to include in the study.
Southern California Edison, 2003 IRP Statistics: Installed Capacity - 10,207 MW; Annual Sales – 52,229 GWh; 4.7 million customers Size, modeling software used, and active promotion of policy discussions, makes Southern California Edison (SCE) a good IRP to include in the study. Some other items of interest include the following. ● This IRP is the first post-energy crisis long-term resource plan, and provides a
good example of how California investor-owned utilities are handling the planning function after a major energy crisis.
● SCE provided an interim plan to “bridge the gap” to acknowledged resolution of the preferred plan which carries the bulk of proposed resources.
● SCE used the same modeling software and consultants (Global Energy Decisions) to conduct their planning.
LG&E Energy Corporation, 2005 IRP Statistics: Installed Capacity - 7,065 MW; Annual Sales 28,190 GWh; 855,000 customers This Company’s IRP (jointly filed by LG&E’s two operating companies, Louisville Gas & Electric and Kentucky Utilities) was selected due to both corporate and IRP similarities: ● LG&E Energy’s IRP is comprehensive and detailed, and is therefore similar to
PacifiCorp’s IRP with respect to the volume of information provided. ● The amount of installed plant capacity is similar to PacifiCorp’s (7,610 MW
net summer capability for LG&E Energy versus 7,987 net plant capability for PacifiCorp).
● Like PacifiCorp, LG&E Energy has two utility operating companies which are integrated for IRP modeling purposes (Louisville Gas & Electric and Kentucky Utilities).
● Like PacifiCorp, LG&E Energy is owned by a foreign company: E.ON AG, a German company.
Georgia Power/Southern Company Services, 2004 IRP Statistics (Georgia Power only): Installed Capacity - 13,980 MW; Annual Sales - 75,000 MWh; 2.1 million customers The IRP from Georgia Power/Southern Company Services fulfills the requirement for including an IRP from a “top-ten” multi-state utility system. Southern Company Services is the support organization for Georgia Power and the other Southern Company operating companies. For IRP preparation, it was tasked with providing a system-wide resource mix study that was distributed to the operating companies for IRP and resource allocation decisions.
PacifiCorp – 2004 IRP Update Appendix C – IRP Benchmarking Study
- 72 -
IRP STAKEHOLDER SURVEY
PacifiCorp distributed an IRP Stakeholder Satisfaction Survey in March 2005. One of the questions was designed to gauge stakeholder opinion on how PacifiCorp’s IRP ranked on overall quality with respect to other IRPs with which respondents were familiar. The question was worded as follows:
Given your knowledge about other organization’s IRPs, how does PacifiCorp’s IRP generally compare in terms of quality?
Respondents were asked to rank PacifiCorp’s IRP as: 1 = Very Unfavorably, 2 = Somewhat Unfavorably, 3 = The Same, 4 = Somewhat Favorably, 5 = Very Favorably. PacifiCorp received a response from 17 of the 20 respondents that completed the survey. The average raw score for the 17 respondents was 4.29 (out of a maximum score of 5). On a percentage basis, the score was 86 percent. The table below shows the frequency distribution of rankings. Almost 60 percent of the respondents judged PacifiCorp’s IRP “very favorably” with respect to other IRPs.
IRP COMMON PRACTICES
This section summarizes common practices across the IRPs examined based on various subject areas, and highlights similarities and differences with respect to PacifiCorp’s IRP. Portfolio Robustness A number of the IRPs examined refer to portfolio “robustness” or “resiliency”. This can be defined as the ability of a portfolio to do well on cost with respect to other portfolios given a broad range of future conditions. While nearly all utilities conducted sensitivity analysis using alternative risk factor values to calculate portfolio cost impacts, few attempted to provide a systematic quantitative measure of portfolio robustness that combined all information gleaned from the alternative futures investigated. Some of the IRPs described a rank-order methodology for assessing comparative resource technology costs, portfolio cost performance, or other performance measures. For example, Central Vermont Public Service Corporation performed a rank order analysis for eight portfolios against four scenarios using five portfolio performance measures. Average rank orders and rank “volatilities” were computed for each portfolio across the scenarios and for each performance measure. The rank orders and rank volatilities for each portfolio were then plotted for analysis. Cost-versus-Risk Tradeoff Analysis
Quality Comparison FrequencyVery Unfavorably 0Somewhat Unfavorably 0The Same 5Somewhat Favorably 2Very Favorably 10
TOTAL COUNT 17
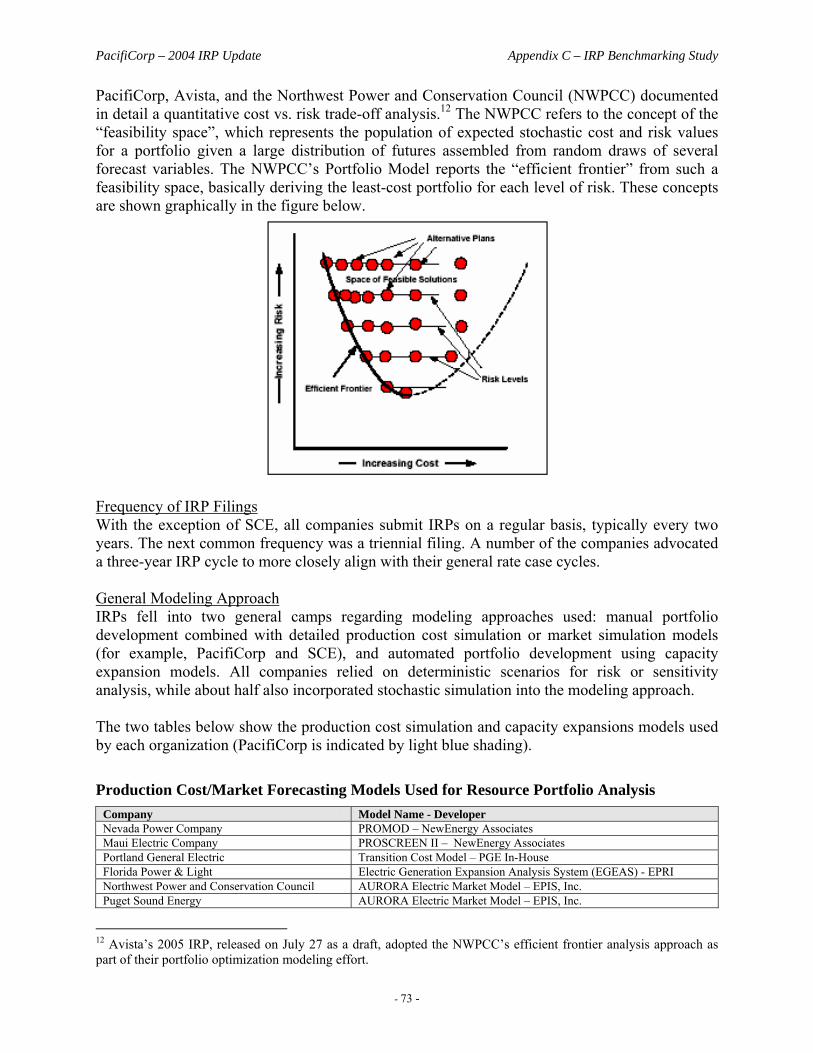
PacifiCorp – 2004 IRP Update Appendix C – IRP Benchmarking Study
- 73 -
PacifiCorp, Avista, and the Northwest Power and Conservation Council (NWPCC) documented in detail a quantitative cost vs. risk trade-off analysis.12 The NWPCC refers to the concept of the “feasibility space”, which represents the population of expected stochastic cost and risk values for a portfolio given a large distribution of futures assembled from random draws of several forecast variables. The NWPCC’s Portfolio Model reports the “efficient frontier” from such a feasibility space, basically deriving the least-cost portfolio for each level of risk. These concepts are shown graphically in the figure below.
Frequency of IRP Filings With the exception of SCE, all companies submit IRPs on a regular basis, typically every two years. The next common frequency was a triennial filing. A number of the companies advocated a three-year IRP cycle to more closely align with their general rate case cycles. General Modeling Approach IRPs fell into two general camps regarding modeling approaches used: manual portfolio development combined with detailed production cost simulation or market simulation models (for example, PacifiCorp and SCE), and automated portfolio development using capacity expansion models. All companies relied on deterministic scenarios for risk or sensitivity analysis, while about half also incorporated stochastic simulation into the modeling approach. The two tables below show the production cost simulation and capacity expansions models used by each organization (PacifiCorp is indicated by light blue shading).
Production Cost/Market Forecasting Models Used for Resource Portfolio Analysis Company Model Name - Developer Nevada Power Company PROMOD – NewEnergy Associates Maui Electric Company PROSCREEN II – NewEnergy Associates Portland General Electric Transition Cost Model – PGE In-House Florida Power & Light Electric Generation Expansion Analysis System (EGEAS) - EPRI Northwest Power and Conservation Council AURORA Electric Market Model – EPIS, Inc. Puget Sound Energy AURORA Electric Market Model – EPIS, Inc.
12 Avista’s 2005 IRP, released on July 27 as a draft, adopted the NWPCC’s efficient frontier analysis approach as part of their portfolio optimization modeling effort.
PacifiCorp – 2004 IRP Update Appendix C – IRP Benchmarking Study
- 74 -
Idaho Electric Power AURORA Electric Market Model – EPIS, Inc. Avista Corporation (2003/2005 IRPs) AURORA Electric Market Model – EPIS, Inc. California Energy Commission MULTISYM – Global Energy Decisions San Diego Gas & Electric RISKSYM – Global Energy Decisions Southern Company PROSYM – Global Energy Decisions Pacific Gas & Electric GenTrader – Power Costs Inc. (Generation asset optimization) PacifiCorp MARKETSYM/PROSYM – Global Energy Decisions
Capacity Expansion Models Used for Resource Portfolio Analysis Company Model Name - Developer Public Service Co. of Colorado PROVIEW Module of Strategist – NewEnergy Associates LG&E Energy PROVIEW Module of Strategist – NewEnergy Associates Southern Company PROVIEW Module of Strategist – NewEnergy Associates Northern States Power PROVIEW Module of Strategist – NewEnergy Associates Carolina Power & Light Company PROVIEW Module of Strategist – NewEnergy Associates Florida Power & Light Electric Generation Expansion Analysis System – EPRI Northwest Power and Conservation Council Excel-based Portfolio Model – NWPCC Avista Corporation (2005 IRP) Avista Linear Programming Model – Avista PacifiCorp Capacity Expansion Module (CEM) – Global Energy Decisions
Reserve Planning Margin For IRPs that reported a target or minimum reserve Planning Margin, the most common value was 15% as shown in the table below. Values ranged from a high of 20% to a low of 11%, with the average at exactly 15%. Of interest is that the three utilities that assumed a relatively low Planning Margin—Portland General Electric (12%), Nevada Power (12%) and Idaho Power (11%)—had the smallest amounts of installed capacity among those utilities listed in the table.
Electric Utility Target Reserve Planning
Margin (%) Florida Power & Light 20 Southern California Edison 17 Duke Power 17 Public Service Company of Colorado 17 Northern States Power 15 Avista Corporation 15 PacifiCorp 15 San Diego Gas & Electric 15* Southern Company 15 LG&E Energy 14 Portland General Electric 12 Nevada Power 12 Idaho Power 11
*Planning Margin allowed to vary in 15%-17% range until 2006; set to 15% for 2006-14. A number of the utilities, including PacifiCorp, conducted economic/Loss of Load Probability studies to determine the cost of reducing unserved energy at various Planning Margin levels. A simple-cycle CT was used as the basis for the carrying cost of building incremental capacity. These studies supplemented the Planning Margin selection process. For example, Southern Company pointed out that corporate perceptions of acceptable risk, industry experience, and operator input were also factors in their decision to select a 15% Planning Margin. Stochastic Simulation and Risk Measurement Only a number of companies utilized stochastic simulation in their modeling processes. In addition to PacifiCorp, stochastic modeling via Monte Carlo simulation was used by four of the
PacifiCorp – 2004 IRP Update Appendix C – IRP Benchmarking Study
- 75 -
utility companies—PSE, NSP, SCE, and PGE—as well as NWPCC. (Avista also incorporated Monte Carlo simulation for their 2005 IRP released in late July.) NSP only modeled its load forecast as a stochastic parameter, while the rest of the organizations that conducted stochastic simulations modeled at a minimum load, gas prices, and electricity prices as stochastic parameters. NWPPC and PSE used the same modeling approach and risk measure: TailVaR90, defined as the average value for the worst 10 percent of outcomes. Resource Screening The majority of IRPs reviewed used a levelized bus bar cost analysis to help screen supply-side technologies for more detailed evaluation in resource portfolios. The level of detail in describing resources and the justification for including them in portfolio analysis was mixed. PacifiCorp excelled at reporting each technology’s cost and performance attributes, but was less clear than some of the other IRPs in describing its technology selection process. Nearly all companies relied on consideration of qualitative factors to help select resource candidates. Typically, the screening consisted of a cost screening followed by a feasibility screening that considered a set of qualitative factors. The most often cited qualitative factors included technology maturity and environmental impacts. Others cited include construction risk (lead-time requirements), operational risk, operational flexibility, and the need to meet state or corporate resource goals (i.e., Renewable Portfolio Standards). One utility, Puget Sound Energy, excluded all resources defined as “emerging technologies” or whose economics were driven predominately by project-specific assumptions. Modeling of CHP Resources Those utilities that modeled CHP resources as a supply-side option did so by expressing CHP as a block resource based on a target or maximum achievable MW potential for the service territory. PacifiCorp’s CHP modeling is consistent with this approach. Puget Sound Energy did not evaluate CHP projects because they depend on project-specific economic assumptions and are therefore not suitable for comparison with generic technologies. LG&E Energy evaluated CHP, standby generation, and other distributed generation technologies as DSM resources using a qualitative screening process that was followed by a program cost-effectiveness evaluation using EPRI’s DSManager screening model. Noteworthy is that none of LG&E’s CHP/distributed generation resource options made it to the cost-effectiveness screening phase. A few utilities provided extensive discussion of CHP development issues in their service territories. PGE identified the following current hurdles to CHP projects: (1) long-term commitment of a steam host, (2) adequate funding capability, (3) investment required to meet FERC interconnection standards, (4) requirement for firm power guarantees, and (5) contract provisions needed to account for cost risks of dispatching variability. Nevada Power mentioned that a high penetration of CHP can be expected to lower their system load factor and increase average costs to serve remaining load. Resource Diversification Strategy Several IRPs explicitly stated that a main portfolio development goal was to have a diversified mix of resources or to increase fuel diversity. Parallels with the general investment strategy of spreading investments to reduce risk were cited (e.g., PGE). For most IRPs that didn’t rely on a portfolio optimization model, the resource diversification criterion was the primary determinant for developing portfolios manually for detailed evaluation. Several companies analyzed

PacifiCorp – 2004 IRP Update Appendix C – IRP Benchmarking Study
- 76 -
“bookend” portfolios composed of one resource type (i.e., all market purchases, coal, CCCT, etc.) to show the comparative benefit of new resource diversification. In PacifiCorp’s IRP, most portfolios were evaluated for incremental impacts of single resource changes as opposed to a complete bookends analysis. A few utilities cited the goal of developing a resource mix with different “commitment” lengths. Coal versus Gas Resources For IRPs that included candidate coal resources in their portfolio evaluations, coal resources were generally cited as the least-cost baseload resource under expected and high gas price scenarios. Notably, Southern Company Services concluded that CCCTs were the resources of choice for incremental additions based on their model assumptions. A number of utilities cited the ability of coal resources to mitigate the cost volatility of gas-intensive portfolios. Virtually all the IRPs discussed the risks of future carbon control costs. However, it was not possible to glean from the IRPs what influence it had on the makeup of resources in each utility’s preferred portfolio. Although NSP considered coal to be the least-cost resource, it noted that portfolio modeling could not distinguish a clear economic winner between baseload gas (CCCT) and coal, and that non-cost factors would tip the balance. Transmission Resources All IRPs included a discussion on existing transmission infrastructure and transmission planning to meet forecasted load obligations. While several other IRPs provided a more comprehensive discussion of their transmission systems, PacifiCorp was one of the few companies that provided a significant amount of detail on how transmission is modeled, as well as transmission costs associated with supply-side resource alternatives.13 None of the IRPs analyzed transmission projects as alternative supply-side options, such as transmission built to access markets rather than serve a specific supply-side resource. Some of the utilities factored in the costs of transmission projects to derive the portfolio cost, with costs fixed for all portfolios. Four IRPs—PacifiCorp, Puget Sound Energy, Southern Company, and Avista (2005 IRP)—each ran one transmission-related portfolio scenario. PSE and Avista constructed simple RTO/regional planning scenarios with a priori assumptions regarding RTO benefits (accelerated transmission availability and/or lower transmission pricing). Avista’s scenario assumed a transmission capital cost reduction of 30 percent. Southern Company constructed an “increased transmission constraint” scenario to look at impacts on export capability. Regarding transmission planning and availability issues, many IRPs cited transmission constraints as a foremost problem with respect to resource planning. Of interest was NSP’s statement that transmission interconnection request and Transmission Service Request (TSR) processes make portfolio planning difficult, and are not well-suited to the IRP or RFP processes. It cited the long lead-time for completing the transmission studies and the complications and delays caused by many generation bidders submitting interconnection requests to the Midwest Independent System Operator (MISO).14 NSP cited the cost recovery and allocation implications of making investments in regional transmission projects as opposed to local projects.
13 Idaho Power also reported transmission investment costs for each resource. 14 In response to these problems, MISO submitted to the FERC a “group study” proposal that bypasses queue order considerations to support the state-wide competitive bid process. Although initially rejected by FERC, the group study concept was later resurrected.
PacifiCorp – 2004 IRP Update Appendix C – IRP Benchmarking Study
- 77 -
Wind Resource Modeling Most of the organizations that modeled wind resources specified them as fixed quantities based on corporate or state-level mandated targets (i.e., Renewable Portfolio Standards), and then conducted sensitivity analysis, such as assuming lower or higher penetration levels with respect to the targets. For example, San Diego Gas & Electric’s portfolio includes a fixed amount of wind and other renewables to meet the 20% electric generation RPS target. The timing and technology mix was based upon information obtained from its 2002 renewable Request for Offer (RFO) process, other sources, and corporate judgment. The renewable costs were based on existing long term contract pricing, and discussions with renewable developers. PSE modeled four portfolios that assume a state RPS is in place, consisting of one with fixed renewable resources at 10% of load by 2013 and three with renewable resources at 15% of load by 2020. Idaho Power tested portfolios using a small number of fixed wind capacity levels: 1,000 MW (50 MW capacity credit), 350 MW (18 MW capacity credit), and 100 MW (5 MW capacity credit). In the case of SCE, they assumed a general renewables supply shape without distinguishing a specific mix of technology types. For those utility IRPs that discussed percentage capacity contributions for wind, PacifiCorp was near the top at 20%. Avista, for their 2005 IRP, used a value of 25%. The next highest level after PacifiCorp was NSP at 13.5%. Idaho Power used a 5% contribution, while LG&E Energy assumed no contribution. Average annual capacity factors ranged from 27% (SCE) to 35% (Idaho Power and PSE), with PacifiCorp at 28.9%. NSP provided an extensive discussion of wind resource modeling, given that they are aggressively pursuing wind projects due to several state legislative mandates to incorporate wind resources into their system. NSP modeled wind in three steps using the PROVIEW optimization module. After optimizing a portfolio with thermal-only resources, they developed a reference case portfolio by optimizing wind resources up to annual limits defined by NSP’s Renewable Energy Objective.15 They found that the addition of wind caused in-service dates of intermediate load resources to be pushed back, while the dates for peaking resources were pushed up. Next, NSP allowed the model to optimize wind resources subject to only a “penetration” cap of 15% of peak load. The company found that the more restrictive conditions of the REO increased the portfolio PVRR by about $95 million. Finally, they conducted scenario analysis assuming wind contributes 50% and 75% of new installed capacity under various assumptions concerning PTC renewal and externality costs. Some of more interesting conclusions are as follows: • In lock-step with PacifiCorp’s view, NSP believes that it is important to gain operating and
market experience before making any decisions to go higher than their current plan to push wind generation to 15% of annual peak load.
• Transmission availability and continuation of the PTC are critical success factors for meeting NSP’s aggressive wind development targets.
15 The Renewable Energy Objective stems from a 2001 state law requiring utilities to make a good faith effort to acquire at least one percent of retail sales from renewables, and to increase the amount by one percent each year until 10% is reached.
PacifiCorp – 2004 IRP Update Appendix C – IRP Benchmarking Study
- 78 -
• They cite a weakness of using Strategist for evaluating wind resources: it can’t evaluate dispatch costs at the hourly level, and therefore underestimates portfolio PVRR.16
Most of the IRPs cited adequate transmission resources as a limiting factor or major concern for wind development. For example, PGE stated that transmission issues were a significant factor in all wind projects proposed under their RFP. Demand Side Management Resource Modeling A minority of utilities chose to directly model DSM resources along with supply-side resources in their portfolio evaluations. Even some of the utilities that used a resource optimization model for their IRPs declined to integrate DSM programs into the optimization runs. For example, PSCo did not model DSM at all using their PROVIEW optimization model. The reasons for the decision to exclude DSM were (1) the lack of standard DSM program cost and performance data that were comparable to supply-side resources, and (2) the need to limit resource options due to optimization processing time. In lieu of DSM resource modeling, PSCo intended to evaluate DSM as part of the solicitation process mandated by the Colorado Commission. In the case of LG&E Energy, the Company conducted a manual portfolio building process somewhat similar to PacifiCorp’s; supply-side resources were deferred and DSM programs added to determine if PVRR was reduced. If the DSM program reduced PVRR, it was then included in the preferred resource plan. The rationale for this approach was that the principal benefit of DSM is to delay supply-side expansion and “not reorder it”. For utilities that directly evaluated supply- and demand-side options in their resource optimization models, the typical approach was to pre-screen DSM programs for cost-effectiveness, and then include the program winners into integrated supply- and demand-side optimization runs. For example, Southern Company built an optimal “benchmark” supply-side resource plan for the combined operating companies using the PROVIEW optimization model, and then added pre-screened DSM resources for final optimization runs. Disclosure of IRP Information A number of IRPs that were made publicly available had some information withheld (redacted). For example, three of the eight IRPs included for the detailed analysis had data redacted from the public version of their IRPs. For PacifiCorp’s entire inventory of 23 IRPs, 7 (or almost one-third) had data redacted. Although fuel prices and technology cost assumptions were the most frequently withheld, a few companies, such as SCE and Southern Company Services, withheld nearly all numerical assumptions and inputs, as well as the preferred portfolios themselves. Load Forecasting A number of utilities determined optimal portfolios for differing load growth assumptions. (In contrast, PacifiCorp does not currently model the influence of load forecast variations on resource selection). For example, LG&E Energy stated that the type, timing, and size of resources are significantly influenced by the load forecast. Consequently, they use base, low, and high load forecast sensitivities in capacity expansion model runs. Resource Flexibility
16 The implication is that an hourly dispatch model is needed to more accurately estimate the costs impacts of wind on a resource portfolio.
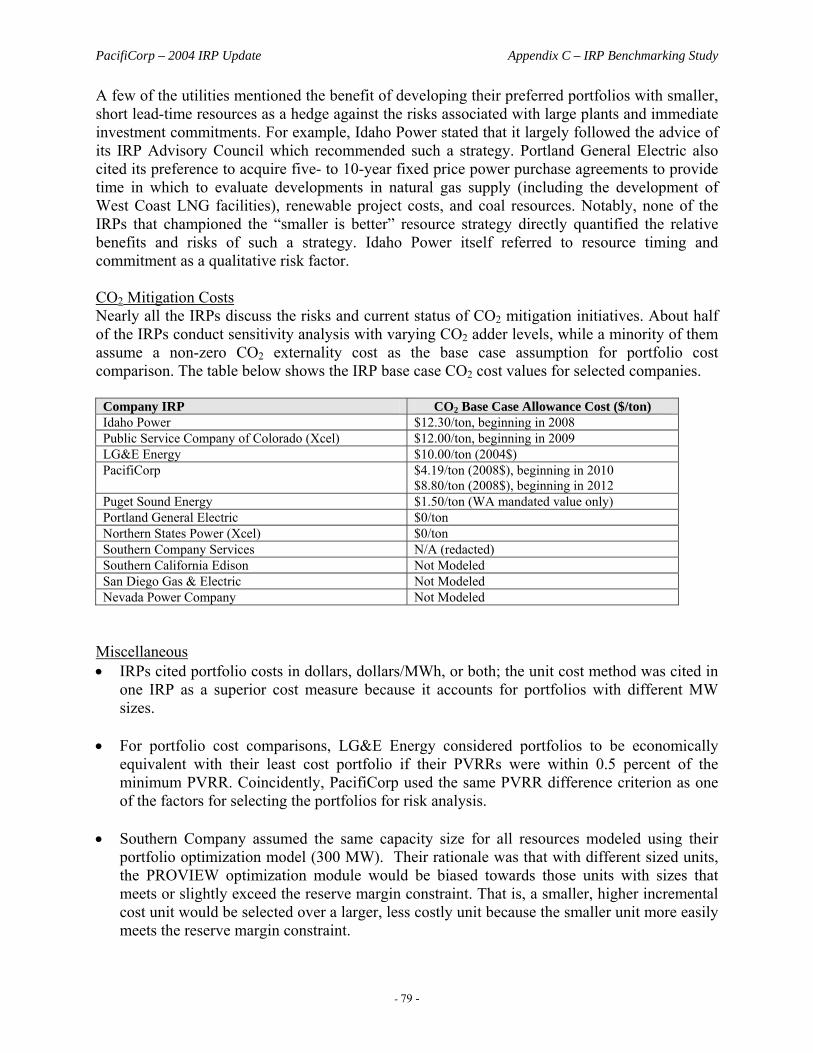
PacifiCorp – 2004 IRP Update Appendix C – IRP Benchmarking Study
- 79 -
A few of the utilities mentioned the benefit of developing their preferred portfolios with smaller, short lead-time resources as a hedge against the risks associated with large plants and immediate investment commitments. For example, Idaho Power stated that it largely followed the advice of its IRP Advisory Council which recommended such a strategy. Portland General Electric also cited its preference to acquire five- to 10-year fixed price power purchase agreements to provide time in which to evaluate developments in natural gas supply (including the development of West Coast LNG facilities), renewable project costs, and coal resources. Notably, none of the IRPs that championed the “smaller is better” resource strategy directly quantified the relative benefits and risks of such a strategy. Idaho Power itself referred to resource timing and commitment as a qualitative risk factor. CO2 Mitigation Costs Nearly all the IRPs discuss the risks and current status of CO2 mitigation initiatives. About half of the IRPs conduct sensitivity analysis with varying CO2 adder levels, while a minority of them assume a non-zero CO2 externality cost as the base case assumption for portfolio cost comparison. The table below shows the IRP base case CO2 cost values for selected companies.
Company IRP CO2 Base Case Allowance Cost ($/ton) Idaho Power $12.30/ton, beginning in 2008 Public Service Company of Colorado (Xcel) $12.00/ton, beginning in 2009 LG&E Energy $10.00/ton (2004$) PacifiCorp $4.19/ton (2008$), beginning in 2010
$8.80/ton (2008$), beginning in 2012 Puget Sound Energy $1.50/ton (WA mandated value only) Portland General Electric $0/ton Northern States Power (Xcel) $0/ton Southern Company Services N/A (redacted) Southern California Edison Not Modeled San Diego Gas & Electric Not Modeled Nevada Power Company Not Modeled
Miscellaneous • IRPs cited portfolio costs in dollars, dollars/MWh, or both; the unit cost method was cited in
one IRP as a superior cost measure because it accounts for portfolios with different MW sizes.
• For portfolio cost comparisons, LG&E Energy considered portfolios to be economically
equivalent with their least cost portfolio if their PVRRs were within 0.5 percent of the minimum PVRR. Coincidently, PacifiCorp used the same PVRR difference criterion as one of the factors for selecting the portfolios for risk analysis.
• Southern Company assumed the same capacity size for all resources modeled using their
portfolio optimization model (300 MW). Their rationale was that with different sized units, the PROVIEW optimization module would be biased towards those units with sizes that meets or slightly exceed the reserve margin constraint. That is, a smaller, higher incremental cost unit would be selected over a larger, less costly unit because the smaller unit more easily meets the reserve margin constraint.
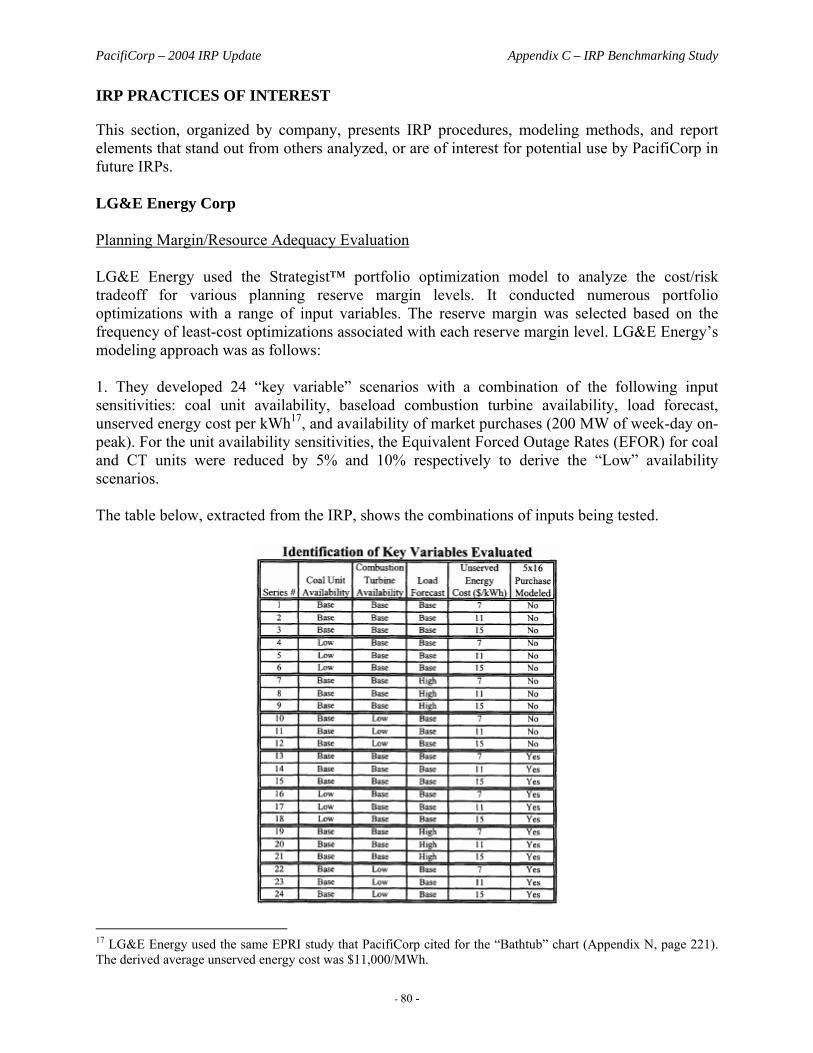
PacifiCorp – 2004 IRP Update Appendix C – IRP Benchmarking Study
- 80 -
IRP PRACTICES OF INTEREST
This section, organized by company, presents IRP procedures, modeling methods, and report elements that stand out from others analyzed, or are of interest for potential use by PacifiCorp in future IRPs. LG&E Energy Corp Planning Margin/Resource Adequacy Evaluation LG&E Energy used the Strategist™ portfolio optimization model to analyze the cost/risk tradeoff for various planning reserve margin levels. It conducted numerous portfolio optimizations with a range of input variables. The reserve margin was selected based on the frequency of least-cost optimizations associated with each reserve margin level. LG&E Energy’s modeling approach was as follows: 1. They developed 24 “key variable” scenarios with a combination of the following input sensitivities: coal unit availability, baseload combustion turbine availability, load forecast, unserved energy cost per kWh17, and availability of market purchases (200 MW of week-day on-peak). For the unit availability sensitivities, the Equivalent Forced Outage Rates (EFOR) for coal and CT units were reduced by 5% and 10% respectively to derive the “Low” availability scenarios. The table below, extracted from the IRP, shows the combinations of inputs being tested.
17 LG&E Energy used the same EPRI study that PacifiCorp cited for the “Bathtub” chart (Appendix N, page 221). The derived average unserved energy cost was $11,000/MWh.
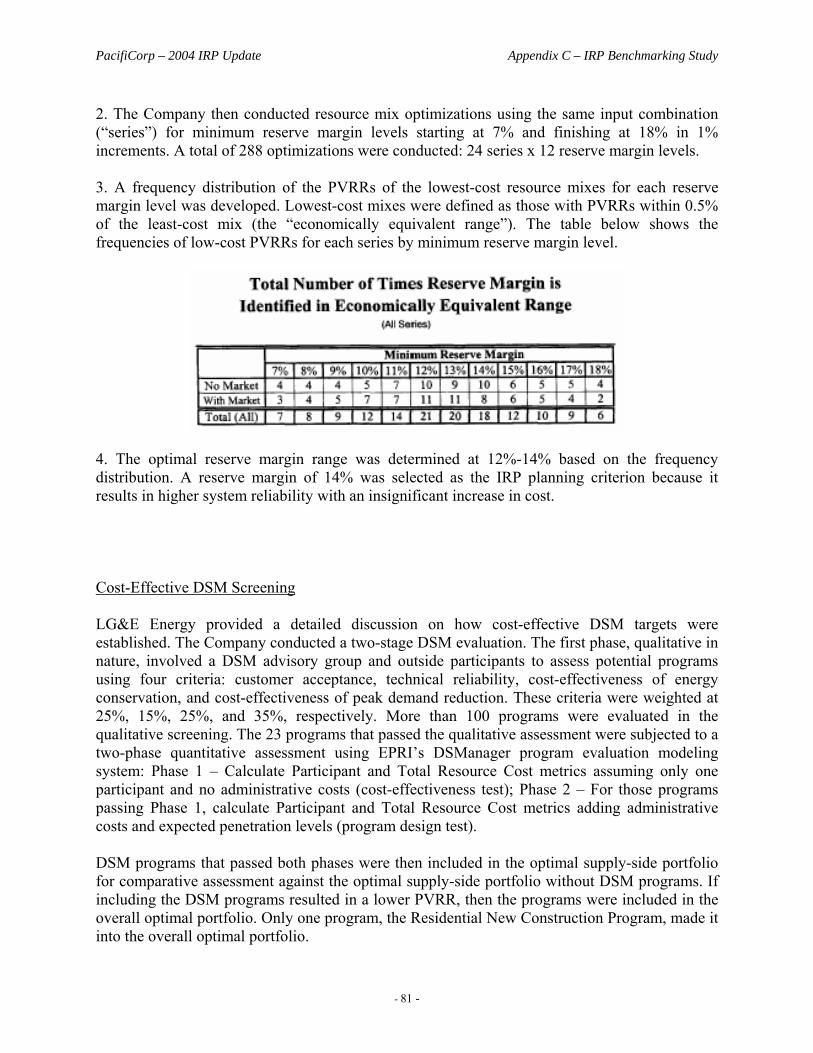
PacifiCorp – 2004 IRP Update Appendix C – IRP Benchmarking Study
- 81 -
2. The Company then conducted resource mix optimizations using the same input combination (“series”) for minimum reserve margin levels starting at 7% and finishing at 18% in 1% increments. A total of 288 optimizations were conducted: 24 series x 12 reserve margin levels. 3. A frequency distribution of the PVRRs of the lowest-cost resource mixes for each reserve margin level was developed. Lowest-cost mixes were defined as those with PVRRs within 0.5% of the least-cost mix (the “economically equivalent range”). The table below shows the frequencies of low-cost PVRRs for each series by minimum reserve margin level.
4. The optimal reserve margin range was determined at 12%-14% based on the frequency distribution. A reserve margin of 14% was selected as the IRP planning criterion because it results in higher system reliability with an insignificant increase in cost. Cost-Effective DSM Screening LG&E Energy provided a detailed discussion on how cost-effective DSM targets were established. The Company conducted a two-stage DSM evaluation. The first phase, qualitative in nature, involved a DSM advisory group and outside participants to assess potential programs using four criteria: customer acceptance, technical reliability, cost-effectiveness of energy conservation, and cost-effectiveness of peak demand reduction. These criteria were weighted at 25%, 15%, 25%, and 35%, respectively. More than 100 programs were evaluated in the qualitative screening. The 23 programs that passed the qualitative assessment were subjected to a two-phase quantitative assessment using EPRI’s DSManager program evaluation modeling system: Phase 1 – Calculate Participant and Total Resource Cost metrics assuming only one participant and no administrative costs (cost-effectiveness test); Phase 2 – For those programs passing Phase 1, calculate Participant and Total Resource Cost metrics adding administrative costs and expected penetration levels (program design test). DSM programs that passed both phases were then included in the optimal supply-side portfolio for comparative assessment against the optimal supply-side portfolio without DSM programs. If including the DSM programs resulted in a lower PVRR, then the programs were included in the overall optimal portfolio. Only one program, the Residential New Construction Program, made it into the overall optimal portfolio.

PacifiCorp – 2004 IRP Update Appendix C – IRP Benchmarking Study
- 82 -
Southern Company Ratepayer Impact Analysis Southern Company performed a portfolio sensitivity analysis with the goal of selecting resource options that minimize rates. This is accomplished by adding capacity that lowers rates using declining revenue requirements for the first year it is added. This case was simulated by doing a year-by-year analysis that committed to a capacity addition decision each year rather than optimizing over the entire study period horizon. Although specifics on methodology and results are not provided, they indicate that the resulting resource mix has more SCCTs and less CCCTs than their reference case. Resource Selection Sensitivity Analysis Southern Company Services conducted the widest variety of sensitivity (“scenario”) analyses among the companies included in the detailed IRP evaluation. The following is a complete inventory of sensitivity study types performed. • Load growth (high, low, none relative to reference level) • Speculative "third-party" CCCT capacity added in a given year • Unit availability (increase, decrease relative to reference level) • Five-year unit retirement date extension • Gas/oil prices (high, low relative to reference level) • Low fuel prices (low coal, gas, and oil prices) • Higher cost of capital • Combined cycle installed cost (lower, higher relative to reference) • Additional economy peak power purchases • Future SO2/NOX/mercury environmental compliance • CO2/ton adder • Future environmental compliance with nuclear option • Rate impact minimization • CCCT-only through 2012; all-resource optimization thereafter • SCCT-only through 2012; all-resource optimization thereafter • Reduce installed coal unit cost to point where coal is competitive • Increase gas price to point where coal is competitive • Oil/gas generation limit • All F-Type CCCTs (to show impact of transition to H-type) • Reduce transmission capacity to outside control areas • Reduce/increase Active Demand Response capacity level by one-half These sensitivity runs were prepared to examine the robustness of the base Southern Company system resource plan. They also appear to have been used by the operating companies in risk/uncertainty analysis of their individual IRPs. Southern Company did not provide specifics on how these sensitivity runs were used in the decision process. Puget Sound Energy
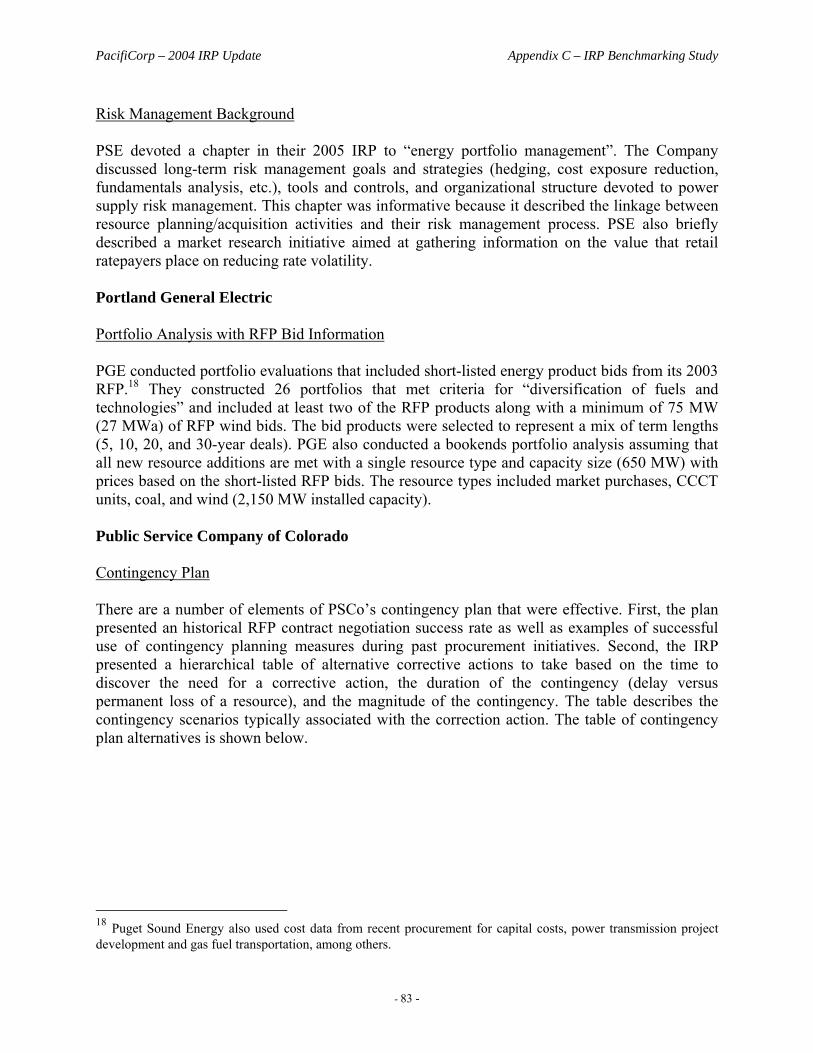
PacifiCorp – 2004 IRP Update Appendix C – IRP Benchmarking Study
- 83 -
Risk Management Background PSE devoted a chapter in their 2005 IRP to “energy portfolio management”. The Company discussed long-term risk management goals and strategies (hedging, cost exposure reduction, fundamentals analysis, etc.), tools and controls, and organizational structure devoted to power supply risk management. This chapter was informative because it described the linkage between resource planning/acquisition activities and their risk management process. PSE also briefly described a market research initiative aimed at gathering information on the value that retail ratepayers place on reducing rate volatility. Portland General Electric Portfolio Analysis with RFP Bid Information PGE conducted portfolio evaluations that included short-listed energy product bids from its 2003 RFP.18 They constructed 26 portfolios that met criteria for “diversification of fuels and technologies” and included at least two of the RFP products along with a minimum of 75 MW (27 MWa) of RFP wind bids. The bid products were selected to represent a mix of term lengths (5, 10, 20, and 30-year deals). PGE also conducted a bookends portfolio analysis assuming that all new resource additions are met with a single resource type and capacity size (650 MW) with prices based on the short-listed RFP bids. The resource types included market purchases, CCCT units, coal, and wind (2,150 MW installed capacity). Public Service Company of Colorado Contingency Plan There are a number of elements of PSCo’s contingency plan that were effective. First, the plan presented an historical RFP contract negotiation success rate as well as examples of successful use of contingency planning measures during past procurement initiatives. Second, the IRP presented a hierarchical table of alternative corrective actions to take based on the time to discover the need for a corrective action, the duration of the contingency (delay versus permanent loss of a resource), and the magnitude of the contingency. The table describes the contingency scenarios typically associated with the correction action. The table of contingency plan alternatives is shown below.
18 Puget Sound Energy also used cost data from recent procurement for capital costs, power transmission project development and gas fuel transportation, among others.
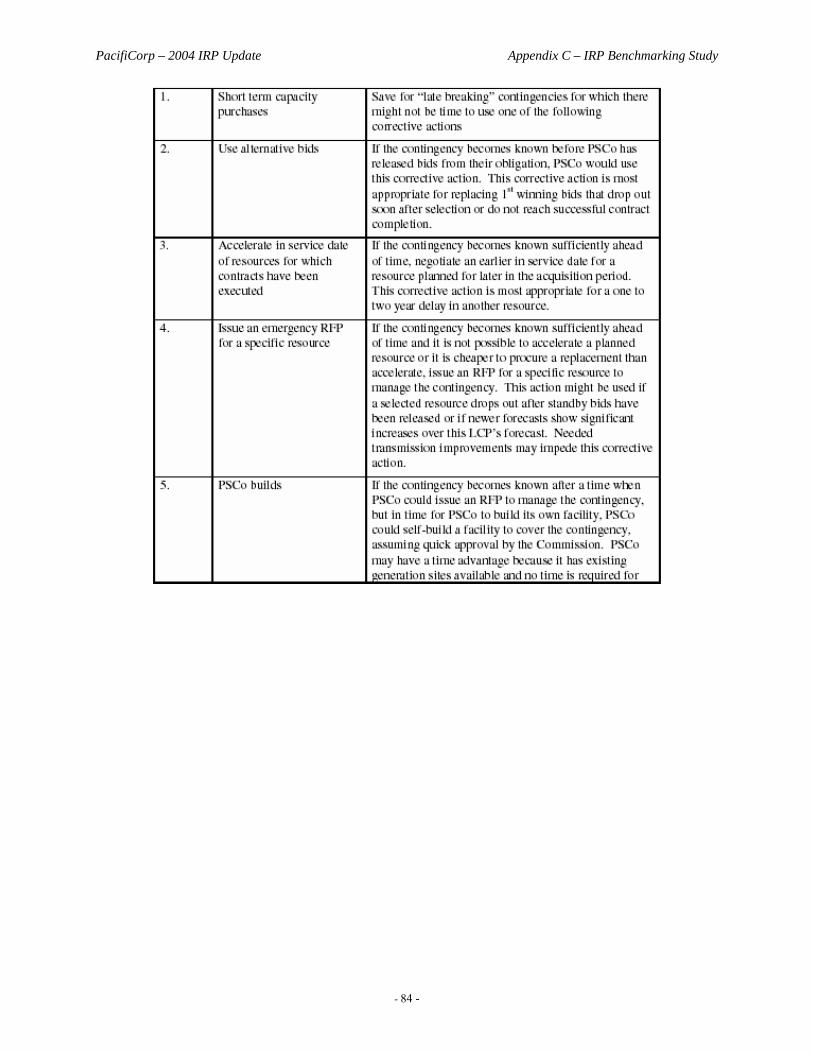
PacifiCorp – 2004 IRP Update Appendix C – IRP Benchmarking Study
- 84 -
PacifiCorp – 2004 IRP Update Appendix C – IRP Benchmarking Study
- 85 -
Northern States Power Company (Xcel) Wind Integration Cost Study NSP discusses the results of a consultant’s 2004 wind integration study that was mandated by the Minnesota legislature. This study was one of the most recent available from the IRP’s examined19, and represents an extensive application of both statistical and simulation methodologies. The study’s objective was to quantify integration costs and reliability impacts of 1,500 MW of additional wind in NSP’s Minnesota control area for a 2010 study year. The study looked at impacts for regulation, load following (ramping), and scheduling/unit commitment. The consultant, EnerNex Corporation, used time series statistical analysis of system load and wind unit output data (two-week interval at 4-second granularity) to derive forecasted incremental reserve requirements and costs. For scheduling and unit commitment impacts, hourly load and generation data over a two-year period was used. 19 PSE also included the results of a recent wind integration study in their 2005 IRP. This study was conducted by Golden Energy Services.

PacifiCorp – 2004 IRP Update Appendix C – IRP Benchmarking Study
- 86 -
Main findings include the following: • The total integration cost was estimated at $4.60/MWh with a mean absolute error of 15% or
less. • The cost of acquiring reserve capacity to support regulation was $0.23/MWh. • Due to load variability exceeding wind variability, the cost for load following was judged as
negligible. • The scheduling and unit commitment cost was estimated at $4.37/MWh. • The Effective Load Carrying Capability was estimated at 26% (400 MW against 1,500 MW
total installed capacity). • NSP concluded that 1,500 MW can be reliably integrated into their system, but cautions that
the study results should not be assumed to apply to non-NSP control areas. Avista Corporation Stochastic Wind Modeling For its 2005 IRP (draft version), Avista documented a new stochastic wind modeling approach. The utility gathered and analyzed hourly Northwest wind speed data from Oregon State University to develop statistical distributions for five wind sites. These distributions were then combined into a single monthly average distribution for the entire Northwest. The company used a stochastic model that accounts for serial correlation to create a variable daily wind generation pattern, and then shaped the daily generation values using the wind speed shape. The wind speed shape was based on hourly data from 1985 through 2000. Graphical Display of Portfolio Resource Mix over Time For its 2003 IRP, Avista Corporation used a radar-type chart to display the percentage portfolio resource mix over time. The figure below, from the results section of the Avista IRP (Section 7, page 44) shows the mix for three years at 10-year intervals. This display format is a compact and convenient way to display a small number of annual data snapshots.
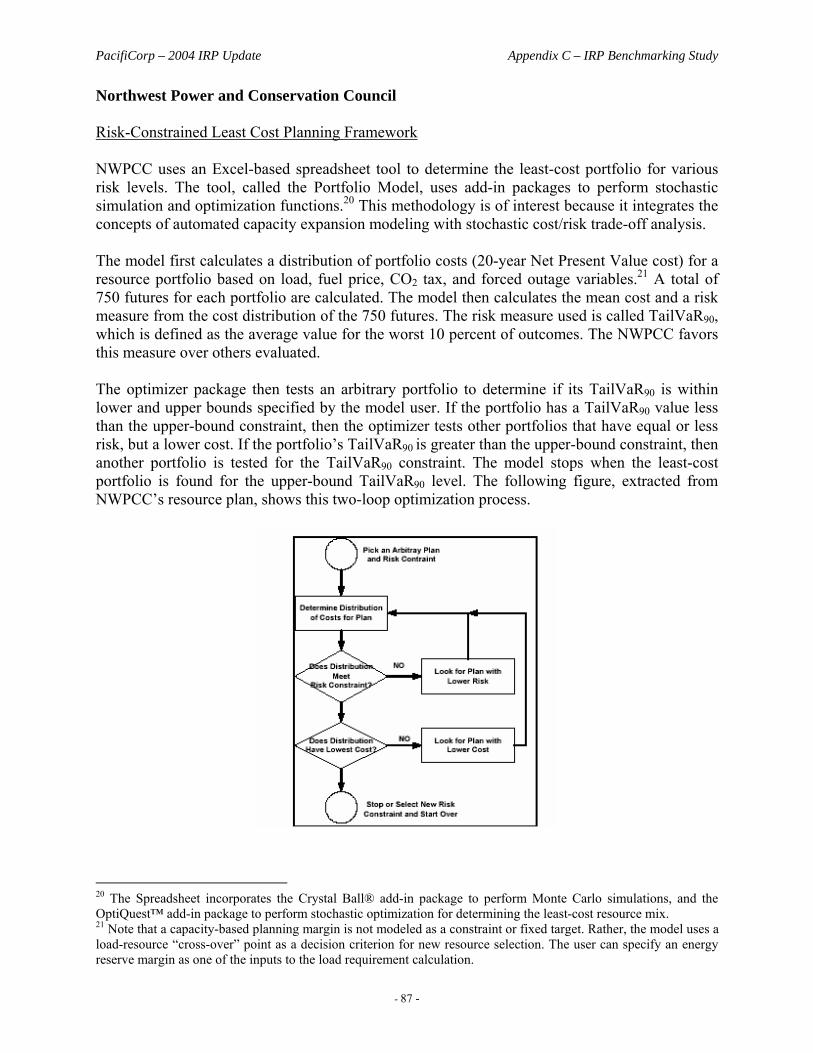
PacifiCorp – 2004 IRP Update Appendix C – IRP Benchmarking Study
- 87 -
Northwest Power and Conservation Council Risk-Constrained Least Cost Planning Framework NWPCC uses an Excel-based spreadsheet tool to determine the least-cost portfolio for various risk levels. The tool, called the Portfolio Model, uses add-in packages to perform stochastic simulation and optimization functions.20 This methodology is of interest because it integrates the concepts of automated capacity expansion modeling with stochastic cost/risk trade-off analysis. The model first calculates a distribution of portfolio costs (20-year Net Present Value cost) for a resource portfolio based on load, fuel price, CO2 tax, and forced outage variables.21 A total of 750 futures for each portfolio are calculated. The model then calculates the mean cost and a risk measure from the cost distribution of the 750 futures. The risk measure used is called TailVaR90, which is defined as the average value for the worst 10 percent of outcomes. The NWPCC favors this measure over others evaluated. The optimizer package then tests an arbitrary portfolio to determine if its TailVaR90 is within lower and upper bounds specified by the model user. If the portfolio has a TailVaR90 value less than the upper-bound constraint, then the optimizer tests other portfolios that have equal or less risk, but a lower cost. If the portfolio’s TailVaR90 is greater than the upper-bound constraint, then another portfolio is tested for the TailVaR90 constraint. The model stops when the least-cost portfolio is found for the upper-bound TailVaR90 level. The following figure, extracted from NWPCC’s resource plan, shows this two-loop optimization process.
20 The Spreadsheet incorporates the Crystal Ball® add-in package to perform Monte Carlo simulations, and the OptiQuest™ add-in package to perform stochastic optimization for determining the least-cost resource mix. 21 Note that a capacity-based planning margin is not modeled as a constraint or fixed target. Rather, the model uses a load-resource “cross-over” point as a decision criterion for new resource selection. The user can specify an energy reserve margin as one of the inputs to the load requirement calculation.
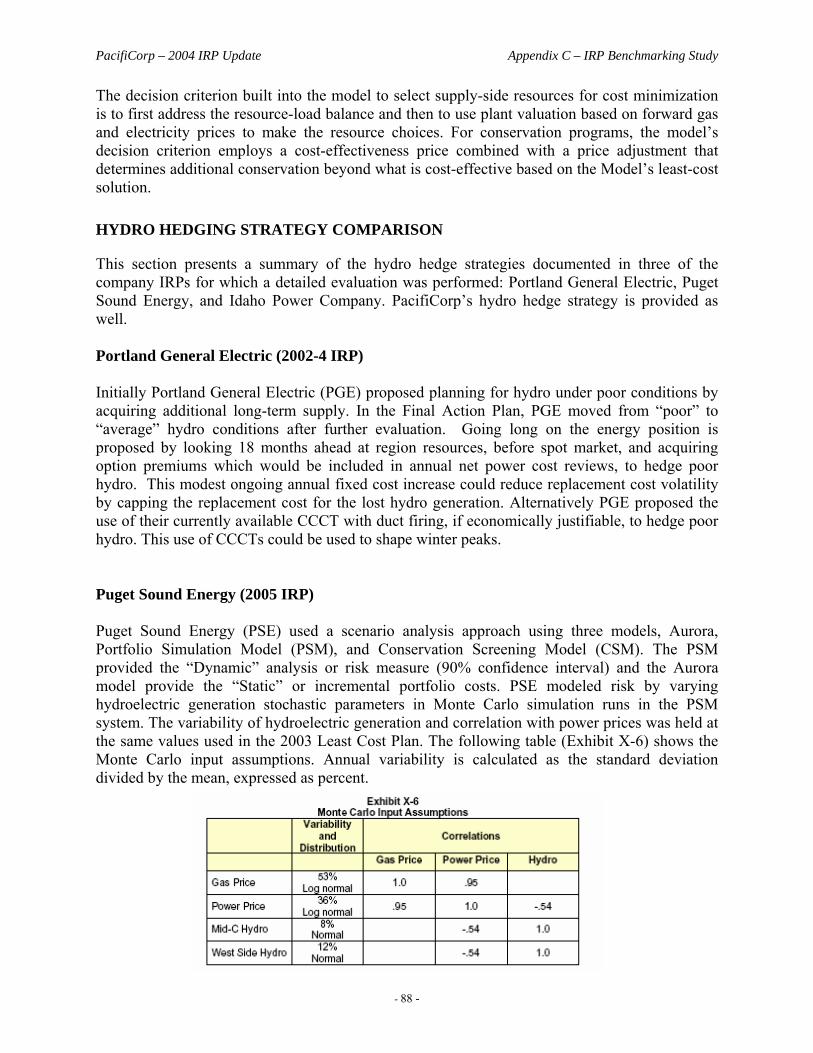
PacifiCorp – 2004 IRP Update Appendix C – IRP Benchmarking Study
- 88 -
The decision criterion built into the model to select supply-side resources for cost minimization is to first address the resource-load balance and then to use plant valuation based on forward gas and electricity prices to make the resource choices. For conservation programs, the model’s decision criterion employs a cost-effectiveness price combined with a price adjustment that determines additional conservation beyond what is cost-effective based on the Model’s least-cost solution.
HYDRO HEDGING STRATEGY COMPARISON
This section presents a summary of the hydro hedge strategies documented in three of the company IRPs for which a detailed evaluation was performed: Portland General Electric, Puget Sound Energy, and Idaho Power Company. PacifiCorp’s hydro hedge strategy is provided as well. Portland General Electric (2002-4 IRP) Initially Portland General Electric (PGE) proposed planning for hydro under poor conditions by acquiring additional long-term supply. In the Final Action Plan, PGE moved from “poor” to “average” hydro conditions after further evaluation. Going long on the energy position is proposed by looking 18 months ahead at region resources, before spot market, and acquiring option premiums which would be included in annual net power cost reviews, to hedge poor hydro. This modest ongoing annual fixed cost increase could reduce replacement cost volatility by capping the replacement cost for the lost hydro generation. Alternatively PGE proposed the use of their currently available CCCT with duct firing, if economically justifiable, to hedge poor hydro. This use of CCCTs could be used to shape winter peaks. Puget Sound Energy (2005 IRP) Puget Sound Energy (PSE) used a scenario analysis approach using three models, Aurora, Portfolio Simulation Model (PSM), and Conservation Screening Model (CSM). The PSM provided the “Dynamic” analysis or risk measure (90% confidence interval) and the Aurora model provide the “Static” or incremental portfolio costs. PSE modeled risk by varying hydroelectric generation stochastic parameters in Monte Carlo simulation runs in the PSM system. The variability of hydroelectric generation and correlation with power prices was held at the same values used in the 2003 Least Cost Plan. The following table (Exhibit X-6) shows the Monte Carlo input assumptions. Annual variability is calculated as the standard deviation divided by the mean, expressed as percent.
PacifiCorp – 2004 IRP Update Appendix C – IRP Benchmarking Study
- 89 -
Idaho Power Company (2004 IRP) Idaho Power models hydroelectric generation as a stochastic parameter in Monte Carlo simulation runs of the Aurora modeling system. They use scenario analysis to understand the effects of water and load (both peak and energy) on energy resources. The scenarios included: 70% water/70% Load (main scenario), 90%/70%, and with additional one at 50%/50%. The scenarios used were due to the public input to the planning process Idaho Power Company developed a resource plan based upon a lower-than-median level of water. Beginning with the 2002 resource plan, Idaho Power Company began using the 70th percentile water conditions and load conditions for resource planning. The 2004 Integrated Resource Plan is the second resource plan wherein Idaho Power Company is using the 70th percentile water and load conditions. Idaho Power does not assume any reductions of capacity or operational flexibility for relicensing of any plants. Nor does it associate any future costs of licensing in their 2004 IRP. They will have better information for the 2006 IRP concerning relicensing impacts. The 2004 IRP hydro data is based on a 1992 hydrological record of the Idaho Department of Water Resources (IDWR) which Idaho Power Company believes to be overstated. The overstatement is due to the increased water use and lower spring fed contributions to the system. IDWR is in the process of updating the computed hydrologic record. PacifiCorp (2004 IRP) PacifiCorp models hydroelectric generation as a stochastic parameter in Monte Carlo simulation runs of the MARKETSYM/PROSYM modeling system. Hydroelectric generation risk parameters were taken from Global Energy Decisions (Henwood), based on the work they performed for the Planning Margin study. The risk parameters were estimated to simulate hydro distribution patterns developed by PacifiCorp. The distributions were based on PacifiCorp’s belief as to all possible outcomes of hydro events. These distributions were developed from hydroelectric generation forecasts for its owned and contracted units under varying levels of precipitation. PacifiCorp layered on top of that the probability of occurrence of each level of precipitation and developed data on weekly hydroelectric generation for the Western area under various levels of exceedence. (See the figure below.)

PacifiCorp – 2004 IRP Update Appendix C – IRP Benchmarking Study
- 90 -
PacifiCorp West Hydroelectric Generation by Percent Exceedence
0
50
100
150
200
250
300
350
400
450
500
550
600
650
700
750
800
1/3/
2005
1/17
/200
5
1/31
/200
5
2/14
/200
5
2/28
/200
5
3/14
/200
5
3/28
/200
5
4/11
/200
5
4/25
/200
5
5/9/
2005
5/23
/200
5
6/6/
2005
6/20
/200
5
7/4/
2005
7/18
/200
5
8/1/
2005
8/15
/200
5
8/29
/200
5
9/12
/200
5
9/26
/200
5
10/1
0/20
05
10/2
4/20
05
11/7
/200
5
11/2
1/20
05
12/5
/200
5
12/1
9/20
05
Date
GW
h
CONCLUSIONS
The analysis indicates that PacifiCorp’s IRP could serve as a standard for IRP reporting based on the sample of publicly available IRPs included in the study. This conclusion is bolstered by the response to the quality assessment question on PacifiCorp’s Stakeholder Satisfaction Survey, where 60% of respondents ranked the PacifiCorp IRP “very favorably” with respect to other IRPs. Areas in which the PacifiCorp IRP excelled include the following: • Level of detail on model inputs: PacifiCorp was one of a handful of utilities that broadly
documented their modeling inputs, and went far beyond what was required by state resource planning requirements. While some provided as much detail for certain modeling areas, none matched PacifiCorp’s overall coverage. Areas in which PacifiCorp excelled included supply-side resource cost/performance attributes, transmission resource costs, stochastic parameters, and emission allowance costs.
• Application of stochastic analysis: While a few other utilities performed stochastic analysis,
PacifiCorp applied the greatest number of stochastic portfolio performance measures, and is the only one that provided an extensive discussion of stochastic modeling methodology and results. PacifiCorp’s IRP also did a superior job describing how those results were integrated into the overall portfolio evaluation process.
• Cost vs. Risk Tradeoffs: PacifiCorp is only one of two utilities that explicitly used and
documented a cost vs. risk tradeoff analysis for resource selection and portfolio decision making. The other was Avista for their 2005 IRP. NWPCC is the one non-utility organization that did so as well.
PacifiCorp – 2004 IRP Update Appendix C – IRP Benchmarking Study
- 91 -
• Discussion on the portfolio selection decision-making process: The IRPs in general focused
on presenting numerical modeling results; few did a good job of documenting the decision trail that led to a preferred portfolio. For example, as part of risk and assumption sensitivity analysis, utilities presented the results of scenario model runs that determine the cost impact of alternative load, price, and environmental cost forecasts. However, only a handful of utilities, including PacifiCorp, discussed how these results actually factored into resource selection decisions.
The analysis did not reveal any substantial weaknesses of PacifiCorp’s IRP with respect to the others. Other utilities provided more background on certain subjects than PacifiCorp, such as transmission planning, risk management, environmental policy and impacts, contract details, technology screening, alternative technology descriptions (particularly renewables), financing considerations, and profiles of existing generating units and DSM programs. Other general observations from the IRP analysis include the following: • There was no dominant modeling technology used by the utilities. Detailed production cost
simulation tools (along with manual portfolio development) and portfolio optimization tools were used about equally.
• In many cases, non-modeling or “qualitative” factors played a key role in determining IRP
preferred resource plans. Overall, the utilities did not provide a correspondingly detailed picture of how the non-modeling factors impacted the planning outcomes.
• Along with costs and risk considerations, many utilities used portfolio robustness22 and/or
resource diversification as broad guidelines for portfolio resource selection.
22 As discussed earlier in this study, robustness refers to consistently favorable portfolio cost performance under different planning assumptions and futures.