© 2002 collier research corp. -...
TRANSCRIPT

HyperSizer May 2002Analysis Verifications
Collier Research Corporation
© 2002 Collier Research Corp.

Pretest Prediction to Uniform Compression Load – Grid Stiffened Panel Structural Certification
HyperSizer Grid Stiffened Panel Test
Pretest Prediction to Uniform Compression Load – Grid Stiffened Panel Structural Certification
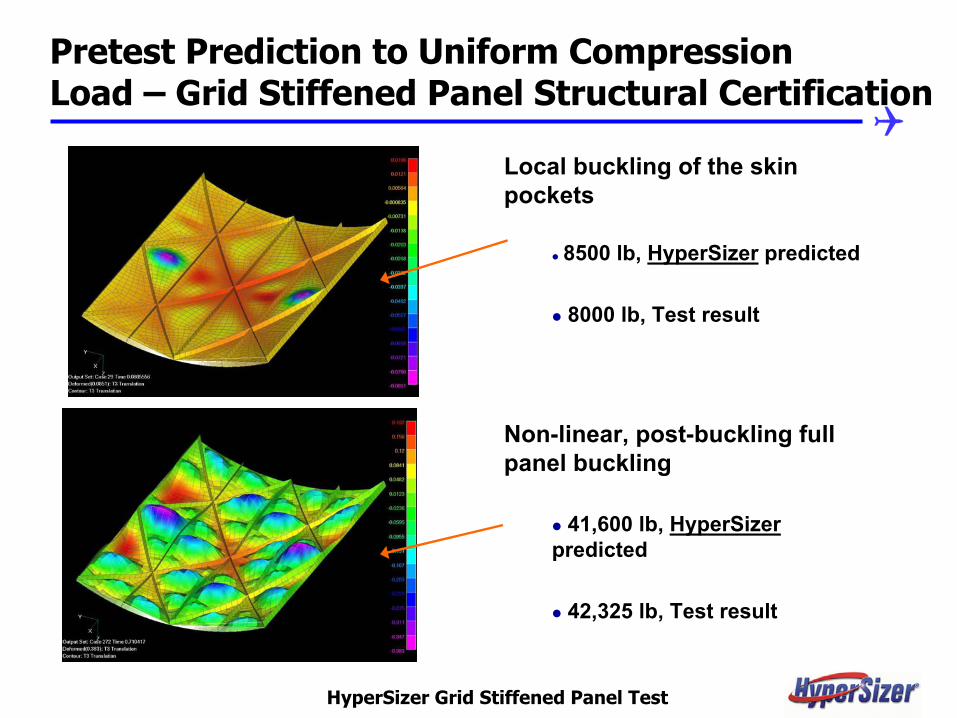
Local buckling of the skin pockets
8500 lb, HyperSizer predicted
8000 lb, Test result
Non-linear, post-buckling full panel buckling
41,600 lb, HyperSizerpredicted
42,325 lb, Test result
HyperSizer Grid Stiffened Panel Test
Pretest Prediction to Uniform Compression Load – Grid Stiffened Panel Structural Certification
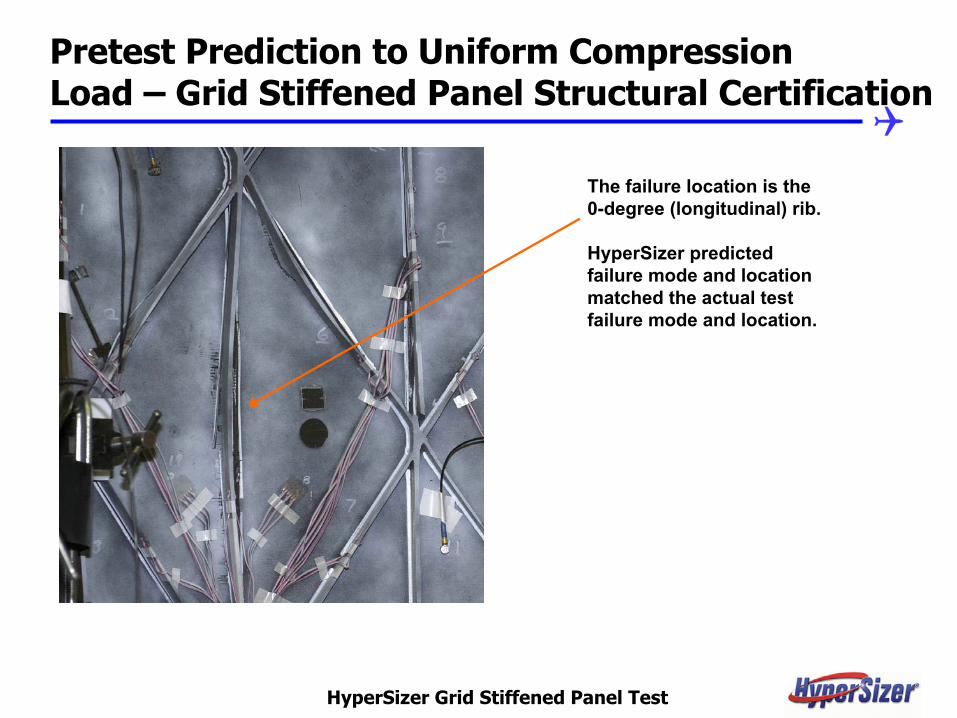
The failure location is the 0-degree (longitudinal) rib.
HyperSizer predicted failure mode and location matched the actual test failure mode and location.
HyperSizer Grid Stiffened Panel Test

Pretest Prediction to Uniform Compression Load – Hat Stiffened Panel Structural Certification
RLV HyperSizer Customers
Analyze and optimize structural area in detail
Reusable Launch Vehicle (RLV) Intertank- Failure Load Prediction for a Test Article
Nx
X (longitudinal)
Y (transverse)
Z
J stiffeners
Hat stiffeners
Back support wall
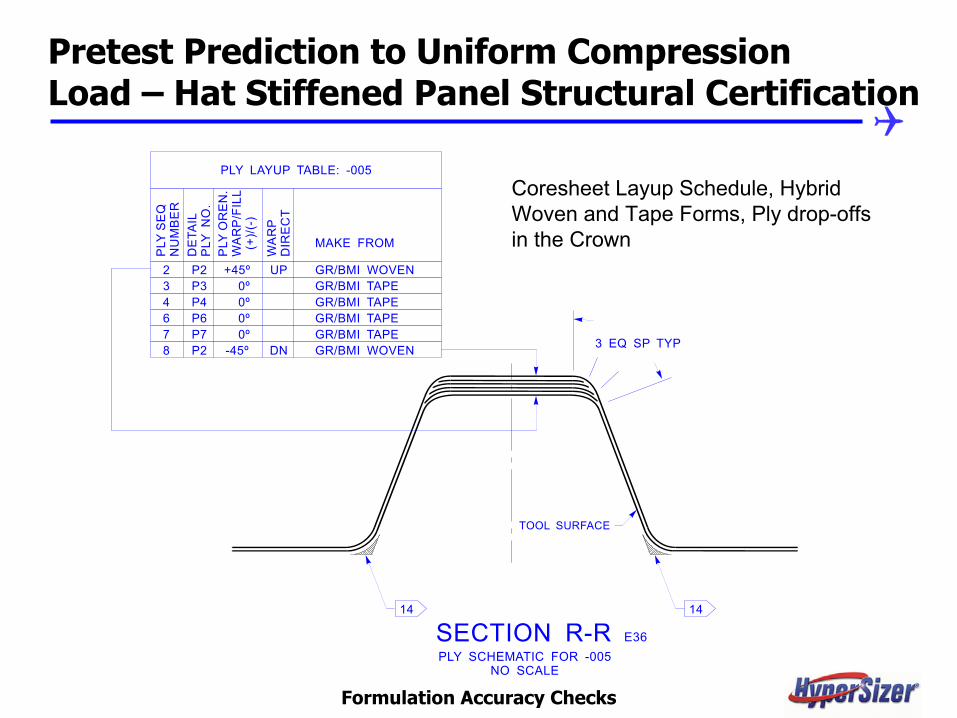
Coresheet Layup Schedule, Hybrid Woven and Tape Forms, Ply drop-offs in the Crown
Formulation Accuracy ChecksIndex Top
PLY SCHEMATIC FOR -005NO SCALE
E36SECTION R-R
2 P2 +45º UP GR/BMI WOVEN
MAKE FROM
PLY LAYUP TABLE: -005P
LY S
EQ
NU
MB
ER
DE
TAIL
P
LY N
O.
WA
RP
DIR
EC
T
PLY
OR
EN
.W
AR
P/F
ILL
(+)
/(-)
3 P3 0º GR/BMI TAPE4 P4 0º GR/BMI TAPE6 P6 0º GR/BMI TAPE7 P7 0º GR/BMI TAPE8 P2 -45º DN GR/BMI WOVEN 3 EQ SP TYP
1414
TOOL SURFACE
Pretest Prediction to Uniform Compression Load – Hat Stiffened Panel Structural Certification

Correlation Strain Gage Test Results (Facesheet)
RLV HyperSizer CustomersIndex Top
10080604020Design Limit Load %
0
400
800
1200
2000
1600
Mic
rost
rain
Strain gage location
Test average
HyperSizerReference [1]
1920 (1.0)1896 (0.988)1860 (0.969)
Pretest Prediction to Uniform Compression Load – Hat Stiffened Panel Structural Certification
Local Buckling Load Comparison Between Analyses and an Experimental Test
Failure Analyses VerificationsIndex Top
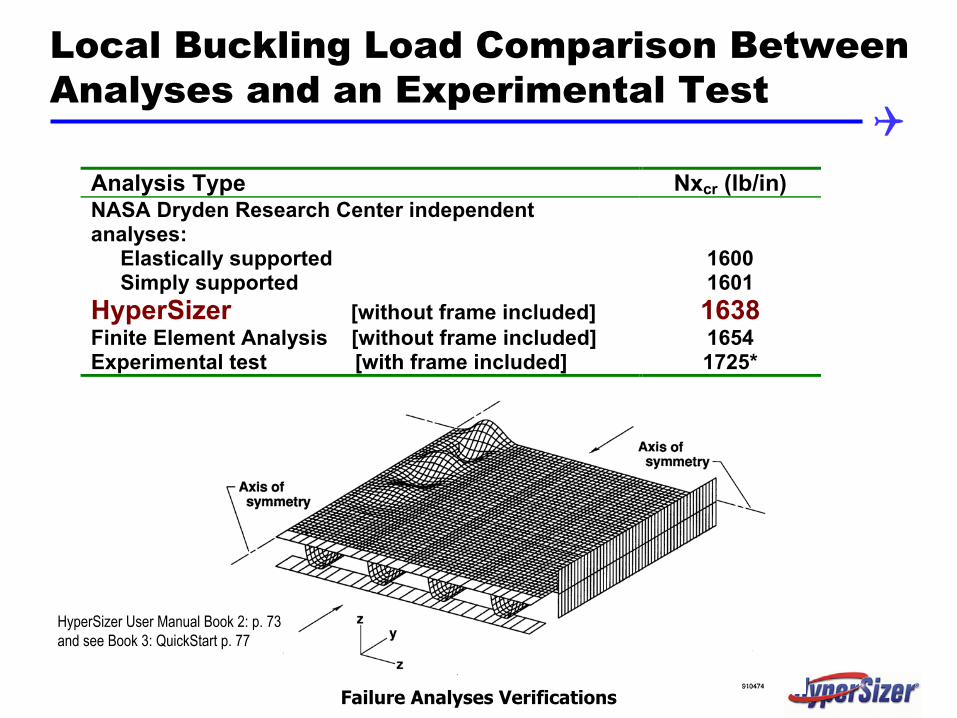
Analysis Type Nxcr (lb/in)NASA Dryden Research Center independentanalyses: Elastically supported 1600 Simply supported 1601HyperSizer [without frame included] 1638Finite Element Analysis [without frame included] 1654Experimental test [with frame included] 1725*
HyperSizer User Manual Book 2: p. 73 and see Book 3: QuickStart p. 77
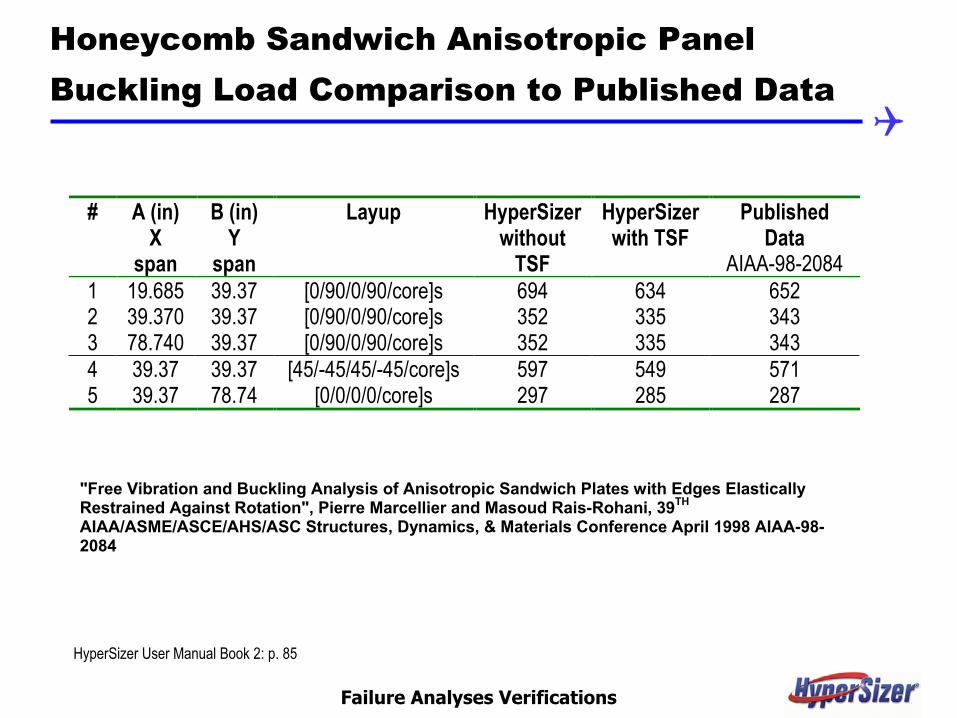
Honeycomb Sandwich Anisotropic Panel Buckling Load Comparison to Published Data
Failure Analyses VerificationsIndex Top
# A (in)X
span
B (in)Y
span
Layup HyperSizerwithout
TSF
HyperSizerwith TSF
PublishedData
AIAA-98-20841 19.685 39.37 [0/90/0/90/core]s 694 634 6522 39.370 39.37 [0/90/0/90/core]s 352 335 3433 78.740 39.37 [0/90/0/90/core]s 352 335 3434 39.37 39.37 [45/-45/45/-45/core]s 597 549 5715 39.37 78.74 [0/0/0/0/core]s 297 285 287
"Free Vibration and Buckling Analysis of Anisotropic Sandwich Plates with Edges ElasticallyRestrained Against Rotation", Pierre Marcellier and Masoud Rais-Rohani, 39TH
AIAA/ASME/ASCE/AHS/ASC Structures, Dynamics, & Materials Conference April 1998 AIAA-98-2084
HyperSizer User Manual Book 2: p. 85
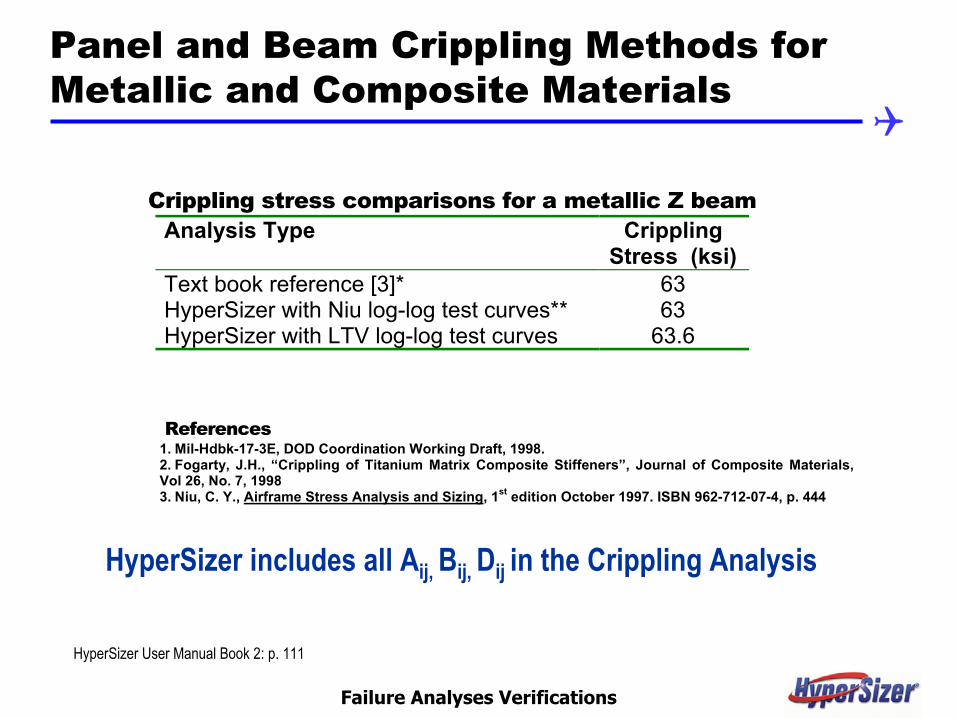
Panel and Beam Crippling Methods for Metallic and Composite Materials
Failure Analyses VerificationsIndex Top
Crippling stress comparisons for a metallic Z beamAnalysis Type Crippling
Stress (ksi)Text book reference [3]* 63HyperSizer with Niu log-log test curves** 63HyperSizer with LTV log-log test curves 63.6
References1. Mil-Hdbk-17-3E, DOD Coordination Working Draft, 1998.2. Fogarty, J.H., “Crippling of Titanium Matrix Composite Stiffeners”, Journal of Composite Materials,Vol 26, No. 7, 19983. Niu, C. Y., Airframe Stress Analysis and Sizing, 1st edition October 1997. ISBN 962-712-07-4, p. 444
HyperSizer includes all Aij, Bij, Dij in the Crippling Analysis
HyperSizer User Manual Book 2: p. 111

Correlation to Hexcel Methods for Honeycomb Sandwich
Failure Analyses VerificationsIndex Top
Analysis Type Benchmark Data HyperSizerBeam buckling* 0.52 0.52Beam buckling, transverse shearflexibility
0.51 0.51
Facesheet yielding stress 10.5 10.5Facesheet wrinkling 45.8 45.8Facesheet dimpling 30.0 30.0Core shear strength 12.1 11.6**Core crushing NA 29.0Core shear crimping 254 254
* HyperSizer analysis performed beam buckling with panel methods
** different correction factor used
HyperSizer User Manual Book 2: p. 79
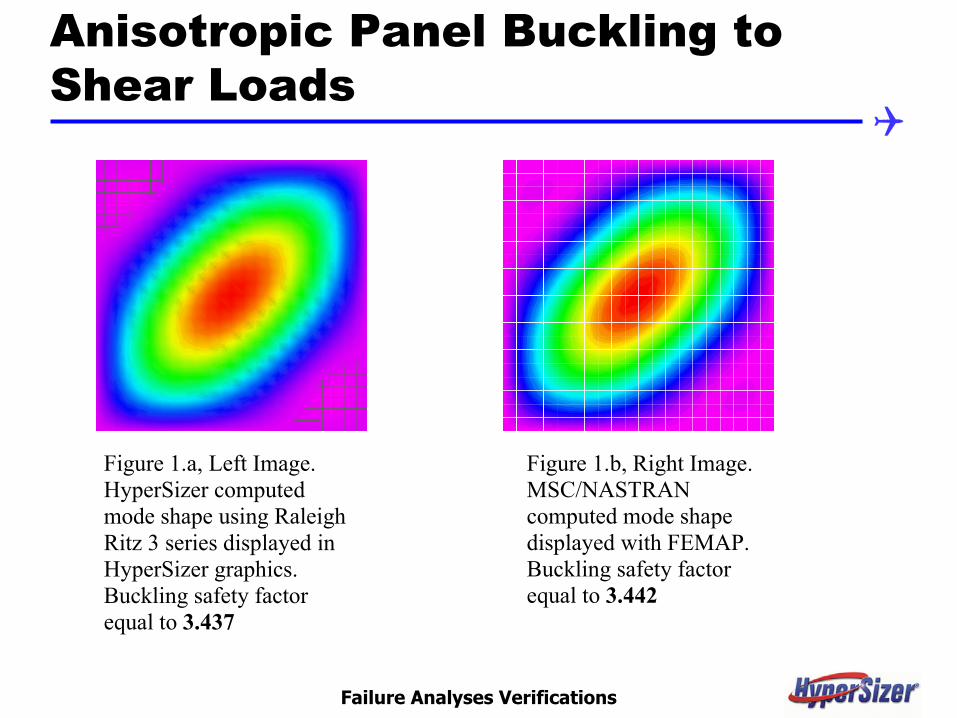
Anisotropic Panel Buckling to Shear Loads
Failure Analyses VerificationsIndex Top
Figure 1.b, Right Image.MSC/NASTRANcomputed mode shapedisplayed with FEMAP.Buckling safety factorequal to 3.442
Figure 1.a, Left Image.HyperSizer computedmode shape using RaleighRitz 3 series displayed inHyperSizer graphics.Buckling safety factorequal to 3.437
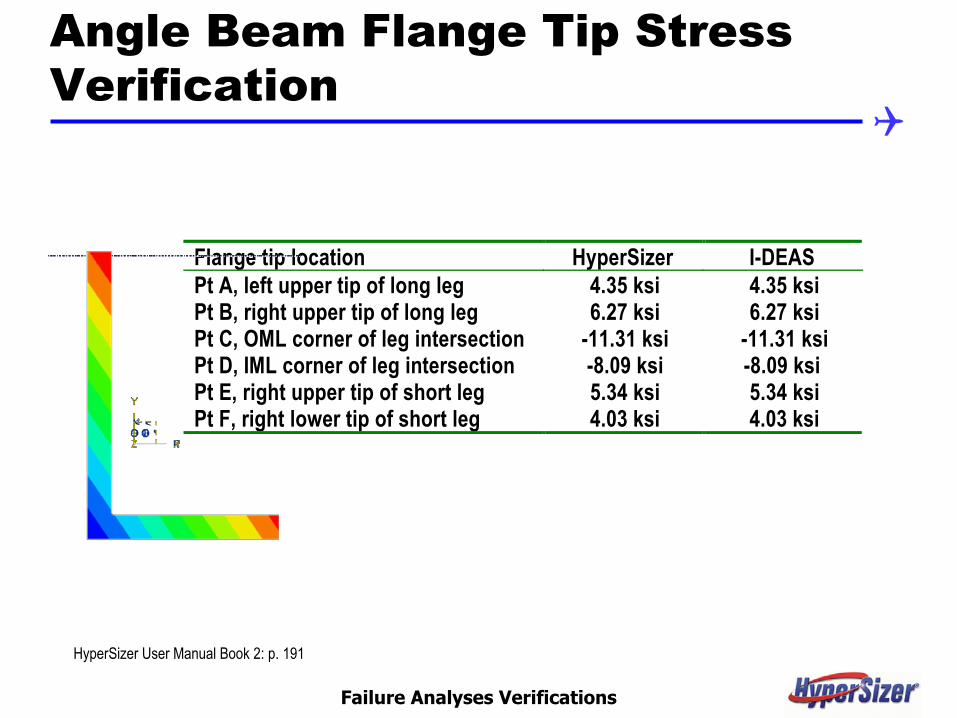
Angle Beam Flange Tip Stress Verification
Failure Analyses VerificationsIndex Top
Flange tip location HyperSizer I-DEASPt A, left upper tip of long leg 4.35 ksi 4.35 ksiPt B, right upper tip of long leg 6.27 ksi 6.27 ksiPt C, OML corner of leg intersection -11.31 ksi -11.31 ksiPt D, IML corner of leg intersection -8.09 ksi -8.09 ksiPt E, right upper tip of short leg 5.34 ksi 5.34 ksiPt F, right lower tip of short leg 4.03 ksi 4.03 ksi
HyperSizer User Manual Book 2: p. 191

Verification of Thermal Stress Including Residual Strain Effects
Failure Analyses VerificationsIndex Top
CASE 2: ∆T and ∆G, a uniform temperature increase of 68º F and a linearthrough-the-thickness temperature gradient of 50º F in/in
Location BenchmarkResidual
strain(µ-in)
HyperSizerResidual
strain(µ-in)
BenchmarkThermalstress(psi)
HyperSizerThermalstress(psi)
Steel top face Top surface 983.2 983.2 4193 4193 Midplane 100.1 100.1 4268 4268 Bottom surface 101.8 101.8 4342 4342Aluminum middle Top surface -228.8 -228.8 -3585 -3585 Midplane -107.8 -107.8 -1689 -1689 Bottom surface 13.2 13.2 207 207Steel bottom face Top surface 115.8 115.8 4940 4940 Midplane 116.7 116.7 4978 4978 Bottom surface 117.6 117.6 5014 5014
HyperSizer User Manual Book 2: p. 73
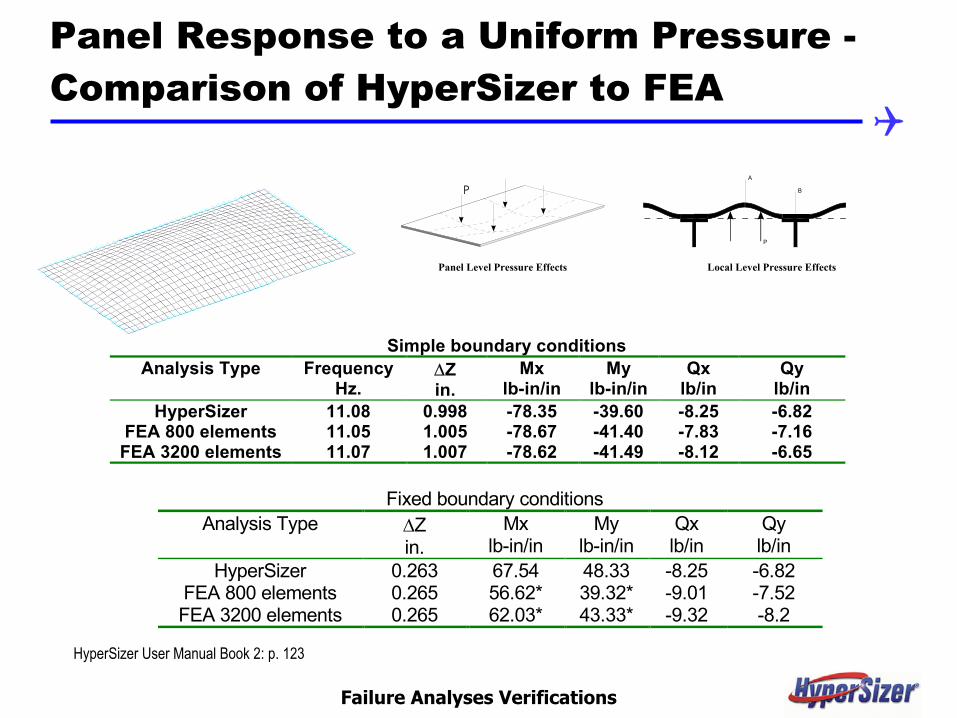
Panel Response to a Uniform Pressure -Comparison of HyperSizer to FEA
Failure Analyses VerificationsIndex Top
P B
A
P
Local Level Pressure EffectsPanel Level Pressure Effects
Simple boundary conditionsAnalysis Type Frequency
Hz.∆Zin.
Mxlb-in/in
Mylb-in/in
Qxlb/in
Qylb/in
HyperSizer 11.08 0.998 -78.35 -39.60 -8.25 -6.82FEA 800 elements 11.05 1.005 -78.67 -41.40 -7.83 -7.16FEA 3200 elements 11.07 1.007 -78.62 -41.49 -8.12 -6.65
Fixed boundary conditionsAnalysis Type ∆Z
in.Mx
lb-in/inMy
lb-in/inQxlb/in
Qylb/in
HyperSizer 0.263 67.54 48.33 -8.25 -6.82FEA 800 elements 0.265 56.62* 39.32* -9.01 -7.52FEA 3200 elements 0.265 62.03* 43.33* -9.32 -8.2
HyperSizer User Manual Book 2: p. 123