20 th january, 2016 - india infrastructure, power, oil...
TRANSCRIPT

20 TH January, 2016

Hydro Potentials

Energy Resources Concentrated in Few Pockets
Hydro – In North Eastern & Northern Himalayan region. Difficult terrain
Coal – In Central India ‾ Chhattisgarh, Orissa, Jharkha
nd, Madhya Pradesh‾ Forest, coal block
Renewable Energy‾ Six major RE rich states: Tamil
Nadu, Andhra Pradesh, Karnataka, Maharashtra, Gujarat, Rajasthan
3
52 GW /
23 GW
44 GW4.5 GW
58 GW
26 GW
All India Hydro Potential : 145 GW

Hydro Power Growth - Estimated
Installed Capacity
Hydro Power Total %
India SAARC
Present 281 42.6 1.4 44 16%
13th Plan(2021-22)
373 62 5 67 18%
14th Plan (2026-27)
691 87 24 111 16%
15th Plan (2031-32)
948 110 46 156 16%
All Figs are in GW
44 67111
156
237306
580
792
0
100
200
300
400
500
600
700
800
900
1000
Present 13th Plan (2021-22)
14th Plan (2026-27)
15th Plan (2031-32)
Hydro Other Generations
281
373
691
948
GW
Requirement of Hydro Power To take care of Peak / Off-Peak Variation Back-up of Renewable Power

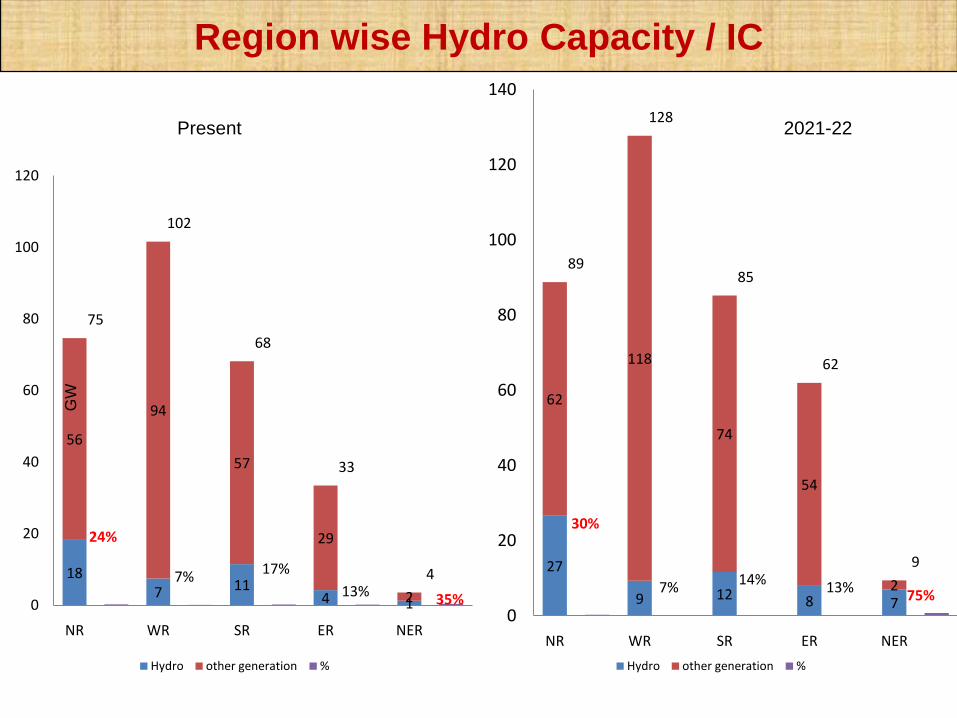
Region wise Hydro Capacity
Present Total till 2021-22
Hydro Total % Hydro Total %
NR 18247 74651 24% 26618 88793 30%
WR 7448 101615 7% 9322 127746 7%
SR 11478 68152 17% 11687 85204 14%
EAST 4209 33441 13% 7994 62009 13%
NRTHEAST 1242 3513 35% 7038 9436 75%
Grand Total 42624 281372 15% 62658 373188 17%
Region wise Hydro Capacity / IC
187 11
4 1
56
94
57
29
2
24%
7% 17%
13% 35%
75
102
68
33
4
0
20
40
60
80
100
120
NR WR SR ER NER
Hydro other generation %
27
9 12 8 7
62
118
74
54
2
30%
7% 14% 13% 75%
89
128
85
62
9
0
20
40
60
80
100
120
140
NR WR SR ER NER
Hydro other generation %
Present 2021-22
GW

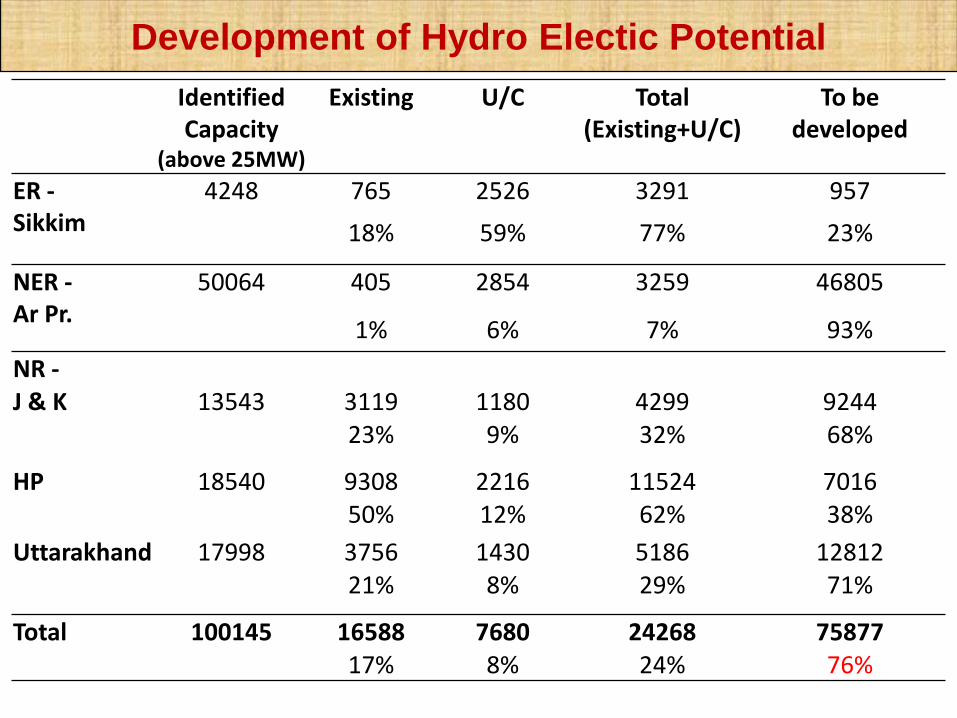
Development of Hydro Electic Potential
Identified Capacity
(above 25MW)
Existing U/C Total (Existing+U/C)
To be developed
NR 52263 18302 5032 23334 2892935% 10% 45% 55%
WR 8131 5552 400 5952 217968% 5% 73% 27%
SR 15890 9507 1390 10897 499360% 9% 69% 31%
ER 10680 3234 2806 6040 464030% 26% 57% 43%
NER 58356 1242 2954 4196 541602% 5% 7% 93%
Total 145320 37837 12582 50419 9490126% 9% 35% 65%
9 PSS( 4785.6 MW) are under operation, 2 PSS (1080 MW) are under construction
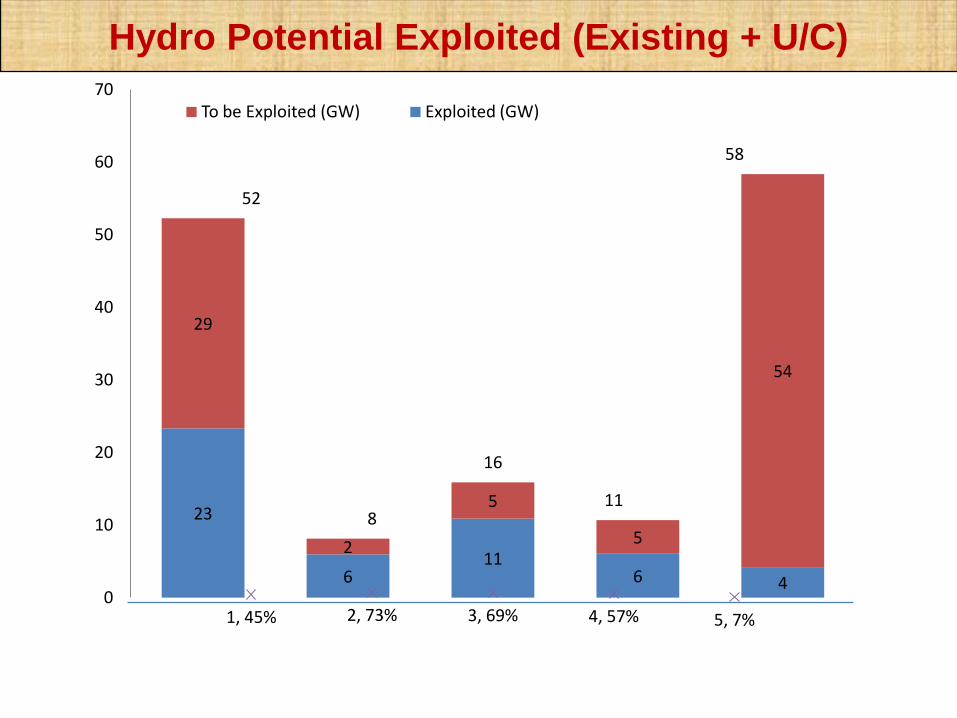
Hydro Potential Exploited (Existing + U/C)
23
611
6 4
29
2
5
5
54
52
8
16
11
58
1, 45% 2, 73% 3, 69% 4, 57% 5, 7%0
10
20
30
40
50
60
70To be Exploited (GW) Exploited (GW)
Development of Hydro Electic Potential
Identified Capacity
(above 25MW)
Existing U/C Total (Existing+U/C)
To be developed
ER -Sikkim
4248 765 2526 3291 957
18% 59% 77% 23%
NER -Ar Pr.
50064 405 2854 3259 46805
1% 6% 7% 93%
NR -J & K 13543 3119 1180 4299 9244
23% 9% 32% 68%
HP 18540 9308 2216 11524 701650% 12% 62% 38%
Uttarakhand 17998 3756 1430 5186 1281221% 8% 29% 71%
Total 100145 16588 7680 24268 7587717% 8% 24% 76%
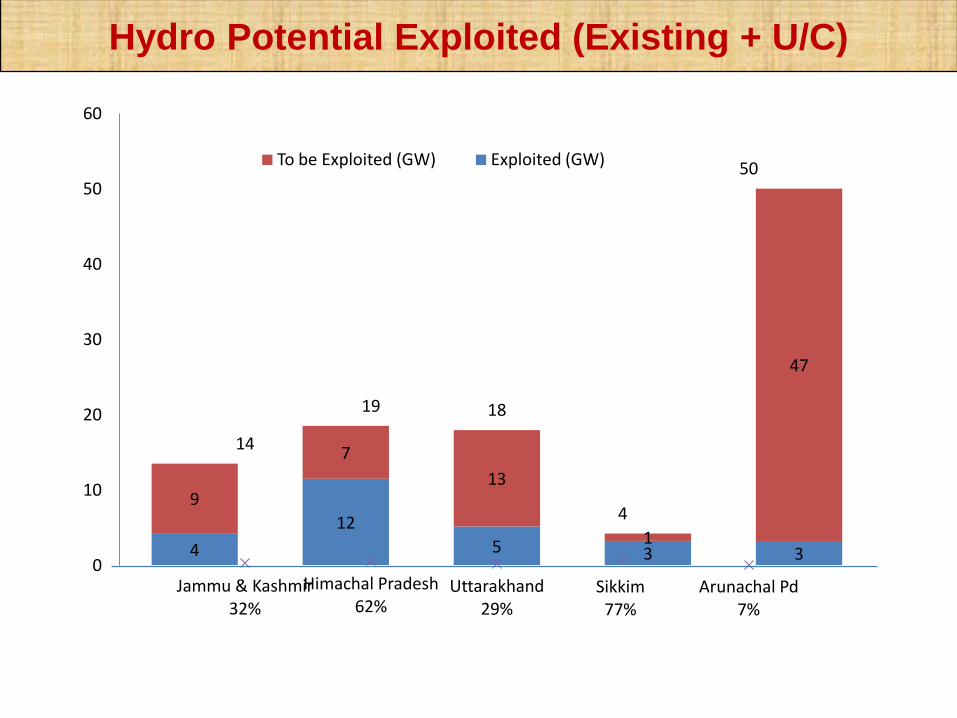
Hydro Potential Exploited (Existing + U/C)
4
12
5 3 3
9
7
13
1
47
14
19 18
4
50
Jammu & Kashmir 32%
Himachal Pradesh 62%
Uttarakhand29%
Sikkim 77%
Arunachal Pd 7%
0
10
20
30
40
50
60
To be Exploited (GW) Exploited (GW)

Sikkim
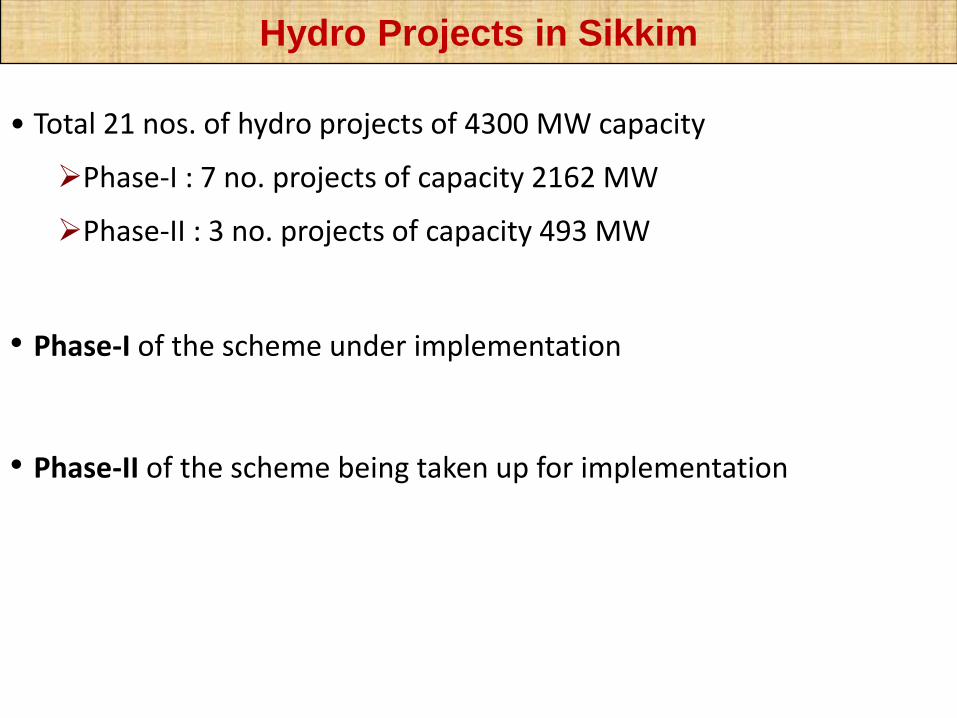
Hydro Projects in Sikkim
• Total 21 nos. of hydro projects of 4300 MW capacity
Phase-I : 7 no. projects of capacity 2162 MW
Phase-II : 3 no. projects of capacity 493 MW
• Phase-I of the scheme under implementation
• Phase-II of the scheme being taken up for implementation
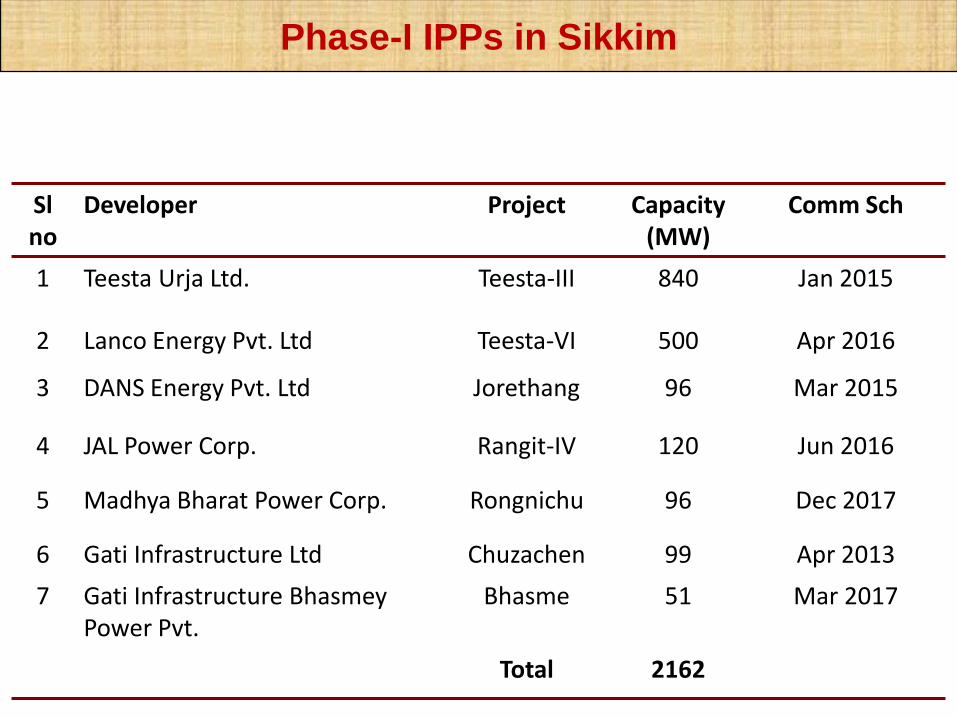
Phase-I IPPs in Sikkim
Slno
Developer Project Capacity(MW)
Comm Sch
1 Teesta Urja Ltd. Teesta-III 840 Jan 2015
2 Lanco Energy Pvt. Ltd Teesta-VI 500 Apr 2016
3 DANS Energy Pvt. Ltd Jorethang 96 Mar 2015
4 JAL Power Corp. Rangit-IV 120 Jun 2016
5 Madhya Bharat Power Corp. Rongnichu 96 Dec 2017
6 Gati Infrastructure Ltd Chuzachen 99 Apr 2013
7 Gati Infrastructure BhasmeyPower Pvt.
Bhasme 51 Mar 2017
Total 2162

Phase-II IPPs in Sikkim
Sl
NoDeveloper Project Capacity
(MW)
Comm.
Sch.
1. Shiga Energy Pvt. Ltd.) Tashiding 97 Dec 2015
2. Sneha Kinetic Power Projects Ltd. Dickchu 96 May 2015
3. Himagiri Hydro energy Ltd. Pannan 300 Apr 2018
Total 493


North-Eastern region

River Basins of Arunachal Pradesh

• Basin-wise Hydro projects allotted to different agencies for development in Arunachal Pradesh
• Major portion of the Power to be exported outside NER to other regions
S. No. Name of Basin Capacity (MW)
1 Tawang 2773
2 Kameng 3292
3 Subansiri 8865
4 Siang 6939
5 Dibang 8508
6 Lohit 6632
Total 37009
Basinwise Hydro Projects in NER (Ar. Pradesh)
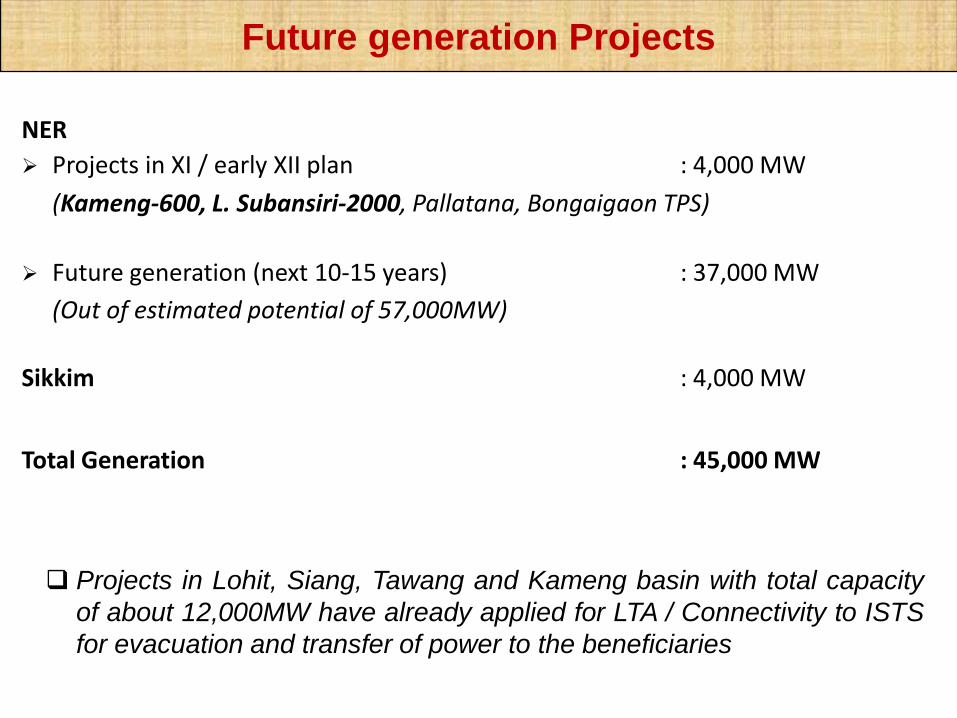
NER
Projects in XI / early XII plan : 4,000 MW
(Kameng-600, L. Subansiri-2000, Pallatana, Bongaigaon TPS)
Future generation (next 10-15 years) : 37,000 MW
(Out of estimated potential of 57,000MW)
Sikkim : 4,000 MW
Total Generation : 45,000 MW
Projects in Lohit, Siang, Tawang and Kameng basin with total capacity
of about 12,000MW have already applied for LTA / Connectivity to ISTS
for evacuation and transfer of power to the beneficiaries
Future generation Projects

22
DESHBANGLA-
BHUTAN
Hydro Electric Projects in NER, Sikkim, Bhutan and Myanmar
SIKKIM
WR
NR
SR
ER
NEPAL
CHICKEN-NECKAREA
KM
NAGALAND
MIZORAM
ASSAM
TRIPURA
MEGHALAYAMANIPUR
KM18
MYANMAR
PRADESHARUNACHAL

• About 45000 MW of power to be evacuated from NER throughchicken neck area in north of West Bengal
• A very narrow patch of land (22 km. Width X 18 km length) near
Siliguri having borders of Nepal on one side & Bangladesh on the
other side and is largely habited.
• All transmission lines, railway lines, gas pipe-lines,
telecommunication lines etc. have to pass through the chicken neck
area.
Development of
Tr. System Through Chicken Neck

About 8 nos. of HVDC / EHVAC corridors (each of 6000MW
capacity) may be required with a total width of about 1.5-2 Kms.
The first such +800 kV HVDC corridor from NER to NR has been
commissioned
For this, 3 more corridors of 6000MW each (Total : 24,000 MW) is
nearing completion in the chicken neck area.
Development of
Tr. System Through Chicken Neck

• World’s Largest multi-terminal
800kV HVDC Project (1750 km)
• 3000 MW HVDC terminals at
Biswanath Chariyali & Alipurduar
and 6000 MW at Agra
• Passing through 3 Regions, 4
States and crossing more than 40
Rivers
Salient Features of the Project
24
1750 kmAgra
Biswanath Chariyali

ALIPURDUAR
WRNR
3000 MW
HVDC
TERMINAL
STATION)
(NER POOLINGAGRA(AGRA)
+/- 800kV, 6000MW BISHWANATH CHARIYALI - ALIPURDUAR - AGRA HVDC BIPOLE
6000MW 3000MW
3000 MW
TERMINAL
HVDC
NR WR
HVDC
TERMINAL
3000 MW
BHUTAN
(600 MW)(2000 MW)
KAMENG
SUBANSIRI
LOWER
TERMINAL
HVDC
3000 MW
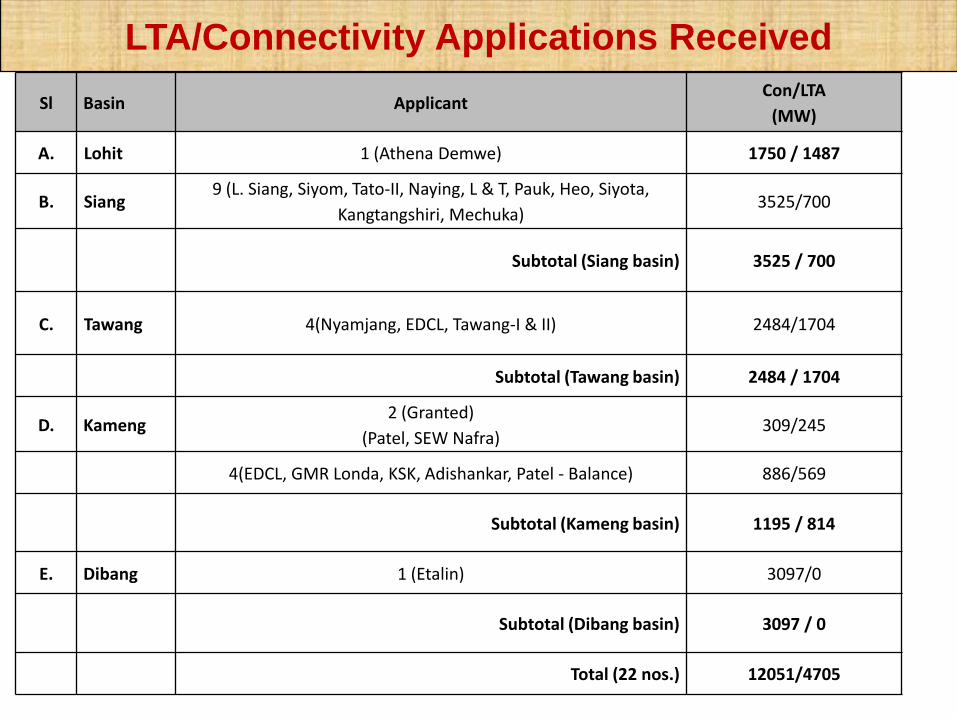
LTA/Connectivity Applications Received
Sl Basin ApplicantCon/LTA
(MW)
A. Lohit 1 (Athena Demwe) 1750 / 1487
B. Siang9 (L. Siang, Siyom, Tato-II, Naying, L & T, Pauk, Heo, Siyota,
Kangtangshiri, Mechuka)3525/700
Subtotal (Siang basin) 3525 / 700
C. Tawang 4(Nyamjang, EDCL, Tawang-I & II) 2484/1704
Subtotal (Tawang basin) 2484 / 1704
D. Kameng 2 (Granted)
(Patel, SEW Nafra)309/245
4(EDCL, GMR Londa, KSK, Adishankar, Patel - Balance) 886/569
Subtotal (Kameng basin) 1195 / 814
E. Dibang 1 (Etalin) 3097/0
Subtotal (Dibang basin) 3097 / 0
Total (22 nos.) 12051/4705

S.No Project Capacity (MW)
1. KSK Dibbin 120
2.Patel Hydro(DirangEnergy)
Gongri : 144Saskan Rong:45
3. Sew Nafra 120
4.AdishankarKhuitam
66
Total 495
BONGAIGAON

Master Plan for Evacuation of Power from Ar. Pradesh

30
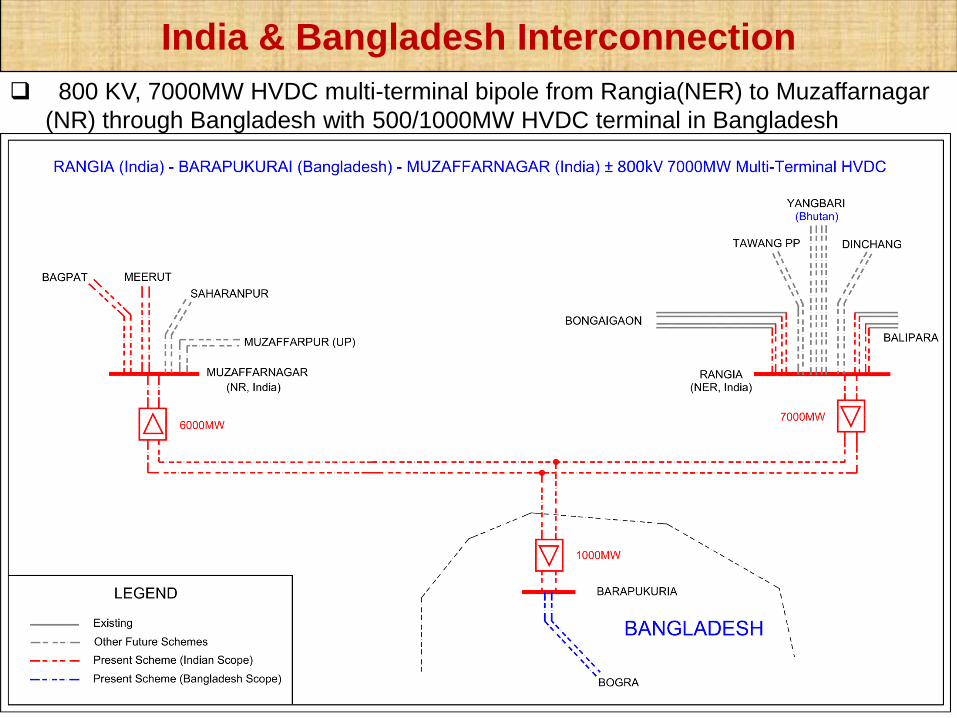
India & Bangladesh Interconnection
800 KV, 7000MW HVDC multi-terminal bipole from Rangia(NER) to Muzaffarnagar
(NR) through Bangladesh with 500/1000MW HVDC terminal in Bangladesh


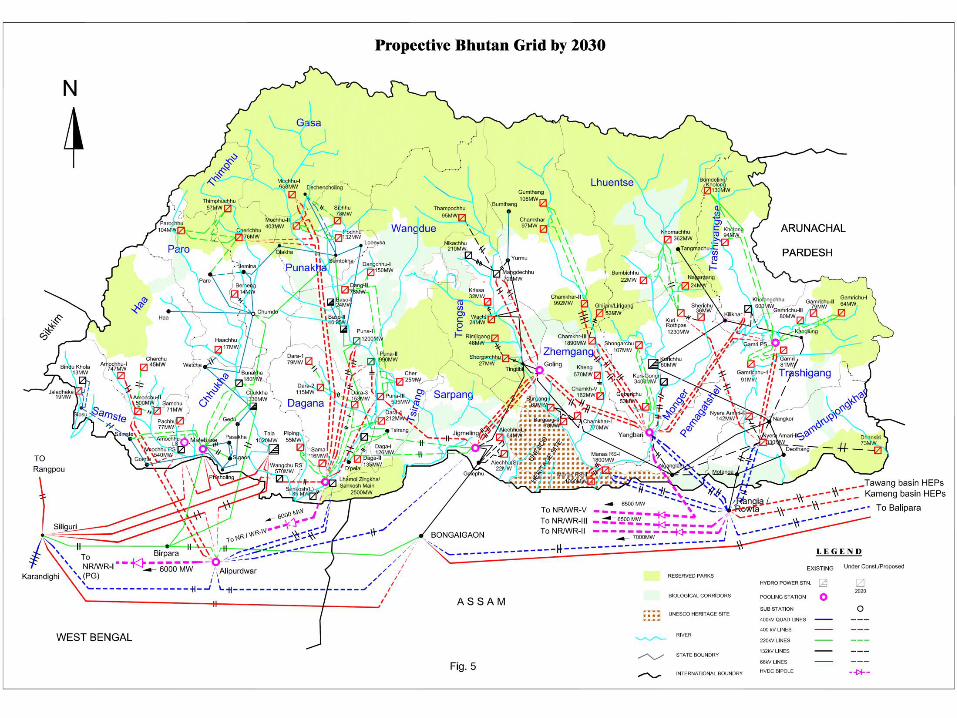
Evacuation from Hydro Projects in Bhutan
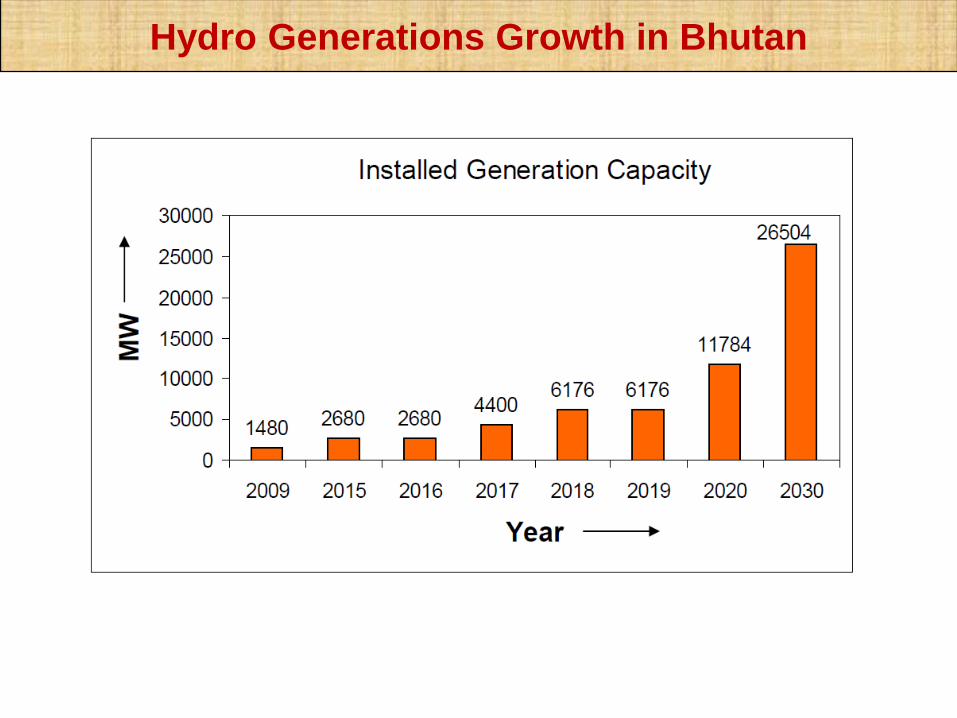
Hydro Generations Growth in Bhutan

India - Bhutan : Interconnections
• Existing Interconnection : [ 1400MW from Tala-1000, Chukha-336 & Kurichu-60]
– Tala – Siliguri 400kV 2x D/c line
– Chukha – Birpara 220kV 3 ckts
– Kurichu - Geylegphug(Bhutan) – Salakati(NER) 132 kV
• On-going Interconnection : [3000MW from Punatsangchu-I:1200MW, Punatsangchu-II: 990MW and Mangdechu-720 MW]
– Punatsangchu-I – Alipurduar 400kV D/c line (Bhutan portion 2xD/c and Indian portion D/c quad line]
– Jigmelling – Alipurduar 400kV D/c line (quad)
34
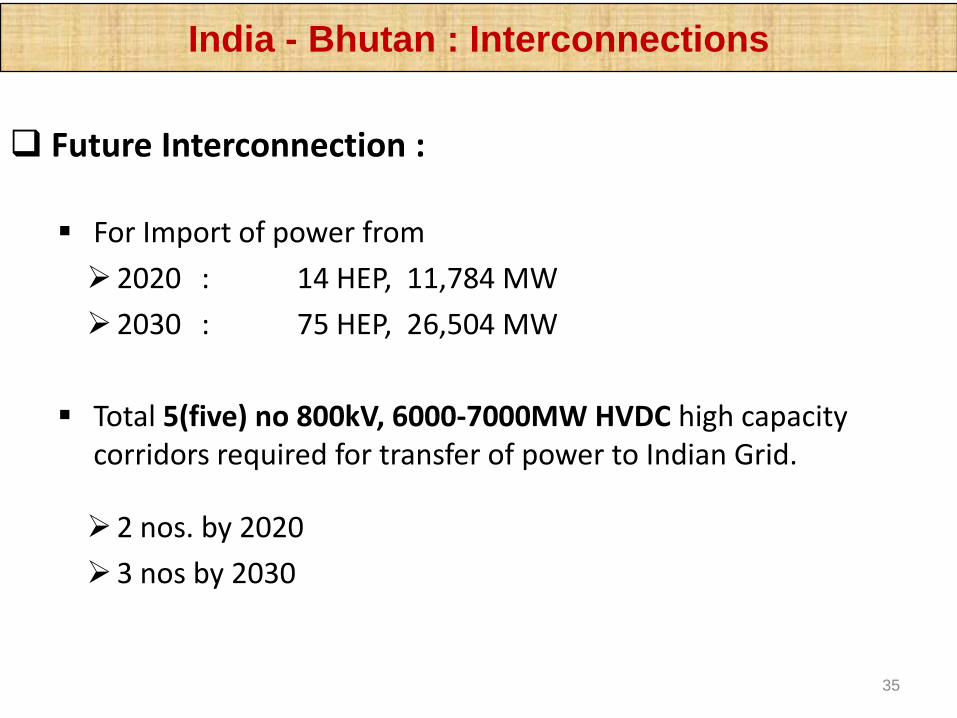
India - Bhutan : Interconnections
Future Interconnection :
For Import of power from
2020 : 14 HEP, 11,784 MW
2030 : 75 HEP, 26,504 MW
Total 5(five) no 800kV, 6000-7000MW HVDC high capacity corridors required for transfer of power to Indian Grid.
2 nos. by 2020
3 nos by 2030
35

Evacuation from Hydro Projects in Nepal

Hydro Potential in Nepal
5011518 1873
2887 3444 38375741
70398295
13540
16001 16688
19204
22598
2792929154
33154
43954
0
5000
10000
15000
20000
25000
30000
35000
40000
45000
50000
MW
Year
Envisaged Growth of Hydro Potential
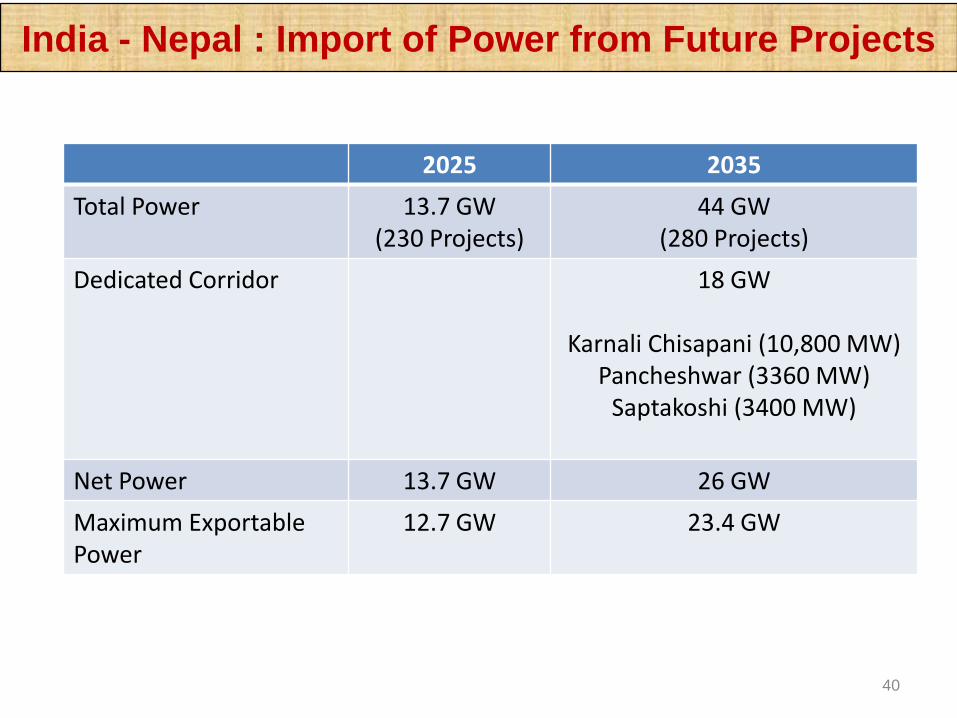
India - Nepal : Import of Power from Future Projects
40
2025 2035
Total Power 13.7 GW(230 Projects)
44 GW(280 Projects)
Dedicated Corridor 18 GW
Karnali Chisapani (10,800 MW) Pancheshwar (3360 MW)
Saptakoshi (3400 MW)
Net Power 13.7 GW 26 GW
Maximum Exportable Power
12.7 GW 23.4 GW
41
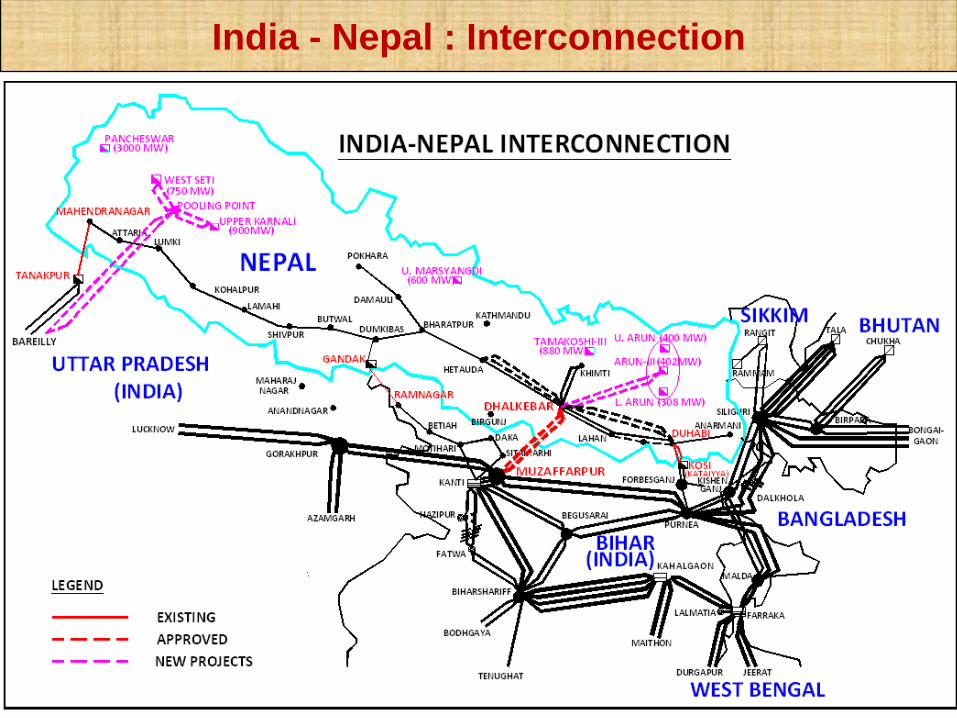
India - Nepal : Interconnection

42
India - Nepal : Future Plan
East-West High capacity transmission Corridor to be planned in Nepal
This is to be connected with hydro projects in Nepal and Load centres in India
Future Hydro Projects :
–Karnali - 10,800 MW
–(Upper Karnali - 900MW)
–Tamakoshi III - 880 MW
–U. Marsyangdi – 2 - 600 MW
–Pancheshwar HEP - 5,600 MW
–Sapta Koshi - 3,300 MW
–Arun HEP - 1,100 MW
–West Seti HEP - 750 MW
–Lower Marsyangdih - 300 MW
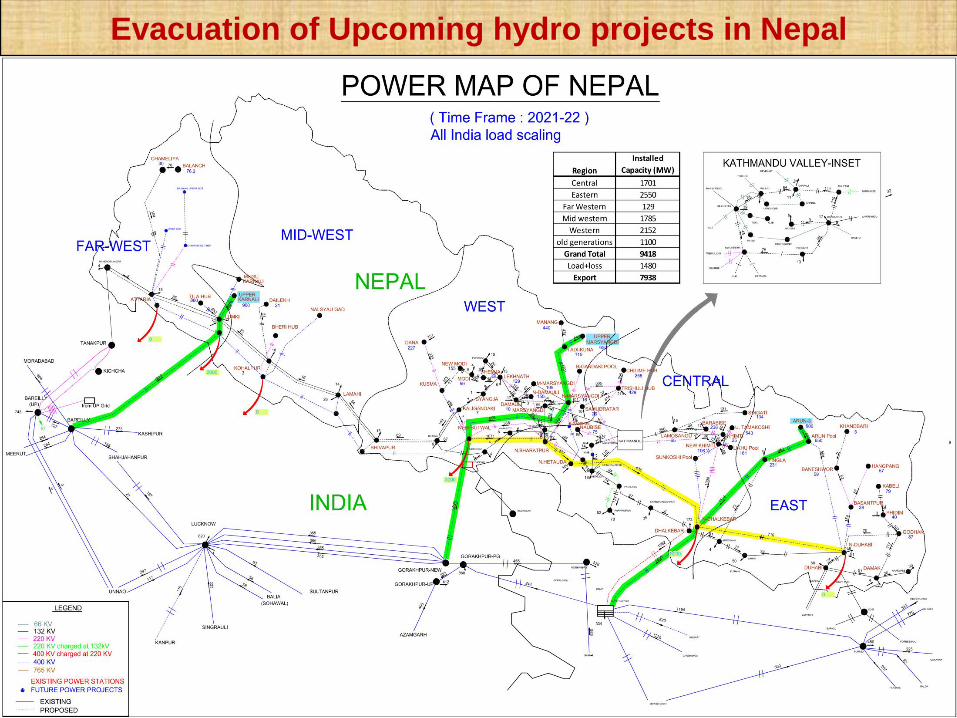
Evacuation of Upcoming hydro projects in Nepal

Master Plan for Evacuation of Power from Nepal
Northern region

Hydro Projects in Himachal Pradesh
Chenab
Basin
Beas BasinSatluj Basin
Ravi
Basin
Yamuna
Basin
2355 MW
2955 MW
9730 MW4460 MW
645 MW
19GW / 12GW
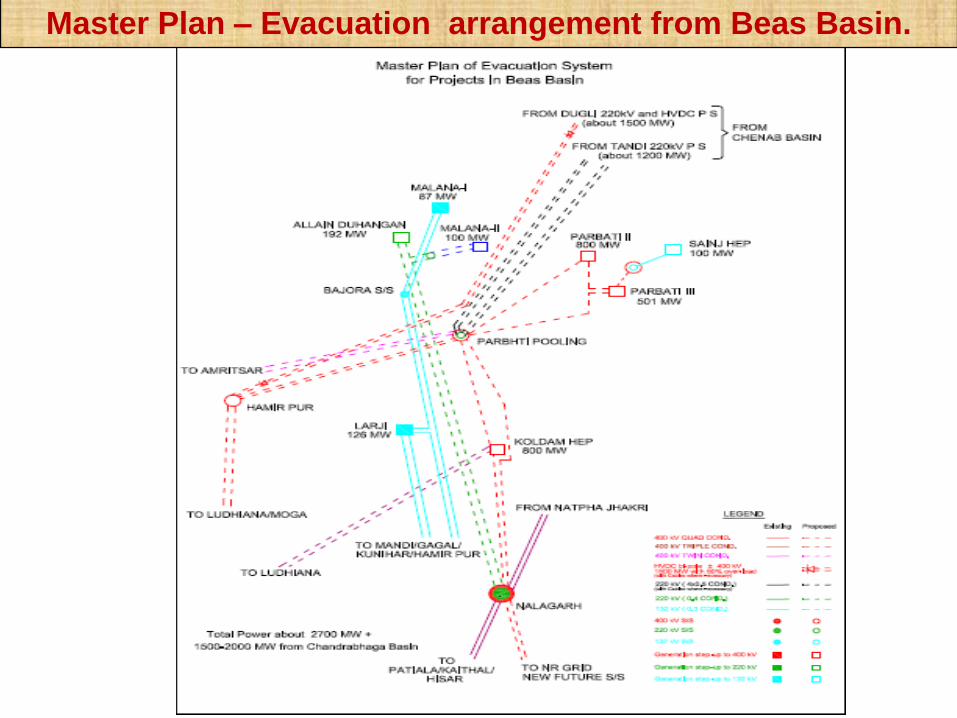
Master Plan – Evacuation arrangement from Beas Basin.

Master Plan – Evacuation arrangement from Chenab Basin.
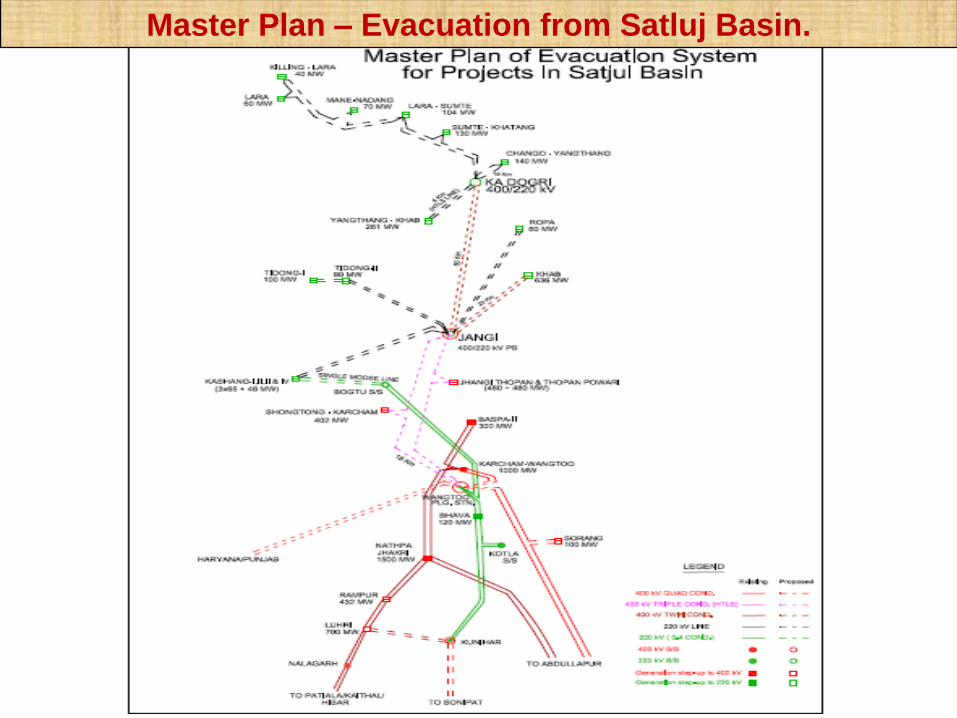
Master Plan – Evacuation from Satluj Basin.

Master Plan – Evacuation from Ravi Basin

Power Evacuation and Transmission system of Jammu & Kashmir.
14GW / 4GW

18GW / 5GW

Planning – Basinwise development
Design : In some cases (Chenab Basin) Generation / Pooling Station Switchyard
Capacity may be equivalent to the ultimate power handling capacity
Implementation (NR)
Tough Terrrain (Hilly, Forest) / Snow Bound terrain / glacier / avalanche prone area(Lahaul / Spiti valley) (height upto 4000mtr)
Time Frame : Working Season 5-6 months in a year due to high snow
Environmental clearances, Transportation (‘Kuccha’ roads, many bridges withmaximum capacity of 9 tonnes.)
High cost of transmission system due to
High Capacity, long distance (to load centre) Transmission line through difficult corridor
Phased development of the generation projects
Low PLF of hydro projects
Recovery of Tariff
Matching generation with Transmission difficult - Uncertainty in implementation of
Hydro Projects (Bhutan - Punatsangchu-I & II, NER - L. Subansiri, Kameng)
Evacuation System for Hydro Projects - Challenges


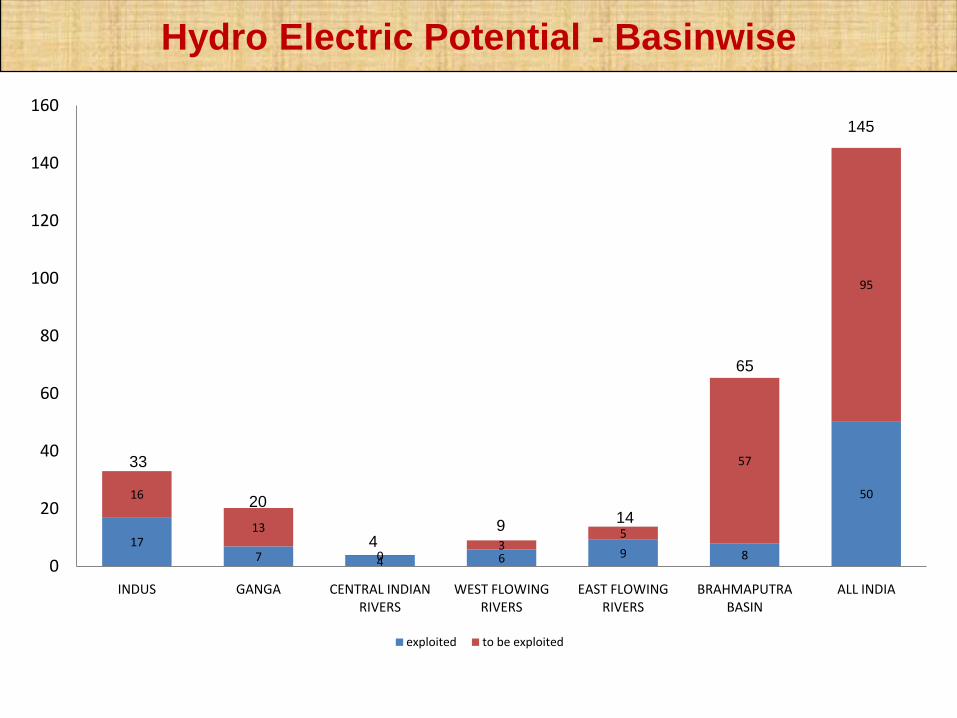
Hydro Electric Potential - Basinwise
Basin Identified Capacity (above 25MW)
Existing (MW,%)
U/C(MW,%)
Total (Existing+U/C)
(MW,%)
to be developed
(MW,%)
INDUS 33.0 13.6 3.5 17.1 16.041% 11% 52% 48%
GANGA 20.3 5.3 1.5 6.9 13.4
26% 8% 34% 66%
CENTRAL INDIAN RIVERS 3.9 3.1 0.4 3.5 0.3
81% 10% 92% 8%
WEST FLOWING RIVERS 9.0 5.7 0.1 5.8 3.2
63% 1% 64% 36%
EAST FLOWING RIVERS 13.8 7.9 1.3 9.2 4.6
58% 9% 67% 33%
BRAHMAPUTRA BASIN 65.4 2.2 5.8 8.0 57.4
3% 9% 12% 88%
ALL INDIA 145.3 37.8 12.6 50.4 94.9
26% 9% 35% 65%
177 4 6 9 8
5016
13
03
5
57
95
0
20
40
60
80
100
120
140
160
INDUS GANGA CENTRAL INDIAN RIVERS
WEST FLOWING RIVERS
EAST FLOWING RIVERS
BRAHMAPUTRA BASIN
ALL INDIA
exploited to be exploited
Hydro Electric Potential - Basinwise
33
20
49
14
65
145