20 british meetings & events industry survey · 2018-12-17 · the meetings show is the...
TRANSCRIPT

British Meetings & Events
INDUSTRY SURVEY 20 19
A definitive study of market trends based on interviews with leading British event organisers
Undertaken by: The Right Solution Ltd
on behalf of: CAT Media
Sponsored by:
ICC Birmingham
Stuttgart Convention Bureau
The Meetings Show

2 British Meetings & Events Industry Survey 2019
WE’LL HELP
YOUR AUDIENCE
theicc.co.uk/deliver 0121 644 5025
Inspiring connections through exceptional events
IC000390 - 18mth Campaign_DELIVER Advert_A4_297x210mm(3mmBleed)_AW.indd 1 26/01/2018 13:43

3British Meetings & Events Industry Survey 2019
Contents
An in-depth
market
research
study based
on interviews
with UK event
organisers from
the corporate,
association
and other
not-for-profit
sectors”
“
Fairway House
Portland Road
East Grinstead
West Sussex
RH19 4ET
Tel: 01342 306700
Email: [email protected]
www.meetpie.com
Available in two formats:Printed copy – £280PDF version – £220 +VAT
To purchase additional copies
of the survey visit
www.mitmagazine.co.uk/BMEIS
© CAT Media – November 2018
Published by:
INTRODUCTION ..................................................5DEFINITION OF A CONFERENCE/MEETING ........5METHODOLOGY .................................................7 RESPONDENT CHARACTERISTICS ......................7SUMMARY OF RESULTS......................................8
FULL RESULTSVolume of events ......................................12Number of delegates ................................13Duration of events ....................................14Percentage of residential events .............14Budgeted delegate rates ..........................14Annual budgets for events .......................15Lead times .................................................16UK destinations .................................... 16/17Overseas destinations ..............................18Preferred venue types ..............................19Preferred venue incentives ......................20Factors influencing venue selection ... 20/21Third party assistance with events ..........22Referral to convention bureaus ...............22Frequency of outsourcing .........................23Measuring return on investment .............23Print and digital media consulted ...... 23/24Meetings industry trade shows attended ..25 Satisfaction ratings ...................................26Factors affecting events currently ...... 26/27Cancellation of events due to terrorism ....27BREXIT ........................................................28Sharing Economy Providers .....................29GDPR ...........................................................29Hours worked per week ...........................29 Working in the events industry ...............29
GLOSSARY OF TERMS ......................................30QUESTIONNAIRE .............................................31

www.congress-stuttgart.com
Unlock ideas with local expertise:
free impartial consulting · free digital Meeting Guide Stuttgart Region · venues & hotels · group programmes · strong partner network ·
easy access from LHR, LGW, BHX, MAN, EDI and ��� destinations · networks & clusters: mobility, engineering, ICT, clean energy, finance,
creative industries
Stuttgart Convention Bureau · [email protected]
MEET INSTUTTGART
BMEIS_SCB A4_Weinberg_301018.indd 1 30.10.18 07:19
5British Meetings & Events Industry Survey 2019
Introduction
Welcome to the British Meetings & Events Industry Survey 2019. This is the tenth year the survey has been undertaken
to provide valuable information on the buying trends and characteristics of their events for 349 conference organisers from the corporate and not-for-profit sectors.
The survey is commissioned and published by CAT Media – and compiled by The Right Solution - and has been made possible through the generous support of ICC Birmingham, Stuttgart Convention Bureau and The Meetings Show.
This research will be of interest to all venues and suppliers of conferences and meetings in the UK, plus intermediary agencies and organisers. Whether you are looking for information for strategic planning and business decisions or general interest in the state of the meetings industry, including all those operating, marketing or developing destinations, venues and related services, the trends and characteristics outlined here will also be of interest for benchmarking activities and budgets.
Third party organisers such as event management agencies, professional conference organisers and venue finders have intentionally not been included as respondents to the survey as their responses would skew the volume and value figures and affect the accuracy of information by duplicating data.
Definition of a conference/meetingFor the purposes of this survey a conference, meeting or business event is defined as one that involves a minimum of eight people, occupying the venue for at least four hours’ duration. Those selected were required to organise at least one meeting fitting this description, although prime targets were organisers of more than one event per year.
A full glossary of terms and definitions used in this report is provided towards the end of this document, together with a copy of the questionnaire used.

The Meetings Show is the gathering place for the MICE industry in the UK, bringing people together to meet in person and build connections that last. Taking place from 26-27 June 2019 at Olympia London, the show provides the
experiences you need to steer your events to the future. Time to take a closer look.
# M E E T YO U AT T H E S H OW
SHARPEN YOUR FOCUS
W H AT D O E S T H E F U T U R E O F E V E N T S L O O K L I K E ?
TMSW0006 Full Page Brand Ad_181025_V2.indd 1 25/10/2018 17:00

7British Meetings & Events Industry Survey 2019
MethodologyThe results analysed are based on online completions and telephone interviews with 349 respondents during July, August, September and October 2018 including 175 from the not-for-profit sector and 174 from the corporate sector. Invitations to participate were sent by email to the CAT Media and The Right Solution databases of qualified meetings and events’ organisers from both the corporate and not-for-profit sectors and other interviews were undertaken by telephone.
It is important to note that respondents are not identical to those for last year and this therefore influences the changes reported from year to year.
The respondents from the not-for-profit sector were made up as follows:
• 58.3%professionalandtradeassociationsandinstitutions
• 12.0%governmentorpublicsectororganisations
• 29.7%othernot-for-profitorganisationssuchascharities,politicalparties,religious groups and trade unions.
These three sectors are collectively referred to as the national (UK) association or not-for-profit sector throughout the report.
Please note the international associations' meetings and conferences are separately researched by both the Union of International Associations (UIA) and the International Congress and Convention Association (ICCA).
7
“
PLEASE NOTE: Due to the rounding up or down of some of the individual figures, totals on the graphs on the following pages do not always add up to 100%
Conference
organisers
from the not-
for-profit and
corporate
sectors
participated”
The Meetings Show is the gathering place for the MICE industry in the UK, bringing people together to meet in person and build connections that last. Taking place from 26-27 June 2019 at Olympia London, the show provides the
experiences you need to steer your events to the future. Time to take a closer look.
# M E E T YO U AT T H E S H OW
SHARPEN YOUR FOCUS
W H AT D O E S T H E F U T U R E O F E V E N T S L O O K L I K E ?
TMSW0006 Full Page Brand Ad_181025_V2.indd 1 25/10/2018 17:00
Respondent characteristicsThe most frequently mentioned job titles for respondents are shown in the table below. The categories in this table are taken from the top words and phrases from the job titles of corporate and not-for-profit respondents. Those where five or more respondents mentioned the title are listed.
Key word in job title Corporate Association respondents respondents
Events 21% 26%
Manager 37% 26%
Events manager 8% 10%
Marketing 17% 5%
Head/senior 20% 9%
Executive 14% 5%
Officer 1% 7%
Director or CEO 11% 7%
Conference 1% 4%

8 British Meetings & Events Industry Survey 2019
Introduction & summary of results for the twelve months to October 2018The British Meetings & Events Industry Survey 2019 outlines results of organisers' buying trends for meetings over the last twelve months, including buyers from the not-for-profit and corporate sectors. The results of this year's survey are compared with 2017, and where relevant 2016, to provide an indication of trends and what is happening in the market. Third party organisers are intentionally not included so that double counting of volume and value is avoided.
Volume of events, numbers of delegates
The results seem indicative of the uncertainty and fluctuations being experienced by many markets. The volume of events has reduced to an average 23 from 32 events per association organiser and from 34 to 31 events per corporate organiser. Yet delegate numbers are up for both sectors – perhaps because of fewer events being held they are more inclined to attend? Or they are eager for information on future trends and developments in their own field? Whatever the reason the increases are significant. Associations’ main events show an average of 403 attendees (up from 292 last year) and their regular events an average of 121 (up from 86). Corporates show an average of 368 attendees at their main event (up from 238 last year) and 130 at regular events (up from 79).
84%ofeachsectorsaidthedurationoftheireventshadnotchanged.Leadtimes average 9 months for associations and 7 months for corporates but many eventsareorganisedwithinshortertimescales.56%ofcorporatesorganisetheirevents within 6 months.
Budgets and budgeted delegate rates
Both sectors show increased average daily delegate rates. The associations sector is up to £51.78 from £43.62 and the corporate sector up to £58.71 from £52.39. This can in part be explained by venue choices as city centre hotels, residential conference centres and luxury venues are the most popular venue types.
24-hour delegate rates are also up from £127.55 to £135.62 for associations and to £157.21 from £151.05 for corporates. However, these results are only forasmallsampleasjust28%ofassociationsand34%ofcorporatesstageresidential events.
Annual budgets also increased from £131,151 to £160,043 for associations/nfp and from £188,043 to £191,346 for corporates. Predictions for the next twelve months are very different for the two sectors with corporates anticipating an increaseof+7.5%andassociations/nfpadecreaseof-7.5%.
Unsurprisingly given the increased average rates, added value items (i.e. more being included in the delegate rates) were the most popular incentives with both sectors, followed by discounts on multiple bookings and long-term contracts.
8

9British Meetings & Events Industry Survey 2019
Destinations
London,Birmingham,Manchester,Leeds(upfrom7thlastyear)andGlasgow are the top five destinations for events held. The top ten, although some positions change within it, are very similar to last year except for Nottingham which moves into tenth place from 12th last year.
Infrastructure, accessibility, general appeal and the role of universities’ academics and ambassadors all influence the popularity of destinations for events. This is borne out by the top influencing factors which are access, location and price followed by capacity of conference facilities, availability and quality of conference facilities.
51%ofcorporates(upfrom45%)and27%(26%)ofassociationshadheldevents overseas. The top countries were France, Germany, Spain and the Republic of Ireland.
Third party help, convention bureaus and freelancers
29%ofassociationseventsand34%ofcorporateeventsareplannedwiththirdpartyassistance.36%ofcorporatesand53%ofassociationssaidtheynever use freelancers or outsourced aspects of event organisation.
Conventionbureausarereferredtoforanaverage21%ofassociationeventsand27%ofcorporateevents.
ROI
53%ofassociations(upfrom45%)and52%ofcorporates(downfrom65%)measuredROIfortheireventsthisyear.
Print and Digital Media & Trade Shows
Meetings & Incentive Travel is the most popular of the print media followed by Conference & Incentive Travel. Meetpie.com is the most popular of the digital media.
Upto57%ofeachsectordidnotattendanytradeshows.TheMeetingsShow was the most attended trade show, followed by Square Meal.
“29% of
associations
events and 34%
of corporate
events are
planned with
third party
assistance”

10 British Meetings & Events Industry Survey 2019
Satisfaction ratings, factors contributing to successful events and affecting events
Standard of conference facilities, Free Wi-Fi, service levels and staff understanding of needs were most highly rated. Understanding of meeting techniques, value for money (catering), technical and standard of bedrooms for associations are not rated as highly. Use of social media, new technologies and networking taking priority are all factors having an effect on events.
However, the single most important factor affecting events is costs and budgets.
Cancellations and current issues
6%ofassociationsand8%ofcorporatessaidrecentterroristactivityhadled to cancellation of events.
46%ofassociationsand48%ofcorporatessaidtheireventswillbeunaffectedbyBREXIT.However,just6%ofassociationsand3%ofcorporates said they feel positive about BREXIT for the future of their events.
36%ofassociationsand26%ofcorporatessaidthatGDPRwillaffectevent promotion or communication with participants.
17%ofcorporates(upfrom14%lastyear)and17%ofassociations(upfrom11%lastyear)saidtheyortheirdelegatesuseAirbnborothersharing economy providers.
Working in the events industry
Averageworkinghoursare42forassociationsand47forcorporates.63%ofassociationorganisersand59%ofcorporatessaytheyplantostayinthe events industry.

11British Meetings & Events Industry Survey 2019
Summary of key results per sector as at October 2018 Corporate Associations Sector Sector
Mean number of events per organiser 31 (34) 23 (32)
Percentage expecting to organise more events in next 12 months 39 28
Percentage residential events 34 (35) 28 (27)
Average number of delegates
At MAIN annual event 368 (238) ((276)) 403 (292) ((384))
At other events 130 (79) ((97)) 121 (86) ((153))
Average lead times 7 months 9 months
Average budgeted daily delegate rate £58.71 (£52.39) £51.78 (£43.62)
Average budgeted 24-hour delegate rate £157.21 (£151.05) £135.62 (£127.55)
Average annual budget for events £191,346 (£188,043) £160,043 (£131,151)
Percentage change in budget anticipated next 12 months +7.5% -7.5%
Preferred venues City centre hotels
Preferred venue incentive Added value items
Percentage of events with third party assistance assistance 34 (27) 29 (35)
Most popular printed media Meetings & Incentive Travel
Most popular digital media Meetpie.com
Most attended trade show The Meetings Show
Most used UK cities London, Birmingham, Manchester, Leeds, Glasgow
Key factors influencing venue & destination selection Access, location, price, capacity of conference facilities
Percentage of events with reference to convention bureaus 27 (11) 21 (18)
Percentage that had held events outside the UK 51 (45) 27 (26)
Most popular European country (outside UK) France
Percentage measuring ROI for events 52 (65) 53 (45)
Single most important factor currently affecting events Costs/budgets
Percentage using sharing economy providers 17 (14) 17 (11)
Percentage who cancelled events due to terrorist activity 8 6
Percentage planning to stay in the events industry 59 63
Average hours worked per week by respondents 47 42
Percentage saying BREXIT negotiations will NOT affect their events 48 (82) 46 (75)
Last year’s figure shown in brackets, 2016 in double brackets
12 British Meetings & Events Industry Survey 2019
0% 10% 20% 30% 40% 50% 60%
Corporates
Associations
Access (road, rail links)
Location (area of country)
Price/value for money
Capacity of conference facilities
Availability
Quality of conference facilities
Free WiFi
Quality of service
Quality of food
Style of venue that suits organisation
Previous experience of venue
Parking on site
Cleanliness of venue
Dedicated technical support
Internal/external perceptions of the venue
and/or destination
Relationship with venue staff
Quality of bedrooms
Reputation
Compliance with your industry criteria
Staff awareness of needs
Technical capability and expertise of staff
Meeting environmental and ‘green’ concerns
Leisure facilities
Recognised brand
Team building activities available
Security in venue or destination
Opportunity for CSR activities
Marketing campaign that caught your
attention
Knowledge capital and local academics/experts
Help with sponsorship or event partners
Key influencing factors 60.7%61.7%
54.8%63.1%
45.2%64.4%
43.7%42.3%
33.3%27.5%
31.1%22.8%
17.0%26.2%
21.5%16.1%
23.0%12.8%
18.5%12.1%
13.3%16.1%
11.9%14.1%
8.9%16.1%
8.1%8.1%
11.9%4.0%
7.4%7.4%
9.6%5.4%
8.9%4.7%
5.9%7.4%
5.2%2.0%
2.2%3.4%
70%
60%
50%
40%
30%
20%
10%
0%
26.7%
More Fewer No Change
Volume of events, change in last 12 months
19.8%21.3%
9.5%
53.5%
69.2%
Corporates
Associations
80%
70%
60%
50%
40%
30%
20%
10%
0%
10.3%
More Fewer No Change
Change in duration, last 12 months
6.1%9.6% 6.0%
83.6% 84.3%Corporates
Associations
50%
40%
30%
20%
10%
0%
34.3%
More Fewer No Change
13.3%
36.0%
11.6%
52.4% 52.4%
Corporates
Associations
Change in number of delegates, last 12 months
3.0%
3.7%1.3%
3.0%0.7%
2.2%0.0%
0.7%1.3%
1.5%0.7%
0.0%1.3%
0.0%0.7%
0.0%0.0%
2.7%
60%
50%
40%
30%
20%
10%
0%
38.7%
More Fewer No Change
Volume of events, change in next 12 months
9.2%
27.8%
6.8%
52.0%
65.4%
Corporates
Associations
25.7%
19.2%
Typical lead times
0% 5% 10% 15% 20% 25% 30% 35%
26.4%
25.0%
15.0%
5.0%
33.8%
11.3%
25.8%
4.0%
6.0%
Corporates
Associations Within 6 weeks
From 6 weeks to 3 months
From 3 to 6 months
From 6 to 12 months
From 12 to 24 months
More than 24 months2.9%
Full results for the associations/not-for-profit and corporate sectors
1. Volume of events held in previous twelve months & change anticipated for year ahead
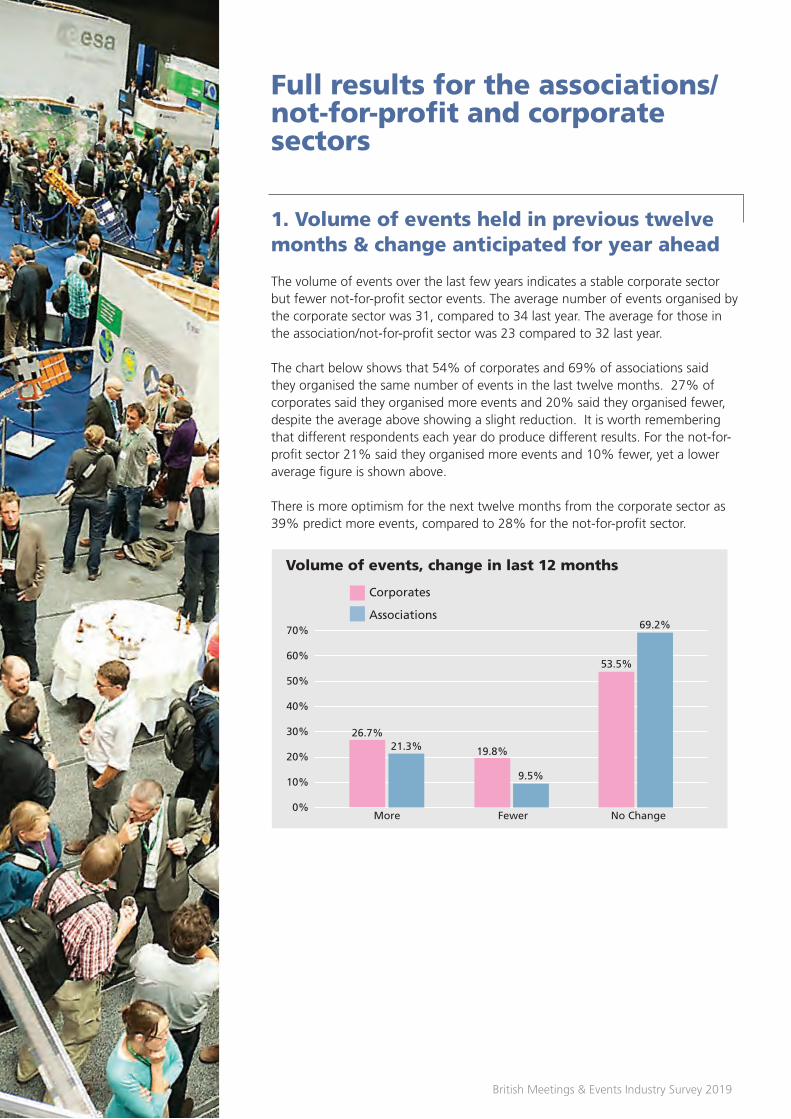
The volume of events over the last few years indicates a stable corporate sector but fewer not-for-profit sector events. The average number of events organised by the corporate sector was 31, compared to 34 last year. The average for those in the association/not-for-profit sector was 23 compared to 32 last year.
Thechartbelowshowsthat54%ofcorporatesand69%ofassociationssaidtheyorganisedthesamenumberofeventsinthelasttwelvemonths.27%ofcorporatessaidtheyorganisedmoreeventsand20%saidtheyorganisedfewer,despite the average above showing a slight reduction. It is worth remembering that different respondents each year do produce different results. For the not-for-profitsector21%saidtheyorganisedmoreeventsand10%fewer,yetaloweraverage figure is shown above.
There is more optimism for the next twelve months from the corporate sector as 39%predictmoreevents,comparedto28%forthenot-for-profitsector.

13British Meetings & Events Industry Survey 2019
0% 10% 20% 30% 40% 50% 60%
Corporates
Associations
Access (road, rail links)
Location (area of country)
Price/value for money
Capacity of conference facilities
Availability
Quality of conference facilities
Free WiFi
Quality of service
Quality of food
Style of venue that suits organisation
Previous experience of venue
Parking on site
Cleanliness of venue
Dedicated technical support
Internal/external perceptions of the venue
and/or destination
Relationship with venue staff
Quality of bedrooms
Reputation
Compliance with your industry criteria
Staff awareness of needs
Technical capability and expertise of staff
Meeting environmental and ‘green’ concerns
Leisure facilities
Recognised brand
Team building activities available
Security in venue or destination
Opportunity for CSR activities
Marketing campaign that caught your
attention
Knowledge capital and local academics/experts
Help with sponsorship or event partners
Key influencing factors 60.7%61.7%
54.8%63.1%
45.2%64.4%
43.7%42.3%
33.3%27.5%
31.1%22.8%
17.0%26.2%
21.5%16.1%
23.0%12.8%
18.5%12.1%
13.3%16.1%
11.9%14.1%
8.9%16.1%
8.1%8.1%
11.9%4.0%
7.4%7.4%
9.6%5.4%
8.9%4.7%
5.9%7.4%
5.2%2.0%
2.2%3.4%
70%
60%
50%
40%
30%
20%
10%
0%
26.7%
More Fewer No Change
Volume of events, change in last 12 months
19.8%21.3%
9.5%
53.5%
69.2%
Corporates
Associations
80%
70%
60%
50%
40%
30%
20%
10%
0%
10.3%
More Fewer No Change
Change in duration, last 12 months
6.1%9.6% 6.0%
83.6% 84.3%Corporates
Associations
50%
40%
30%
20%
10%
0%
34.3%
More Fewer No Change
13.3%
36.0%
11.6%
52.4% 52.4%
Corporates
Associations
Change in number of delegates, last 12 months
3.0%
3.7%1.3%
3.0%0.7%
2.2%0.0%
0.7%1.3%
1.5%0.7%
0.0%1.3%
0.0%0.7%
0.0%0.0%
2.7%
60%
50%
40%
30%
20%
10%
0%
38.7%
More Fewer No Change
Volume of events, change in next 12 months
9.2%
27.8%
6.8%
52.0%
65.4%
Corporates
Associations
25.7%
19.2%
Typical lead times
0% 5% 10% 15% 20% 25% 30% 35%
26.4%
25.0%
15.0%
5.0%
33.8%
11.3%
25.8%
4.0%
6.0%
Corporates
Associations Within 6 weeks
From 6 weeks to 3 months
From 3 to 6 months
From 6 to 12 months
From 12 to 24 months
More than 24 months2.9%
2. Number of delegates attending events
CorporatesFor corporates, the mean number of delegates at their annual conference at 368 is much higher than 238 last year and 276 in 2016, and for regular events is 130comparedto79lastyearand97in2016,yetonly34%saidtheyhadmoredelegates attending.
AssociationsThe average attendees at the main annual conference has increased to 403 comparedto292lastyearyetcloserto384in2016,with36%sayingtheyhadattracted more delegates. The mean number of attendees at their regular events is 121, higher than 86 last year yet closer to 153 in 2016. The subject matter (and other factors such as location and price as revealed later) for regular events is causing variations in how many delegates attend.
The uncertainty around many fields and markets currently may be resulting in more delegates attending events for both sectors with all looking for a steer on the future. Perhaps the fact there are fewer events taking place encourages more to attend?
“54% of
corporates
and 69% for
associations
said they
organised the
same number
of events in
the last twelve
months”
0% 10% 20% 30% 40% 50% 60%
Corporates
Associations
Access (road, rail links)
Location (area of country)
Price/value for money
Capacity of conference facilities
Availability
Quality of conference facilities
Free WiFi
Quality of service
Quality of food
Style of venue that suits organisation
Previous experience of venue
Parking on site
Cleanliness of venue
Dedicated technical support
Internal/external perceptions of the venue
and/or destination
Relationship with venue staff
Quality of bedrooms
Reputation
Compliance with your industry criteria
Staff awareness of needs
Technical capability and expertise of staff
Meeting environmental and ‘green’ concerns
Leisure facilities
Recognised brand
Team building activities available
Security in venue or destination
Opportunity for CSR activities
Marketing campaign that caught your
attention
Knowledge capital and local academics/experts
Help with sponsorship or event partners
Key influencing factors 60.7%61.7%
54.8%63.1%
45.2%64.4%
43.7%42.3%
33.3%27.5%
31.1%22.8%
17.0%26.2%
21.5%16.1%
23.0%12.8%
18.5%12.1%
13.3%16.1%
11.9%14.1%
8.9%16.1%
8.1%8.1%
11.9%4.0%
7.4%7.4%
9.6%5.4%
8.9%4.7%
5.9%7.4%
5.2%2.0%
2.2%3.4%
70%
60%
50%
40%
30%
20%
10%
0%
26.7%
More Fewer No Change
Volume of events, change in last 12 months
19.8%21.3%
9.5%
53.5%
69.2%
Corporates
Associations
80%
70%
60%
50%
40%
30%
20%
10%
0%
10.3%
More Fewer No Change
Change in duration, last 12 months
6.1%9.6% 6.0%
83.6% 84.3%Corporates
Associations
50%
40%
30%
20%
10%
0%
34.3%
More Fewer No Change
13.3%
36.0%
11.6%
52.4% 52.4%
Corporates
Associations
Change in number of delegates, last 12 months
3.0%
3.7%1.3%
3.0%0.7%
2.2%0.0%
0.7%1.3%
1.5%0.7%
0.0%1.3%
0.0%0.7%
0.0%0.0%
2.7%
60%
50%
40%
30%
20%
10%
0%
38.7%
More Fewer No Change
Volume of events, change in next 12 months
9.2%
27.8%
6.8%
52.0%
65.4%
Corporates
Associations
25.7%
19.2%
Typical lead times
0% 5% 10% 15% 20% 25% 30% 35%
26.4%
25.0%
15.0%
5.0%
33.8%
11.3%
25.8%
4.0%
6.0%
Corporates
Associations Within 6 weeks
From 6 weeks to 3 months
From 3 to 6 months
From 6 to 12 months
From 12 to 24 months
More than 24 months2.9%

14 British Meetings & Events Industry Survey 2019
3. Duration of events
84%ofeachsectorsaidthedurationoftheireventshadnotchanged.Although not asked in this year's survey, the average duration has previously been around 1.5 days for both sectors with many events non-residential as shown in the responses to the following question.
0% 10% 20% 30% 40% 50% 60%
Corporates
Associations
Access (road, rail links)
Location (area of country)
Price/value for money
Capacity of conference facilities
Availability
Quality of conference facilities
Free WiFi
Quality of service
Quality of food
Style of venue that suits organisation
Previous experience of venue
Parking on site
Cleanliness of venue
Dedicated technical support
Internal/external perceptions of the venue
and/or destination
Relationship with venue staff
Quality of bedrooms
Reputation
Compliance with your industry criteria
Staff awareness of needs
Technical capability and expertise of staff
Meeting environmental and ‘green’ concerns
Leisure facilities
Recognised brand
Team building activities available
Security in venue or destination
Opportunity for CSR activities
Marketing campaign that caught your
attention
Knowledge capital and local academics/experts
Help with sponsorship or event partners
Key influencing factors 60.7%61.7%
54.8%63.1%
45.2%64.4%
43.7%42.3%
33.3%27.5%
31.1%22.8%
17.0%26.2%
21.5%16.1%
23.0%12.8%
18.5%12.1%
13.3%16.1%
11.9%14.1%
8.9%16.1%
8.1%8.1%
11.9%4.0%
7.4%7.4%
9.6%5.4%
8.9%4.7%
5.9%7.4%
5.2%2.0%
2.2%3.4%
70%
60%
50%
40%
30%
20%
10%
0%
26.7%
More Fewer No Change
Volume of events, change in last 12 months
19.8%21.3%
9.5%
53.5%
69.2%
Corporates
Associations
80%
70%
60%
50%
40%
30%
20%
10%
0%
10.3%
More Fewer No Change
Change in duration, last 12 months
6.1%9.6% 6.0%
83.6% 84.3%Corporates
Associations
50%
40%
30%
20%
10%
0%
34.3%
More Fewer No Change
13.3%
36.0%
11.6%
52.4% 52.4%
Corporates
Associations
Change in number of delegates, last 12 months
3.0%
3.7%1.3%
3.0%0.7%
2.2%0.0%
0.7%1.3%
1.5%0.7%
0.0%1.3%
0.0%0.7%
0.0%0.0%
2.7%
60%
50%
40%
30%
20%
10%
0%
38.7%
More Fewer No Change
Volume of events, change in next 12 months
9.2%
27.8%
6.8%
52.0%
65.4%
Corporates
Associations
25.7%
19.2%
Typical lead times
0% 5% 10% 15% 20% 25% 30% 35%
26.4%
25.0%
15.0%
5.0%
33.8%
11.3%
25.8%
4.0%
6.0%
Corporates
Associations Within 6 weeks
From 6 weeks to 3 months
From 3 to 6 months
From 6 to 12 months
From 12 to 24 months
More than 24 months2.9%
4. Percentage of residential events
The mean percentage of events that were residential for the corporate sector was34%andforthenot-for-profitsectorwas28%.Thesepercentagesarevery similar to those for previous years.
5. Budgeted delegate rates (inclusive of VAT)
Associations saw their budgeted daily delegate rates increase to £51.78 from £43.62 last year and £48.93 in 2016. Budgeted 24-hour rates were also higher for associations, although the proportion of respondents who use them is very low, as many association delegates pay for their own accommodation.
Average budgeted daily rates for corporates increased to £58.71 - closer to the 2016 figure of £57.38 and up from £52.39 in 2017 despite reported changes averaging5.7%.Thisrateprobablyreflectsthepreferredvenueswithfewerextra costs to the delegate rate being charged at residential conference centres and the higher costs of luxury venues (see page 19), although later results show just how budget conscious all organisers remain (page 15). For corporates the 24-hour rate was also up this year to £157.21 from £151.05 but down on the figure for 2016.
Changes in budgeted daily delegate rates since 2016
Sector Daily Daily Daily 24-Hr 24-Hr 24-Hr 2018 2017 2016 2018 2017 2016
Corporates £58.71 £52.39 £57.38 £157.21 £151.05 £167.13
Associations £51.78 £43.62 £48.93 £135.62 £127.55 £147.88

15British Meetings & Events Industry Survey 2019
6. Annual budget for events
The average annual budget for corporate respondents increased slightly to £191,346 from £188,043 last year. The predicted budget change for the next twelvemonthsis+7.5%,amuchhigherfigurethanithasbeenforsometime,yet the focus on achieving value for money remains.
Associations/not-for-profit sector also saw their average annual events budget increase to £160,043 from £131,151 last year, possibly reflective of increased delegate numbers as association delegates pay for themselves at events unlike corporate delegates who are paid for by the organisation. However, the average predictedbudgetchangeforthenexttwelvemonthsis-7.5%.Itappearsthatthis year’s rise cannot be sustained. For the public sector in particular, budget cuts continue.
“The mean
percentage
of events
that were
residential for
the corporate
sector was
34% and for
the not-for-
profit sector
was 28%”
Average annual budgets for events
Sector Average annual Average annual Average annual budget 2018 budget 2017 budget 2016
Corporate £191,346 £188,043 £185,476
Associations £160,043 £131,151 £143,66877.1%
30.5%
27.1%
18.5%
21.2%
19.2%
11.3%
15.9%
11.9%
11.9%
6.6%
6.6%
6.0%
6.0%
5.3%
2.0%
Top UK destinations for the last 12 months
70.9%
27.9%
28.5%
16.4%
10.7%
10.7%
15.0%
6.4%
7.1%
9.9%7.1%
7.9%9.3%
3.6%
2.1%
7.1%
7.1%
6.4%
5.7%
5.3%3.6%
2.1%4.6%
7.1%
Corporates
Associations
11.9%
0% 10% 20% 30% 40% 50% 60% 70% 80%
60.7%
33.3%
45.2%
31.9%
38.5%
20.7%
12.6%
19.3%
18.5%
7.4%
Preferred Venue types
59.1%
45.0%
27.5%
29.5%
20.1%
34.2%
40.9%
17.4%
7.4%
14.1% Corporates
Associations
City centre hotel
Dedicated conference centre/management
training centre, residential
Luxury venue
Multi-purpose venue
Unusual venue
Purpose-built convention centre
University/Academic venue
Out-of-Town (Seaside/Country) hotel
Sporting venue
Business centre e.g. Regus
Airport hotel
0% 10% 20% 30% 40% 50% 60%
12.6%8.7%
2.9%
2.6%
London
Birmingham
Manchester
Leeds
Glasgow
Edinburgh
Bristol
Cardiff
Liverpool
Nottingham
Oxford
Belfast
Newcastle/ Gateshead
Cambridge
Brighton
Coventry
Leicester
Sheffield
York
Southampton
Aberdeen
Telford
Bournemouth
Harrogate
Jersey 2.0%
2.0%3.6%
4.3%
1.4%
0.7%
3.6%
75.0%
71.3%
69.5%
72.0%
71.5%
73.8%
68.3%
68.8%
59.5%
Satisfaction ratings
76.8%
72.2%
64.5%
73.1%
75.8%
68.8%
69.3%
61.7%
Corporates
Associations
Standard of conference facilities
AV facilities and support
Standard of bedrooms
Staff understanding
Service levels
Free WiFi
Value for money (catering)
Technical
Understanding of meeting techniques
50% 55% 60% 65% 70% 75% 80%
50%
40%
30%
20%
10%
0%
30.5%
11.9%
47.7%
9.9%
More Fewer No Change Don’t Know
Budget, change in last 12 months
38.4%
10.6%
43.0%
7.9%
Corporates
Associations
50%
40%
30%
20%
10%
0%
27.8%
11.3%
34.4%
26.5
More Fewer No Change Don’t Know
Budget, change in next 12 months
28.6%
9.3%
43.8%
14.8%
Corporates
Associations
73.5%
77.1%
30.5%
27.1%
18.5%
21.2%
19.2%
11.3%
15.9%
11.9%
11.9%
6.6%
6.6%
6.0%
6.0%
5.3%
2.0%
Top UK destinations for the last 12 months
70.9%
27.9%
28.5%
16.4%
10.7%
10.7%
15.0%
6.4%
7.1%
9.9%7.1%
7.9%9.3%
3.6%
2.1%
7.1%
7.1%
6.4%
5.7%
5.3%3.6%
2.1%4.6%
7.1%
Corporates
Associations
11.9%
0% 10% 20% 30% 40% 50% 60% 70% 80%
60.7%
33.3%
45.2%
31.9%
38.5%
20.7%
12.6%
19.3%
18.5%
7.4%
Preferred Venue types
59.1%
45.0%
27.5%
29.5%
20.1%
34.2%
40.9%
17.4%
7.4%
14.1% Corporates
Associations
City centre hotel
Dedicated conference centre/management
training centre, residential
Luxury venue
Multi-purpose venue
Unusual venue
Purpose-built convention centre
University/Academic venue
Out-of-Town (Seaside/Country) hotel
Sporting venue
Business centre e.g. Regus
Airport hotel
0% 10% 20% 30% 40% 50% 60%
12.6%8.7%
2.9%
2.6%
London
Birmingham
Manchester
Leeds
Glasgow
Edinburgh
Bristol
Cardiff
Liverpool
Nottingham
Oxford
Belfast
Newcastle/ Gateshead
Cambridge
Brighton
Coventry
Leicester
Sheffield
York
Southampton
Aberdeen
Telford
Bournemouth
Harrogate
Jersey 2.0%
2.0%3.6%
4.3%
1.4%
0.7%
3.6%
75.0%
71.3%
69.5%
72.0%
71.5%
73.8%
68.3%
68.8%
59.5%
Satisfaction ratings
76.8%
72.2%
64.5%
73.1%
75.8%
68.8%
69.3%
61.7%
Corporates
Associations
Standard of conference facilities
AV facilities and support
Standard of bedrooms
Staff understanding
Service levels
Free WiFi
Value for money (catering)
Technical
Understanding of meeting techniques
50% 55% 60% 65% 70% 75% 80%
50%
40%
30%
20%
10%
0%
30.5%
11.9%
47.7%
9.9%
More Fewer No Change Don’t Know
Budget, change in last 12 months
38.4%
10.6%
43.0%
7.9%
Corporates
Associations
50%
40%
30%
20%
10%
0%
27.8%
11.3%
34.4%
26.5
More Fewer No Change Don’t Know
Budget, change in next 12 months
28.6%
9.3%
43.8%
14.8%
Corporates
Associations
73.5%

16 British Meetings & Events Industry Survey 2019
0% 10% 20% 30% 40% 50% 60%
Corporates
Associations
Access (road, rail links)
Location (area of country)
Price/value for money
Capacity of conference facilities
Availability
Quality of conference facilities
Free WiFi
Quality of service
Quality of food
Style of venue that suits organisation
Previous experience of venue
Parking on site
Cleanliness of venue
Dedicated technical support
Internal/external perceptions of the venue
and/or destination
Relationship with venue staff
Quality of bedrooms
Reputation
Compliance with your industry criteria
Staff awareness of needs
Technical capability and expertise of staff
Meeting environmental and ‘green’ concerns
Leisure facilities
Recognised brand
Team building activities available
Security in venue or destination
Opportunity for CSR activities
Marketing campaign that caught your
attention
Knowledge capital and local academics/experts
Help with sponsorship or event partners
Key influencing factors 60.7%61.7%
54.8%63.1%
45.2%64.4%
43.7%42.3%
33.3%27.5%
31.1%22.8%
17.0%26.2%
21.5%16.1%
23.0%12.8%
18.5%12.1%
13.3%16.1%
11.9%14.1%
8.9%16.1%
8.1%8.1%
11.9%4.0%
7.4%7.4%
9.6%5.4%
8.9%4.7%
5.9%7.4%
5.2%2.0%
2.2%3.4%
70%
60%
50%
40%
30%
20%
10%
0%
26.7%
More Fewer No Change
Volume of events, change in last 12 months
19.8%21.3%
9.5%
53.5%
69.2%
Corporates
Associations
80%
70%
60%
50%
40%
30%
20%
10%
0%
10.3%
More Fewer No Change
Change in duration, last 12 months
6.1%9.6% 6.0%
83.6% 84.3%Corporates
Associations
50%
40%
30%
20%
10%
0%
34.3%
More Fewer No Change
13.3%
36.0%
11.6%
52.4% 52.4%
Corporates
Associations
Change in number of delegates, last 12 months
3.0%
3.7%1.3%
3.0%0.7%
2.2%0.0%
0.7%1.3%
1.5%0.7%
0.0%1.3%
0.0%0.7%
0.0%0.0%
2.7%
60%
50%
40%
30%
20%
10%
0%
38.7%
More Fewer No Change
Volume of events, change in next 12 months
9.2%
27.8%
6.8%
52.0%
65.4%
Corporates
Associations
25.7%
19.2%
Typical lead times
0% 5% 10% 15% 20% 25% 30% 35%
26.4%
25.0%
15.0%
5.0%
33.8%
11.3%
25.8%
4.0%
6.0%
Corporates
Associations Within 6 weeks
From 6 weeks to 3 months
From 3 to 6 months
From 6 to 12 months
From 12 to 24 months
More than 24 months2.9%
7. Lead times
Theaverageleadtimeforassociationsis9monthsalthough32%areorganisingtheir events with lead times of 12 months or longer. For corporates lead times average7monthsand56%ofcorporatesorganiseeventswithinsixmonths.
8. UK destinations for events in the last 12 months
Londonremainsthemostuseddestinationforbothcorporateandassociationsectors, with Birmingham in number two and Manchester in number three position,followedbyLeedsin4th(from7thlastyear)andGlasgowin5thposition.Cardiffat8thandLiverpool9tharethesameaslastyearbut Nottingham moves up to 10th from 12th. It is important to note that Leicester,Sheffield,SouthamptonandTelfordwereaddedintotheprompteddestinations this year resulting in position changes for other towns and cities.
The strong influence of infrastructure, accessibility and general appeal is clear together with universities with influential academics and ambassadors for associations. The high presence of corporate players in individual destinations also influences their position in the chart.
Many other destinations were mentioned by respondents including Cheltenham,Farnborough,Luton,MiltonKeynes,Peterborough,Windsor,and Watford plus regions such as West Midlands, Somerset, Northumberland, Yorkshire,Lancashire,CumbriaandMerseyside.

17British Meetings & Events Industry Survey 2019
“The average
lead time for
associations
is 9 months
although 32%
are organising
their events
with lead times
of 12 months or
longer”
77.1%
30.5%
27.1%
18.5%
21.2%
19.2%
11.3%
15.9%
11.9%
11.9%
6.6%
6.6%
6.0%
6.0%
5.3%
2.0%
Top UK destinations for the last 12 months
70.9%
27.9%
28.5%
16.4%
10.7%
10.7%
15.0%
6.4%
7.1%
9.9%7.1%
7.9%9.3%
3.6%
2.1%
7.1%
7.1%
6.4%
5.7%
5.3%3.6%
2.1%4.6%
7.1%
Corporates
Associations
11.9%
0% 10% 20% 30% 40% 50% 60% 70% 80%
60.7%
33.3%
45.2%
31.9%
38.5%
20.7%
12.6%
19.3%
18.5%
7.4%
Preferred Venue types
59.1%
45.0%
27.5%
29.5%
20.1%
34.2%
40.9%
17.4%
7.4%
14.1% Corporates
Associations
City centre hotel
Dedicated conference centre/management
training centre, residential
Luxury venue
Multi-purpose venue
Unusual venue
Purpose-built convention centre
University/Academic venue
Out-of-Town (Seaside/Country) hotel
Sporting venue
Business centre e.g. Regus
Airport hotel
0% 10% 20% 30% 40% 50% 60%
12.6%8.7%
2.9%
2.6%
London
Birmingham
Manchester
Leeds
Glasgow
Edinburgh
Bristol
Cardiff
Liverpool
Nottingham
Oxford
Belfast
Newcastle/ Gateshead
Cambridge
Brighton
Coventry
Leicester
Sheffield
York
Southampton
Aberdeen
Telford
Bournemouth
Harrogate
Jersey 2.0%
2.0%3.6%
4.3%
1.4%
0.7%
3.6%
75.0%
71.3%
69.5%
72.0%
71.5%
73.8%
68.3%
68.8%
59.5%
Satisfaction ratings
76.8%
72.2%
64.5%
73.1%
75.8%
68.8%
69.3%
61.7%
Corporates
Associations
Standard of conference facilities
AV facilities and support
Standard of bedrooms
Staff understanding
Service levels
Free WiFi
Value for money (catering)
Technical
Understanding of meeting techniques
50% 55% 60% 65% 70% 75% 80%
50%
40%
30%
20%
10%
0%
30.5%
11.9%
47.7%
9.9%
More Fewer No Change Don’t Know
Budget, change in last 12 months
38.4%
10.6%
43.0%
7.9%
Corporates
Associations
50%
40%
30%
20%
10%
0%
27.8%
11.3%
34.4%
26.5
More Fewer No Change Don’t Know
Budget, change in next 12 months
28.6%
9.3%
43.8%
14.8%
Corporates
Associations
73.5%

18 British Meetings & Events Industry Survey 2019
9. Events held in overseas destinations during last 12 months
51%ofcorporates(upfrom45%)and27%ofassociations(26%)saidtheyhad held events in overseas destinations over the last 12 months.
Of those respondents who had held events overseas, not all stated the countries they had held events in. For those who did, the top countries are listed in the table below with France, Germany and Spain at the top followed by Republic of Ireland and Netherlands.
Other countries mentioned are Turkey, Croatia, Ukraine, Russia, Greece, Finland, Hungary and Malta. A few respondents had also held events in Asia and the Middle East.
Percentage of all Association**
respondents who had held an event there
Top overseas countries*
* The table shows percentage of respondents using overseas countries who had held events in each country.
** Although this includes all not-for-profit sector respondents, the associations included are UK membership based and therefore lower levels of overseas destinations are to be expected. International associations meeting statistics are reported by the UIA and ICCA.
Percentage of all Corporate
respondents who had held an event there
France 36% 42%
Germany 34% 27%
Spain 27% 23%
Republic of Ireland 14% 35%
Netherlands 27% 19%
Italy 22% 12%
Switzerland 3% 23%
Sweden 9% 15%
Portugal 14% 8%
Denmark 6% 15%
Belgium 3% 15%
USA 14% 0%
Austria 3% 8%
18

19British Meetings & Events Industry Survey 2019
“
10. Preferred venue types
City centre hotels remain the most popular venue types followed by dedicated conference centres and luxury venues, despite concerns about compliance. Multipurpose venues and unusual venues are more popular than previous years – perhaps due to the rise in experiential events. Universities/academic venues and purpose-built convention centres are more popular with the not-for-profit sector.
51% of
corporates (up
from 45%)
and 27% of
associations
(26%) said they
had held events
in overseas
destinations
over the last
12 months”
77.1%
30.5%
27.1%
18.5%
21.2%
19.2%
11.3%
15.9%
11.9%
11.9%
6.6%
6.6%
6.0%
6.0%
5.3%
2.0%
Top UK destinations for the last 12 months
70.9%
27.9%
28.5%
16.4%
10.7%
10.7%
15.0%
6.4%
7.1%
9.9%7.1%
7.9%9.3%
3.6%
2.1%
7.1%
7.1%
6.4%
5.7%
5.3%3.6%
2.1%4.6%
7.1%
Corporates
Associations
11.9%
0% 10% 20% 30% 40% 50% 60% 70% 80%
60.7%
33.3%
45.2%
31.9%
38.5%
20.7%
12.6%
19.3%
18.5%
7.4%
Preferred Venue types
59.1%
45.0%
27.5%
29.5%
20.1%
34.2%
40.9%
17.4%
7.4%
14.1% Corporates
Associations
City centre hotel
Dedicated conference centre/management
training centre, residential
Luxury venue
Multi-purpose venue
Unusual venue
Purpose-built convention centre
University/Academic venue
Out-of-Town (Seaside/Country) hotel
Sporting venue
Business centre e.g. Regus
Airport hotel
0% 10% 20% 30% 40% 50% 60%
12.6%8.7%
2.9%
2.6%
London
Birmingham
Manchester
Leeds
Glasgow
Edinburgh
Bristol
Cardiff
Liverpool
Nottingham
Oxford
Belfast
Newcastle/ Gateshead
Cambridge
Brighton
Coventry
Leicester
Sheffield
York
Southampton
Aberdeen
Telford
Bournemouth
Harrogate
Jersey 2.0%
2.0%3.6%
4.3%
1.4%
0.7%
3.6%
75.0%
71.3%
69.5%
72.0%
71.5%
73.8%
68.3%
68.8%
59.5%
Satisfaction ratings
76.8%
72.2%
64.5%
73.1%
75.8%
68.8%
69.3%
61.7%
Corporates
Associations
Standard of conference facilities
AV facilities and support
Standard of bedrooms
Staff understanding
Service levels
Free WiFi
Value for money (catering)
Technical
Understanding of meeting techniques
50% 55% 60% 65% 70% 75% 80%
50%
40%
30%
20%
10%
0%
30.5%
11.9%
47.7%
9.9%
More Fewer No Change Don’t Know
Budget, change in last 12 months
38.4%
10.6%
43.0%
7.9%
Corporates
Associations
50%
40%
30%
20%
10%
0%
27.8%
11.3%
34.4%
26.5
More Fewer No Change Don’t Know
Budget, change in next 12 months
28.6%
9.3%
43.8%
14.8%
Corporates
Associations
73.5%

20 British Meetings & Events Industry Survey 2019
Did not attend any trade shows
The Meetings Show
Square Meal
International Confex
Other
World Travel Market
Conference & Hospitality Show
Academic Venue Show
EIBTM World, Barcelona
IMEX, Frankfurt
IMEX, America
Trade shows attended
0% 10% 20% 30% 40% 50% 60%
56.7%
15.8%
16.7%
9.2%
10.8%
3.3%
5.0%
1.7%
22.1%
19.1%
9.9%
3.8%
4.6%
2.3%
5.3%
Corporates
Associations
4.2%
2.5%
0.8%
1.5%
55.0%
Preferred venue incentives: 12 months to June 2018
Corporates
Associations
Added value items
Discounts on multiple bookings
Discounts on long-term contracts
Cash incentives
Incentive gifts/awards
Subvention available
Discounts on exchange rates
0% 10% 20% 30% 40% 50% 60% 70%
74.5%
68.1%
43.7%
17.0%
11.1 %
38.9%
27.5%
15.4%
6.7%
12.1%
4.4%
6.0%
6.7%
17.8 %
50.0%
51.7%
20.8%
12.5%
11.7%
Meetings & Incentive Travel
(M&IT)
Conference & Incentive Travel
(C&IT)
Do not read meetings industry
print media
Conference News
Event
Association Meetings
International
Conference & Meetings World
Other
Publications read or consulted regularly
0% 10% 20% 30% 40% 50%
33.6%
26.0%
19.1%
13.0%
9.9%
5.8%
8.4%
Corporates
Associations
Do not use meetings industry websites
meetpie.com
conference-news.co.uk
citmagazine.com
internationalmeetingsreview.com
amimagazine.global
Other
conworld.net
Digital media consulted
0% 10% 20% 30% 40% 50% 60% 70%
65.6%
49.2%
25.8%
10.0%
4.2%
2.5%
1.7%
0.0%
13.0%
11.5%
10.8%
0.8%
0.8%
0.8%
0.8%
Corporates
Associations
9.2%
5.0%
6.1%
0.0%
3.1%
0.0%
0.0%
11. Preferred venue incentives
Added value items remain the most popular incentive with both sectors – mentionedby75%ofassociations(upfrom57%lastyear)and68%ofcorporates(upfrom63%lastyear).Nextmostpopulararediscountsonmultiple bookings and discounts on long term contracts. The earlier results showed an increase in average daily delegate rates and this result shows more is expected to be included in these higher rates. Organisers dislike hidden costs or extras that they were not anticipating appearing on their invoices.
Subventionfromthedestinationorvenueismentionedby12%ofassociations–upfrom6%lastyear.
12. Key factors influencing venue & destination selection
The top influencing factors remain access, location and price. Capacity and quality of conference facilities are both more important this year, possibly influenced by increased delegate numbers and expecting value for money. Style of venue that suits the organisation (and this is followed through into compliance with industry criteria) is more important as is previous experience of venues. Availability is also rated more important than previous years.
It is interesting to see the low priority of security in the venue or destination despiterecentterroristactivity.Thelaterresultshowsthat6%ofassociationsand8%ofcorporatessaidthatrecentterroristactivityhadledthem to alter events (see page 27).
20

21British Meetings & Events Industry Survey 2019
0% 10% 20% 30% 40% 50% 60%
Corporates
Associations
Access (road, rail links)
Location (area of country)
Price/value for money
Capacity of conference facilities
Availability
Quality of conference facilities
Free WiFi
Quality of service
Quality of food
Style of venue that suits organisation
Previous experience of venue
Parking on site
Cleanliness of venue
Dedicated technical support
Internal/external perceptions of the venue
and/or destination
Relationship with venue staff
Quality of bedrooms
Reputation
Compliance with your industry criteria
Staff awareness of needs
Technical capability and expertise of staff
Meeting environmental and ‘green’ concerns
Leisure facilities
Recognised brand
Team building activities available
Security in venue or destination
Opportunity for CSR activities
Marketing campaign that caught your
attention
Knowledge capital and local academics/experts
Help with sponsorship or event partners
Key influencing factors 60.7%61.7%
54.8%63.1%
45.2%64.4%
43.7%42.3%
33.3%27.5%
31.1%22.8%
17.0%26.2%
21.5%16.1%
23.0%12.8%
18.5%12.1%
13.3%16.1%
11.9%14.1%
8.9%16.1%
8.1%8.1%
11.9%4.0%
7.4%7.4%
9.6%5.4%
8.9%4.7%
5.9%7.4%
5.2%2.0%
2.2%3.4%
70%
60%
50%
40%
30%
20%
10%
0%
26.7%
More Fewer No Change
Volume of events, change in last 12 months
19.8%21.3%
9.5%
53.5%
69.2%
Corporates
Associations
80%
70%
60%
50%
40%
30%
20%
10%
0%
10.3%
More Fewer No Change
Change in duration, last 12 months
6.1%9.6% 6.0%
83.6% 84.3%Corporates
Associations
50%
40%
30%
20%
10%
0%
34.3%
More Fewer No Change
13.3%
36.0%
11.6%
52.4% 52.4%
Corporates
Associations
Change in number of delegates, last 12 months
3.0%
3.7%1.3%
3.0%0.7%
2.2%0.0%
0.7%1.3%
1.5%0.7%
0.0%1.3%
0.0%0.7%
0.0%0.0%
2.7%
60%
50%
40%
30%
20%
10%
0%
38.7%
More Fewer No Change
Volume of events, change in next 12 months
9.2%
27.8%
6.8%
52.0%
65.4%
Corporates
Associations
25.7%
19.2%
Typical lead times
0% 5% 10% 15% 20% 25% 30% 35%
26.4%
25.0%
15.0%
5.0%
33.8%
11.3%
25.8%
4.0%
6.0%
Corporates
Associations Within 6 weeks
From 6 weeks to 3 months
From 3 to 6 months
From 6 to 12 months
From 12 to 24 months
More than 24 months2.9%
“
21
Added value
remains the
most popular
incentive with
both sectors”

22 British Meetings & Events Industry Survey 2019
14. Referral to convention bureaus 42%ofassociationssaidtheyuseconventionbureaus.Ofthese,10%(4%ofall associations) use them for all events all the time and amongst the others, on averagetheyareusedfor21%ofevents.
44%ofcorporatessaidtheyuseconventionbureaus.Ofthese,10%(4%ofallcorporates)usethemforalleventsandonaveragetheyareusedfor27%ofevents.
Percentage of events planned Corporate Association with third party assistance
None 25.8% 37.7%
Up - 10% 21.9% 17.4%
11% - 20% 7.0% 12.3%
21% - 30% 9.4% 8.7%
31% - 50% 9.4% 6.5%
51% - 60% 7.8% 4.3%
More than 60% 3.9% 2.2%
All 14.8% 10.9%
13. Percentage of events planned with third party assistance Onaverage29%ofassociations’eventsand34%ofcorporateeventsareplanned with third party assistance.
Upto15%ofeachsectorsaidtheyusethirdpartiestohelpwithalleventsyet38%ofassociationeventsand26%ofcorporateareplannedwithoutanyassistance.
Percentage of events referred Corporate Association to convention bureaus
Less than 15% 46.7% 60.3%
16% - 30% 18.3% 9.5%
31% - 50% 8.3% 9.5%
51% - 75% 6.7% 4.8%
76% - 99% 10.0% 6.3%
All 10.0% 9.5%

23British Meetings & Events Industry Survey 2019
15. How frequently do you use freelancers or outsource aspects of event organisation?
16. Measuring Return on Investment for events A higher percentage of the not-for-profit sector measured Return on Investment this year, which is to be expected when public money is used for many events and delegates pay to attend association events. However, a lower percentage of corporates are measuring ROI this year.
17. Meetings Industry Print and Digital Media consulted regularly
Meetings & Incentive Travel is the most popular print media closely followed by Conference & Incentive Travel.
66%ofassociationsand49%ofcorporatesdonotusemeetingsindustrywebsites.Meetpie.comismostpopularofthedigitalmediaandusedby26%ofcorporatesand13%ofassociations.
(It should be noted that Meetings and Incentive Travel’s database is used for this research).
Other media mentioned were Square Meal, Business Travel, Broadcast, Stand Out and other individual sector related publications.
“A higher
percentage of
the not-for-
profit sector
measured
Return on
Investment
this year”
Frequency of outsourcing for Corporate Association aspects of event organisation
Always 5% 2%
Regularly 9% 5%
Sometimes 24% 18%
Never 36% 53%
Do you measure ROI Corporate Association for your events?
Yes 52% (65%) 53% (45%)
No 48% (35%) 47% (55%)
See graphs overleaf....

24 British Meetings & Events Industry Survey 2019
Did not attend any trade shows
The Meetings Show
Square Meal
International Confex
Other
World Travel Market
Conference & Hospitality Show
Academic Venue Show
EIBTM World, Barcelona
IMEX, Frankfurt
IMEX, America
Trade shows attended
0% 10% 20% 30% 40% 50% 60%
56.7%
15.8%
16.7%
9.2%
10.8%
3.3%
5.0%
1.7%
22.1%
19.1%
9.9%
3.8%
4.6%
2.3%
5.3%
Corporates
Associations
4.2%
2.5%
0.8%
1.5%
55.0%
Preferred venue incentives: 12 months to June 2018
Corporates
Associations
Added value items
Discounts on multiple bookings
Discounts on long-term contracts
Cash incentives
Incentive gifts/awards
Subvention available
Discounts on exchange rates
0% 10% 20% 30% 40% 50% 60% 70%
74.5%
68.1%
43.7%
17.0%
11.1 %
38.9%
27.5%
15.4%
6.7%
12.1%
4.4%
6.0%
6.7%
17.8 %
50.0%
51.7%
20.8%
12.5%
11.7%
Meetings & Incentive Travel
(M&IT)
Conference & Incentive Travel
(C&IT)
Do not read meetings industry
print media
Conference News
Event
Association Meetings
International
Conference & Meetings World
Other
Publications read or consulted regularly
0% 10% 20% 30% 40% 50%
33.6%
26.0%
19.1%
13.0%
9.9%
5.8%
8.4%
Corporates
Associations
Do not use meetings industry websites
meetpie.com
conference-news.co.uk
citmagazine.com
internationalmeetingsreview.com
amimagazine.global
Other
conworld.net
Digital media consulted
0% 10% 20% 30% 40% 50% 60% 70%
65.6%
49.2%
25.8%
10.0%
4.2%
2.5%
1.7%
0.0%
13.0%
11.5%
10.8%
0.8%
0.8%
0.8%
0.8%
Corporates
Associations
9.2%
5.0%
6.1%
0.0%
3.1%
0.0%
0.0%
....continued from previous page

25British Meetings & Events Industry Survey 2019
“Meetpie.
com is most
popular of
the digital
media”
Did not attend any trade shows
The Meetings Show
Square Meal
International Confex
Other
World Travel Market
Conference & Hospitality Show
Academic Venue Show
EIBTM World, Barcelona
IMEX, Frankfurt
IMEX, America
Trade shows attended
0% 10% 20% 30% 40% 50% 60%
56.7%
15.8%
16.7%
9.2%
10.8%
3.3%
5.0%
1.7%
22.1%
19.1%
9.9%
3.8%
4.6%
2.3%
5.3%
Corporates
Associations
4.2%
2.5%
0.8%
1.5%
55.0%
Preferred venue incentives: 12 months to June 2018
Corporates
Associations
Added value items
Discounts on multiple bookings
Discounts on long-term contracts
Cash incentives
Incentive gifts/awards
Subvention available
Discounts on exchange rates
0% 10% 20% 30% 40% 50% 60% 70%
74.5%
68.1%
43.7%
17.0%
11.1 %
38.9%
27.5%
15.4%
6.7%
12.1%
4.4%
6.0%
6.7%
17.8 %
50.0%
51.7%
20.8%
12.5%
11.7%
Meetings & Incentive Travel
(M&IT)
Conference & Incentive Travel
(C&IT)
Do not read meetings industry
print media
Conference News
Event
Association Meetings
International
Conference & Meetings World
Other
Publications read or consulted regularly
0% 10% 20% 30% 40% 50%
33.6%
26.0%
19.1%
13.0%
9.9%
5.8%
8.4%
Corporates
Associations
Do not use meetings industry websites
meetpie.com
conference-news.co.uk
citmagazine.com
internationalmeetingsreview.com
amimagazine.global
Other
conworld.net
Digital media consulted
0% 10% 20% 30% 40% 50% 60% 70%
65.6%
49.2%
25.8%
10.0%
4.2%
2.5%
1.7%
0.0%
13.0%
11.5%
10.8%
0.8%
0.8%
0.8%
0.8%
Corporates
Associations
9.2%
5.0%
6.1%
0.0%
3.1%
0.0%
0.0%
18. Meetings Industry Trade shows attended
Upto57%ofeachsectorsaidtheydidnotattendmeetingsindustrytrade shows.
Of those that were attended The Meetings Show was the most popular, attendedby16%ofcorporatesand22%ofassociations.SquareMealwasnextmostpopularattendedby17%ofcorporatesand19%ofassociationsandInternationalConfexwasattendedbyupto10%ofeach sector.
Many other shows were mentioned including BNC, Marketing Week, Cvent Connect, ITM, Media Production, Visit Scotland Expo and trade shows in their own fields such as Electrical Manufacturers Show.

26 British Meetings & Events Industry Survey 2019
19. Satisfaction ratings
The responses to views on satisfaction with the factors shown below have been weighted to illustrate those viewed most highly. These are standard of conference facilities, Free Wi-Fi, service levels and staff understanding of needs. Understanding of meeting techniques, value for money (catering), technical and standard of bedrooms for associations are not rated as highly.
77.1%
30.5%
27.1%
18.5%
21.2%
19.2%
11.3%
15.9%
11.9%
11.9%
6.6%
6.6%
6.0%
6.0%
5.3%
2.0%
Top UK destinations for the last 12 months
70.9%
27.9%
28.5%
16.4%
10.7%
10.7%
15.0%
6.4%
7.1%
9.9%7.1%
7.9%9.3%
3.6%
2.1%
7.1%
7.1%
6.4%
5.7%
5.3%3.6%
2.1%4.6%
7.1%
Corporates
Associations
11.9%
0% 10% 20% 30% 40% 50% 60% 70% 80%
60.7%
33.3%
45.2%
31.9%
38.5%
20.7%
12.6%
19.3%
18.5%
7.4%
Preferred Venue types
59.1%
45.0%
27.5%
29.5%
20.1%
34.2%
40.9%
17.4%
7.4%
14.1% Corporates
Associations
City centre hotel
Dedicated conference centre/management
training centre, residential
Luxury venue
Multi-purpose venue
Unusual venue
Purpose-built convention centre
University/Academic venue
Out-of-Town (Seaside/Country) hotel
Sporting venue
Business centre e.g. Regus
Airport hotel
0% 10% 20% 30% 40% 50% 60%
12.6%8.7%
2.9%
2.6%
London
Birmingham
Manchester
Leeds
Glasgow
Edinburgh
Bristol
Cardiff
Liverpool
Nottingham
Oxford
Belfast
Newcastle/ Gateshead
Cambridge
Brighton
Coventry
Leicester
Sheffield
York
Southampton
Aberdeen
Telford
Bournemouth
Harrogate
Jersey 2.0%
2.0%3.6%
4.3%
1.4%
0.7%
3.6%
75.0%
71.3%
69.5%
72.0%
71.5%
73.8%
68.3%
68.8%
59.5%
Satisfaction ratings
76.8%
72.2%
64.5%
73.1%
75.8%
68.8%
69.3%
61.7%
Corporates
Associations
Standard of conference facilities
AV facilities and support
Standard of bedrooms
Staff understanding
Service levels
Free WiFi
Value for money (catering)
Technical
Understanding of meeting techniques
50% 55% 60% 65% 70% 75% 80%
50%
40%
30%
20%
10%
0%
30.5%
11.9%
47.7%
9.9%
More Fewer No Change Don’t Know
Budget, change in last 12 months
38.4%
10.6%
43.0%
7.9%
Corporates
Associations
50%
40%
30%
20%
10%
0%
27.8%
11.3%
34.4%
26.5
More Fewer No Change Don’t Know
Budget, change in next 12 months
28.6%
9.3%
43.8%
14.8%
Corporates
Associations
73.5%
Contributing factors Corporates Associations
Producing interesting events 1 51% 1 78% with relevant content
Content relevant to their work and daily life 2 39% 2 55%
Inspiring and original sessions/presentations 6= 20% 3 31%
Networking with peers and colleagues 3 33% 4 29%
Ease of access and travel 4 30% 5 24%
The (Quality of) venue 5 25% 6 19%
Cost of attending 9 12% 7 17%
Networking with industry experts 6= 20% 8 13%
Quality of service 10 7% 9= 12%
Food 8 14% 9= 12%
RANK
ING
RANK
ING
20. Top ten factors contributing to a successful event for delegates
Producing interesting events with relevant content was rated most highly as contributing to success by both sectors.
26

27British Meetings & Events Industry Survey 2019
“The single
biggest factors
affecting
events
currently are
COSTS and
BUDGETS
followed by
attendance
and attracting
delegates”
21. Factors affecting events
The use of social media before and during events, new technologies and the
priority of networking over content are the factors most being felt.
Percentage of Percentage ofFactors affecting events Corporates Associations feeling the affect feeling the affect
Using social media to raise awareness and interest before the event 63% 79%
Using social media during the event 64% 71%
Making content available online after the event 65% 66%
New technologies adding creative options for events 61% 57%
Networking taking priority over content 61% 56%
Online content extending audience reach 59% 57%
Compliance issues 55% 50%
Less formal approach with delegates driving content on the day 53% 50%
More focus on ROI for the cost of the event 54% 42%
Procurement department involvement in appointing suppliers 55% 38%
CSR and sustainability focus for the event 48% 40%
Health and safety factors 48% 39%
Risk assessments 47% 37%
Factors highlighted in red are those where more than 60% of the sector selected it
22. Single most important factor affecting their events
The single biggest factors affecting events currently are COSTS and BUDGETS followed by attendance and attracting delegates. BREXIT, GDPR and having enough time plus availability were also mentioned.
23. Cancellation of events due to recent terrorist activity
When asked whether recent terrorist activity had led to cancellation of events 6%ofassociationsand8%ofcorporatessaidithad.

28 British Meetings & Events Industry Survey 2019
24. The BREXIT EffectWhen asked whether BREXIT is likely to affect the volume or nature of their events, results were as shown below. There are far fewer respondents saying their events will be unaffected than last year. They have instead opted to say they don’t know. This uncertainty seems to have influenced many other results of the survey.
Is BREXIT likely to affect the Corporates Association volume or nature of events
Yes, an increase 4% 9%
Yes, a decrease 13% 12%
No, my events will be unaffected 48% 46%
Don't know 35% 33%
Corporates
Do not feel it will have a major impact on events
Negative and Positive aspects
Not sure whether it will be positive or negative but will impact
Organising events in Europe, it will lead to increased costs as we will no longer be able to claim back VAT
Associations
It will depend very much on the final format of the trade deals, the market suffering will impact on attendance particularly at our large biennial trade show, but we will need to run events to support our members with information on how the situation will affect their businesses
May affect audience numbers in the UK
No effect unless BREXIT increases costs
Slightly negative about everything related to BREXIT
How did you vote in the Corporates Association referendum?
Remain 39% 42%
Exit 3% 6%
Prefer not to say 18% 22%
D/K or didn’t answer 40% 30%
Feelings on impact of BREXIT Corporates Association for future events?
Positive 3% 6%
Negative 22% 15%
Don’t know 40% 47%
Other or didn’t answer 35% 32%
Comments made:
28

29British Meetings & Events Industry Survey 2019
“63% of
association
organisers
and 59% of
corporates
said they
plan to stay
in the events
industry”
EU GDPR affect? Corporates Association
Yes, a little 18% 27%
Yes, a lot 8% 9%
No, not at all 31% 31%
D/K or didn’t answer 43% 33%
27. Use of sharing economy providers
17%ofcorporates(upfrom14%lastyear)and17%ofassociations(upfrom11%lastyear)saidtheyortheirdelegatesuseAirbnborothersharingeconomy providers.
28. Hours worked per week
When asked how many hours they work each week including travel time and working on site, the average was 42 for associations and 47 for corporates.
29. Working in the events industry
Respondents were asked “Do you plan to stay working in the events industry or leave?”
63%ofassociationorganisersand59%ofcorporatessaidtheyplantostayintheeventsindustry,7%ofassociationsand4%ofcorporatessaidtheyplantoleave.Thissuggestsover30%ofeachsectorarenotsure.
Is your business now Corporates Association GDPR compliant?
Yes 60% 63%
No 3% 2%
We’re still working on it 5% 6%
D/K or didn’t answer 32% 29%
25. Will the EU General Data Protection Regulation affect your event promotion/communication with participants in 2018?
26. Is your business now GDPR compliant?

30 British Meetings & Events Industry Survey 2019
Glossary of Terms/Definitions
Buyer/conference organiserA person within the company or association who has responsibility for venue selection and organisational tasks related to conferences and meetings
Meeting/conferenceAn event involving eight or more people for a minimum of four hours during one day or more, occupying a venue outside the company’s own premises
Management meetingA meeting for the board or management to discuss company-related issues
Sales conferenceA gathering of the sales force to discuss sales issues such as targets, new strategy, marketing plans or to review performance
Training courseAn event for employees to learn/update skills or approach to specific aspects of their job
PresentationAn event held specifically for internal or external audiences to receive information rather than participate
Product launchFor communication of new product information to either internal (e.g. dealers) or external (customer) audiences
AGMAnnual general meeting held to inform shareholders and/or members of company/organisation about progress
Daily delegate rateIncludes the following:-
Morning coffee and biscuits, lunch, afternoon tea with biscuitsMeeting room hire 8.30am-5.30pmVAT
24-hour delegate rateIncludes all of the above plus:-
Overnight accommodation Breakfast and dinner
PCO Professional conference/congress organiser
D/K, N/A Don’t know / not answered
GLO
SSA
RY

31British Meetings & Events Industry Survey 2019
SU
RV
EY
The British Meetings & Events Industry Survey 2019
QuestionnaireAs an organiser of conferences and meetings on behalf of your organisation, your expert opinion will be invaluable to us in collating The British Meetings & Events Industry Survey 2019. We know you are busy but would ask that you please take a few minutes to answer our questions.
What's in it for you? There are two good incentives:
•Thefirstisyouwillbeenteredintoaprizedrawtowina£500vouchertospend at John Lewis.
•Thesecondisreliableandquotabledataandtrendsuponwhichyoucanbenchmark your current and future activities such as venue rates and expenditure. A free copy of the report will be made available to you as a corporate or association based event planner. This can help you negotiate better with suppliers and it can also help you with internal discussions, such as your budgets, choice of venue, travel costs etc.
The Right Solution analyse the survey on behalf of CAT Media and it is sponsored by ICC Birmingham, Stuttgart Convention Bureau and The Meetings Show. It will tell us what is really happening in the events industry and the results will be available to you in November. The British Meetings & Events Industry Survey is the definitive quantitative and trends survey in the events industry.
Many thanks for your participation.
1. In order to be entered into the prize draw and to receive your complimentary copy of the report when published, you must have completed the questionnaire fully and will need to provide the following details:
Name:
Job Title:
Organisation:
Telephone number:
Email address:
Website:
2. Please specify which of the following sectors is the most appropriate description for your organisation?
Professional or trade association Governmental or public sector Other not-for-profit sector Corporate Third party (PCO, event management company, venue finder etc)
Other (please specify) .........................................................................

32 British Meetings & Events Industry Survey 2019
3. How many conferences or meetings did you organise in the 12 months ending June 2018?
1 - 3 7 - 9 21 - 30 41 - 50 4 - 6 10 - 20 31 -40 51+
4. How does this compare with the 12 months ending June 2018? More Fewer The same
5. Howmanyeventsareyoulikelytoorganiseinthenext12months(toJune2019)?
More Fewer The same
6. In the 12 months to June 2018, how many delegates attended your MAIN annual event?
1-25 101-200 401–500 1501–2000 26–50 201–300 501–1000 2000+
51–100 301–400 1001–1500
7. And OTHER events? Please use the number that is most typical of your events
1-25 101-200 401–500 1501–2000 26–50 201–300 501–1000 2000+
51–100 301–400 1001–1500
8. In the last 12 months has the number of delegates attending your events: Increased Decreased Stayed the same
9. In the last 12 months has the typical duration of your events: Increased Decreased Stayed the same
10. What percentage of your events are residential? None 51to75% Lessthan15% 76to99% 16to30% All 31to50%
11. Has this percentage increased or decreased in the last 12 months? Increased Decreased Stayed the same
12. WhatareyouraverageDAILYbudgeteddelegaterates(venuecostsperhead including meeting room hire, coffee/tea and lunch per person), inc. VAT?
Lessthan£30 £71 - £80 £31 - £40 £81 - £90 £41 – £50 £91 - £100 £51 – £60 More than £100 (please specify) £61 - £70 ............................................................ 13. Whatareyouraverage24HOURbudgeteddelegaterates(venuecostsper
head including accommodation, meeting room hire, coffee/tea and lunch per person) inc. VAT?
Not applicable £151 - £175 Lessthan£100 £176 - £200 £101 - £125 £201 - £225 £126 - £140 £226 - £250 £141 – £150 Not Applicable More than £250 (please specify) .........................................................
SU
RV
EY
32

33British Meetings & Events Industry Survey 2019
14. What is your annual budget for UK events this year? We are trying to establish the value of the UK conference/meetings market and it would bemosthelpfulifyoucouldtellushowmuch(approximately)youspend(budget)onconferences/meetingsintheUKintotalperyear?This information is confidential and will only be used collectively for averages
Up to £50,000 £401,000 - £500,000 £51,000 - £100,000 £501,000 - £600,000 £101,000 - £200,000 £201,000 - £300,000 More than £600,000 (please specify) £301,000 - £400,00 ......................................................... 15. Inthe12monthstoJune2018,didtheaveragebudgetforyourevents
increase or decrease compared to the previous year? Increased Stayed the same Decreased Don’t know
16. Pleasespecifythepercentagechangesincelastyear'sbudget(ifknown)
..............................................................................
17. Will your events budget for the next 12 months increase or decrease in comparison to the previous twelve months?
Increased Stayed the same Decreased Don’t know
18. Pleasespecifythepercentagechangeexpectedfornextyear'sbudget(ifknown)
..............................................................................
19. What is the typical lead time for your events - how far in advance do you book venues? Within 6 weeks From 6 to 12 months From 6 weeks to 3 months From 12 to 24 months 3 months to 6 months More than 24 months (please specify) ...................................................
20. HOW MANY events did you hold in the following UK destinations during the last 12 months? Please specify the number for each location.
Aberdeen Leicester Birmingham Liverpool Blackpool London Bristol Manchester Bournemouth Newcastle/Gateshead Brighton Oxford Belfast Nottingham Cambridge Sheffield Cardiff Southampton Coventry Telford Eastbourne Torquay Edinburgh York Glasgow Harrogate Elsewhere in the UK, (please specify) Jersey
............................................................... Leeds 21. Have you held events outside the UK in the last 12 months? Yes No

34 British Meetings & Events Industry Survey 2019
22. How many events have you held in the following European locations in the last 12 months? Total number of events in each
Austria Republic of Ireland Belgium Russia Croatia Spain Denmark Sweden France Switzerland Germany Turkey Greece Ukraine Italy Other European countries, Netherlands (please specify) Portugal ................................................
Africa, which country/ies ..................................................................
The Americas, which country/ies .......................................................
Asia, which country/ies .....................................................................
Australasia, which country/ies ...........................................................
Middle East, which country/ies ..........................................................
Elsewhere in the world, which country/ies ........................................
23. Which of the following venue types do you use most often for your events? Please tick all that apply.
Airport Hotel Business centre e.g. Regus City Centre Hotel Dedicated conference centre/management training centre, residential Luxuryvenue Multi-purpose venue Out-of-Town (Seaside/Country) Hotel Purpose-built convention centre Sporting Venue University/Academic Venue Unusual Venue Other venue type (please specify) ............................................................
24. For what percentage of your events do you refer to convention bureaus (UKorabroad)forinformationondestinations?
None 51to75% Lessthan15% 76to99% 16to30% All 31to50%
25. Whenbookingvenues,whichofthefollowingbookingincentivesappealto you the most? Please tick up to three of the options below.
Added value items within the costs agreed such as Audio Visual, organiser’s office Cash incentives Discounts on exchange rates Discounts on long-term contracts Discounts on multiple bookings Incentive gifts/awards Subvention available from the destination or venue Other (please specify) ............................................................................
SU
RV
EY
SU
RV
EY

35British Meetings & Events Industry Survey 201935
26. Which of the following key factors are most influential in your venue and destination selection? Please select UP TO five that apply most.
Other (please specify)............................................................................
Opportunity for CSR activities Parking on site Previous experience of venue Price/value for money Quality of bedrooms Quality of conference facilities Quality of food Quality of service Recognised brand Relationship with venue staff Reputation Security in venue or destination Staff awareness of needs Style of venue that suits organisation Team building activities available Technical capability and expertise of staff
Access (road, rail links) Availability Capacity of conference facilities Cleanliness of venue Compliance with your industry criteria Dedicated technical support Free WiFi Help with sponsorship or event partners Internal/external perceptions of the venue &/or destination Knowledge capital and local academics/experts Leisurefacilities Location(areaofcountry) Marketing campaign that caught your attention Meeting environmental and 'green' concerns
27. How would you rate your satisfaction with the following factors at the UK venues you used during the last 12 months
Excellent Very Good Satisfactory Poor
Standard of conferencefacilities (room layout etc.)
AV equipment / technicalfacilities and support
Standard of bedrooms atselected accommodation
Staff understanding ofconference organiser and delegate needs
Service levels
Availability of free WiFi
Value for money. Foodquality and catering standards
Technical and technologicalcapabilities
Understanding of newmeeting techniques (hybrid, social media etc.)
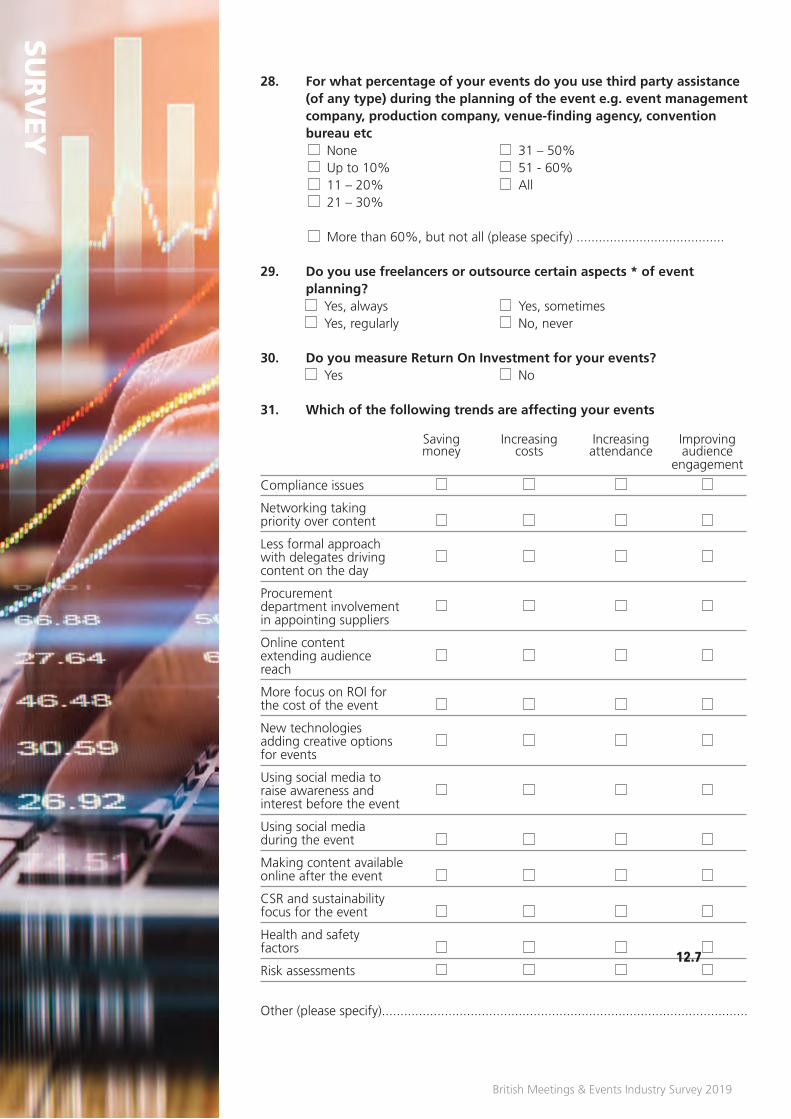
36 British Meetings & Events Industry Survey 2019
28. For what percentage of your events do you use third party assistance (ofanytype)duringtheplanningoftheevente.g.eventmanagementcompany, production company, venue-finding agency, convention bureau etc
None 31–50% Upto10% 51-60% 11–20% All 21–30% Morethan60%,butnotall(pleasespecify)........................................
29. Do you use freelancers or outsource certain aspects * of event planning?
Yes, always Yes, sometimes Yes, regularly No, never
30. Do you measure Return On Investment for your events? Yes No
31. Which of the following trends are affecting your events
Saving Increasing Increasing Improving money costs attendance audience engagement
Compliance issues
Networking taking priority over content
Lessformalapproach with delegates driving content on the day
Procurement department involvement in appointing suppliers
Online content extending audience reach
More focus on ROI for the cost of the event
New technologies adding creative options for events
Using social media to raise awareness and interest before the event
Using social media during the event
Making content available online after the event
CSR and sustainability focus for the event
Health and safety factors
Risk assessments
Other (please specify)...................................................................................................
SU
RV
EY
12.7
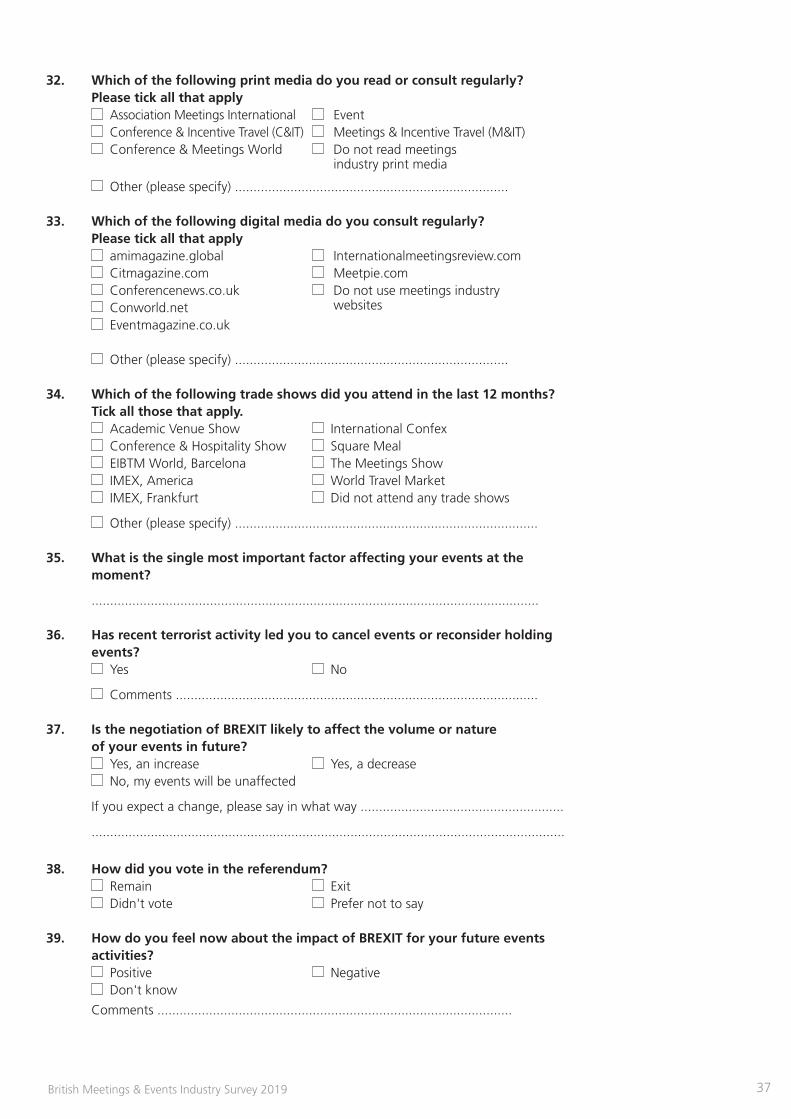
37British Meetings & Events Industry Survey 2019
32. Which of the following print media do you read or consult regularly? Please tick all that apply
Association Meetings International Event Conference & Incentive Travel (C&IT) Meetings & Incentive Travel (M&IT) Conference & Meetings World Do not read meetings
industry print media
Other (please specify) ..........................................................................
33. Which of the following digital media do you consult regularly? Please tick all that apply
amimagazine.global Internationalmeetingsreview.com Citmagazine.com Meetpie.com Conferencenews.co.uk Do not use meetings industry
Conworld.net websites Eventmagazine.co.uk Other (please specify) ..........................................................................
34. Which of the following trade shows did you attend in the last 12 months? Tick all those that apply.
Academic Venue Show International Confex Conference & Hospitality Show Square Meal EIBTM World, Barcelona The Meetings Show IMEX, America World Travel Market IMEX, Frankfurt Did not attend any trade shows
Other (please specify) .................................................................................. 35. Whatisthesinglemostimportantfactoraffectingyoureventsatthe
moment?
.........................................................................................................................
36. Has recent terrorist activity led you to cancel events or reconsider holding events?
Yes No
Comments ..................................................................................................
37. Is the negotiation of BREXIT likely to affect the volume or nature of your events in future?
Yes, an increase Yes, a decrease No, my events will be unaffected
If you expect a change, please say in what way .......................................................
................................................................................................................................
38. How did you vote in the referendum? Remain Exit Didn't vote Prefer not to say
39. How do you feel now about the impact of BREXIT for your future events activities?
Positive Negative Don't know
Comments ................................................................................................
12.7

38 British Meetings & Events Industry Survey 2019
40. Will the EU General Data Protection Regulation cause problems for your event promotion/communication with participants in 2018?
Yes, a little Yes, a lot No, not at all Don't know
41. Is your business now GDPR compliant? Yes No Don't know We're still working on it
42. Do you or your delegates use Airbnb or other sharing economy providers for accommodation for your events?
Yes No
Please list those you do use .......................................................................
43. Which of the following issues contribute most to a successful event from your delegates' point of view?
Please tick the three most important Producing interesting events with relevant content to the audience Content relevant to their work and daily life Inspiring and original sessions / presentations Celebrity keynote presenters Attractive destination The (quality ) of venue Food Entertainment Quality of accommodation Quality of service Ease of access and travel Networking with industry experts Networking with peers / colleagues Cost of attending Ability to add delegates virtually Extending communications before / during and after the event
44. On average, including travelling time and working on site, how many hours do you work each week?
................................................................................................................
45. Doyouplantostayworkingintheeventsindustryorleave–Ifyouwere to leave it, why would it be?
Stay in the events industry Leavetheeventsindustry
Please say why ..........................................................................................
SU
RV
EY

39British Meetings & Events Industry Survey 2019
The best in the business.Chris Jordan,Canada Business Events
“”
AG CHALLENGE ADVERT BMEIS.indd 1 21/11/2018 15:30:27

British Meetings & Events
INDUSTRY SURVEY 20 19
A definitive study of market trends based on interviews with leading British event organisers
Sponsored by:
Undertaken by:
The Right Solution Ltd
on behalf of: