2 the role of boundary-crossing in …thesis.library.caltech.edu/5929/19/chapter2.pdf2 the role of...
TRANSCRIPT

12
2 THE ROLE OF BOUNDARY-CROSSING IN
EPITHELIAL WOUND HEALING
Abstract
The processes of wound healing and collective cell migration have been studied for
decades. Intensive research has been devoted to understanding the mechanisms involved
in wound healing, but the role of cell-substrate interactions is still not thoroughly
understood. Here we probe the role of cell-substrate interactions by examining in vitro
the healing of monolayers of human corneal epithelial (HCE) cells cultured on artificial
extracellular matrix (aECM) proteins. We find that the rate of wound healing is
dependent on the concentration of fibronectin-derived (RGD) cell-adhesion ligands in the
aECM substrate. The wound closure rate varies nearly six fold on the substrates
examined, despite the fact that the rate of migration of individual cells shows little
sensitivity to the RGD concentration (which varies 40-fold). To explain this apparent
contradiction, we study collective migration by means of a dynamic Monte-Carlo
simulation. The cells in the simulation spread, retract, and proliferate with probabilities
obtained from a simple phenomenological model. Results of the simulation reveal that
the overall wound closure rate is determined by the probability of crossing the boundary
between the matrix deposited underneath the cell sheet and the aECM protein.
Manuscript prepared for submission by Eileen Fong1, Shelly Tzlil,2 and David A. Tirrell1,2
(1) Department of Bioengineering, California Institute of Technology
(2) Division of Chemistry and Chemical Engineering, California Institute of Technology

13
2.1 Introduction
The collective migration of cells is fundamental to wound healing, morphogenesis
and many bioengineering applications. Wound healing in particular involves the
migration of cell sheets over adhesive surfaces. Two mechanisms of migration have been
identified in wound healing (1). First is the “purse string” mechanism where a marginal
actomyosin cable develops along the wound edge, and wound closure proceeds with
contraction of the actin belt (2). The second mechanism involves active spreading and
migration of cells at the wound edge, known commonly as “lamellipodial crawling”. The
latter mechanism is more commonly observed in vitro and has been characterized by
using scratch-wound models. In these models, cells experience an injury, which triggers
cell migration through various biochemical signaling events (3). It has also been argued
that the availability of free space is sufficient to initiate cell migration in the absence of
mechanical injury (4-6). Upon wounding, proliferation is up-regulated (7).
Adhesive cell-substratum interactions are required for sustained migration into the
wound area (8, 9). The rates of migration of individual cells are governed by surface
adhesivity in a biphasic fashion, at least under certain conditions (10). Surfaces modified
with adhesion ligands such as fibronectin (FN) (11, 12) and Arg-Gly-Asp (RGD)
peptides have been shown to facilitate wound healing, and it is reasonable to infer that the
observed increases in healing rates arise primarily from faster migration of individual
cells. We show here that other factors are more important.

14
The substrates used in this work were prepared from artificial extracellular matrix
(aECM) proteins that combine domains derived from fibronectin and elastin (15) (Figure
A1). We and others have shown that such aECM proteins can be crosslinked to yield
materials with elastic moduli similar to those of natural elastins (13-15), and that
presentation of the fibronectin-derived RGD sequence promotes cell spreading and
adhesion (16-18).
Wound healing was examined in monolayers of human corneal epithelial cells
(HCE) cultured on aECM protein substrates that present controlled, varying densities of
the RGD sequence. HCE cells undergo rapid re-epithelization in vivo (19). Both the α5β1
and αvβ3 integrins, which bind RGD, are up-regulated by wounding (20). Crosslinked
films with varying RGD densities were prepared by mixing aECM proteins containing
RGD and “scrambled” (RDG) domains. Substrates are identified by specifying the
percentage of the RGD protein in the film (e.g., 100% RGD).
2.2 Materials and methods
Protein expression and purification
Standard methods for cloning, bacterial growth, protein expression, sodium
dodecyl sulfate-polyacrylamide gel electrophoresis (SDS-PAGE), and Western blotting
were used to prepare and characterize aE-RGD and aE-RDG (16). Typical yields of
protein obtained from 10 L fermentation cultures were approximately 500 mg. The molar
masses of aE-RGD and aE-RDG were 34.8 kDa.

15
Preparation of spin-coated aECM Films
Round glass coverslips (12 mm diameter; No. 1, Deckgläser, Germany) were
sonicated in a mixture of ethanol and KOH for 15 min and rinsed several times with
distilled H2O. aECM protein solutions were prepared by dissolving mixtures of aE-RGD
and aE-RDG (100 mg/ml in ddH2O) for 3 4 h at 4 ºC. Protein solutions containing
2.5%, 5%, 20%, 35%, 50%, 70%, 75%, 80%, 90%, and 100% aE-RGD were prepared.
Bis[sulfosuccinimidyl] suberate (BS3) was used to crosslink the aECM protein substrates.
BS3 (2.0 mg; Pierce, Rockford, IL) was dissolved in 17 µl of sterile distilled H2O and
added to 150 l of protein solution, mixed, and centrifuged to remove bubbles. The
stoichiometric ratio of activated esters in BS3 to primary amines in the aECM proteins
was roughly 1:1. A 17 l volume of BS3-protein solution was then spin-coated on a 12
mm diameter round glass cover slip at 7000 rpm for 30 sec at 4 ºC. Each protein film was
stored overnight at 4 ºC before use.
Generation of aECM films containing boundaries
We prepared 100 µl of aECM protein solutions (25 mg/ml in distilled H2O)
containing 0%, 2.5%, 20%, 50%, and 100% aE-RGD and BS3 (0.29 mg in 2.5 µl ddH2O)
as previously described. The protein solution (17 µl) was spin-coated onto a 12 mm
diameter round glass coverslip at 5000 rpm 30 sec at 4 °C. Protein films were allowed to
dry overnight at 4 °C. Subsequently, 600 µl of aECM protein solution (15 mg/ml) was
mixed with 1.725 mg of BS3 dissolved in 12.75 µl distilled H2O. A small volume (2 µl)
of the second aECM protein solution was pipetted across the middle of the film and spin-

16
coated at 5000 rpm for 30 sec at 4 °C. Under these conditions, an interface was generated
between two distinct surface chemistries.
Characterization of substrates by atomic force microscopy (AFM)
Images and force curves were collected on an Asylum MFP-3D-BIO atomic force
microscope, with accompanying IGOR Pro v.5.05 software. Pyramidal-tipped silicon
nitride cantilevers (Veeco DNP-S) with nominal spring constant 0.58 N/m were used for
imaging. The tip of a pair of fine forceps was drawn lightly across the surface of the
protein film, prepared as described above, tearing away the protein along the scratch and
exposing the underlying glass substrate. The edge of the scratch was imaged by AFM
both dry and in water, and the thickness of the film was determined. Scans were made at
various positions along the scratch to obtain an average measurement. The average film
thickness was calculated by averaging the height measurements obtained from 5
positions, using the revealed glass as a baseline. Thicknesses measured on three separate
films were averaged.
For nanoindentation studies, tips with 600 nm SiO2 microspheres attached at the
tip end (Novascan Technologies, IA) were used (14). Protein films with pre-determined
thicknesses were immersed in water for at least 1 h at room temperature to allow
equilibrium water uptake. Both the films and the cantilever assembly were submerged in
water under ambient conditions during nanoindentation. Force curves were collected; the
instrument records z (piezo) displacement and force, the product of measured tip
deflection and cantilever spring constant. The maximum indentation force was set to 50

17
nN relative to the contact point. The tip speed was 1 µm/sec, and data were collected at
0.5 Hz.
The spring constants of the tips used for nanoindentation were determined to be
about 0.3 N/m using thermal calibration in water. The Dimitriadis model (21) for
indentation of linear-elastic soft material films of finite height with a spherical indenter
was applied to the loading force data. Only force-indentation points between 20 nm and
10% maximum indentation were used to constrain the data to the near-linear response
range. The elastic modulus was obtained by averaging the calculated moduli at multiple
points in three separate films.
Human corneal epithelial (HCE) cell culture
Primary human corneal epithelial cells were obtained from ScienCell Research
Laboratories (San Diego, CA, #6510) and Cascade Biologics (Portland, OR, #C-019-5C).
All cells were maintained in serum-free EpiLife culture medium (with 60 M CaCl2,
Cascade Biologics) supplemented with Human Corneal Growth Supplement (HCGS
containing bovine pituitary extract, bovine insulin, hydrocortisone, bovine transferring,
and mouse epidermal growth factor, Cascade Biologics). Gentamicin (10 g/ml) and
amphotericin (0.25 g/ml) were also added to culture media. Serum-free EpiLife medium
was used in all experiments to exclude extracellular matrix proteins (i.e., fibronectin,
laminin) present in serum. Cells between passages 2 to 7 were used.

18
Cell spreading
Aliquots (500 l) of FN and BSA solutions were added to the wells of a
transparent 24-well plate (Falcon BD, VWR, Batavia, IL) and allowed to adsorb
overnight at 4 ºC. In these experiments, fibronectin (FN, 10 g/ml in PBS, Chemicon,
MA) was used as a positive control and bovine serum albumin (BSA, 2 mg/ml in PBS,
Sigma) was used as a negative control. Subsequently, wells were rinsed twice with pre-
warmed PBS solution and blocked with 500 l of 0.2 wt% heat-inactivated BSA solution
at room temperature for 30 min. At the same time, coverslips containing spin-coated
aECM protein films were mounted in empty wells by dotting sterile grease around the
circumference of the coverslips. Gentle pressure was applied to ensure firm adhesion to
the well. Finally, all wells were rinsed twice with pre-warmed PBS solution.
HCE cells were enzymatically passaged using 0.05 % Trypsin-0.25 % EDTA
(Cascade Biologics). To each well, 4.8 x 10⁴ cells were added together with 1 ml of fresh
EpiLife medium. The plates were swirled gently to prevent clustering of cells and placed
in an incubator at 37 ºC under 5% CO2/95 % air. Images of five random positions in each
well were acquired after 4 hours. 200 cells were traced for each surface using ImageJ and
their areas were recorded. Cells with projected areas above 300 m2 (based on the
average cell areas on BSA) were considered spread and the percentage of spread cells
was plotted for each surface.

19
Wound healing
The experimental setup was adapted from Nikolić et al. with modifications (6).
Slabs of polydimethylsiloxane (PDMS; Dow Corning, Midland, MI) were cast to 0.3 mm
thickness according to the manufacturer’s instructions. Briefly, PDMS was mixed at 10:1
PDMS base/curing agent ratio, poured into a 100 mm petri dish to 0.3 mm height,
degassed in a desiccator for at least 1 h and baked for at least 2 h at 65 C. Blocks of
PDMS with lateral dimensions roughly 2 mm x 2 mm were cut with a sterile scalpel,
sterilized with ethanol and air-dried. Use of thin (0.3 mm) blocks of PDMS allowed cells
to maintain confluence across the edge of the block and prevented contact between cells
and the underlying substrate surface.
The PDMS blocks were placed at the center of the coverslips containing spin-
coated aECM films. These coverslips were then subsequently mounted in 24-well tissue
culture plates by using sterile vacuum grease (Dow Corning, Midland, MI). To all wells,
500 l of FN was added overnight at 4 C to cover the entire surface to aid cell adhesion.
The next day, 2 x 10⁵ primary HCE cells were seeded into each well and allowed to grow
to confluence in 3 5 days. The medium was changed every two days. Once a confluent
monolayer formed, the PDMS blocks were lifted with sterile tweezers, creating a
wounded cell sheet. A schematic drawing of the experimental set up is shown in Figure
2.2A.
Each well was rinsed twice with fresh medium before the start of each experiment
to remove any cell debris. Meanwhile, a chamber was set up around the microscope to
maintain the microscope stage and chamber interior at 37 ºC with 5% CO2/95% air to

20
sustain cells. A hole was made in the cover of one of the empty wells in the 24-well plate
and the air supply was attached to ensure that cells were maintained under the CO2/air
mixture. Water was also added to surrounding empty wells to prevent excessive
evaporation of the medium. Wound closure was followed for 30 h by time-lapse phase
contrast microscopy on a Nikon Eclipse TE300 microscope at 10 x magnification. Digital
images of at least 5 different spots of the wound edge for each substrate were acquired
every 15 min using MetaMorph v6.3.2 (Molecular Devices, Sunnyvale, CA).
The wound areas immediately after wounding (t = 0 h) and after 30 h (t = 30 h)
were traced manually using ImageJ v1.37 (NIH, USA, http://rsb.info.nih.gov/ij/). The
difference in the two areas was then divided by the length of the wound edge to yield the
distance traveled by the cell sheet. This distance was then divided by the total time (30 h)
to give the wound closure rate. The overall wound closure rates were obtained by
averaging the wound closure rates calculated from all the videos obtained from more than
three independent experiments.
Cell tracking was performed to explain the differences in overall wound closure
behaviors observed on surfaces with different RGD densities. Individual cells within the
cell sheet were also tracked manually using ImageJ, with MTrackJ, a plug-in created by
Meijering and colleagues at the University Medical Center Rotterdam, Netherlands
(http://www.bigr.nl/). Trajectories of individual cells were tracked frame by frame for the
last 10 h for each video. The average cell speed (m/min) of an individual cell was

21
determined by averaging the speeds calculated in each 15 min interval. Only the cells that
migrated on the test surface were included in the analysis.
The calculated cell speeds were slightly below the reported range of 60 80 µm/h
(19, 22). However, these differences could be characteristic of tissue culture monolayers
and the use of serum-free media.
Interface-crossing experiments
aECM surfaces containing substrate interfaces were mounted into the wells of a
24-well tissue culture plate. HCE cells (1 x 10⁴) were added to each well and allowed to
attach for 2 h at 37 °C at 5% CO2/ 95% air. Images of the interface at several positions on
the aECM film were acquired every 15 min for 24 h using phase contrast microscopy at
37 °C at 5% CO2/ 95% air.
Time-lapse videos were analyzed using ImageJ. We tracked cells that contacted
the interface and recorded the time spent at the interface before a “decision” was made
(i.e., the cell crossed the interface or moved away). We considered each encounter a
separate “event” (i.e., once the cell leaves the interface and re-contacts the interface
again, the timing restarts). The total amount of time spent at the interface and the
subsequent decision (i.e., to cross the interface or not) were recorded for at least 150
events for each condition.

22
Statistical analysis
For all experimental data, the statistical significance of differences was estimated by
analysis of variance followed by the Tukey test. Differences were taken to be significant
at P ≤ 0.05.
2.3 Results and discussion
Dehydrated films were determined to be in the range of 192.64 19.27 nm (n =
70) in thickness; hydrated films were 349.15 26.27 nm (n = 36) thick. Based on
measured height differences, water content in hydrated films was estimated to be
approximately 45%. The elastic modulus of a hydrated film was determined to be 0.24
0.06 MPa (n = 21), which falls within the range previously determined for films of
similar aECM proteins (14). There were no discernible physical differences between aE-
RDG and aE-RGD films with varying RGD concentrations.
HCE cells were allowed to spread on spin-coated aECM films containing varying
RGD densities. After 4 h, HCE cells were well-spread on crosslinked 100% RGD and on
adsorbed FN, but remained rounded on the scrambled control (0% RGD) and on adsorbed
BSA surfaces (Figures 2.1A D). To quantify these differences, projected areas of 250
cells were measured at each of several time points over a 4 h period. Cells with projected
areas larger than 300 µm2 were considered well-spread. The percentage of well-spread
cells on aECM films increased with RGD density (Figure 2.1E). Although some cells
eventually spread on the scrambled control substrate, spreading on the control surface
was likely a consequence of cellular secretion of ECM proteins (23, 24).

23
E
Figure 2.1 HCE cell spreading behavior on various substrates. Phase contrast images of HCE
cells after 4 h on crosslinked spin-coated aECM films prepared from 0% RGD (A) or 100% RGD
(B), adsorbed bovine serum albumin (BSA, C) and adsorbed fibronectin (FN, D). Scale bar = 100
m. (E) Percent well-spread cells after 4 h on spin-coated aECM films with varying RGD
densities. Error bars represent SEM.
Conventional scratch wound assays are limited by interference from proteins
deposited by cells removed from the wound. Recent work of Nikolić et al. (6) and others
(25) showed that removal of a PDMS barrier triggered cell responses similar to those
0
20
40
60
80
0 20 50 80 100
Per
cen
t w
ell-
spre
ad c
ells
% RGD
(A) 0% RGD (B)100% RGD
(C) BSA (D) FN

24
observed in scratch wound assays. Using a similar approach, we pre-coated glass
coverslips with the protein of interest and laid down a short PDMS slab to provide a
temporary platform for cell attachment. To facilitate cell attachment, fibronectin was
incubated in each well overnight prior to plating of HCE cells (Figure 2.2A). Removal of
the PDMS slab placed the edge of the wounded cell sheet in contact with the test surface.
HCE cells migrated collectively in the direction of the wound by lamellipodial
crawling on 100% RGD, consistent with previous reports (5, 26). On 2.5% RGD,
however, minimal advance of the cell sheet was observed, even though cells at the wound
edge were constantly extending protrusions (Figure 2.2B). Figure 2.3A shows the average
displacement of the cell sheet on various surfaces as a function of time. The overall
wound closure rate increases approximately 5.6-fold as the RGD density increases
(Figure 2.3B and Table A1). Individual cells within the cell sheet were also tracked for
the last 10 h of each video (Figure 2.3C). Cells were selected at random and only cells
that migrated on the test surface were included in the analysis. Surprisingly, the cells did
not migrate significantly faster on 100% RGD than on 2.5% RGD.

25
A B (1) 2.5% RGD (2) 100% RGD (3) 2.5% RGD (4) 100% RGD
0 h
10
h
18 h
30 h
C
Spreading
Retraction
Proliferation
PDMS peeled off Time Lapse
Microscopy
Images of wound edge were
acquired every 15 minutes aECM protein
exposed
aECM protein
Glass coverslip
PDMS
Fibronectin

26
Figure 2.2 (A) Schematic of wound healing experiment. Cross-linked aECM proteins were spin-
coated onto glass coverslips and mounted in tissue culture multi-well plates. A slab of PDMS was
laid on top of the protein film and fibronectin solution was allowed to adsorb overnight at 4 ºC to
aid cell attachment. HCE cells were grown to confluence and the PDMS was peeled off. The
protein film was rinsed twice with serum-free media and the wounded cell sheets were allowed to
migrate over the aECM protein. This process was monitored by time lapse microscopy. (B) Time
course wound healing on 2.5% RGD and 100% RGD substrates. (Panels 1 and 2) Experimental
images showing the progression of the wound edge on 2.5% and 100% RGD, respectively, at
various time intervals. (Panels 3 and 4) Comparative snapshots of wound edges for 2.5% RGD
and 100% RGD substrates. Cells that have divided are represented as red cells. The initial
positions of the wound edge (i.e., the position of the interface) are indicated by white lines in the
images at 30 h. (C) Schematic of the Monte-Carlo simulation. In the model, cells can either
spread with Ws to take up two lattice sites; retract to either one of the sites with Wr or undergo
proliferation with Wp.
This result was puzzling we expected the increase in wound closure rate with
RGD concentration to be a consequence of an increase in cell speed. How can the rate of
wound closure increase when cell speed does not? We imagined that the critical event
might be the “decision” made by each cell as it comes in contact with the test surface.
Does the cell cross to the test surface or retreat to the matrix deposited beneath the
confluent cell monolayer? If the rate of crossing depends on the adhesivity of the test
surface, it seemed likely that wound healing should occur more rapidly on surfaces
bearing higher RGD densities. In order to test this hypothesis, we performed computer
simulations of the healing process.

27
The surface was modeled as a 2D hexagonal lattice in which each lattice site was
either occupied by a cell or empty. Cell migration in the simulation proceeds via a two-
step mechanism; first, the cell spreads onto an adjacent lattice site, and then it retracts to a
single lattice site (Figure 2.2C). If retraction vacates the site occupied by the cell before it
spread, migration has occurred.
We define the x-axis as the axis perpendicular to the wound edge, and the initial
position of the wound edge (the boundary) as x = 0. Thus, in the initial configuration of
the simulation, cells occupy all the lattice sites whose x positions are smaller than zero,
and the rest of the sites are empty. As the simulation progresses, cells cross the boundary
into the wound area and the value of x at the wound edge position increases.
We denote the transition probabilities for spreading, retraction, and proliferation
by Ws, Wr, and Wp respectively. We use a simple model for spreading and retraction
behavior to estimate the values of Ws and Wr for the different surfaces, based on
experimental data (see supporting information for model details). Since FN is a major
component of the matrix deposited beneath the confluent monolayer, the probabilities for
spreading and retraction for lattice sites with x < 0 were taken to be those for FN. We
estimated the proliferation rate (Wp) by constructing rate equations according to the
simulation rules and solving them in the low cell concentration limit. The doubling time
was then compared to experimental data. Details of the simulation scheme can be found
in the supporting information of this chapter.

28
Experiment Simulation A D
B E
C F
0
100
200
300
400
0 10 20 30
Wo
un
d e
dg
e d
isp
lace
men
t (µ
m)
Time (h)
100%80%50%20%2.5%
0
100
200
300
400
0 10 20 30
Wo
un
d e
dg
e d
isp
lace
men
t (µ
m)
Time (h)
100%
80%
50%
20%
2.5%
0
2
4
6
8
10
12
0 20 40 60 80 100
Wo
un
d c
losu
re r
ate
(µm
/h)
% RGD
*
*
0
2
4
6
8
10
0 20 40 60 80 100
Wo
un
d c
losu
re r
ate
(µm
/h)
% RGD
0
0.2
0.4
0.6
0.8
1
1008050202.5
Ave
rag
e ce
ll sp
eed
s (µ
m/m
in)
% RGD
0
0.5
1
1.5
2
2.5
1008050202.5
Sin
gle
cel
l sp
eed
(µ
m/m
in)
% RGD
**
29
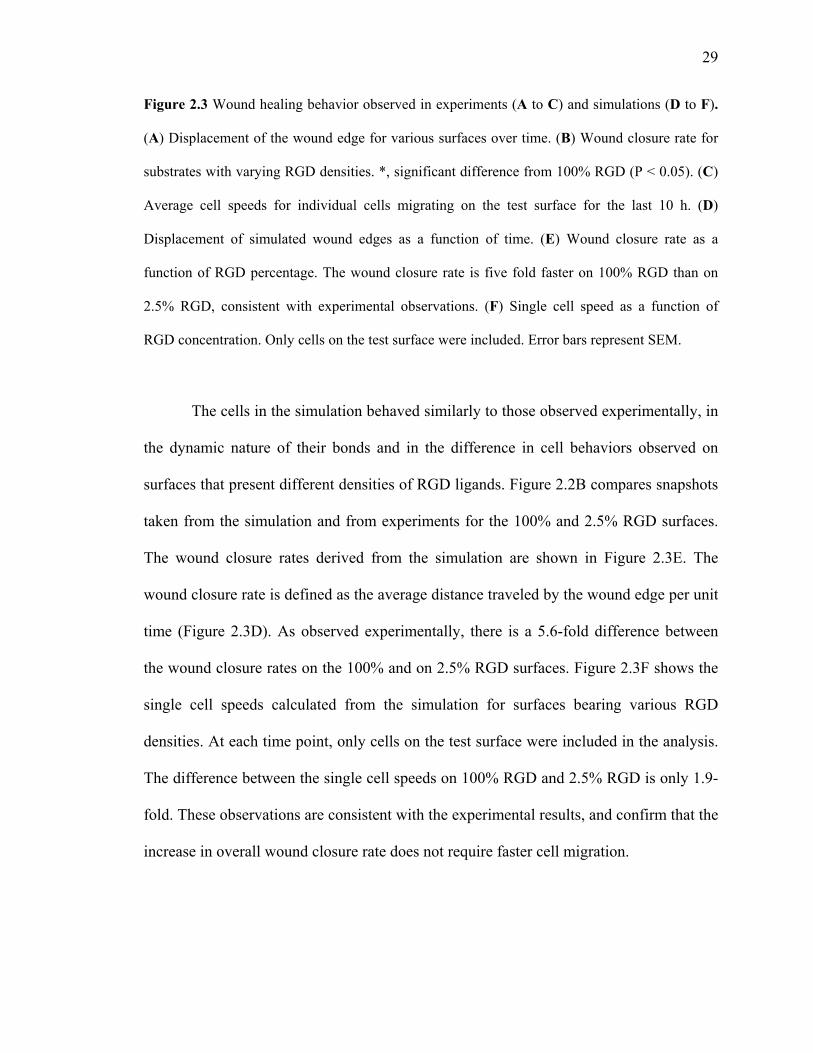
Figure 2.3 Wound healing behavior observed in experiments (A to C) and simulations (D to F).
(A) Displacement of the wound edge for various surfaces over time. (B) Wound closure rate for
substrates with varying RGD densities. *, significant difference from 100% RGD (P < 0.05). (C)
Average cell speeds for individual cells migrating on the test surface for the last 10 h. (D)
Displacement of simulated wound edges as a function of time. (E) Wound closure rate as a
function of RGD percentage. The wound closure rate is five fold faster on 100% RGD than on
2.5% RGD, consistent with experimental observations. (F) Single cell speed as a function of
RGD concentration. Only cells on the test surface were included. Error bars represent SEM.
The cells in the simulation behaved similarly to those observed experimentally, in
the dynamic nature of their bonds and in the difference in cell behaviors observed on
surfaces that present different densities of RGD ligands. Figure 2.2B compares snapshots
taken from the simulation and from experiments for the 100% and 2.5% RGD surfaces.
The wound closure rates derived from the simulation are shown in Figure 2.3E. The
wound closure rate is defined as the average distance traveled by the wound edge per unit
time (Figure 2.3D). As observed experimentally, there is a 5.6-fold difference between
the wound closure rates on the 100% and on 2.5% RGD surfaces. Figure 2.3F shows the
single cell speeds calculated from the simulation for surfaces bearing various RGD
densities. At each time point, only cells on the test surface were included in the analysis.
The difference between the single cell speeds on 100% RGD and 2.5% RGD is only 1.9-
fold. These observations are consistent with the experimental results, and confirm that the
increase in overall wound closure rate does not require faster cell migration.

30
The probability that a cell crosses the matrix boundary is given by its probability
to spread onto the RGD test surface multiplied by its probability to retract from the FN
surface, i.e., RGD FNs rW W . Hence, the ratio of the probabilities for crossing to the 100%
RGD and 2.5% RGD test surfaces is: PFN→100%RGD / PFN→2.5%RGD = Ws100%RGD/ Ws
2.5%RGD = 5.3.
The second equality was obtained from the spreading rates used in the simulation. As
explained in detail in the supporting information, we used the cell spreading assay data
(Figure 2.1E) to determine these rates. Hence, the 5.3-fold difference in crossing
probability arises from the 5.3-fold difference in the rate of cell spreading. Following the
same logic, we can also explain the small differences in cell speed observed on surfaces
with different RGD concentrations. The ratio between single cell migration rates on
100% and 2.5% RGD is Ws100%RGD Wr
100%RGD/ Ws2.5%RGD Wr
2.5%RGD = 1.8.
The simulation results suggest that the 5.6-fold variation in wound closure rates
observed experimentally arises primarily from variation in boundary-crossing rates
(Figure 2.5B and see supporting information, Figure A7). To measure boundary-crossing
rates directly, we prepared substrates by spin-coating one layer of aECM protein on top
of another (Figure 2.4). A typical surface used for studying the crossing probabilities was
imaged by AFM. The height of the step at the boundary was 119.2 ± 14 nm (n = 30).

31
Figure 2.4 Image of typical substrate with an interface imaged using an atomic force
microscope (left). A cross-section of the interface region is also shown (right).
Single HCE cells were seeded on these surfaces, and cells at the boundary were
followed by time-lapse microscopy. The total time in contact with the boundary and the
subsequent decision (i.e., to cross the boundary or not) were recorded for each cell. The
crossing rate was calculated by dividing the number of crossings by the total time in
contact with the boundary (see supporting information for crossing rate calculations).
The results confirm that the crossing rate increases 5.7-fold as the adhesivity of the
substrate increases (Figure 2.5C), supporting the hypothesis that the variation in wound
closure rate is determined primarily by variation in the rate of boundary crossing.

32
A B
C
Figure 2.5 (A) Schematic representation of boundary crossing. Black arrows represent relative
crossing rates for each condition. (B and C) show the rate constants of crossing, kc (from 100%
RGD to the test surfaces) for simulation and experimental data, respectively. In both curves, the
crossing rates from 100% RGD to 100% RGD and from 100% RGD to 2.5% RGD differ by a
factor of five. Error bars in C are experimental errors (see supporting information for this
chapter).
0
0.1
0.2
0.3
0.4
0.5
0.6
0 20 40 60 80 100
k c (m
in-1
)
Test surface (% RGD)
0
0.002
0.004
0.006
0.008
0.01
0 20 40 60 80 100
k c(m
in-1
)
Test surface (% RGD)
FN 2.5% RGD
“boundary”
FN 100% RGD
Experiment
‘boundary’
test
100%RGD
Simulation
100% RGD test

33
2.4 Conclusions
In summary, we find that the rate of healing of epithelial cell monolayers cultured
on aECM proteins increases with increasing density of adhesion ligands presented at the
substrate surface. As shown both experimentally and through simulation of the healing
process, the variation in healing rate arises not from variation in the rate of cell migration,
but instead from variation in the rate at which cells cross the boundary between the
matrix deposited by the cell monolayer and the aECM protein. The simulation method
described here can be applied to many cell types, and through variation in the cell-cell
interaction energy (see supporting information) captures a broad range of wound
healing behavior, from diffusion-like behavior in which cell-cell contacts break and
reform (as observed for corneal epithelial cells) to behavior that resembles that of an
elastic sheet in which cell-cell contacts remain unchanged during wound healing (as
observed in monolayers of MDCK cells (27)).
34
2.5 Acknowledgements
We acknowledge Drs. Julie Liu, Paul Nowatzki, and Stacey Maskarinec for help
with protein expression and cell culture. We also thank Dr. Zhen-Gang Wang for useful
advice on the simulation model. E.F. is supported by the Nanyang Overseas Scholarship,
Singapore; S.T. is supported by the Human Frontier Science Program Cross-Disciplinary
Fellowship. This work is funded by the NSF Center for the Science and Engineering at
Caltech and by NIH grant EB1971.
2.6 References
1. P. Martin, J. Lewis, Science 360, 179 (1992).
2. W. M. Bement, P. Forscher, M. S. Mooseker, J. Cell. Biol. 121, 565 (1993).
3. P. J. Sammak, L. E. Hinman, P. O. T. Tran, M. D. Sjaastad, T. E. Machen, J. Cell Sci. 110, 465 (1997).
4. M. Poujade et al., Proc. Natl. Acad. Sci. U.S.A. 104, 15988 (2007).
5. E. R. Block, A. R. Matela, N. SundarRaj, E. R. Iszkula,J. K. Klarlund, J. Biol. Chem. 279, 24307 (2004).
6. D. L. Nikolic, A. N. Boettiger, D. Bar-Sagi, J. D. Carbeck, S. Y. Shvartsman, Am. J Physiol. Cell Physiol. 291, 68 (2005).
7. G. J. Todaro, G. K. Lazar, H. Green, J. Cell Physiol. 66, 325 (1965).
8. K. Suzuki, J. Saito, R. Yanai, N. Yamada, T. Chikama, K. Seki, T. Nishida, Prog. Ret. Eye Res. 22, 113 (2003).
9. R. A. F. Clark, J. Invest. Dermatol. 94, 128S (1990).
10. S. P. Palecek, J. C. Loftus, M. H. Ginsberg, D. A. Lauffenburger, A. F. Horwitz, Nature 385, 537 (1997).
11. D. K. Pettit, A. S. Hoffman, T. A. Horbett, J. Biomed. Mater. Res. 28, 685 (1994).

35
12. R. van Horssen, N. Galjart, J. A. P. Rens, A. M. M. Eggermont, T. L. M. ten Hagen, J. Cell Biochem. 99, 1536 (2006).
13. L. Aucoin, C. M. Griffith, G. Pleizier,Y. Deslandes, H. Sheardown, J. Biomater. Sci. Polymer Edn. 13, 447 (2002).
14. P. J. Nowatzki, D. A. Tirrell, Biomaterials, 1261 (2003).
15. K. Di Zio, D. A. Tirrell, Macromolecules 36, 1553 (2003).
16. J. C. Liu, S. C. Heilshorn, D. A. Tirrell, Biomacromolecules 5, 497 (2003).
17. S. C. Heilshorn, K. A. Di Zio, E. R. Welsh, D. A. Tirrell, Biomaterials 24, 4245 (2003).
18. J. C. Liu, D. A. Tirrell, Biomacromolecules 9, 2984 (2008).
19. L. Luo, P. S. Reinach, W. W. Y. Kao, Exp. Biol. Med. Vol. 226, 653 (2001).
20. M. A. Stepp, Exp. Eye Res. 83, 3 (2006).
21. E. K. Dimitriadis, F. Horkay, J. Maresca, B. Kachar, R. S. Chadwick, Biophys. J. 82, 2798 (2002).
22. M. Zhao, B. Song, J. Pu, J. V. Forrester, C. D. McCaig, FASEB J. 17, 397 (2003).
23. M. D. M. Evans, J. G. Steele, J. Biomed. Mater. Res. 40, 621 (1997).
24. M. D. M. Evans, J. G. Steele, Exp. Cell Res. 233, 88 (1997).
25. K. Y. Chan, D. L. Patton, Y. T. Cosgrove, Invest. Opthalmol. Vis. Sci. 30, 2488 (1989).
26. R. Farooqui, G. Fenteany, J. Cell Sci. 118, 51 (2005).

36
ADDITIONAL INFORMATION FOR CHAPTER 2
A
M-MASMTGGQQMG-HHHHHHH-DDDDK (LD-YAVTGRGDSPASSKIA ((VPGIG)2VPGKG(VPGIG)2)4VP)3-LE
T7 tag His tag cleavage RGD cell-binding Elastin-like repeats
B
M-MASMTGGQQMG-HHHHHHH-DDDDK (LD-YAVTGRDGSPASSKIA ((VPGIG)2VPGKG(VPGIG)2)4VP)3-LE
Scrambled RGD
Figure A1. Amino acid sequences of aECM proteins containing (A) RGD and (B) RDG cell-
binding domains. Each aECM protein contained a T7 tag, a hexahistidine tag, an enterokinase
cleavage site, and elastin-like domains containing lysine residues (italicized) for crosslinking.
domain
site domain

37
Figure A2. Rate constants of interface crossing, kc from 100% RGD into various test
surfaces. The crossing probabilities computed for both configurations of the interface. There
were no significant differences between the rate constants for the two configurations of each test
surface, suggesting that the small “step” at the interface did not affect the boundary-crossing rate.
0
0.002
0.004
0.006
0.008
0.01
0 2.5 100
k c(m
in-1
)
% RGD
1
2
100%RGD
test
test
100% RGD

38
Mathematical model
A simple model for spreading and retraction
Figure A3. A schematic illustration of the cell spreading and retraction model. The beads
represent integrin receptor clusters, while the chain represents the cell membrane. The cell edge is
represented by the dashed line. Receptor clusters adjacent to the cell edge can adsorb or desorb
with rate constants ak and dk respectively.
We use a simplified picture for cell spreading and retraction in order to estimate
numerical values for the speed of these processes. In Fig. A3, the cell membrane is
modeled as a chain of beads which represent integrin receptors or clusters. Both
spreading and retraction advance through adsorption and desorption of receptor clusters
at the ligand-bearing surface. Only the receptor clusters adjacent to the cell edge
(represented by the dashed line in Fig. A3) can adsorb or desorb. The rate constants for
adsorption and desorption are ak and dk , respectively.
akdk
0 xak
dk
0 x0 x

39
During spreading and retraction, the cell edge performs a random walk where each
adsorption event results in an increase in its x position while each desorption event results
in a decrease in its x position.
The master equation, describing the processes discussed above, is of the form:
(1) ( , )
( 1, ) ( 1, ) ( ) ( , )a d a d
dP x tk P x t k P x t k k P x t
dt
where ( , )P x t is the probability of the cell edge to be at position x at time t, and x is
measured in units equal to the average distance between receptor clusters.
The solution for the average cell edge displacement is:
(2) ( )a dx k k t
An increase in x corresponds to an increase in the cell area in contact with the surface.
Therefore, we define the spreading rate, sW , as the change in the average value of x with
time:
(3) ( )s ss a d
d xW k k
dt
Similarly, the retraction rate, rW , is defined as:
(4) ( )r rr d a
d xW k k
dt
The forces exerted by the cell influence the effective rate of receptor adsorption and
desorption events ( ak and dk ). Since, the forces exerted by the cell are different when the

40
cell is in a state of spreading or retraction, the rate constants for adsorption and
desorption in these two cases will be different. Consequently, we add a superscript in
Equations 3 and 4 (s or r) to denote the cell state (spreading or retraction).
In a cell-free system with receptors incorporated in a rigid planar membrane, the binding
of the receptors to the surface ligands, can be described as a second order reaction.
Denoting the rate constant for binding by k and the rate constant for unbinding by 1k ,
the ratio between these rate constants is: 1 exp( / )Bk k k T where 0 is the
binding energy (the difference in energy between the unbound and bound states).
For the case of a flexible membrane, the spreading process is associated with a change in
membrane shape. The shape deformation results in an energy barrier which we denote by
el .
Spreading and retraction processes are not spontaneous and require forces to be applied
by the cell (1). In the case of spreading, a protrusive force is exerted on the cell
membrane, thereby reducing the energy barrier associated with membrane deformation in
an amount f where f is the force applied by the cell and is the length along which
the force is applied (2, 3). In this case the rate constants for adsorption and desorption in
our model are:
(5) exp( / / ), exp( / )s sa el B B d Bk k k T f k T k k k T

41
When retracting, the cell pulls on the receptor-ligand bond, thereby reducing the energy
barrier associated with bond breakage in an amount f (1, 2).
In this case, the rate constants take the form:
(6) exp( / ), exp( / / )r ra el B d B Bk k k T k k k T f k T
Following Equations 3 - 6, the rates for spreading and retraction can be expressed as:
(7) exp( / / ) exp( / )s el B B BW k k T f k T k k T
(8) exp( / / ) exp( / )r B B el BW k k T f k T k k T
Using equations 7 - 8, we can connect between the spreading and retraction rates on
surfaces with the same RGD fraction, RGD :
(9) ( ) exp( / ) ( ) exp( / ) ( )r RGD B s RGD el B sW f k T A W k k T W FN
In Equation 9, ( )sW FN denotes the spreading rate on fibronectin,
( ) ( ) ( )s RGD s RGD sW W W FN and ( ) ( ) ( )r RGD r RGD sW W W FN are the spreading and
retraction rates relative to the spreading rate on fibronectin and
exp( / / ) ( )el B B sA k k T f k T W FN .
We can use the results from the spreading assay (Fig. 2.1E) in order to get a numerical
value for the constant A. If we assume that the binding energy, is proportional to the
RGD fraction on the surface, i.e., RGD , we get

42
(10) exp /s RGD BW A B k T
where ( )sB k W FN .
The percent spread cells on aECM with different RGD concentrations after 4 h (shown in
Fig. 2.1E) relative to the percent of spread cells on FN after 4 h, was taken as a measure
for the relative rate of cell spreading, sW , and was fitted to Equation 10. The fit is shown
in Fig. A4.
Figure A4. The fit of the experimental spreading data to the theoretical expression for the
relative spreading rate, Equation 10.
Out of the fit we obtain 1.11A
0
0.1
0.2
0.3
0.4
0.5
0.6
0.7
0.8
0.9
0 0.2 0.4 0.6 0.8 1
φRGD
sW
43
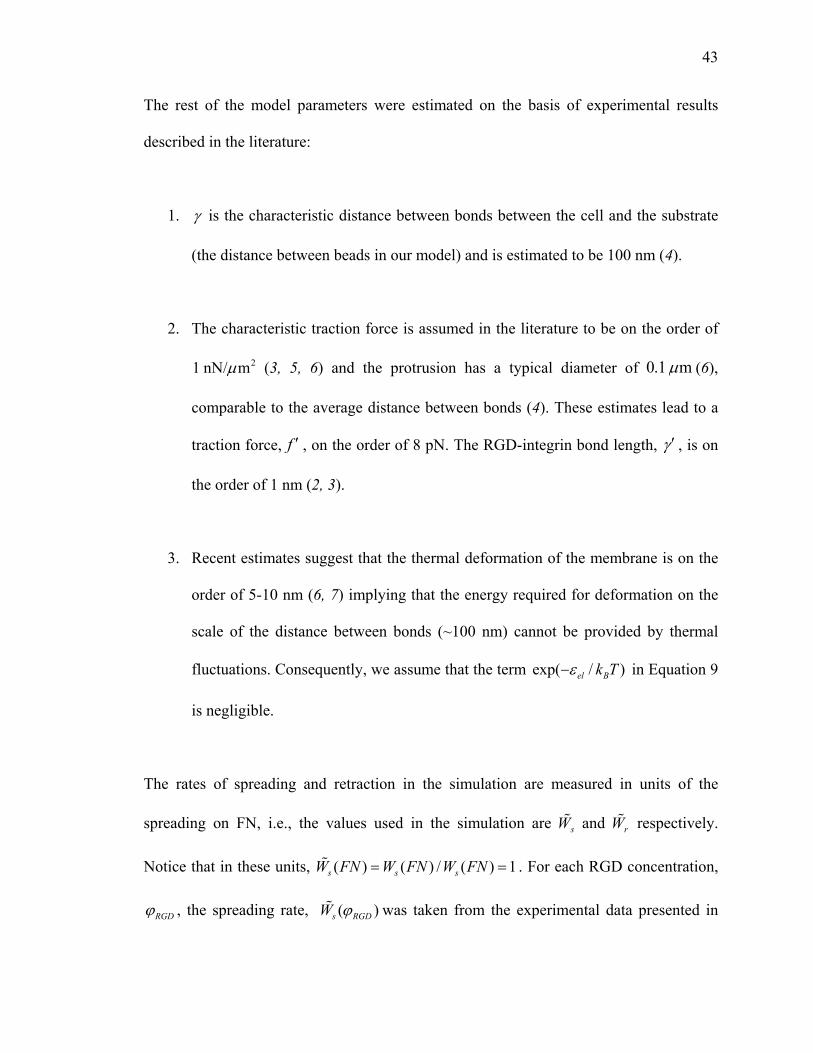
The rest of the model parameters were estimated on the basis of experimental results
described in the literature:
1. is the characteristic distance between bonds between the cell and the substrate
(the distance between beads in our model) and is estimated to be 100 nm (4).
2. The characteristic traction force is assumed in the literature to be on the order of
21 nN/ m (3, 5, 6) and the protrusion has a typical diameter of 0.1 m (6),
comparable to the average distance between bonds (4). These estimates lead to a
traction force, f , on the order of 8 pN. The RGD-integrin bond length, , is on
the order of 1 nm (2, 3).
3. Recent estimates suggest that the thermal deformation of the membrane is on the
order of 5-10 nm (6, 7) implying that the energy required for deformation on the
scale of the distance between bonds (~100 nm) cannot be provided by thermal
fluctuations. Consequently, we assume that the term exp( / )el Bk T in Equation 9
is negligible.
The rates of spreading and retraction in the simulation are measured in units of the
spreading on FN, i.e., the values used in the simulation are sW and rW respectively.
Notice that in these units, ( ) ( ) / ( ) 1s s sW FN W FN W FN . For each RGD concentration,
RGD , the spreading rate, ( )s RGDW was taken from the experimental data presented in

44
Fig. A4. The value for the retraction rate on the same surface, ( )r RGDW was calculated
using Equation 9.
Estimation of the proliferation rate
Figure A5. An illustration of the proliferation kinetic scheme. The white box represents an
empty neighboring lattice site on which the cell can spread in order to proliferate.
The number of cells confined to a single lattice site is denoted by 1n ( ); the number of
spread on two adjacent lattice sites by: 2n ( ). The empty square in Fig. A5
represents an empty neighboring site on the lattice. The rates for spreading, retraction and
proliferation steps are denoted by sW , rW and pW respectively.
In our model, only cells that are spread on two adjacent lattice sites can proliferate. This
assumption is consistent with the observation that decreased cell spreading can inhibit
proliferation signals (8), and it creates an effective time lag between consecutive cell
divisions, resembling inter-phase (9).
The rate equations for the kinetic scheme illustrated in Fig. A5 are:
s
r
W
W pW
s
r
W
W pW pW

45
(10) 11 1 1 2 2 2 2(1 ) 2s r p
dnW n n n n n W n W n
dt
(11) 21 1 1 2 2 2 2(1 )s r p
dnW n n n n n W n W n
dt
The first term is the rate of spreading, where the probability to find a neighboring empty
lattice site is taken to be the mean field probability, i.e., _ (1 )empty siteP where is the
fraction of occupied sites on the lattice and is given by 1 1 2 2n n n n where 1n is the
number of cells that occupy a single site when at confluence. Likewise, 2n is the number
of cells that occupy two adjacent sites at confluence.
The change in the total number of cells 1 2n n n is then:
(12) 1 22p
dn dndnW n
dt dt dt
Since for most cases, ,p r sW W W , we can assume fast equilibrium in order to solve the
rate equations (Equations 10 - 12). In the limit of low cell concentration ( *1 1 1n n ), we
get the expected exponential growth:
(13)
1
p
r
s
Wdnn
dt WW
The doubling time, Dt , for a cell population which grows according to the kinetic scheme
presented in Fig. A5 is:

46
(13) ln 21D r s
p
t W WW
According to the literature, the doubling time for human corneal epithelial (HCE) cells is
estimated to be 25 h (10). Using the values for Wr and Ws on FN, we get 10.05pW h .
We assume that pW is identical on all the surfaces.
Simulation details
We use a dynamic Monte Carlo scheme (11, 12) to simulate the dynamics of collective
cell migration. The surface is modeled as 100 100 hexagonal lattice with a lattice
constant of d = 50 µm, which is on the order of a cell diameter. At time t = 0, the first 10
columns of the lattice are occupied by cells (total number of cells, N = 1000), while the
rest of the lattice sites are empty. Since proliferation is enabled, N increases with time.
In every Monte Carlo step, N cells are chosen randomly and an attempt is made to change
their state according to the appropriate probabilities. As explained before, the spreading
rate on fibronectin (FN) in the simulation is defined as 1 and the rest of the rates are
calibrated accordingly. All the rates in the simulation are scaled to make sure that the
time steps are small enough so that in any Monte-Carlo (MC) step only one event can
occur. The conversion between simulation time and experimental time was done by a
one-time calibration, equating the wound closure rate for the case of 2.5% RGD obtained
from the simulation and from the experiment. Working backwards we get: 1 MC step
equals 0.15 min and -1( ) 0.54 minsW FN .

47
Cell-cell interactions
Wound healing behavior depends not only on cell-aECM interaction but also on the inter-
cellular interaction. The energy of a cell fluctuates, but unlike in a fluid, the origin of the
fluctuations is not collisions with the solvent or the thermal energy. The fluctuations in
energy in a cellular system originate from fluctuations around the steady state of the
biochemical networks of the cell (13). Consequently, it is accepted to define an effective
temperature /eff T BT F k where TF is the magnitude of the energy fluctuations and Bk is
the Boltzmann constant (14-16). As a result, the probability of a cell to have an energy
fluctuation is exp( / )TF .
In the simulation, we measure the intercellular interaction energy, cell cell , in units of TF
and use a value of / 1.0cell cell TF . The interaction energy between cells comes into play
in the simulation for the case of cell retraction. When a cell retracts, there is an active
force that pulls it from the surface and from its neighbors as explained in the model for
spreading and retraction (see section of model for spreading and retraction). This force
can either lead to cell-cell bond breakage or to retraction of the cell, pulling the
neighboring cell along.
Let us denote the number of neighbors that the cell in question would lose upon retraction
by . The cell can retract and break the bonds with its neighbors with probability
exp( / )r cell cell TW F . Or the cell can retract, break the bonds with -1 of its
neighbors and pull the remaining cells with it with probability 1exp( / )r cell cell TW F
.

48
A neighboring cell can only be stretched if it occupies a single lattice site. This is to
ensure that the total elastic energy of the cell does not exceed the cell fluctuation energy
FT.
Single cell crossing rates
When a cell is at the interface, it can either cross the interface with a rate constant, ck or
move away from the interface with a rate constant, bk as illustrated in the schematic
figure below.
Figure A6. Schematic diagram of cell at an interface, showing two possible outcomes. A cell
can cross the interface with a rate constant kc, or it can move away with a rate constant, kb.
From the time-lapse movies, we recorded the time spent by the cell at the interface until a
reaction occurs (i.e., waiting time), as well as the outcome (i.e. crossing or moving away).
In order to extract the rate constant for interface crossing from the experiment, it is
necessary to know the waiting time distribution for cells at the interface.
Let us define 0 0( ; )P t t as the probability that no event occurs in the interval 0 0( , )t t t and
assume that the events are independent and the rate constants do not depend on time.
ck
bk
ck
bk
interface

49
Then, 0 0 0 0( ; ) ( ; ) 1 ii
P t dt t P t t k dt
, where ik is the rate constant for event i (in
our case: ,i c b ).
Consequently, 0 0 0 00 0
( ; ) ( ; )( ; )i
i
P t dt t P t tk P t t
dt
And in the limit of 0dt , we get:
00
( )( )i
i
dP tk P t
dt
so that 0 ( ) exp i
i
P t k t
We denote the waiting time distribution as ( )w t . The waiting time distribution can be
expressed as:
0 00
( ) ( )( ) ( )
P t P t dt dw t P t
dt dt
and hence,
(14) ( ) expw t K Kt
where ii
K k is the sum of the rate constants for all possible events.
Using the waiting time distribution (Equation 14), the average waiting time is:

50
(15)
0
0
exp1
exp
t K Kt dt
tK
K Kt dt
In the case of the cell crossing experiment, the waiting at the interface can end with either
crossing of the interface ( ck ) or with bouncing back ( bk ) and thus, 1 ( )c bt k k .
If we define 1N as the number of events which end with interface crossing and N as the
total number of events, we get:
(16) c c
c b
N k
N k k
Using Equations 14-16, the rate constant of interface crossing can be expressed as:
(17) cc
Nk
N t
Notice, that according to Equation 17, the rate constant of interface crossing, kc can be
calculated as the number of crossing events divided by the total waiting time at the
interface.
The 15-min time interval between two consecutive time-lapse images is taken to be the
experimental error for the waiting time.

51
Figure A7. The rate constants of interface crossing from FN to test surfaces obtained from
simulation. The ratio between crossing rates from 100% RGD to 100% RGD and 100% RGD to
2.5% RGD is also five fold, consistent with experimental observations (Table A1).
0
0.04
0.08
0.12
0.16
0.2
0 20 40 60 80 100
k c (m
in-1
)
Test surface (% RGD)
FN test

52
Table A1. Summary of the rates for 100% and 2.5% RGD surfaces.
Simulation Experiment Surface composition (the line represents the wound
edge at time t=0) FN|RGD FN|RGD
Wound closure rate (µm/h) (100% RGD)
9.4 9.6
Wound closure rate (µm/h) (2.5% RGD)
1.7 1.7
Wound closure rate ratio (100% RGD/2.5% RGD)
5.6 5.6
Single cell speed ratio (100% RGD/2.5% RGD)
1.9 1.4
FN RGDP ratio (100% RGD/2.5% RGD)
4.7 5.7

53
References
1. D. A. Lauffenburger, Cell 84, 359 (1996).
2. G. I. Bell, Science 200, 618 (1978).
3. S. P. Palecek, A. F. Horwitz, D. A. Lauffenburger, Ann. Biomed. Eng. 27, 219 (1999).
4. T. R. Weikl, M. Asfaw, H. Krobath, B. Rozycki, R. Lipowsky, Soft Matter 5, 3213 (2009).
5. M. Prass, K. Jacobson, A. Mogilner, M. Radmacher, J. Cell Biol. 174, 767 (2006).
6. A. Pierres, V. Monnet-Corti, A. M. Benoliel, P. Bongrand, Trends in Cell Biol. 19, 428 (2009).
7. A. Zidovska, E. Sackmann, Phys. Rev. Lett. 96, 048103 (2006).
8. C. M. Nelson, C. S. Chen, FEBS Lett. 514, 238 (2002).
9. B. Alberts et al., Molecular Biology of the Cell. (Garland Science, 2008), pp. 637-655.
10. C. R. Kahn, E. Young, I. H. Lee, J. S. Rhim, Invest. Opthalmol. Vis. Sci. 34, 3429 (1993).
11. K. A. Fichthorn, W. H. Weinberg, J. Chem. Phys. 95, 1090 (1991).
12. C. H. Kang, W. H. Weinberg, Accts. Chem. Res. 25, 253 (1992).
13. B. C. Goodwin, Temporal Organization in Cells: A Dynamic Theory of Cellular Control Processes. (Academic Press, 1963), pp. 55-80.
14. D. A. Beysens, G. Forgacs, J. A. Glazier, Proc. Natl. Acad. Sci. U.S.A. 97, 9467 (2000).
15. A. Neagu, K. Jakab, R. Jamison, G. Forgacs, Phys. Rev. Lett. 95, 178104 (2005).
16. D. Drasdo, S. Hohme, Phys. Biol. 2, 133 (2005).