2. hydrometeorology - university of yamanashimagat dam halog dantor sto ... legend: rain gauge...
TRANSCRIPT

JICA Study on Disaster caused by the Typhoon No. 16 (Ondoy) and No. 17 (Pepeng)
2. HYDROMETEOROLOGY
2.1 Typhoon Tracks
Tropical Storm Ondoy entered the Philippine Area of Responsibility on September 24, 2009. Its entrance enhanced the southwest monsoon and brought rains to the Visayas and Central Luzon area. This caused severe rainfall over Metro Manila wherein normally one month of rain fell in just about six hours triggering knee-deep to roof-deep widespread flooding, power blackout and killing several hundreds of residents in the metropolis.
Just about a week after Ondoy, Tropical Storm Pepeng battered Central and Northern Luzon.
The tracks of these two typhoons are shown in Figure 2.1 and 2.2, respectively.
2.2 Locations of Rainfall and Water Level Stations in Luzon
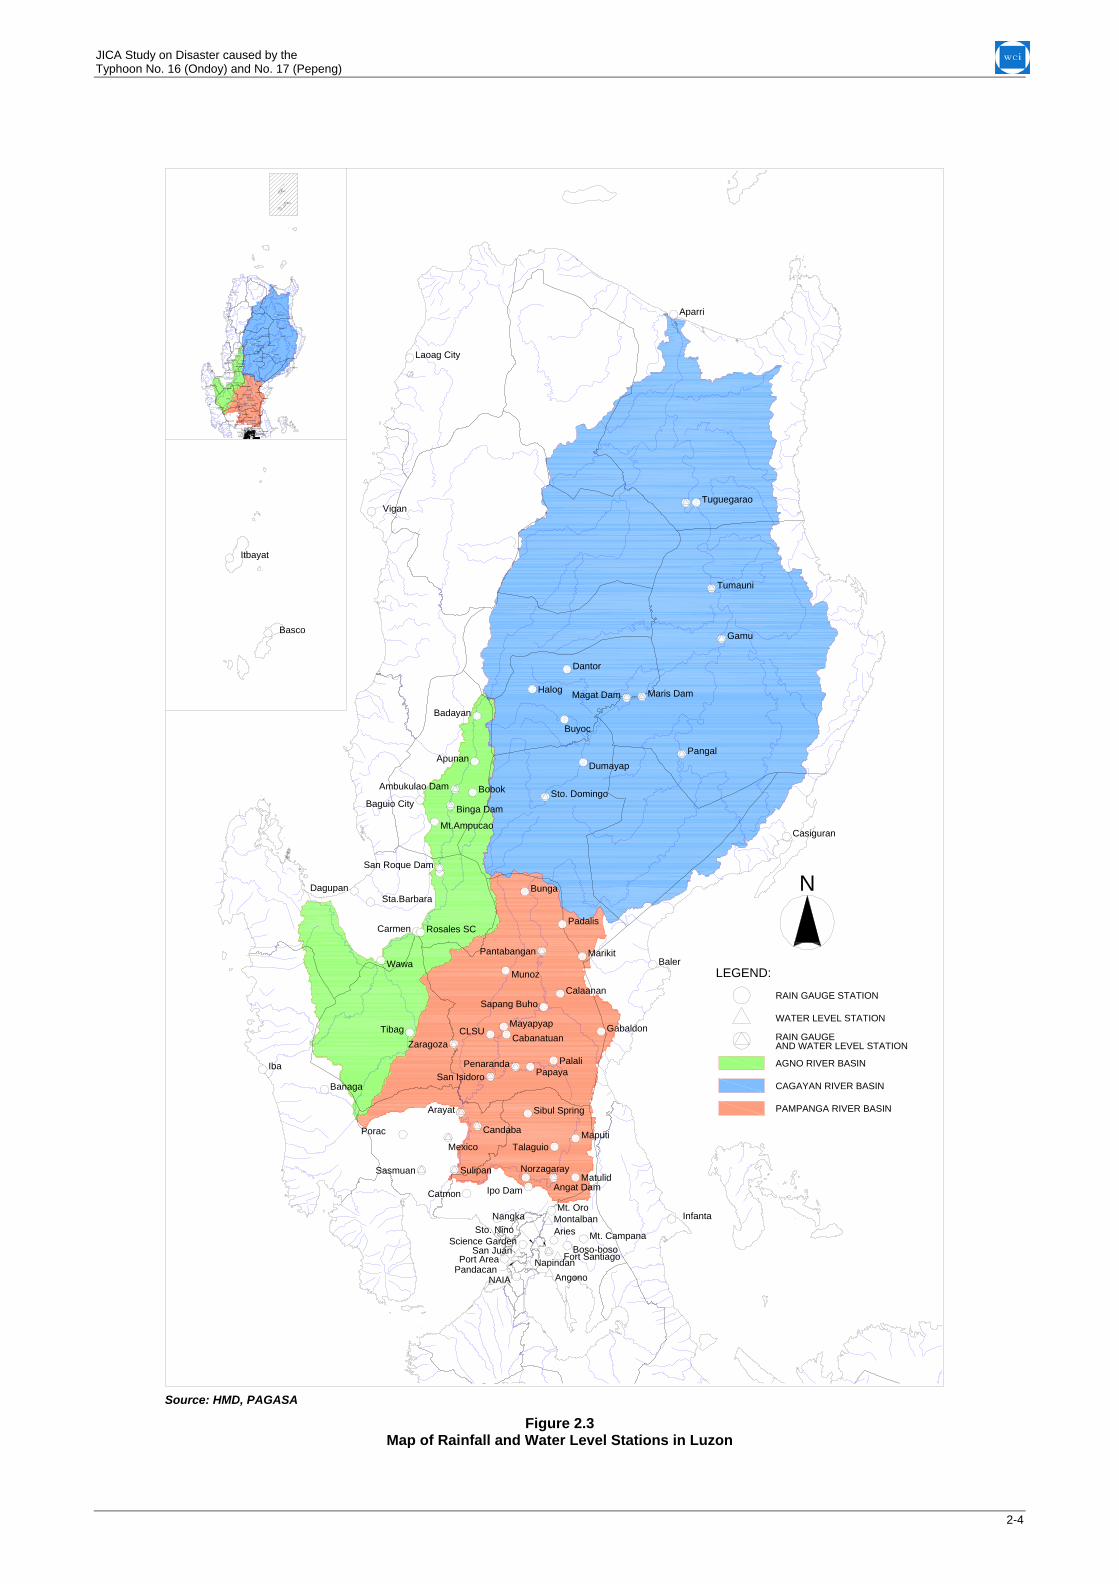
Rainfall and water level stations for the island of Luzon are shown in Figure 2.3, while those in Metro Manila and along the Laguna Lake are shown in Figure 2.4. The rainfall and water level stations consist of a mixture of those under PAGASA, MMDA, LLDA and DPWH.
2.3 Listing of Rainfall and Water Level Stations in Luzon
Rainfall and water level have been recorded at several of the stations shown in Figures 2.3 and 2.4 where these two tropical storms left their tracks. Considering that most of the populace were caught unaware, only a few persons and agencies were able to partially record rainfall and water level. Only those stations equipped with automatic recorders and telemetering devices were able to fully record the whole event, although total consolidation of the collected data is not fully complete as of this time.
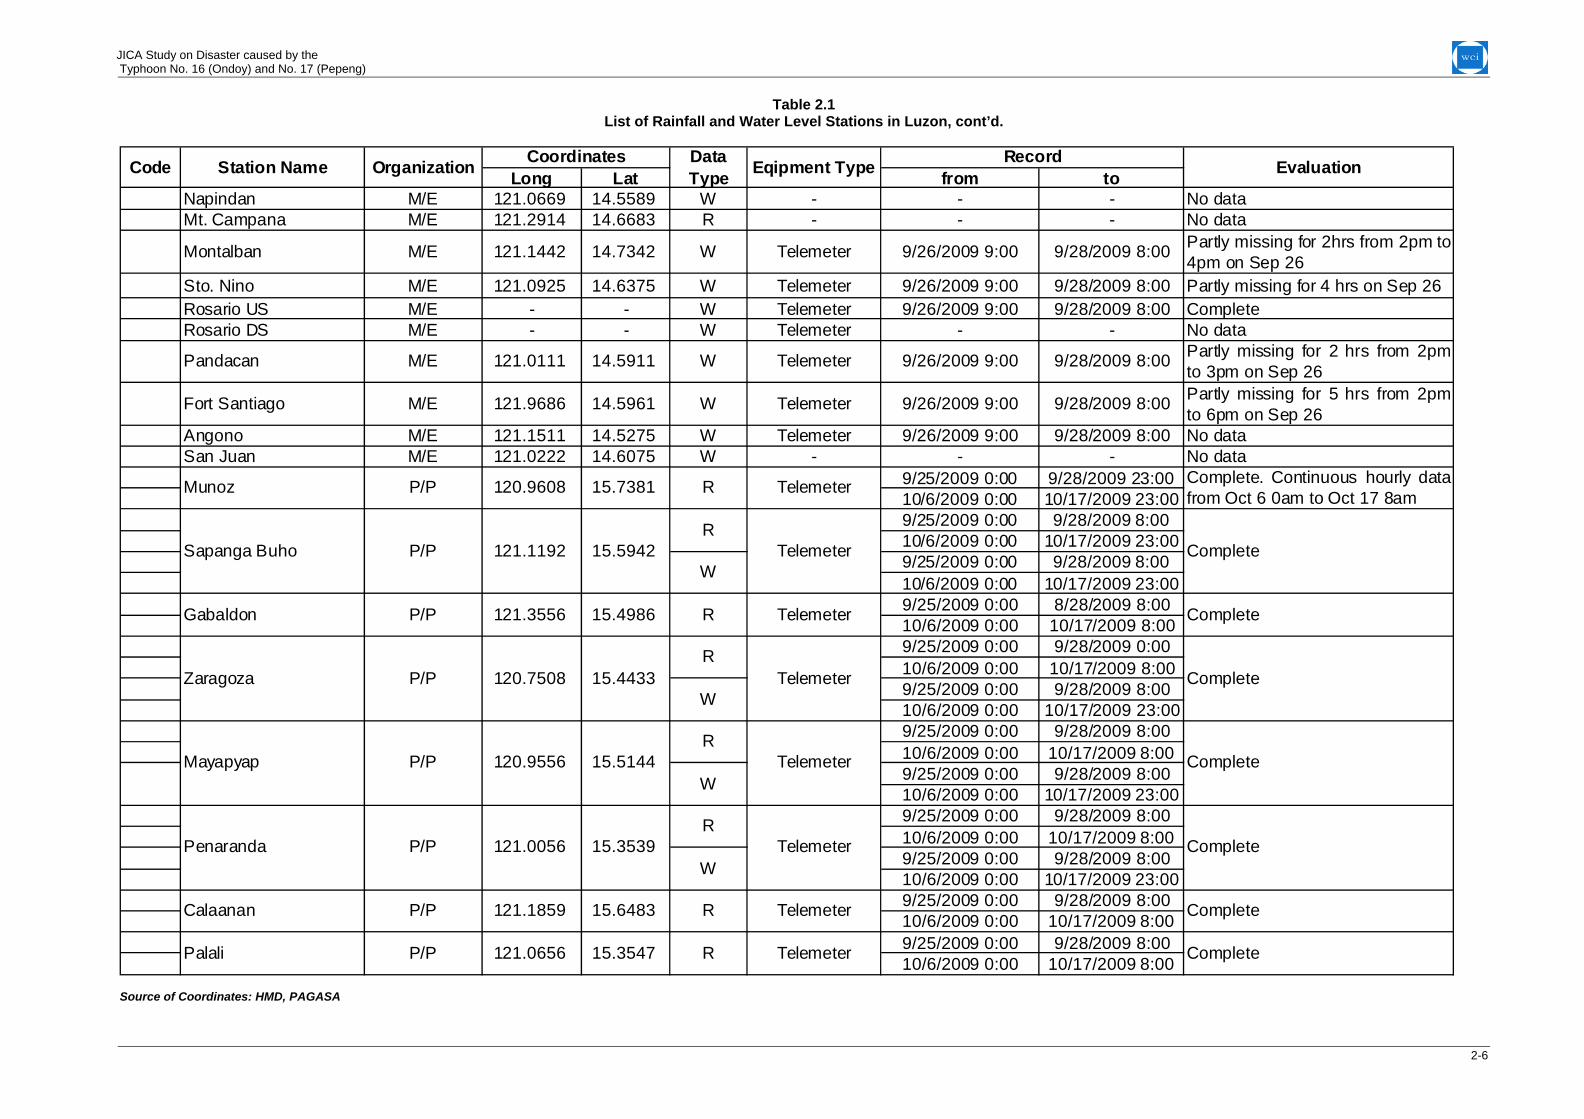
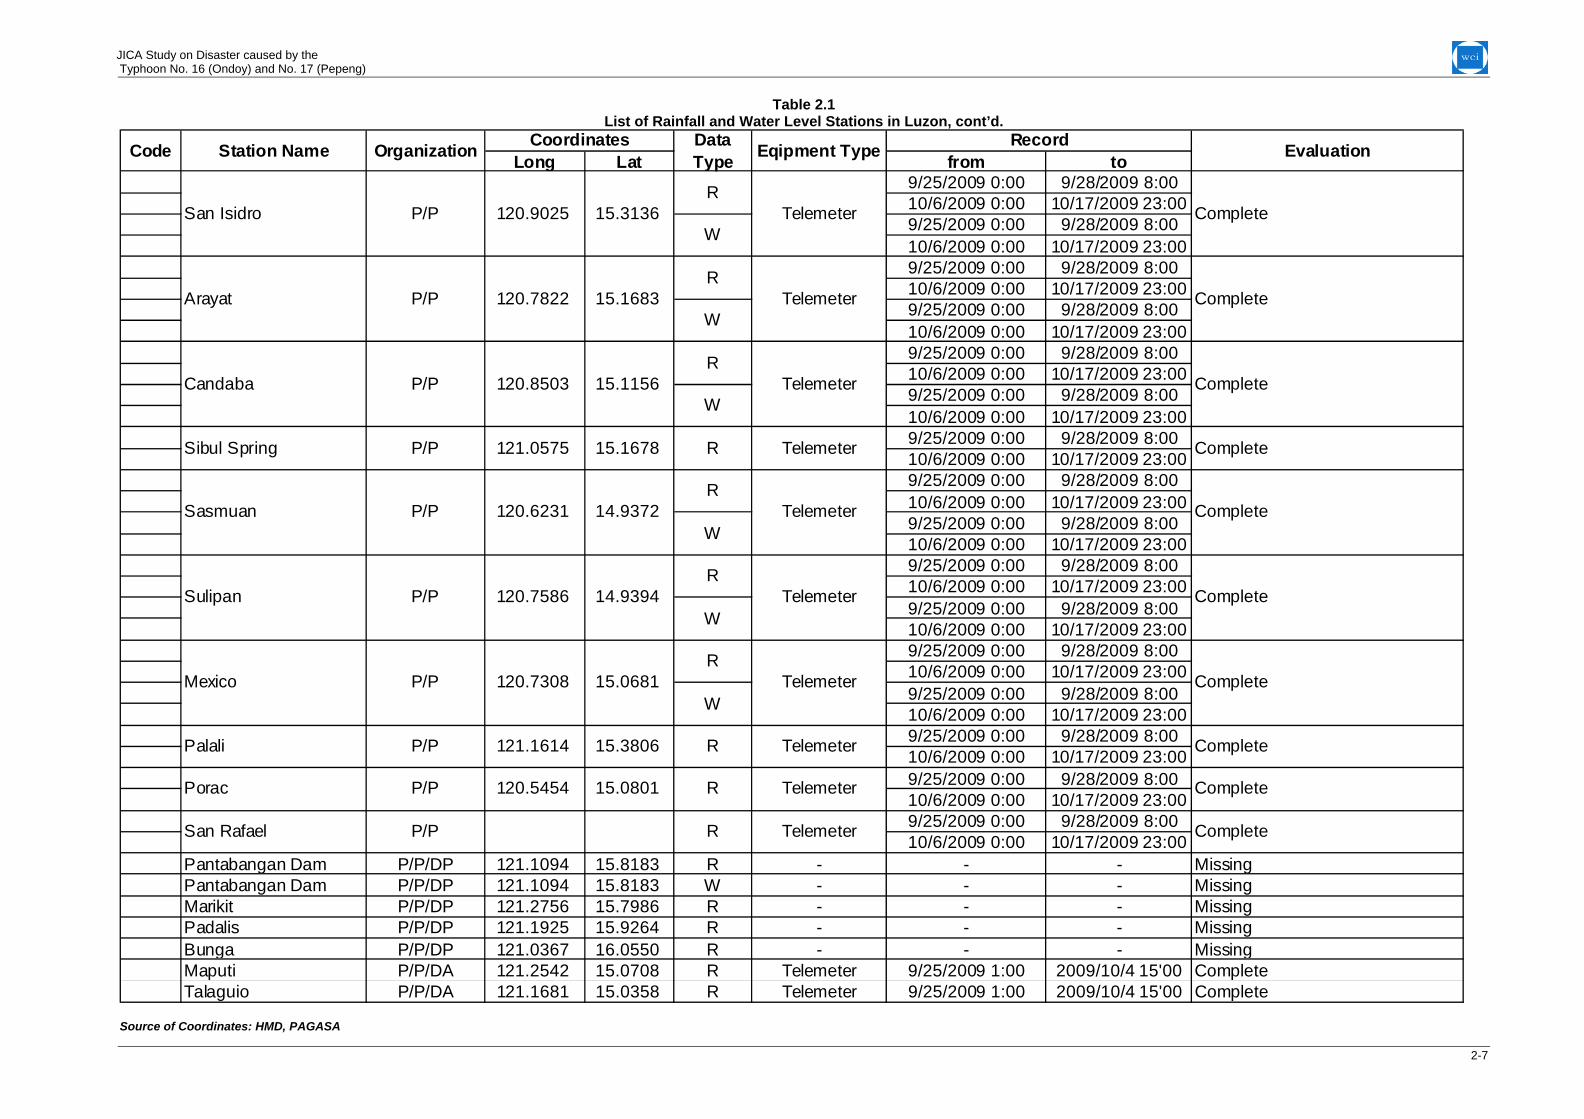
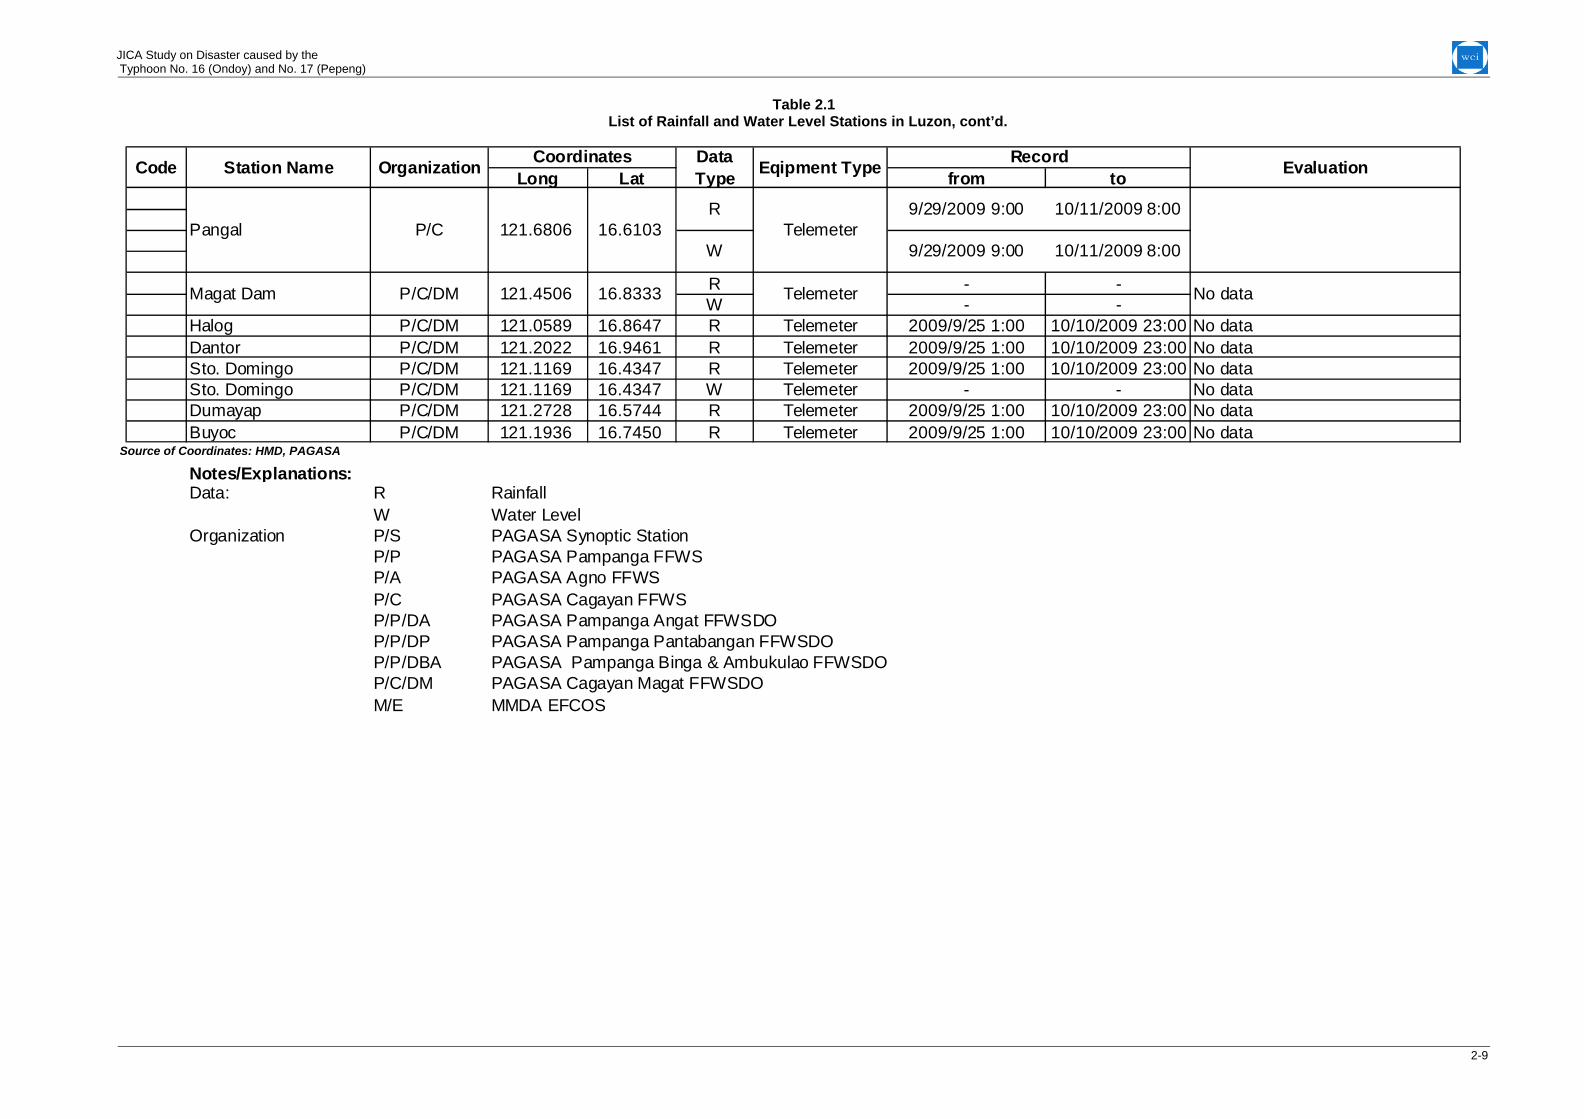
A listing of these rainfall and water level stations for the Island of Luzon is shown in Table 2.1. The list shown thereat includes the name of the station, the organization operating and maintaining these stations, longitude and latitude coordinates, sort of data collected, type of equipment used, data available with respect to the two tropical storms, availability of data and evaluation as to the accuracy of the data collected.
The actual collected data are shown in the attached optical recording file (i.e. DVD).
The hourly rainfall hyetographs and the water level hydrograph are shown in Annex 2 based on the collected data and included in the DVD.
2.4 Laguna Lake Development Authority (LLDA) Data
Water level in the Laguna Lake has also risen as a result of Tropical Storms Ondoy, Pepeng and other subsequent storms. This is shown also in Annex 2 and included in the DVD.
2-1

JICA Study on Disaster caused by the Typhoon No. 16 (Ondoy) and No. 17 (Pepeng)
Source: HMD, PAGASA Figure 2.1
Track of Tropical Storm Ondoy
2-2

JICA Study on Disaster caused by the Typhoon No. 16 (Ondoy) and No. 17 (Pepeng)
Source: HMD, PAGASA
Figure 2.2 Track of Tropical Storm Pepeng
2-3
JICA Study on Disaster caused by the Typhoon No. 16 (Ondoy) and No. 17 (Pepeng)
Laoag City
TuguegaraoVigan
Baguio City
Casiguran
Dagupan
Baler
CabanatuanCLSU
Iba
Infanta
Science Garden
Port Area
NAIA
Napindan
Mt. CampanaAriesNangka
Boso-boso
Mt. OroMontalban
Sto. Nino
PandacanAngono
San Juan
Catmon
Munoz
Sapang Buho
Mayapyap Gabaldon
Zaragoza
PapayaSan Isidoro
Arayat
Candaba
Sibul Spring
Sasmuan Sulipan
Penaranda
Mexico
Calaanan
Palali
Porac
Pantabangan Marikit
Padalis
Bunga
Angat DamIpo Dam
TalaguioMaputi
MatulidNorzagaray
Rosales SC
Sta.Barbara
Carmen
Wawa
Mt.Ampucao
Banaga
Tibag
Binga Dam
Ambukulao Dam Bobok
Apunan
Badayan
San Roque Dam
Pangal
Maris Dam
Gamu
Tumauni
Magat DamHalog
Dantor
Sto. Domingo
Dumayap
Buyoc
Fort Santiago
Aparri
Itbayat
Basco
Laoag City
TuguegaraoVigan
Baguio City
Casiguran
Dagupan
Baler
CabanatuanCLSU
Iba
Infanta
Science Garden
Port Area Napindan
Mt. CampanaAriesNangka
Boso-boso
Mt. OroMontalban
Sto. Nino
Pandacan
San Juan
Catmon
Munoz
Sapang Buho
Mayapyap Gabaldon
Zaragoza
PapayaSan Isidoro
Arayat
Candaba
Sibul Spring
Sasmuan Sulipan
Penaranda
Mexico
Calaanan
Palali
Porac
Pantabangan Marikit
Padalis
Bunga
Angat DamIpo Dam
TalaguioMaputi
MatulidNorzagaray
Rosales SC
Sta.Barbara
Carmen
Wawa
Mt.Ampucao
Banaga
Tibag
Binga Dam
Ambukulao Dam Bobok
Apunan
Badayan
San Roque Dam
Pangal
Maris Dam
Gamu
Tumauni
Magat DamHalog
Dantor
Sto. Domingo
Dumayap
Buyoc
Fort Santiago
Aparri
Itbayat
Basco
LEGEND:
RAIN GAUGE STATION
WATER LEVEL STATION
RAIN GAUGEAND WATER LEVEL STATION
AGNO RIVER BASIN
CAGAYAN RIVER BASIN
PAMPANGA RIVER BASIN
N
Source: HMD, PAGASA Figure 2.3
Map of Rainfall and Water Level Stations in Luzon
2-4

JICA Study on Disaster caused by the Typhoon No. 16 (Ondoy) and No. 17 (Pepeng)
2-5
Figure 2.4 Map of Rainfall and Water Level Stations in Metro Manila and along Laguna Lake
Survey Report, The Project for the Rehabilitation of the Flood Control Operation and Warning System in Metro Manila

JICA Study on Disaster caused by the Typhoon No. 16 (Ondoy) and No. 17 (Pepeng)
Table 2.1 List of Rainfall and Water Level Stations in Luzon
Long Lat from to132 Itbayat P/S 121.8000 20.7500 R - - - -
135 Basco P/S 121.9667 20.4500 R Chart Recorder - - Complete, available in chart and 6-hourly reading
232 Aparri P/S 121.6333 18.3667 R - - - -223 Laoag City P/S 120.5333 18.1833 R - - - -233 Tuguegarao P/S 121.7333 17.6167 R - - - -222 Vigan P/S 120.3833 17.5667 R - - - -
328 Baguio City P/S 120.6000 16.4167 R Chart Recorder 9/24/2009 9:00 9/30/2009 8:00 Complete, available in chart and 6-hourly reading
336 Casiguran P/S 122.1167 16.2833 R Chart Recorder 9/24/2009 9:00 9/30/2009 8:00 Complete, available in chart and 6-hourly reading
325 Dagupan P/S 120.3333 16.0500 R - - - No data
333 Baler P/S 121.5667 15.7667 R Chart Recorder 9/24/2009 9:00 9/30/2009 8:00 Complete, available in chart and 6-hourly reading
330 Cabanatuan P/S 120.9667 15.4833 R Chart Recorder 9/24/2009 9:00 9/30/2009 8:00 Complete, available in chart and 6-hourly reading
329 CLSU P/S 120.9000 15.4833 R - - - No data
324 Iba P/S 119.9667 15.3333 R Chart ecorder 9/24/2009 9:00 9/30/2009 8:00 Complete, available in chart and 6-hourly reading
434 Infanta P/S 121.6500 14.7500 R - - - No data
430 Science Garden P/S 121.0419 14.6447 R Tel meter 9/25/2009 9:00 9/28/2009 8:00 Complete. Continuous hourly datafrom 8am Sep 25 to 7 am Sep 27
425 Port Area P/S 120.9686 14.5856 R Tel meter 9/25/2009 9:00 9/28/2009 8:00 Complete. Continuous hourly datafrom 8am Sep 25 to 7 am Sep 27
429 NAIA P/S 121.0167 14.5167 R - - - No data
Catmon DPWH 120.8097 14.8456 R Telemeter 9/25/2009 9:00 9/28/2009 8:00 Complete. Continuous hourly datafrom 8am Sep 25 to 7 am Sep 27
Boso-boso M/E 121.2231 14.6400 R Tel meter 9/26/2009 9:00 9/28/2009 8:00 Complete. Continuous hourly datafrom 8am Sep 26 to 7 am Sep 27
Aries M/E 121.1689 14.6628 R Tel meter 9/26/2009 9:00 9/28/2009 8:00 Partly missing from 2pm to 4pmSep 26
Mt. Oro M/E 121.1578 14.7800 R Tel meter 9/26/2009 9:00 9/28/2009 8:00 Partly missing from 2pm to 4pmSe
R
e
e
e
e
e p 26
Nangka M/E 121.1486 14.6161 R Tel meter 9/26/2009 9:00 9/28/2009 8:00 Partly missing from 2pm to 9pmSee p 26
Nangka M/E 121.1486 14.6161 W Tel meter 9/26/2009 9:00 9/27/2009 8:00 Only 4 hrs of data from 9am to12noon on Sep 26
Code Station Name Organization Coordinates Record EvaluationData Type Eqipment Type
e
Source of Coordinates: HMD, PAGASA
2-5
JICA Study on Disaster caused by the Typhoon No. 16 (Ondoy) and No. 17 (Pepeng)
Table 2.1 List of Rainfall and Water Level Stations in Luzon, cont’d.
Long Lat from toNapindan M/E 121.0669 14.5589 W - - - No dataMt. Campana M/E 121.2914 14.6683 R - - - No data
Montalban M/E 121.1442 14.7342 W Telemeter 9/26/2009 9:00 9/28/2009 8:00 Partly missing for 2hrs from 2pm to4pm on Sep 26
Sto. Nino M/E 121.0925 14.6375 W Tel meter 9/26/2009 9:00 9/28/2009 8:00 Partly missing for 4 hrs on Sep 26Rosario US M/E - - W Telemeter 9/26/2009 9:00 9/28/2009 8:00 Com
eplete
Rosario DS M/E - - W Telemeter - - No data
Pandacan M/E 121.0111 14.5911 W Tel meter 9/26/2009 9:00 9/28/2009 8:00 Partly missing for 2 hrs from 2pmto 3pm on Sep 26
Fort Santiago M/E 121.9686 14.5961 W Telemeter 9/26/2009 9:00 9/28/2009 8:00 Partly missing for 5 hrs from 2pmto 6pm on Sep 26
Angono M/E 121.1511 14.5275 W Tel meter 9/26/2009 9:00 9/28/2009 8:00 No dataSan Juan M/E 121.0222 14.6075 W - - - No data
9/25/2009 0:00 9/28/2009 23:0010/6/2009 0:00 10/17/2009 23:009/25/2009 0:00 9/28/2009 8:0010/6/2009 0:00 10/17/2009 23:009/25/2009 0:00 9/28/2009 8:0010/6/2009 0:00 10/17/2009 23:009/25/2009 0:00 8/28/2009 8:0010/6/2009 0:00 10/17/2009 8:009/25/2009 0:00 9/28/2009 0:0010/6/2009 0:00 10/17/2009 8:009/25/2009 0:00 9/28/2009 8:0010/6/2009 0:00 10/17/2009 23:009/25/2009 0:00 9/28/2009 8:0010/6/2009 0:00 10/17/2009 8:009/25/2009 0:00 9/28/2009 8:0010/6/2009 0:00 10/17/2009 23:009/25/2009 0:00 9/28/2009 8:0010/6/2009 0:00 10/17/2009 8:009/25/2009 0:00 9/28/2009 8:0010/6/2009 0:00 10/17/2009 23:009/25/2009 0:00 9/28/2009 8:0010/6/2009 0:00 10/17/2009 8:009/25/2009 0:00 9/28/2009 8:0010/6/2009 0:00 10/17/2009 8:00
WCompleteSapanga Buho
R Telemeter Complete. Continuous hourly datafrom Oct 6 0am to Oct 17 8am
R
Munoz P/P 120.9608 15.7381
Gabaldon P/P 121.3556 15.4986
15.5942P/P 121.1192
R Telemeter Complete
Complete
R
CompleteR
WZaragoza
120.9556 15.5144W
P/P 120.7508 15.4433
Mayapyap CompleteP/P
Calaanan
Complete
P/P
P/P
121.1859
121.0656Palali
15.6483 R Tel meter
Tel meterR
WPenaranda P/P 121.0056 15.3539
15.3547 R Tel meter Complete
Code
Telemeter
Tel meter
Tel meter
Data Type Eqipment Type RecordStation Name Organization Coordinates Evaluation
e
e
e
e
e
e
e
Source of Coordinates: HMD, PAGASA
2-6
JICA Study on Disaster caused by the Typhoon No. 16 (Ondoy) and No. 17 (Pepeng)
Table 2.1
Long Lat from to9/25/2009 0:00 9/28/2009 8:0010/6/2009 0:00 10/17/2009 23:009/25/2009 0:00 9/28/2009 8:0010/6/2009 0:00 10/17/2009 23:009/25/2009 0:00 9/28/2009 8:0010/6/2009 0:00 10/17/2009 23:009/25/2009 0:00 9/28/2009 8:0010/6/2009 0:00 10/17/2009 23:009/25/2009 0:00 9/28/2009 8:0010/6/2009 0:00 10/17/2009 23:009/25/2009 0:00 9/28/2009 8:0010/6/2009 0:00 10/17/2009 23:009/25/2009 0:00 9/28/2009 8:0010/6/2009 0:00 10/17/2009 23:009/25/2009 0:00 9/28/2009 8:0010/6/2009 0:00 10/17/2009 23:009/25/2009 0:00 9/28/2009 8:0010/6/2009 0:00 10/17/2009 23:009/25/2009 0:00 9/28/2009 8:0010/6/2009 0:00 10/17/2009 23:009/25/2009 0:00 9/28/2009 8:0010/6/2009 0:00 10/17/2009 23:009/25/2009 0:00 9/28/2009 8:0010/6/2009 0:00 10/17/2009 23:009/25/2009 0:00 9/28/2009 8:0010/6/2009 0:00 10/17/2009 23:009/25/2009 0:00 9/28/2009 8:0010/6/2009 0:00 10/17/2009 23:009/25/2009 0:00 9/28/2009 8:0010/6/2009 0:00 10/17/2009 23:009/25/2009 0:00 9/28/2009 8:0010/6/2009 0:00 10/17/2009 23:00
Pantabangan Dam P/P/DP 121.1094 15.8183 R - - - MissingPantabangan Dam P/P/DP 121.1094 15.8183 W - - - MissingMarikit P/P/DP 121.2756 15.7986 R - - - MissingPadalis P/P/DP 121.1925 15.9264 R - - - MissingBunga P/P/DP 121.0367 16.0550 R - - - MissingMaputi P/P/DA 121.2542 15.0708 R Telemeter 9/25/2009 1:00 2009/10/4 15'00 CompleteTalaguio P/P/DA 121.1681 15.0358 R Telemeter 9/25/2009 1:00 2009/10/4 15'00 Complete
Code Station Name Organization Coordinates Data Type Eqipment Type Record Evaluation
RComplete
121.0575 15.1678
120.8503P/P 15.1156
Arayat P/P 120.7822 15.1683
Sibul Spring P/P
San Isidro P/PW
Candaba
120.9025 15.3136
Telemeter Complete
Tel meter
Tel meter
R Telemeter
W
R
W
R
14.9394R
WSulipan P/P 120.7586
Sasmuan P/P 120.6231R
Mexico 15.0681R
WTelemeter Complete
CompleteTel meter
14.9372W
Porac 15.0801 R Telemeter
Palali 15.3806 R Telemeter
San Rafael R
P/P 120.7308
P/P 121.1614
P/P 120.5454
P/P Telemeter Complete
Telemeter
Complete
Complete
Complete
Complete
Complete
e
e
e
List of Rainfall and Water Level Stations in Luzon, cont’d.
Source of Coordinates: HMD, PAGASA
2-7

JICA Study on Disaster caused by the Typhoon No. 16 (Ondoy) and No. 17 (Pepeng)
Table 2.1
Long Lat from to
Matulid P/P/DA 121.2547 14.9142 R Telemeter 9/25/2009 1:00 2009/10/4 15'00 CompleteAngat P/P/DA 121.1650 14.9114 R Telemeter 9/25/2009 1:00 2009/10/4 15'00 CompleteAngat Dam P/P/DA 121.1650 14.9114 W Telemeter 9/25/2009 1:00 2009/10/4 15'00 CompleteNorzagaray P/P/DA 121.0514 14.9119 R Telemeter - - MissingSan Roque Dam (D) P/A 120.6853 16.1269 R Telemeter 9/24/2009 9:00 9/28/2009 8:00 MissingSta.Barbara P/A 120.4011 16.0067 R Telemeter 9/24/2009 9:00 9/28/2009 8:00 MissingCarmen P/A 120.5928 15.8900 R Telemeter 9/24/2009 9:00 9/28/2009 8:00 MissingWawa P/A 120.4472 15.7744 R Telemeter 9/24/2009 9:00 9/28/2009 8:00 MissingMt.Ampucao P/A 120.6619 16.3300 R Telemeter 9/24/2009 9:00 9/28/2009 8:00 MissingBanaga P/A 120.2211 15.2544 R - - - -Tibag P/A 120.5692 15.4872 R Telemeter 9/24/2009 9:00 9/28/2009 8:00 MissingBadayan P/A/DBA 120.8314 16.7553 R Telemeter 10/1/2009 9:00 10/12/2009 0:00 CompleteApunan P/A/DBA 120.8247 16.5728 R Telemeter 10/1/2009 9:00 10/12/2009 0:00 CompleteBobok P/A/DBA 120.8175 16.4500 R Telemeter 10/1/2009 9:00 10/12/2009 0:00 Complete
R 10/1/2009 9:00 10/12/2009 0:00 CompleteW 10/1/2009 9:00 10/12/2009 0:00 CompleteR 10/1/2009 9:00 10/12/2009 0:00 CompleteW 10/1/2009 9:00 10/12/2009 0:00 CompleteR 10/1/2009 9:00 10/12/2009 0:00 CompleteW 10/1/2009 9:00 10/12/2009 0:00 Complete
Pitican P/A/DBA R Tel meter 10/1/2009 9:00 10/12/2009 0:00 CompleteAmpucao P/A/DBA 120.6619 16.3300 R Telemeter 10/1/2009 9:00 10/12/2009 0:00 Complete
9/22/2009 9:00 9/28/2009 8:009/29/2009 9:00 10/11/2009 8:009/22/2009 9:00 9/28/2009 8:009/29/2009 9:00 10/11'2009 8:009/22/2009 9:00 9/28/2009 8:009/29/2009 9:00 10/11/2009 8:009/22/2009 9:00 9/28/2009 8:009/29/2009 9:00 10/11'2009 8:009/22/2009 9:00 9/28/2009 8:009/29/2009 9:00 10/11/2009 8:00
W - - No data9/22/2009 9:00 9/28/2009 8:009/29/2009 9:00 10/11/2009 8:009/22/2009 9:00 9/28/2009 8:009/29/2009 9:00 10/11'2009 8:00
EvaluationCoordinaType Eqipment Type Record
Tel meter
San Roque Dam P/A/DBA 120.6840 16.1460 Tel meter
Binga Dam P/A/DBA 120.7267 16.3961
Ambukulao Dam P/A/DBA 120.7439 16.4611 Tel meter
Maris Dam P/C 121.5139 16.8388 Partly missing
TelemeterR
R
WTelemeter
Gamu P/C 121.8421 17.0717
Tumauni P/C 121.7989 17.2738R
WTelemeter
Partly missing
Partly missing
Tuguegarao P/C 121.6903 17.6154R
WTel meter Partly missing
Code Station Name Organization tes Data
e
e
e
e
e
List of Rainfall and Water Level Stations in Luzon, cont’d.
Source of Coordinates: HMD, PAGASA
2-8
JICA Study on Disaster caused by the Typhoon No. 16 (Ondoy) and No. 17 (Pepeng)
Table 2.1 List of Rainfall and Water Level Stations in Luzon, cont’d.
Long Lat from to
R - -W - -
Halog P/C/DM 121.0589 16.8647 R Telemeter 2009/9/25 1:00 10/10/2009 23:00 No dataDantor P/C/DM 121.2022 16.9461 R Telemeter 2009/9/25 1:00 10/10/2009 23:00 No dataSto. Domingo P/C/DM 121.1169 16.4347 R Telemeter 2009/9/25 1:00 10/10/2009 23:00 No dataSto. Domingo P/C/DM 121.1169 16.4347 W Telemeter - - No dataDumayap P/C/DM 121.2728 16.5744 R Telemeter 2009/9/25 1:00 10/10/2009 23:00 No dataBuyoc P/C/DM 121.1936 16.7450 R Telemeter 2009/9/25 1:00 10/10/2009 23:00 No data
Notes/Explanations:Data: R Rainfall
W Water LevelOrganization P/S PAGASA Synoptic Station
P/P PAGASA Pampanga FFWSP/A PAGASA Agno FFWSP/C PAGASA Cagayan FFWSP/P/DA PAGASA Pampanga Angat FFWSDOP/P/DP PAGASA Pampanga Pantabangan FFWSDOP/P/DBA PAGASA Pampanga Binga & Ambukulao FFWSDOP/C/DM PAGASA Cagayan Magat FFWSDOM/E MMDA EFCOS
Code Station Name Organization Coordinates Data Type Eqipment Type Record Evaluation
R16.6103
9/29/2009 9:00 10/11/2009 8:00
9/29/2009 9:00Pangal
WP/C 121.6806
10/11/2009 8:00Telemeter
Telemeter No dataMagat Dam P/C/DM 121.4506 16.8333
Source of Coordinates: HMD, PAGASA
2-9