operation of rain gauge and groundwater monitoring
TRANSCRIPT

Illinois State Water SurveyInstitute of Natural Resource SustainabilityUniversity of Illinois at Urbana-Champaign
Champaign, Illinois
Contract Report 2009-08
Operation of Rain Gauge and Groundwater Monitoring Networksfor the Imperial Valley Water Authority
Year Thirteen: September 2004-August 2005
bySteven D. Wilson, Nancy E. Westcott,
Kevin L. Rennels, and H. Allen Wehrmann
June 2009

Operation of Rain Gauge and Groundwater MonitoringNetworks for the Imperial Valley Water Authority
Year Thirteen: September 2004–August 2005by
Steven D. Wilson,Nancy E. Westcott,Kevin L. Rennels,
and H. Allen Wehrmann
Illinois State Water SurveyInstitute of Natural Resource SustainabilityUniversity of Illinois at Urbana-Champaign
Champaign, IL


iii
ContentsPage
Abstract . . . . . . . . . . . . . . . . . . . . . . . . . . . . . . . . . . . . . . . . . . . . . . . . . . . . . . . . . . . . . . . . . . . . . 1
Introduction . . . . . . . . . . . . . . . . . . . . . . . . . . . . . . . . . . . . . . . . . . . . . . . . . . . . . . . . . . . . . . . . . . 3Rain Gauge and Observation Well Networks . . . . . . . . . . . . . . . . . . . . . . . . . . . . . . . . . . 3Irrigation Test Site . . . . . . . . . . . . . . . . . . . . . . . . . . . . . . . . . . . . . . . . . . . . . . . . . . . . . . . 5Report Objective . . . . . . . . . . . . . . . . . . . . . . . . . . . . . . . . . . . . . . . . . . . . . . . . . . . . . . . . 5Acknowledgments . . . . . . . . . . . . . . . . . . . . . . . . . . . . . . . . . . . . . . . . . . . . . . . . . . . . . . . 6
Rain Gauge Network: Description, Operation, and Maintenance . . . . . . . . . . . . . . . . . . . . . . . . . 7
Groundwater-Level Observation Well Network: Description, Operation, and Maintenance . . . . 9
Irrigation Test Site: Description, Operation, and Maintenance (Year Three) . . . . . . . . . . . . . . . 11
Precipitation, Groundwater-Level, and Irrigation Data Analysis . . . . . . . . . . . . . . . . . . . . . . . . 13Precipitation Analysis . . . . . . . . . . . . . . . . . . . . . . . . . . . . . . . . . . . . . . . . . . . . . . . . . . . 13Groundwater-Level Analysis . . . . . . . . . . . . . . . . . . . . . . . . . . . . . . . . . . . . . . . . . . . . . . 13
Monthly Measurements . . . . . . . . . . . . . . . . . . . . . . . . . . . . . . . . . . . . . . . . . . . . 13Continuous Measurements . . . . . . . . . . . . . . . . . . . . . . . . . . . . . . . . . . . . . . . . . . 13
Irrigation Water-Use Analysis . . . . . . . . . . . . . . . . . . . . . . . . . . . . . . . . . . . . . . . . . . . . . 14Crane Creek Discharge Measurements . . . . . . . . . . . . . . . . . . . . . . . . . . . . . . . . . . . . . . 14
Results . . . . . . . . . . . . . . . . . . . . . . . . . . . . . . . . . . . . . . . . . . . . . . . . . . . . . . . . . . . . . . . . . . . . . 15Precipitation . . . . . . . . . . . . . . . . . . . . . . . . . . . . . . . . . . . . . . . . . . . . . . . . . . . . . . . . . . . 15
Annual and Monthly Precipitation . . . . . . . . . . . . . . . . . . . . . . . . . . . . . . . . . . . . 15Storm Events . . . . . . . . . . . . . . . . . . . . . . . . . . . . . . . . . . . . . . . . . . . . . . . . . . . . 24
Groundwater Levels . . . . . . . . . . . . . . . . . . . . . . . . . . . . . . . . . . . . . . . . . . . . . . . . . . . . . 26Monthly Measurements . . . . . . . . . . . . . . . . . . . . . . . . . . . . . . . . . . . . . . . . . . . . 26Irrigation Test Site Measurements . . . . . . . . . . . . . . . . . . . . . . . . . . . . . . . . . . . . 27Continuous Measurements . . . . . . . . . . . . . . . . . . . . . . . . . . . . . . . . . . . . . . . . . . 30
Irrigation Water Use . . . . . . . . . . . . . . . . . . . . . . . . . . . . . . . . . . . . . . . . . . . . . . . . . . . . 33
Summary . . . . . . . . . . . . . . . . . . . . . . . . . . . . . . . . . . . . . . . . . . . . . . . . . . . . . . . . . . . . . . . . . . . 37
References . . . . . . . . . . . . . . . . . . . . . . . . . . . . . . . . . . . . . . . . . . . . . . . . . . . . . . . . . . . . . . . . . . 39
Appendix A. Hydrographs, Imperial Valley Observation Well Network . . . . . . . . . . . . . . . . . . 41
Appendix B. Observed Groundwater Levels, Imperial Valley Observation Well Network . . . . 51
Appendix C. Site Descriptions, Imperial Valley Rain Gauge Network . . . . . . . . . . . . . . . . . . . 57

iv
Contents (concluded)
Page
Appendix D. Instructions for Rain Gauge Technicians . . . . . . . . . . . . . . . . . . . . . . . . . . . . . . . 71
Appendix E. Documentation, Imperial Valley Rain Gauge Network Maintenance, 2004–2005 . . . . . . . . . . . . . . . . . . . . . . . . . . . . . . . . . . . . . . . . . . . . . . . . 75
Appendix F. Hydrographs, Transducer Data at the Test Site . . . . . . . . . . . . . . . . . . . . . . . . . . . 77
Appendix G. Annual Precipitation, Years One–Twelve . . . . . . . . . . . . . . . . . . . . . . . . . . . . . . . 83
Appendix H. Precipitation Events, Total Precipitation, and Precipitation per PrecipitationEvent by Month and Season, 1992–2004 . . . . . . . . . . . . . . . . . . . . . . . . . . . . . . . . . . . . 91
Appendix I. Documentation of Precipitation Events in the Imperial Valley, 2004–2005 . . . . . . 95

v
List of Tables
Page
1. Imperial Valley Network Observation Wells . . . . . . . . . . . . . . . . . . . . . . . . . . . . . . . . . . . 10
2. Depths, Installation Dates, and Measuring Point Elevations, Imperial Valley Irrigation Site Observation Wells . . . . . . . . . . . . . . . . . . . . . . . . . . . . . . . . . . . . . . . . . . . . . . . . . . . . 12
3. Monthly Precipitation Amounts (inches), September 2004–August 2005 . . . . . . . . . . . . . 15
4. Comparison of Total Precipitation (inches), Number of Precipitation Events, andAverage Precipitation per Event by Month and Season, 1992–2004 and 2004–2005 . . . . 17
5. Estimated Monthly Irrigation Withdrawals (billion gallons), Number of IrrigationSystems, Withdrawal per System, and Withdrawal Rank . . . . . . . . . . . . . . . . . . . . . . . . . 34
6. Average Annual Precipitation, Annual Precipitation Surplus, Running Surplus, andRanked Annual Precipitation and Irrigation . . . . . . . . . . . . . . . . . . . . . . . . . . . . . . . . . . . . 34

vi
List of Figures
Page
1. Configuration of the 13-site observation well and 25-site rain gauge networks,and location of the irrigation field site, Imperial Valley, 2004–2005 . . . . . . . . . . . . . . . . . 4
2. Locations of observation wells and streamflow discharge measurement pointsin relation to the irrigation test site . . . . . . . . . . . . . . . . . . . . . . . . . . . . . . . . . . . . . . . . . . . 11
3. Network average annual precipitation (inches) for September 1992–August 2005with all gauges and without gauges 16, 19, and 21 . . . . . . . . . . . . . . . . . . . . . . . . . . . . . . . . . 16
4. Total precipitation (inches) for September 2004–August 2005 . . . . . . . . . . . . . . . . . . . . . 17
5. Precipitation (inches) for September 2004 and October 2004 . . . . . . . . . . . . . . . . . . . . . . 18
6. Precipitation (inches) for November 2004 and December 2004 . . . . . . . . . . . . . . . . . . . . 19
7. Precipitation (inches) for January 2005 and February 2005 . . . . . . . . . . . . . . . . . . . . . . . . 20
8. Precipitation (inches) for March 2005 and April 2005 . . . . . . . . . . . . . . . . . . . . . . . . . . . . 21
9. Precipitation (inches) for May 2005 and June 2005 . . . . . . . . . . . . . . . . . . . . . . . . . . . . . . 22
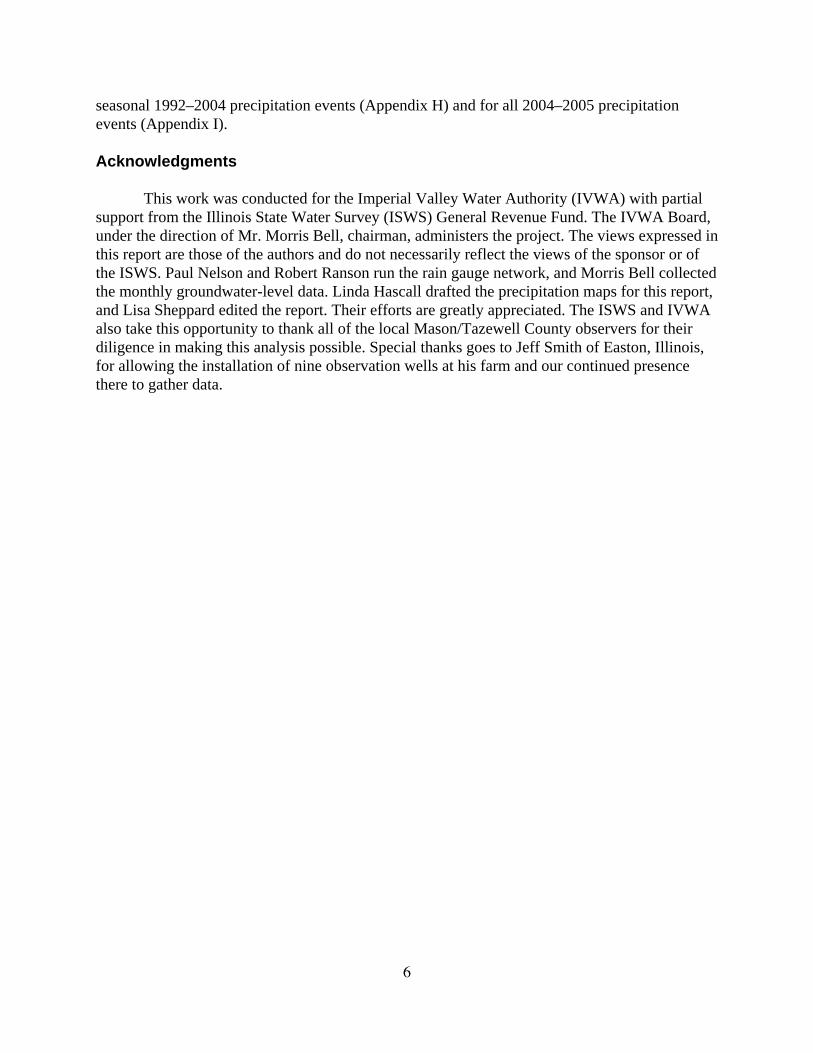
10. Precipitation (inches) for July 2005 and August 2005 . . . . . . . . . . . . . . . . . . . . . . . . . . . . 23
11. Network average monthly precipitation (inches), September 1992–August 2005 . . . . . . . 25
12. Groundwater levels at the Snicarte well, MTOW-1, 1958–2005 . . . . . . . . . . . . . . . . . . . . 28
13. Groundwater levels at the Snicarte well, MTOW-1, 1990–2005 . . . . . . . . . . . . . . . . . . . . 28
14. Groundwater level (Wells 3 & 6), Crane Creek stage elevation, and precipitation(Gauge 20) at the irrigation test site . . . . . . . . . . . . . . . . . . . . . . . . . . . . . . . . . . . . . . . . . . 29
15. Discharge measurements in Crane Creek at the irrigation test site . . . . . . . . . . . . . . . . . . 29
16. Digital water level data for the Easton well (MTOW-2) . . . . . . . . . . . . . . . . . . . . . . . . . . 30
17. Digital water level data for the Wildlife Refuge well (MTOW-3) . . . . . . . . . . . . . . . . . . . 31
18. Digital water level data for the Rest Area well (MTOW-7) . . . . . . . . . . . . . . . . . . . . . . . . 31
19. Digital water level data for the Talbott Tree Farm network well (MTOW-13) . . . . . . . . 32

vii
List of Figures (Concluded)
Page
20. Groundwater elevations and precipitation at the Easton network well (MTOW-2) fora January 2005 recharge event . . . . . . . . . . . . . . . . . . . . . . . . . . . . . . . . . . . . . . . . . . . . . . 32
21. Groundwater elevations and precipitation at the Easton network well (MTOW-2) foran April 2005 recharge event . . . . . . . . . . . . . . . . . . . . . . . . . . . . . . . . . . . . . . . . . . . . . . . 33
22. Estimated irrigation pumpage and average monthly precipitation . . . . . . . . . . . . . . . . . . . 35


1
Operation of Rain Gauge and Groundwater MonitoringNetworks for the Imperial Valley Water Authority
Year Thirteen: September 2004–August 2005
by
Steven D. Wilson, Nancy E. Westcott, Kevin L. Rennels, and H. Allen Wehrmann
Abstract
The Illinois State Water Survey (ISWS), under contract to the Imperial Valley WaterAuthority (IVWA), has operated a network of rain gauges in Mason and Tazewell Counties sinceAugust 1992. The ISWS also established a network of groundwater observation wells in theMason-Tazewell area in 1994, which is monitored by the IVWA. The purpose of the rain gaugenetwork and the groundwater observation well network is to collect long-term data to determinethe impact of groundwater withdrawals in dry periods and during the growing season, and therate at which the aquifer recharges. This report presents data accumulated from both networkssince their inception through August 2005. Precipitation is recorded continuously at 20 raingauges. Groundwater levels are measured the first of each month at 13 observation wells. Thedatabase from these networks consists of 13 years of precipitation data and 11 years ofgroundwater observations.
For the period September 2004–August 2005, the network received an average of 27.34inches of precipitation, 7.55 inches lower than the network 12-year 1992–2004 averageprecipitation of 34.89 inches. Above average precipitation fell in the fall and winter months, andbelow average rain fell during the spring and summer of 2005. Year Thirteen had the thirdwettest fall and the second wettest winter of the 13 years of network operation. The spring andsummer of 2005 were the driest warm seasons of the past 13 years.
In 2004–2005, groundwater levels rose in response to the wet fall and winter, then felldramatically in the spring and summer of 2005 due to a lack of precipitation. The dry growingseason also had a dramatic effect on irrigation water demands; irrigation pumpage increased 40percent from the previous high record of 52 billion gallons (in 1996). Total irrigation for theJune–September period was estimated to be 72 billion gallons.
To improve our understanding of the relationship among groundwater, stream discharge,and irrigation, an irrigation test site was established in April 2003 (Year Eleven) near Easton, IL.Nine observation wells were installed in close proximity to an irrigated field that abuts CraneCreek. Transducers with data loggers were installed in various wells since 2003 to monitorgroundwater levels, and an additional data logger was installed in Crane Creek to monitor streamstage. Discharge measurements indicate that there is groundwater discharge into Crane Creek atthe test site even during irrigation. Groundwater data show a rapid (within 24-hour) response ofgroundwater levels to precipitation, probably mostly due to the increase in stage in Crane Creekin this area of prevalent sandy soils, though shallow water levels also contribute to this rapidresponse.


3
Introduction
The Imperial Valley area, a portion of which also is called the Havana Lowlands, islocated principally in Mason and southern Tazewell Counties in west-central Illinois, just east ofthe Illinois River (Figure 1). The area overlies the confluence of the ancient Mississippi and theMahomet-Teays bedrock valleys. The sandy soils and rolling dunes of the confluence area in thewestern portion of the Imperial Valley stand in stark contrast to the typically flat silt loam soilsthroughout much of the rest of central Illinois. The sand-and-gravel deposits associated withthese two valleys contain an abundant groundwater resource. The area is used primarily for rowand specialty crops, and it is extensively irrigated from the easily developed groundwaterresource that underlies the Imperial Valley.
Regional precipitation variability affects irrigation water demand on the aquifer, rechargeto the aquifer, and the extent to which the aquifer can be used for agricultural irrigation andmunicipal, industrial, and domestic water supplies. These factors affect water withdrawals fromthe aquifer. Therefore, knowledge of precipitation variability and its relationship to groundwaterrecharge over an extensively irrigated region, such as the area within the Imperial Valley WaterAuthority (IVWA), should provide useful information for the management of groundwaterresources in that region.
The Illinois State Water Survey (ISWS) has a long-term interest in precipitationmeasurement and related research, and has performed precipitation research in areas such ashydrology, weather modification, climate change, and urban influences on precipitation climate. Scientists and engineers from the ISWS have conducted extensive research on Illinoisgroundwater resources and have a continued interest in the hydrodynamics and recharge ofaquifers in the state.
The objective of this project is to conduct long-term monitoring of precipitation andgroundwater levels in the Imperial Valley region to learn how groundwater resources respond todrought and seasonal irrigation, and to assess groundwater recharge.
Rain Gauge and Observation Well Networks
A number of studies (Walker et al., 1965; Panno et al., 1994; Clark, 1994) have shownthat precipitation is the primary source of water for groundwater recharge in the Imperial Valley.Therefore, detailed precipitation measurements are important for understanding its contributionto groundwater levels in the Imperial Valley area.
During the past 50 years, the ISWS has operated rain gauge networks of varying arealgauge densities over various time periods in both rural and urban areas. Sampling requirements,as determined from these past studies (e.g., Huff, 1970), indicate that a 2- to 3-mile gridded raingauge spacing should be adequate for properly capturing convective precipitation systems(spring and summer), and a 6-mile spacing is adequate for more widespread precipitation-producing systems (fall and winter). The Belfort weighing bucket rain gauge provides preciseand reliable precipitation measurements. Given the size of the IVWA area and the above spacingguidelines, a gridded, 25-site rain gauge network (Figure 1) with approximately 5 miles betweengauges was established in late August 1992. The network was reduced to 20 sites in September1996. Results of the previous years of the network operation are reported in Peppler and

Figure 1. Configuration of the 13-site observation well and 25-site rain gauge networks, and location of the irrigation field site, Imperial Valley, 2004-2005.
4

5
Hollinger (1994, 1995), Hollinger and Peppler (1996), Hollinger (1997), Hollinger and Scott(1998), Hollinger et al. (1999, 2000), Scott et al. (2001, 2002), Wehrmann et al. (2004, 2005),and Wilson et al. (2008).
The observation well network originally consisted of 11 wells, termed Mason-TazewellObservation Wells (MTOW) 1 through 11. The network was established for the IVWA in 1994by Sanderson and Buck (1995). The IVWA added two wells (MTOW-12 and MTOW-13) in1995 and 1996, respectively, to improve spatial coverage of the network. The 13 observationwells are located fairly uniformly across the Imperial Valley study area (Figure 1). Hollinger etal. (1999) includes the first summary of the groundwater-level data and statistical analyses of thecorrelation among precipitation, Illinois River stage, and groundwater levels for the four yearsthat the observation well network had been in operation. Hollinger et al. (2000), Scott et al.(2001, 2002), and Wehrmann et al. (2004, 2005) include groundwater-level data and reanalysisof the correlation among precipitation, Illinois River stage, and groundwater levels for theobservation well network prior to Year Thirteen.
Irrigation Test Site
Understanding the relationship between the regional groundwater discharge to streamsand the effects of irrigation on water levels near these streams is a key component in developinga transient groundwater model of the Imperial Valley area. In order to model the conditions asthey change during the summer, additional input data will be required about the effects ofirrigation on groundwater levels and groundwater discharge to streams. Necessary data inputs foran ideal site include continuous water-level data, pumping rates and times for irrigation systems,and discharge/stage readings at a nearby stream, all at a location where groundwater isinfluenced by a stream and where the groundwater system is under the influence of irrigationpumpage. A test site meeting these criteria was located along Crane Creek, near Easton, IL, inMason County. The site has only one center-pivot irrigation system within a half mile of thecreek, which provides some control over irrigation effects in the immediate vicinity. The site,owned by Jeff Smith, is being studied to gather some of the necessary data for input into aregional flow model and eventually a nested model of the site within the regional model.
Report Objective
This report documents the operation, maintenance, data reduction and analysis, andmanagement of the networks during the thirteenth year of the rain gauge network operation andthe eleventh year of the observation well network operation. A discussion of observedrelationships among precipitation, Illinois River stage, irrigation, and groundwater levels isincluded.
The appendices document groundwater hydrographs (Appendix A), observedgroundwater-level data (Appendix B), rain gauge network site descriptions (Appendix C),instructions for rain gauge technicians (Appendix D), and rain gauge maintenance for the2004–2005 period (Appendix E). The transducer data for the Crane Creek site are included(Appendix F). Contour maps of the annual precipitation across the Imperial Valley are presentedfor Years One–Twelve (Appendix G). Documentation also is presented for the monthly and
6
seasonal 1992–2004 precipitation events (Appendix H) and for all 2004–2005 precipitationevents (Appendix I).
Acknowledgments
This work was conducted for the Imperial Valley Water Authority (IVWA) with partialsupport from the Illinois State Water Survey (ISWS) General Revenue Fund. The IVWA Board,under the direction of Mr. Morris Bell, chairman, administers the project. The views expressed inthis report are those of the authors and do not necessarily reflect the views of the sponsor or ofthe ISWS. Paul Nelson and Robert Ranson run the rain gauge network, and Morris Bell collectedthe monthly groundwater-level data. Linda Hascall drafted the precipitation maps for this report,and Lisa Sheppard edited the report. Their efforts are greatly appreciated. The ISWS and IVWAalso take this opportunity to thank all of the local Mason/Tazewell County observers for theirdiligence in making this analysis possible. Special thanks goes to Jeff Smith of Easton, Illinois,for allowing the installation of nine observation wells at his farm and our continued presencethere to gather data.

7
Rain Gauge Network: Description, Operation, and Maintenance
Peppler and Hollinger (1994) described construction of the IVWA rain gauge network andthe type and setup of the weighing-bucket rain gauges used. Figure 1 shows locations for gaugesR1–R25. Appendix C gives complete site descriptions for the 20 operational rain gauges as ofAugust 31, 2005. Also included are the locations of five rain gauges removed from the network in1996. In December 1997, the rain gauges were upgraded to include a data logger and linearpotentiometer to automatically record the amount of water in the rain gauges every 10 minutes.This eliminates the necessity to digitize weekly or monthly paper charts, saves two to three daysof analysis time each month, and provides more accurate time frames for events. Precipitationalso is recorded each month on eight-day paper charts for backup if data loggers fail.
The 20 active sites are maintained by a local Mason County resident hired to change thecharts once a month, download data from the data loggers, and perform other routine servicing.Rain gauge servicing includes checking the felt-tipped pen to make sure it is inking properly,emptying the bucket contents from approximately April–October, and noting any unusualproblems, including chart-drive malfunction, gauge imbalance or instability, vandalism,unauthorized movement of the gauge, etc. During the warm season, evaporation shields are fittedinto the collection orifice above the bucket to minimize evaporation. During the cold season, onequart of antifreeze is added to each rain gauge bucket so that any frozen precipitation collectedwill melt to allow a proper weight reading, and to prevent freeze damage to the collection bucket.Rain gauges are serviced during the first few days of the month. A memory card with the digitaldata and the 20 rain gauge charts are sent monthly to the ISWS. Appendix D presents instructionsfor the rain gauge technician.
Champaign-based personnel visit the network to perform major maintenance and repairsas needed. This usually consists of a site assessment of an observer-noted problem anddetermination of a solution. Sometimes problems pertain to the chart drives, and the usualsolution is to adjust or replace the chart drive. If replaced, the defective chart drive is cleaned andreadied for reuse at the ISWS. Other typical repairs performed on these trips include resolderingwires and battery replacement. The 20 gauges are calibrated every two years. If a gauge appearsto record consistently high or low precipitation amounts compared with its neighbors, the gauge isfirst cleaned and calibrated. If the problem persists, the gauge is replaced. Appendix E documentsnonroutine maintenance or repairs, including any site relocations, for the 20 rain gauges duringYear Thirteen.


9
Groundwater-Level Observation Well Network:Description, Operation, and Maintenance
Table 1 provides a general description of each network well, including location, depth,and the predominant soil associations in proximity to each well. This provides somedetermination of relative soil permeability around the wells. Generally, the greater permeabilitiesassociated with the Plainfield-Bloomfield, Sparta-Plainfield-Ade, and Onarga-Dakota-Sparta soilassociations (Calsyn, 1995) are found at MTOW-1, -3, -4, -6, -7, -9, and -12, which are all locatedin the western portion of the study area (Figure 1). Fine-grained materials found in the upperportion of the geologic profiles at MTOW-10 and MTOW-11 (southeastern portion of the studyarea) indicate that water levels in these two wells are under artesian conditions. Becausegroundwater in these wells is under pressure, water-level responses may be different from thoseof other wells.
The wells range in depth from 24 to 100 feet. Most network wells were constructed after1985 as part of special studies within the Imperial Valley or for use in the observation wellnetwork. A few wells that existed prior to the development of the network were used for watersupply. All of the network wells have been surveyed for well head elevation above mean sealevel.
Well MTOW-1, located at Snicarte, is an inactive, large-diameter, hand-dug domestic wellthat has been monitored by the ISWS since 1958. MTOW-1 has been incorporated into theShallow Groundwater Well Network of the ISWS Water and the Atmospheric ResourcesMonitoring (WARM) Program. This well is equipped with a Stevens Type F water-level recorderthat produces a continuous record of the groundwater level on a 32-day paper chart. ISWS staffvisit the well monthly to measure the groundwater level, change the recorder chart, and performrecorder maintenance. Therefore, a longer and more complete groundwater level record isavailable for this well than for any other well in the IVWA network.
From 1995 through 2001, groundwater levels in the IVWA observation wells weremeasured at the beginning of each month from March through November (December, January, andFebruary readings typically were not collected). Beginning in 2002, monthly measurements werecollected throughout the entire year. A mid-month measurement was collected during the1995–1997 irrigation seasons (May–October 1995, May–September 1996, and May–August1997). Groundwater levels measured manually with a steel tape or electric probe are entered into adatabase as depth below land surface. The IVWA collects these measurements, maintains thedatabase, and forwards the resulting data annually to the ISWS.
In January 2005, four of the wells (MTOW -2, -3, -7, -13) were outfitted with pressuretransducers and digital data loggers for collecting water level measurements. In Year Fourteen, sixadditional wells will be outfitted with transducers and data loggers. Manual monthlymeasurements will be discontinued at wells equipped with digital data loggers.
Manual monthly measurements will be discontinued at wells equipped with thetransducer/data logger set up; however, manual measurements will continue to be made when thedata loggers are downloaded to ensure the transducers are working properly. When a disagreementis found between manual and transducer measurements, the transducer measurement is corrected.

10
Table 1. Imperial Valley Network Observation Wells
Name I.D. LocationDepth(feet)
GeneralizedSoil Association Remarks
Snicarte MTOW-1 Section 11.8b, T.19N., R.10W., Mason County
40.5 Sparta-Plainfield-Ade
Inactive well, continuousrecord since 1958
Easton MTOW-2 Section 25.8a, T.21N., R.7W., Mason County
82 Elburn-Plano-Thorp
Abandoned city fire well
Mason County Wildlife Refuge &Recreation Area
MTOW-3 Section 14.8c, T.20N., R.9W., Mason County
24 Plainfield-Bloomfield
Installed in 1985 for ISGSstudy
Sand Ridge SR-11 MTOW-4 Section 2.8d, T.22N., R.7W., Mason County
27 Plainfield-Bloomfield
Installed in 1989 for ISWSstudy
Pekin - OW8 MTOW-5 Section 3.6a, T.24N., R.5W.,Tazewell County
49 Selma-Harpster Installed in 1991 for ISWSstudy
Mason State Tree Nursery MTOW-6 Section 33.8f, T.22N., R.7W., Mason County
45.5 Onarga-Dakota-Sparta
Installed in 1993
IL Route 136 Rest Area MTOW-7 Section 3.7e, T.21N., R.8W., Mason County
44 Onarga-Dakota-Sparta
Installed in 1993
Green Valley MTOW-8 Section 34.1c, T.23N., R.5W., Mason County
53.5 Elburn-Plano-Thorp
Installed in 1993
IDOT - DWR MTOW-9 Section 12.8e, T.21N., R.9W., Mason County
48 Sparta-Plainfield-Ade
Installed in 1994 for floodstudy
San Jose MTOW-10 Section 36.2d, T.22N., R.5W., Mason County
56 Elburn-Plano-Thorp
Old municipal well
Mason City MTOW-11 Section 18.2a, T.20N., R.5W., Mason County
63 Tama-Ipava Old municipal well
Hahn Farm MTOW-12 Section 23.8c, T.21N., R.8W.,Mason County
100 Plainfield-Bloomfield
Old turkey farm well
Talbott Tree Farm MTOW-13 Section 9.4a, T.23N, R.6W.,Tazewell County
82 Selma-Harpster Installed in 1996
__________Notes: General Soil Map Units are from Calsyn (1995).
MTOW = Mason-Tazewell Observation Well.

11
Irrigation Test Site: Description, Operation, and Maintenance (Year Three)
The irrigation test site along Crane Creek, southwest of Easton, IL, is located in Section 4of Township 20 North, Range 7 West (Crane Creek Township) on property owned by Mr. JeffSmith. Nine observation wells were installed in April 2003. Three are on the north side of CraneCreek and six are on the south side. The irrigation well is on the south side of Crane Creek; itsirrigation pattern, along with the observation well locations, are shown on Figure 2. Theobservation wells range from 31 to 37 feet deep, and the non-pumping water levels are less than 10feet below land surface during the off-irrigation season. The depth and date of construction foreach well are listed in Table 2. Monitoring included groundwater level observations (manual anddigital), surface water stage (manual and digital), creek discharge measurements, and measurementof well elevations.
Figure 2. Locations of observation wells and streamflowdischarge measurement points in relation to the irrigation test site

12
As of September 1, 2004, transducers/data loggers were installed in wells 1, 3, 5, and 6 tomeasure groundwater elevation, and in Crane Creek near the downstream bridge to measure streamelevation. The transducer in well 3 was removed on Feb 17, 2005, as it was on loan from anotherproject. Also, on Feb 17, 2005, the transducer in well 5 was found damaged and data recording hadended. The cable had been caught in a mower accidentally and the unit was destroyed. The datalogger in well 1 was removed on Sept 9, 2004. Data were collected from well 6 throughout theyear. Transducers were installed in all nine wells in the spring of 2005.
Transducers placed at the test site were set up to collect data at varying intervals. Well 6and the transducer in Crane Creek collected data on 15-minute intervals. The transducers in wells4, 5, 8, and 9 were set to collect data every 30 minutes. In wells 1, 2, 3, and 7, the transducerscollected data every hour. Hydrographs of the transducer data for the site wells are presented inAppendix F.
In total, there were 75 groundwater level hand measurements, 12 stream dischargemeasurements, 32 downloads from the transducers, and 18 stage measurements completed at thetest site during Year Thirteen. In addition, measuring point elevations of the wells and stagereadings were determined based on the downstream bridge elevation of 494.00 feet mean sea level(msl) (taken from the U.S. Geological Survey [USGS] topographic map). Elevations weresurveyed from the downstream bridge so that relative water levels could be determined. The exactelevation of the downstream bridge has yet to be determined, but assuming it is 494 feet msl, waterlevels can be plotted in relative terms to evaluate flow direction and elevation differences betweenthe groundwater system and Crane Creek. The elevations are listed in Table 2.
Table 2. Depths, Installation Dates, and Measuring Point Elevations, Imperial ValleyIrrigation Site Observation Wells
Well number Depth (feet) Date installed MP Elevation(ft msl)
1 33.10 4/23/03 492.45
2 32.75 4/22/03 495.07
3 31.10 4/23/03 493.26
4 34.30 4/22/03 495.03
5 34.75 4/22/03 491.86
6 37.00 4/22/03 495.81
7 32.85 4/23/03 496.27
8 34.00 4/23/03 494.24
9 33.50 4/23/03 492.28
Upstream bridge ---- ---- 496.61
Downstream bridge ---- ---- 494.00

13
Precipitation, Groundwater-Level, and Irrigation Data Analysis
This report presents rainfall and groundwater-level data for the period September 2004–August 2005 (Year Thirteen). Data collected from rain gauge and observation well networks weremaintained in separate databases, but the resulting data were evaluated together to examine theresponse of groundwater levels to local precipitation. Observed groundwater levels may beinfluenced by irrigation pumpage; thus an estimate of monthly pumpage must be presented.
Precipitation Analysis
Data reduction activities during Year Thirteen of network operations are similar to thoseperformed during the previous 12 years (Peppler and Hollinger, 1994, 1995; Hollinger andPeppler, 1996; Hollinger, 1997; Hollinger and Scott, 1998; Hollinger et al., 1999, 2000; Scottet al., 2001, 2002; Wehrmann et al., 2004, 2005; Wilson et al., 2008). Hourly rainfall amounts aretotaled from 10-minute digital data and are placed into an array of monthly values for the 20gauges. This data array is used to check for spatial and temporal consistency among gauges, and todivide the data into storm periods. If the digital data are missing, hourly rainfall amounts from theanalog (paper) charts are used. In the rare event that data from both a data logger and thecorresponding chart are missing, the hourly amounts are estimated based on an interpolation ofvalues from the nearest surrounding gauges.
Groundwater-Level Analysis
Monthly Measurements
Groundwater levels for each well for the period of record (1995–2005) are presentedgraphically (Appendix A) and in tabular form (Appendix B). Graphs of groundwater levels arecommonly called hydrographs. Each hydrograph also contains the total monthly precipitationamounts for the nearest rain gauge. For observation wells located between several rain gauges, anaverage of the surrounding rain gauge data is presented. Groundwater-level data are presented asdepth to water from land surface. For observation wells located relatively near the Illinois River(MTOW-1, -5, and -9), the stage of the river at the nearest U.S. Army Corps of Engineers(USACE) gauging station also is shown. Mean monthly stage data were downloaded for theBeardstown, Havana, and Kingston Mines stations from the USACE Internet site(http://water.mvr.usace.army.mil).
Continuous Measurements
Selected historical daily groundwater-level data from recorder chart records for theSnicarte observation well (MTOW-1) were transferred to digital format and graphed with dailyrainfall data from gauge 24. The results, shown in the Year Eleven report, indicate that there isindeed a quick response to rainfall at MTOW-1. In response to those findings, transducers wereinstalled in the Green Valley (MTOW-8) and Rest Area (MTOW-7) wells during Year Twelve, butonly marginal success was found in correlating rainfall to groundwater level changes at these twosites. Consequently, in Year Thirteen, four digital water level recorders were purchased andinstalled in wells MTOW -2, -3, -7, and -13.

14
Irrigation Water-Use Analysis
Since 1995, the IVWA has estimated irrigation pumpage from wells in the Imperial Valleybased on electric power consumption, using the equation below:
Q = 1505 × KWH × IRR/MECwhere Q is the total estimated monthly irrigation pumpage (in gallons), KWH is the monthlyelectrical power consumption (in kilowatt hours) used by the irrigation accounts served by MenardElectric Cooperative, IRR is the total number of irrigation systems in the IVWA region, MEC isthe number of Menard Electric Cooperative irrigation accounts, and 1505 is a power consumptionconversion factor (in gallons/KWH). Irrigation systems in the region receive electric power fromthe Menard Electric Cooperative and two investor-owned utilities (AmerenCIPS andAmerenCILCO). Menard Electric Cooperative provides the IVWA with electric powerconsumption data for the irrigation services they serve during the growing season(June–September). Not all the irrigation systems use electric power to pump water, and Menardserves only some of these systems. The pumpage estimate assumed that application rates for theirrigation wells with electric pumps in Menard Electric Cooperative also are representative ofother utilities and other energy sources. Past estimates were based on the assumption that 33percent of the irrigation wells were in Menard Electric Cooperative in 1995–1997, 40 percent in1998–2001.
In summer 2002, a USGS study indicated the need for a new power consumptionconversion factor. An updated conversion factor was determined by recording electricalconsumption while closely measuring the pumping rate at 77 irrigation systems. The updatedvalue, 1259 gallons/KWH, is appreciably lower than the previously used factor of 1505gallons/KWH, suggesting that previous estimates of water withdrawals may have overestimatedpumpage by approximately 20 percent (i.e., pumping system efficiency is estimated to be 20percent less than previously thought). Therefore, irrigation withdrawals for the years 1997 to thepresent were recalculated using the new formula, replacing earlier published estimates. Collectionof additional data related to the irrigation systems (such as system age and size) and the conversionfactors associated with those systems may further impact withdrawal estimates.
Crane Creek Discharge Measurements
The stream discharge measurements indicate that the total difference in discharge betweenthe upstream end of the site and the downstream end of the site (where the creek crosses the roads)is less than the error associated with the discharge measurement method, but given that everymeasurement consistently shows a greater discharge at the downstream gauge than at the upstreamgauge, it is believed that the data are reflecting the influence of groundwater discharge along thestream reach at the site. There appears to be no change in stream stage, even though the water levelin the groundwater system is being lowered on both sides of the creek. By surveying the wellelevations, it was found that groundwater levels are above the level of the creek, even when theirrigation system is on. In order to see a change in the stream stage, water levels in thegroundwater system would need to be lowered below the stream elevation to reverse the flowdirection toward the aquifer.

15
Results
Precipitation
Annual and Monthly Precipitation
The Year Thirteen dataset was used to produce the following analyses: 1) monthly andannual (September 2004–August 2005) precipitation amounts for each site in the IVWA network(Table 3); 2) the average precipitation pattern for the 13-year network operation (Figure 3a and b);3) the total precipitation pattern for Year Thirteen (Figure 4); 4) a comparison of totalprecipitation, precipitation events, and precipitation per event (Table 4); and 5) the averageprecipitation for each month in Year Thirteen (Figures 5–10). The annual precipitation patterns forYears One–Twelve also are presented (Appendix G).
Year Thirteen network precipitation was below average, 6.96 inches lower than thenetwork 13-year average of 34.31, 7.54 inches below the previous 12-year average of 34.89inches. It was the fourth driest period in the 13 years of network operation. Spring and summer2005 had very low monthly precipitation averages, affecting irrigation pumpage significantly.
Table 3. Monthly Precipitation Amounts (inches), September 2004–August 2005 Month
Station Sep Oct Nov Dec Jan Feb Mar Apr May Jun Jul Aug Total
2 1.62 5.09 4.79 1.26 4.18 1.7 0.66 2.42 0.54 0.96 2.18 2.62 28.023 3.24 5.31 4.73 1.22 3.92 1.35 0.61 1.46 0.85 2.27 1.59 3.47 30.024 1.55 4.56 4.70 1.22 4.13 1.58 0.70 2.68 0.58 0.45 1.75 2.65 26.556 0.55 4.79 4.31 1.17 4.12 1.56 0.53 1.91 0.85 2.50 1.45 2.05 25.797 0.56 5.43 4.33 1.22 4.12 1.56 0.74 1.67 0.94 1.51 2.34 2.52 26.948 1.17 4.55 3.44 1.32 4.45 1.44 0.67 2.57 0.81 0.26 1.55 3.11 25.349 0.78 5.24 4.98 1.26 4.33 1.89 0.61 2.41 1.16 3.67 1.85 1.86 30.04
10 0.42 5.26 4.19 1.27 4.17 1.59 0.54 2.58 1.03 2.27 1.30 2.19 26.8111 0.47 5.30 4.56 1.07 4.00 1.35 0.70 1.89 0.73 1.73 1.69 1.97 25.4612 0.64 5.37 5.18 1.29 5.18 1.64 0.78 1.89 0.87 0.55 2.28 3.08 28.7513 1.05 4.59 4.44 1.34 4.24 1.45 0.66 2.13 1.03 1.23 1.65 2.04 25.8515 0.47 4.84 4.93 1.16 4.49 1.62 0.74 2.25 0.68 1.33 1.26 1.83 25.6016 0.82 4.72 4.05 0.93 4.01 1.47 0.82 1.93 0.77 1.29 1.47 1.79 24.0718 0.51 5.33 4.66 1.43 4.56 1.82 0.73 2.33 0.86 0.53 1.54 3.09 27.3919 0.47 5.49 5.22 1.33 5.03 2.12 0.87 1.81 1.06 0.94 1.74 2.18 28.2620 0.25 4.81 4.89 1.11 4.75 1.82 0.83 1.85 1.23 1.37 1.18 2.44 26.5321 1.08 5.05 3.81 1.18 4.56 1.44 0.65 1.79 0.79 1.09 1.36 2.68 25.4822 1.67 5.81 3.98 1.18 5.36 1.87 0.79 2.15 0.93 1.71 1.53 4.24 31.2223 1.64 6.01 4.22 1.04 5.45 1.86 0.73 1.58 0.88 0.46 1.44 3.34 28.6524 0.54 5.89 5.46 1.50 4.84 1.77 0.83 2.57 0.99 0.56 1.58 3.62 30.15
Average 0.98 5.17 4.54 1.23 4.49 1.64 0.71 2.09 0.88 1.33 1.64 2.64 27.34
__________Note:Stations 1, 5, 14, 17, and 25 were removed from the network in September 1995.

16
Figure 3. Network average annual precipitation (inches) for September 1992–August 2005with all gauges (a) and without gauges 16, 19, and 21 (b)

17
Figure 4. Total precipitation (inches) for September 2004–August 2005
Table 4. Comparison of Total Precipitation (inches), Number of Precipitation Events, andAverage Precipitation per Event for Each Month and Season, 1992–2004 and 2004–2005
1992-2004 12-year average 2004-2005 averagePeriod Precipitation Events Inches/event Precipitation Events Inches/event
Sep 2.77 7.1 0.39 0.98 4 0.25Oct 2.31 9.0 0.26 5.17 16 0.32Nov 2.61 10.0 0.26 4.54 9 0.50Dec 1.46 8.8 0.17 1.23 5 0.25Jan 1.92 10.1 0.19 4.49 12 0.37Feb 1.66 8.3 0.20 1.64 7 0.23Mar 2.16 8.1 0.27 0.71 4 0.18Apr 3.51 11.4 0.31 2.09 8 0.26May 4.81 14.9 0.32 0.88 9 0.10Jun 4.06 12.2 0.33 1.33 8 0.17Jul 3.96 11.3 0.35 1.64 5 0.33Aug 3.68 13.2 0.28 2.64 11 0.24
Fall 7.68 26.1 0.29 10.69 29 0.37Winter 5.04 27.2 0.19 7.36 24 0.31Spring 10.47 34.4 0.30 3.68 21 0.18Summer 11.69 36.7 0.32 5.61 24 0.23
Annual 34.89 124.3 0.28 27.34 98 0.28

18
Figure 5. Precipitation (inches) for September 2004 and October 2004

19
Figure 6. Precipitation (inches) for November 2004 and December 2004

20
Figure 7. Precipitation (inches) for January 2005 and February 2005

21
Figure 8. Precipitation (inches) for March 2005 and April 2005

22
Figure 9. Precipitation (inches) for May 2005 and June 2005
23
Figure 10. Precipitation (inches) for July 2005 and August 2005

24
Figure 3a presents the 13-year network average including all sites; Figure 3b presents the13-year network average for all sites, excluding sites 16, 19, and 21 during the period 1997–2002,and Figure 4 presents the annual precipitation pattern for Year Thirteen. The pattern seen in the13-year network average (Figure 3a) is still dominated by values at stations 16, 19, and 21 (Figure4), which greatly differed from their neighbors during the period 1997–2002. The bias at sites 16,19, and 21 were considerably smaller for Years Eleven–Thirteen, and thus the precipitation datafor these three stations are included in all analyses. During Year Thirteen, annual gauge totalsvaried from 24.1 inches at site 16 to 31.2 inches at site 22 (Figure 4). Six-inch gradients inprecipitation are not unusual events during any given year, as long as they are not replicated at thesame gauges year after year.
October 2004 (Figure 5b) was the wettest month of Year Thirteen, reporting a 5.17-inchnetwork average, followed by November 2004 (Figure 6a, 4.54 inches), and January 2005 (Figure7a, 4.49 inches). Precipitation for those four months totaled 14.20 inches, or approximately 52percent of the total annual precipitation. March 2005 was the driest month of the year (Figure 8a,0.71 inches), followed by May 2005 (Figure 9a, 0.88 inches). Total average precipitation for thenetwork in the three spring season months (March–May) was light, 3.68 inches, or about 13percent of the yearly total.
Individually, October and November 2004 and January 2005 were wetter than the 12-yearaverage by 1.75 inches or more (see Table 4). May, June, and July 2005 were drier than averageby more than 2.0 inches, and September 2004 and March, April, and August 2005 were drier thanaverage by more than 1.0 inch. Only December 2004 and February 2005 were within ± 0.25 inchesof the 12-year average. The fall of 2004 (September–November, 10.69 inches) was the wettestseason of the year, followed by winter 2004–2005 (December–February, 7.36 inches). The fallprecipitation total was 3.02 inches above normal and the winter precipitation total was 2.32 inchesabove average. The spring total precipitation was 6.79 inches below the 12-year network springaverage, and the summer total precipitation was 6.08 inches below average.
The annual precipitation total for 2004–2005 was the fourth driest of the 13 years ofnetwork operation. The network received 28.20 inches less precipitation than in the wettest year(1992–1993) and 1.65 inches more than in the driest year (1995–1996). Year Thirteen had the thirdwettest fall (1992 and 1993 were wetter), and the second wettest winter (1992–1993 was wetter) ofthe 13 years of network operation. The spring and summer of 2005 were the driest warm seasonsof the 13 years of network operation.
Storm Events
The network precipitation events were examined for the 13-year period of record. Meanmonthly, seasonal, and annual number of these precipitation events are presented for each year(Appendix H), and for 2004–2005 (Table 4). The monthly, seasonal, and annual number ofprecipitation events averaged over the 1992–2004 period also are presented (Table 4). A networkstorm period was defined as a precipitation event separated from preceding and succeeding eventsat all network stations by at least three hours. Data for the individual network storm periods alsoare presented (Appendix I, Tables I-2 and I-3).
During this dry Year Thirteen, there were 98 precipitation events, which tied for the secondfewest number of events in 13 years of network operation. More events than average occurred inthe fall, but fewer than average events were observed during the next three seasons of the year.

25
The majority of events occurred in the fall and winter, which is unusual. The spring and summerseasons had the fewest number of precipitation events of the past 13 years. The amount ofprecipitation per event also was below average in the spring and summer of 2005, about 60 percent(spring) and 72 percent (summer) of the average amount of precipitation per event.
The plot of the network average monthly precipitation time series (Figure 11) shows themonthly variation of precipitation. It is not uncommon for five to six months of the fall–winterseasons to fall below 2.75 inches of precipitation. This occurred in the five years from 1995–1996to 1999–2000 and in the three successive years 2001–2002 to 2003–2004. It is not unusual for oneor two spring and summer months to fall below 2.75 inches of precipitation in any given year. Inthe four summers of 1995, 1996, 1997, and 2000, three or four months during the spring–summerseasons fell below 2.75 inches. The 1996, 1997, and 2000 years were drier overall than YearThirteen when all six spring–summer months fell below 2.75 inches of precipitation.
A total of 1590 network storm periods have occurred during the 13-year observationperiod: 148 in 1992–1993, 102 in 1993–1994, 129 in 1994–1995, 98 in 1995–1996, 121 in1996–1997, 134 in 1997–1998, 144 in 1998–1999, 156 in 1999–2000, 148 in 2000–2001, 122 in2001–2002, 80 in 2002–2003, 110 in 2003–2004, and 98 in 2004–2005, resulting in a 13-yearaverage of 124.3 storms per year.
Appendix I documents each network storm period for Year Thirteen with the date and hourof the start time, duration, number of sites receiving precipitation, network average precipitation,
1993 1994 1995 1996 1997 1998 1999 2000 2001 2002 2003 2004 2005Date
0.0
1.0
2.0
3.0
4.0
5.0
6.0
7.0
8.0
9.0
10.0
11.0
12.0
Tota
l Mo
nth
ly P
reci
pita
tion
(inc
hes
)
Figure 11. Network average monthly precipitation (inches), September 1992 - August 2005

26
storm average precipitation, maximum precipitation received, station (gauge) where the maximumoccurred, and storm recurrence frequency of the maximum observed precipitation. The networkaverage precipitation is the arithmetic mean of the precipitation received at all network stations,and the storm average is the arithmetic mean of the precipitation received at stations reportingprecipitation during the storm period.
The storm recurrence frequency is the statistical probability of the recurrence of a stormwith the reported precipitation (i.e., a 10-year storm would be expected to occur on average onlyonce every 10 years at a given station, or have a 10 percent chance of occurring in any given year).The recurrence frequencies computed here are based upon the total storm duration for the area. SeeAppendix I for further explanation. Also included in Appendix I is a table indicating theprecipitation received at each of the 20 stations for each network storm period for Year Thirteen(Table I-3). Sites that exceed the one-year or more recurrence frequency are indicated in bold type(Table I-3). Previous years of network storm periods can be found in Scott et al. (2002),Wehrmann et al. (2004, 2005), and Wilson et al. (2008).
In the first 12 years of operation, 61 of the 1492 storm periods produced maximumprecipitation at one or more stations with a recurrence frequency greater than one year: 50-year(1 storm), 10-year (3 storms), 5-year (8 storms), 2-year (31 storms), and greater than 1-year butless than 2-year (18 storms). The 50-year storm (storm 153) occurred on September 13, 1993, andthe 10-year storms on May 16, 1995 (storm 323), May 8, 1996 (storm 432), and July 19, 1997(storm 580). These four heaviest storms occurred during the warm season months(May–September).
Nine storms had a recurrence interval exceeding the 1-year or greater recurrence frequencyin 1992–1993, five in 1993–1994, six in 1994–1995, one in 1995–1996, three in 1996–1997, fourin 1997–1998, four in 1998–1999, five in 1999–2000, four in 2000–2001, eight in 2001–2002,seven in 2002–2003, and five in 2003–2004.
In Year Thirteen, only one of the 98 network storm periods exceeded the 1-year recurrencefrequency. Year Thirteen also had a below average number of network storm periods and a belowaverage number of heavy rainfall periods. No events exceeded the 5-year or more recurrencefrequency. The Year Thirteen heavy rain event was a 2-year event that occurred on September15–16, 2004 (storm 1495).
Groundwater Levels
Monthly Measurements
Groundwater levels in observation wells MTOW-5 and MTOW-9, because of theirproximity to the Illinois River, have been found to fluctuate largely in response to river stage. Thepeak mean monthly Illinois River stage during Year Thirteen occurred in January and February2005. For three straight months the Illinois River had a mean stage of more than 440 feet msl.River stage had exceeded 440 feet msl only one month since 2002. Because of the extended,elevated river stage, groundwater levels in MTOW-5 and -9 show strong recovery during thosethree months (Dec. 2004–Feb. 2005).
Most of the study area had fairly consistent average to above average rainfall fromFebruary 2004 through January 2005. In that span, there were at least five months with 4 inches of

27
rain at nearly every gauge. The aquifer responded accordingly and groundwater levels rose in allthe observation wells through March 2005, except for those close to the Illinois River, whichbegan declining in February. Beginning in March, however, precipitation amounts decreasedsignificantly. The following months were below the 12-year average for the study area and waterlevels declined through August 2005; some wells were at or near the lowest point they have beensince the project began (see the graphs in Appendix A).
As witnessed in Year Thirteen, and because the aquifer is very near or at land surface in thestudy area, recharge can occur at any time of the year when rainfall amounts are significant.Significant precipitation in Fall 2004 through January 2005 resulted in aquifer recharge, andconversely, the lack of precipitation from March 2005 through August 2005 limited recharge to theaquifer and groundwater levels declined.
The long-term hydrograph at MTOW-1 (Snicarte) in Figure 12 provides a reference forcomparison with the shorter records of the other network wells. The ISWS has recorded waterlevels in this well since 1958. Annual fluctuations from less than 1 foot to more than 6 feet havebeen observed. Based on available data, these annual fluctuations often appear to be superimposedon longer-term trends, perhaps of 10 years or more. For the 47-year record, both the record lowand high have been observed within the past 15 years. A detailed look at water levels since 1990 isshown in Figure 13. During and shortly after the drought years of 1988 and 1989, the water levelfell to 40.5 feet below land surface from September 1989 until April 1990, the only time in its 45-year history that MTOW-1 went dry. During the 1993 flood, groundwater levels rose almost 10feet and peaked at approximately 30 feet in September 1993. In the years since then, groundwaterlevels in MTOW-1 showed an almost linear decline until 1998, when water levels again rosedramatically, recovering to peak levels similar to those observed in 1994 and 1995. In 2005 thiswell was close to being dry; the August 31, 2005 water level measurement (September reading)was 39.90 feet below land surface.
Irrigation Test Site Measurements
The data for wells 3 and 6 are shown in Figure 14 along with the stage in Crane Creek and precipitation from gauge 20. The data show each summer’s effects from irrigation pumpage at thesite. Figure 14 graphically represents the significance of the dry summer in 2005 as well as thesignificance of heavy rainfall that occurred in May and June of 2004. The number of irrigationpumpage cycles completed at the site in 2005 can be counted on the figure. The dry summerrequired more frequent irrigation than in 2004 or 2003.
Figure 15 shows discharge versus time for the upstream and downstream portion of CraneCreek. Fewer measurements (12) were taken during the summer of 2005 because it appeared thatthe values from 2004 provided better representation of creek conditions. The readings continued toshow that the downstream discharge was higher than the upstream discharge, indicating thegroundwater system was contributing to the stream. Development of the groundwater model at thesite will help to quantify the loss of groundwater to the stream at the site. The results of the modelcan then be evaluated against the field data and should correlate with what we have seen with ourdischarge measurements.

28
Figure 13. Groundwater levels at the Snicarte well, MTOW-1, 1990-2005
1955 1965 1975 1985 1995 2005Year
42
40
38
36
34
32
30
28D
epth
to w
ate
r, fe
et
Grea t F lo od of 1 99 3
1 988 -1 989 D rou gh t
aa
Figure 12. Groundwater levels at the Snicarte well, MTOW-1, 1958-2005
1990 1992 1994 1996 1998 2000 2002 200442
40
38
36
34
32
30
28
Depth
to w
ate
r, fe
et b
elo
w la
nd s
urface
1993 Flood
1988-89 Drought

29
4/1/04 7/10/04 10/18/04 1/26/05 5/6/05 8/14/05Date
0
20
40
60
Str
ea
m D
isch
arg
e (
cfs)
Upstream
Downstream
Figure 15. Discharge measurements in Crane Creek at the irrigation test site
Jul-03 Oct-03 Jan-04 Apr-04 Jul-04 Oct-04 Jan-05 Apr-05 Jul-05
13
12
11
10
9
8
7
6
5
4
Dep
th to
wat
er, f
eet
0
1
2
3
Dai
ly p
recip
itatio
n, i
nches
0
2
4
6
Cra
ne
Cre
ek
sta
ge, f
eet
Well #3
Well #6
Crane Creek
Figure 14. Groundwater level (Wells 3 & 6), Crane Creek stage elevation, andprecipitation (Gauge 20) at the irrigation test site. Triangles are manual readings.

30
Continuous Measurements
An analysis of the continuous record from the Snicarte well (MTOW-1) in the Year ElevenReport (Wehrmann et al., 2005) indicated that recharge often occurs within one to three days ofthe rainfall event and typically lasts three to five days after the rainfall event has ended. Thisanalysis confirms that aquifer response to rainfall can happen quickly, as expected, given thepermeable surface soils typical of the area. Further, duration of the recharge events vary based onthe magnitude of the rainfall event. In other words, recharge occurs on a scale of days, not monthsafter a precipitation event; thus, using monthly water-level data to develop correlations withrainfall may not be meaningful.
In response to this finding, transducers were placed in the Green Valley (MTOW-8) andRoute 136 Rest Area (MTOW-7) observation wells during Year Twelve to begin collectingcontinuous water-level data. The data indicated that indeed recharge was evident two to three daysafter significant rainfall events at these wells.
Based on the success of these results, the IVWA purchased four In-Situ Mini-troll dataloggers and installed them in four wells on December 30, 2004. The wells outfitted with digitalrecorders are Easton (MTOW-2), Wildlife Refuge (MTOW-3), Rest Area (MTOW-7), and theTalbott Tree Farm (MTOW-13). Figures 16–19 illustrate the water-level data collected for thesefour wells during Year Thirteen. Six more data loggers were purchased at the end of Year Thirteento place in six additional network wells.
These water-level measurements from the short period of record do not show the rechargeevents as clearly as have been evident on past datasets. This is likely because Year Thirteen was anunusually dry year, with only one storm greater than a 1-year recurrence interval, that being a 2-year storm. It is anticipated that as more data are collected and more severe storm events occur,recharge events will be evident on the water level hydrographs. For this year, however, only theEaston well showed recharge events that can be correlated to precipitation events. Figures 20 and21 show the effects of precipitation on water levels for January and April of 2005.
9/1/04 12/31/04 5/2/05 8/31/05Date
495
497
499
501
503
505
Gro
und
wat
er E
leva
tion
(fee
t ab
ove
MS
L)
September 1, 2004 - August 31, 2005 Digital Measurements
Hand Measurements
Figure 16. Digital water level data for the Easton well (MTOW-2)

31
Figure 18. Digital water level data for the Rest Area (MTOW-7)
9/1/04 12/31/04 5/2/05 8/31/05Date
470
472
474
476
478
480G
rou
nd
wa
ter
Ele
vatio
n (
fee
t ab
ove
MS
L)
Digital Measurement
Hand MeasurementSeptember 1, 2004 - August 31, 2005
Figure 17. Digital water level data for the Wildlife Refuge (MTOW-3)
9/1/04 12/31/04 5/2/05 8/31/05Date
470
472
474
476
478
480
Gro
undw
ate
r E
leva
tion (
feet a
bove
MS
L)
September 1, 2004 - August 31, 2005 Digital Measurement
Hand Measurement

32
Figure 19. Digital water level data for the Talbott Tree Farm network well (MTOW-13)
Figure 20. Groundwater elevations and precipitation at the Easton network well (MTOW-2)for a January 2005 recharge event
9/1/04 12/31/04 5/2/05 8/31/05Date
460
462
464
466
468
470G
roun
dwat
er E
leva
tion
(feet
abo
ve M
SL)
September 1, 2004 - August 31, 2005 Digital MeasurementHand Measurement
12/31/04 1/10/05 1/20/05 1/30/05Date
14
12
10
8
6
4
De
pth
to w
ate
r at
MT
OW
-2, f
eet
bel
ow la
nd
su
rfac
e
0
2
4
6
Pre
cip
itatio
n (
inch
es)
Groundwater Level
Precipitation

33
Figure 21. Groundwater elevations and precipitation at the Easton network well (MTOW-2)for an April 2005 recharge event
Irrigation Water Use
Low precipitation during the growing season affected irrigation demand dramatically duringYear Thirteen. Since 1995 the average irrigation withdrawals were 41 billion gallons (bg) a year,ranging from 30 to 50 bg. In 2005, however, the total irrigation pumpage was approximately 72 bg.This is 70 percent above average for the previous 10 years and 20 bg more than in any other year.
Monthly and seasonal estimates of irrigation withdrawals are shown in Table 5. These datawere calculated for the Imperial Valley by previously described methods. Total annual irrigationwithdrawals, from highest to lowest, are as follows: 2005; 1996; 2001 and 2002 (equal); 2003;2004; 1999; 1997 and 1995 (equal); and 1998 and 2000 (equal). Though more irrigation systemsare added each year, this year (2005) showed that rainfall during the irrigation season is the primaryfactor in determining the amount of irrigation that takes place. Note also that even though there aremore systems operating, the production from each system, 0.037 billion gallons, was much higherthan any previous year. The greatest average irrigation withdrawals typically occur in July andAugust, and the least occur in September and June.
The estimated monthly irrigation pumpage also is displayed graphically in Figure 22 withaverage monthly network precipitation. These pumpage values show a tendency toward lowerirrigation amounts with increasing precipitation and vice versa, but also show that irrigation isdependent on the timing of precipitation. For example, only 30 bg were pumped in 2000 (YearEight), even though Year Eight showed a precipitation deficit of 9.5 inches (Table 6). This wasbecause significant precipitation fell during the summer of 2000, reducing the need for irrigation.Year Thirteen was the fourth driest of network operation, 7.55 inches lower than the network 12-year average precipitation (Table 4), but because the irrigation season was dry, it had the highestirrigation pumpage recorded for the study area.
4/1/05 4/8/05 4/15/05 4/22/05 4/29/05Date
11
10
9
8
7
De
pth
to w
ate
r at
MT
OW
-2, f
eet
bel
ow la
nd
su
rfac
e
0
2
4
6
Pre
cip
itatio
n (
inch
es)
Groundwater Level
Precipitation

34
Table 5. Estimated Monthly Irrigation Withdrawals (billion gallons),Number of Irrigation Systems, Withdrawal per System, and Withdrawal Rank
Year June July August September Total # Systems BG/system Rank
1995 2.6 14 10 11 38 81996 2.0 20 18 12 52 21997 2.6 19 14 2.0 38 81998 2.1 7.8 13 6.9 30 1622 .018 101999 2.8 18 12 6.0 39 1771 .022 72000 6.4 6.0 12 5.6 30 1799 .017 102001 4.4 21 17 5.0 47 1818 .026 32002 3.4 24 16 3.7 47 1839 .026 32003 4.1 16 15 10 46 1867 .025 52004 5.3 12 19 5.7 42 1889 .022 62005 15 29 23 4.8 72 1909 .037 1
Average 4.6 17 16 6.6 44__________Note: Total annual withdrawal may differ from sum of monthly withdrawals due to rounding error. Also, data regarding the number of systems in 1995–1997 are unavailable.
Table 6. Average Annual Precipitation, Annual Precipitation Surplus, Running Surplus,and Ranked Annual Precipitation and Irrigation
September–August Network average Annual Running Rank period precipitation (in.) surplus (in.) surplus (in.) Precip. Irrigation
1992 - 1993 55.55 +18.79 +18.79 1 -1993 - 1994 40.21 +3.45 +22.24 2 -1994 - 1995 39.42 +2.66 +24.90 5 81995 - 1996 25.70 -11.06 +13.84 13 21996 - 1997 27.31 -9.45 +4.39 11 81997 - 1998 40.06 +3.30 +7.69 3 101998 - 1999 34.02 -2.74 +4.95 6 71999 - 2000 25.81 -10.95 -6.00 12 102000 - 2001 30.97 -5.79 -11.79 7 32001 - 2002 39.91 +3.15 -8.64 4 32002 - 2003 30.06 -6.70 -15.34 8 52003 - 2004 29.64 -7.12 -22.46 9 62004 - 2005 27.34 -9.42 -31.88 10 1
1971–2000 30-yr average 37.82 (Havana)1971–2000 30-yr average 35.70 (Mason City)1971–2000 30-yr average 36.76 (average of Mason City and Havana used to determine surplus)Note: Site 16 was excluded from network average computations from 1996-1997 through 2001-2002.

35
Figure 22. Estimated irrigation pumpage and average monthly precipitation, Imperial Valley
Note: Site 16 was excluded from network average computations from 1996-1997 through 2001-2002.
Table 6 shows that for seven of the past nine years, rainfall has been below the 30-year,historical average, although the timing of rainfall during the growing season has the most impact onthe amount of irrigation withdrawals. With 287 more systems in 2005 than in 1998, the increase inthe number of irrigation systems also must play a role in how much water is being applied withinthe IVWA. The increase has been steady over the past few years, averaging about 20 new systems ayear. Obviously, 2005 was an unusually dry year and required additional irrigation to meet cropneeds. This year highlights the importance of the timing of rainfall on the need for irrigation.
1995 1996 1997 1998 1999 2000 2001 2002 2003 2004 2005 20060
5
10
15
20
25
30
35
40E
stim
ate
d m
on
thly
irri
ga
tion
pu
mp
ag
e, b
illio
n g
allo
ns
0
2
4
6
8
10
12
Mo
nth
ly P
reci
pita
tion
(in
che
s)
Estimated monthly irrigation pumpage (June-September)
Monthly precipitation Totals

37
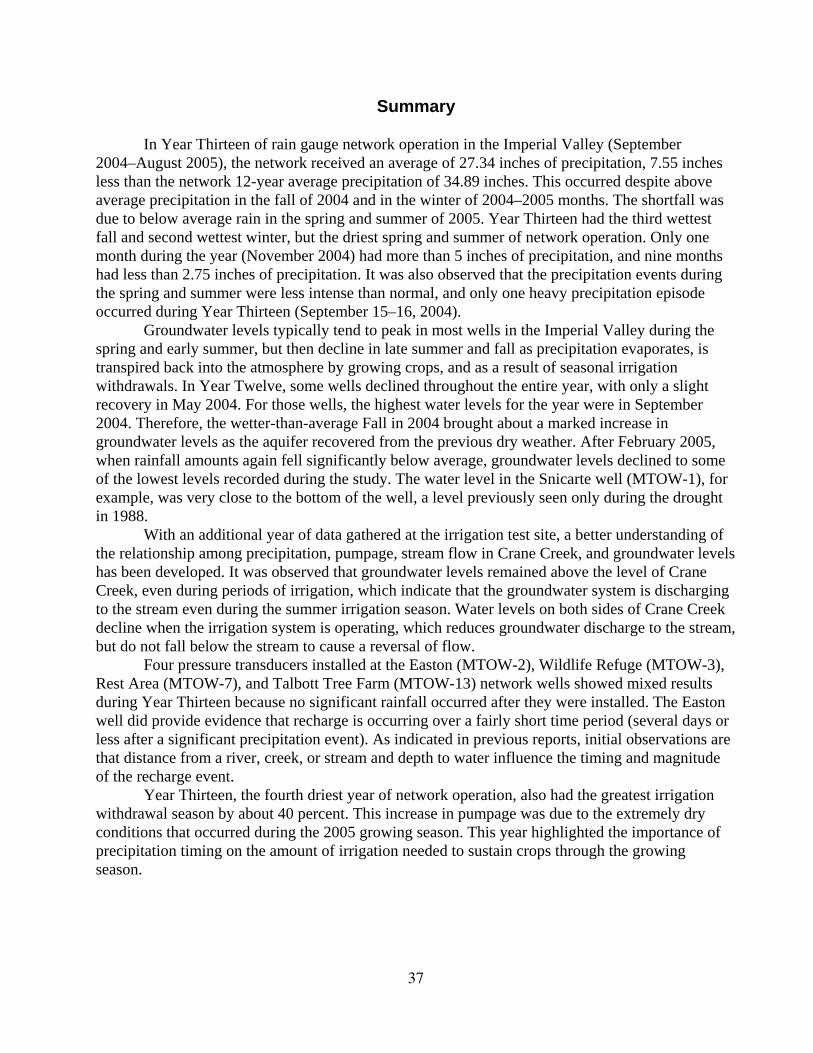
Summary
In Year Thirteen of rain gauge network operation in the Imperial Valley (September2004–August 2005), the network received an average of 27.34 inches of precipitation, 7.55 inchesless than the network 12-year average precipitation of 34.89 inches. This occurred despite aboveaverage precipitation in the fall of 2004 and in the winter of 2004–2005 months. The shortfall wasdue to below average rain in the spring and summer of 2005. Year Thirteen had the third wettestfall and second wettest winter, but the driest spring and summer of network operation. Only onemonth during the year (November 2004) had more than 5 inches of precipitation, and nine monthshad less than 2.75 inches of precipitation. It was also observed that the precipitation events duringthe spring and summer were less intense than normal, and only one heavy precipitation episodeoccurred during Year Thirteen (September 15–16, 2004).
Groundwater levels typically tend to peak in most wells in the Imperial Valley during thespring and early summer, but then decline in late summer and fall as precipitation evaporates, istranspired back into the atmosphere by growing crops, and as a result of seasonal irrigationwithdrawals. In Year Twelve, some wells declined throughout the entire year, with only a slightrecovery in May 2004. For those wells, the highest water levels for the year were in September2004. Therefore, the wetter-than-average Fall in 2004 brought about a marked increase ingroundwater levels as the aquifer recovered from the previous dry weather. After February 2005,when rainfall amounts again fell significantly below average, groundwater levels declined to someof the lowest levels recorded during the study. The water level in the Snicarte well (MTOW-1), forexample, was very close to the bottom of the well, a level previously seen only during the droughtin 1988.
With an additional year of data gathered at the irrigation test site, a better understanding ofthe relationship among precipitation, pumpage, stream flow in Crane Creek, and groundwater levelshas been developed. It was observed that groundwater levels remained above the level of CraneCreek, even during periods of irrigation, which indicate that the groundwater system is dischargingto the stream even during the summer irrigation season. Water levels on both sides of Crane Creekdecline when the irrigation system is operating, which reduces groundwater discharge to the stream,but do not fall below the stream to cause a reversal of flow.
Four pressure transducers installed at the Easton (MTOW-2), Wildlife Refuge (MTOW-3),Rest Area (MTOW-7), and Talbott Tree Farm (MTOW-13) network wells showed mixed resultsduring Year Thirteen because no significant rainfall occurred after they were installed. The Eastonwell did provide evidence that recharge is occurring over a fairly short time period (several days orless after a significant precipitation event). As indicated in previous reports, initial observations arethat distance from a river, creek, or stream and depth to water influence the timing and magnitudeof the recharge event.
Year Thirteen, the fourth driest year of network operation, also had the greatest irrigation withdrawal season by about 40 percent. This increase in pumpage was due to the extremely dryconditions that occurred during the 2005 growing season. This year highlighted the importance ofprecipitation timing on the amount of irrigation needed to sustain crops through the growingseason.


39
References
Calsyn, D.E. 1995. Soil Survey of Mason County, Illinois. Illinois Agricultural Experiment StationSoil Report 146, U.S. Department of Agriculture, Natural Resources Conservation Service andUniversity of Illinois, Urbana, IL.
Clark, G.R. 1994. Mouth of the Mahomet Regional Groundwater Model, Imperial Valley Region ofMason, Tazewell, and Logan Counties, Illinois. Illinois Department of Transportation, Divisionof Water Resources, Springfield, IL.
Hollinger, S.E. 1997. Continued Operation of a Raingage Network for the Imperial Valley WaterAuthority, Year Four: September 1995–August 1996. Illinois State Water Survey ContractReport 615, Champaign, IL.
Hollinger, S.E., and R.A. Peppler. 1996. Continued Operation of a Raingage Network for theImperial Valley Water Authority, Year Three: September 1994–August 1995. Illinois StateWater Survey Contract Report 597, Champaign, IL.
Hollinger, S.E., and R.W. Scott. 1998. Continued Operation of a Raingage Network for theImperial Valley Water Authority, Year Five: September 1996–August 1997. Illinois State WaterSurvey Contract Report 625, Champaign, IL.
Hollinger, S.E., H.A. Wehrmann, R.D. Olson, and R.W. Scott. 2000. Operation of Rain Gauge andGround-water Monitoring Networks for the Imperial Valley Water Authority, Year Seven:September 1998–August 1999. Illinois State Water Survey Contract Report 2000-12,Champaign, IL.
Hollinger, S.E., H.A. Wehrmann, R.D. Olson, R.W. Scott, and R. Xia. 1999. Operation of RainGauge and Ground-Water Monitoring Networks for the Imperial Valley Water Authority, YearSix: September 1997–August 1998. Illinois State Water Survey Contract Report 646,Champaign, IL.
Huff, F.A. 1970. Sampling errors in measurement of mean precipitation. Journal of AppliedMeteorology 9:35–44.
Huff, F.A., and J.R. Angel. 1989. Frequency Distributions and Hydroclimatic Characteristics ofHeavy Rainstorms in Illinois. Illinois State Water Survey Bulletin 70, Champaign, IL.
Panno, S.V., K.C. Hackley, K. Cartwright, and C.L. Liu. 1994. Hydrochemistry of the MahometBedrock Valley Aquifer, east-central Illinois: Indicators of recharge and ground-water flow.Ground Water 32: 591–604.
Peppler, R.A., and S.E. Hollinger. 1994. Installation and Operation of a Raingauge Network for theImperial Valley Water Authority, Year One: September 1992–August 1993. Illinois State WaterSurvey Contract Report 575, Champaign, IL.

40
Peppler, R.A., and S.E. Hollinger. 1995. Continued Operation of a Raingage Network for theImperial Valley Water Authority, Year Two: September 1993–August 1994. Illinois State WaterSurvey Contract Report 583, Champaign, IL.
Sanderson, E.W., and A.G. Buck. 1995. Reconnaissance Study of Ground-Water Levels in theHavana Lowlands Area. Illinois State Water Survey Contract Report 582, Champaign, IL.
Scott, R.W., H.A. Wehrmann, and S.E. Hollinger. 2001. Operation of Rain Gauge andGroundwater Monitoring Networks for the Imperial Valley Water Authority, Year Eight:September 1999–August 2000. Illinois State Water Survey Contract Report 2001-15,Champaign, IL.
Scott, R.W., H.A. Wehrmann, and S.E. Hollinger. 2002. Operation of Rain Gauge andGroundwater Monitoring Networks for the Imperial Valley Water Authority, Year Nine:September 2000–August 2001. Illinois State Water Survey Contract Report 2002-07,Champaign, IL.
Walker, W.H., R.E. Bergstrom, and W.C. Walton. 1965. Preliminary Report on the Ground-WaterResources of the Havana Lowlands Region in West-Central Illinois. Illinois State Water Surveyand Illinois State Geological Survey Cooperative Ground-Water Report 3, Champaign, IL.
Wehrmann, H.A., N.E. Westcott, and R.W. Scott. 2004. Operation of Rain Gauge andGroundwater Monitoring Networks for the Imperial Valley Water Authority, Year Ten:September 2001–August 2002. Illinois State Water Survey Contract Report 2004-01,Champaign, IL.
Wehrmann, H.A., S. D. Wilson, and N.E. Westcott. 2005. Operation of Rain Gauge andGroundwater Monitoring Networks for the Imperial Valley Water Authority, Year Eleven:September 2002–August 2003. Illinois State Water Survey Contract Report 2005-06,Champaign, IL.
Wilson, S.D., H.A. Wehrmann, K.L. Rennels, and N.E. Westcott. 2008. Operation of Rain Gaugeand Groundwater Monitoring Networks for the Imperial Valley Water Authority, Year Twelve:September 2003–August 2004. Illinois State Water Survey Contract Report 2008-12,Champaign, IL.

Appendix A. Hydrographs, Imperial Valley Observation Well Network

42
Appendix A. Hydrographs, Imperial Valley Observation Well Network
This appendix shows hydrographs of groundwater levels in each of the Imperial Valley observationwells. The hydrographs also include monthly precipitation totals from the nearest rain gauge oraverage of nearby gauges from the Imperial Valley rain gauge network, and Illinois River stage forwells near the river. The hydrographs maintain a common y-axis range (25 feet).
Figure A-1. Groundwater depth and precipitation for MTOW-1
Figure A-2. Groundwater depth and Illinois River stage for MTOW-1
Observed depth to water in MTOW-1
Total monthly precipitation at Gauge 24
0
2
4
6
8
10
12
14
16
Tota
l month
ly p
reci
pita
tion a
t Gauge 2
4, i
nch
es
1995 1996 1997 1998 1999 2000 2001 2002 2003 2004 2005
55
50
45
40
35
30
Dept
h to
wate
r at
MTO
W-1
, fee
t be
low
land
surfac
e
Observed depth to water in MTOW-1
Mean IL River stage at Beardstown
425
430
435
440
445
450
IL R
iver st
age a
t Beard
stow
n, f
eet-m
sl
1995 1996 1997 1998 1999 2000 2001 2002 2003 2004 200555
50
45
40
35
30
Dept
h to
wate
r at
MTO
W-1
, fee
t be
low
land
surfac
e

43
Appendix A. (continued)
Figure A-3. Groundwater depth and precipitation for MTOW-2
Figure A-4. Groundwater depth and precipitation for MTOW-3
1995 1996 1997 1998 1999 2000 2001 2002 2003 2004 2005
25
20
15
10
5
0
Dep
th to
wat
er in
MTO
W-2
, fe
et b
elow
land
surfac
e Observed depth to water in MTOW-2
Avg. of total monthly precipitation at Gauges 15, 20, and 21
0
2
4
6
8
10
12
14
16
Ave
rage o
f tota
l month
ly p
reci
pita
tion a
t Gauges
15, 2
0, a
nd 2
1
1995 1996 1997 1998 1999 2000 2001 2002 2003 2004 2005
0
2
4
6
8
10
12
14
16
Tota
l mon
thly
pre
cipita
tion
at G
auge
18
30
25
20
15
10
5
Dept
h to
wate
r in
MTO
W-3
, feet
bel
ow la
nd
surface Observed depth to water in MTOW-3
Total monthly precipitation at Gauge 18

44
Appendix A. (continued)
Figure A-5. Groundwater depth and precipitation for MTOW-4
Figure A-6. Groundwater depth and precipitation for MTOW-5
1995 1996 1997 1998 1999 2000 2001 2002 2003 2004 2005
30
25
20
15
10
5
Dept
h to
wate
r in
MTO
W-4
, fe
et b
elow
land
surface
0
4
8
12
16
Tot
al M
onth
ly P
reci
pita
tion a
t G
auge
4
Observed depth to water in MTOW-4
Total monthly precipitation at Gauge 4
0
2
4
6
8
10
12
14
16
Ave
rage o
f tota
l month
ly p
reci
pita
tion a
t Gauges
2 a
nd 3
45
40
35
30
25
20
Dep
th to
wat
er in
MTO
W-5
, fe
et b
elow
land
sur
face
1995 1996 1997 1998 1999 2000 2001 2002 2003 2004 2005
Observed depth to water in MTOW-5
Avg. of total monthly precipitation at Gauges 2 and 3

45
Appendix A. (continued)
Figure A-7. Groundwater depth and Illinois River stage for MTOW-5
Figure A-8. Groundwater depth and precipitation for MTOW-6
425
430
435
440
445
450
Mean IL
Riv
er st
age a
t Kin
gst
on M
ines,
feet-m
sl
40
35
30
25
20
15
Dep
th to
wate
r in
MTO
W-5
, fe
et b
elow
land
surface
1995 1996 1997 1998 1999 2000 2001 2002 2003 2004 2005
Observed depth to water in MTOW-5
Mean IL River stage at Kingston Mines
0
2
4
6
8
10
12
14
16
Ave
rage o
f tota
l month
ly p
reci
pita
tion a
t Gauges
9,1
0 &
15
1995 1996 1997 1998 1999 2000 2001 2002 2003 2004 2005
30
25
20
15
10
5
Dep
th to
wat
er in
MTO
W-6
, fee
t bel
ow la
nd s
urfa
ce Observed depth to water in MTOW-6
Avg. of total monthly precipitation at Gauges 9, 10 & 15

46
Appendix A. (continued)
Figure A-9. Groundwater depth and precipitation for MTOW-7
Figure A-10. Groundwater depth and Illinois River stage for MTOW-7
0
2
4
6
8
10
12
14
16
Tot
al m
onth
ly p
reci
pita
tion
at G
aug
e 1
3
1995 1996 1997 1998 1999 2000 2001 2002 2003 2004 2005
30
25
20
15
10
5
Dept
h to
wate
r in
MTO
W-7
, fe
et b
elow
land s
urface Observed depth to water in MTOW-7
Total monthly precipitation at Gauge 13
425
430
435
440
445
450
Mean IL
Riv
er st
age a
t Hava
na, f
eet-m
sl
1995 1996 1997 1998 1999 2000 2001 2002 2003 2004 2005
30
25
20
15
10
5
Dept
h to
wate
r in
MTO
W-7
, fe
et b
elow
land s
urface Observed depth to water in MTOW-7
Mean IL River stage at Havana
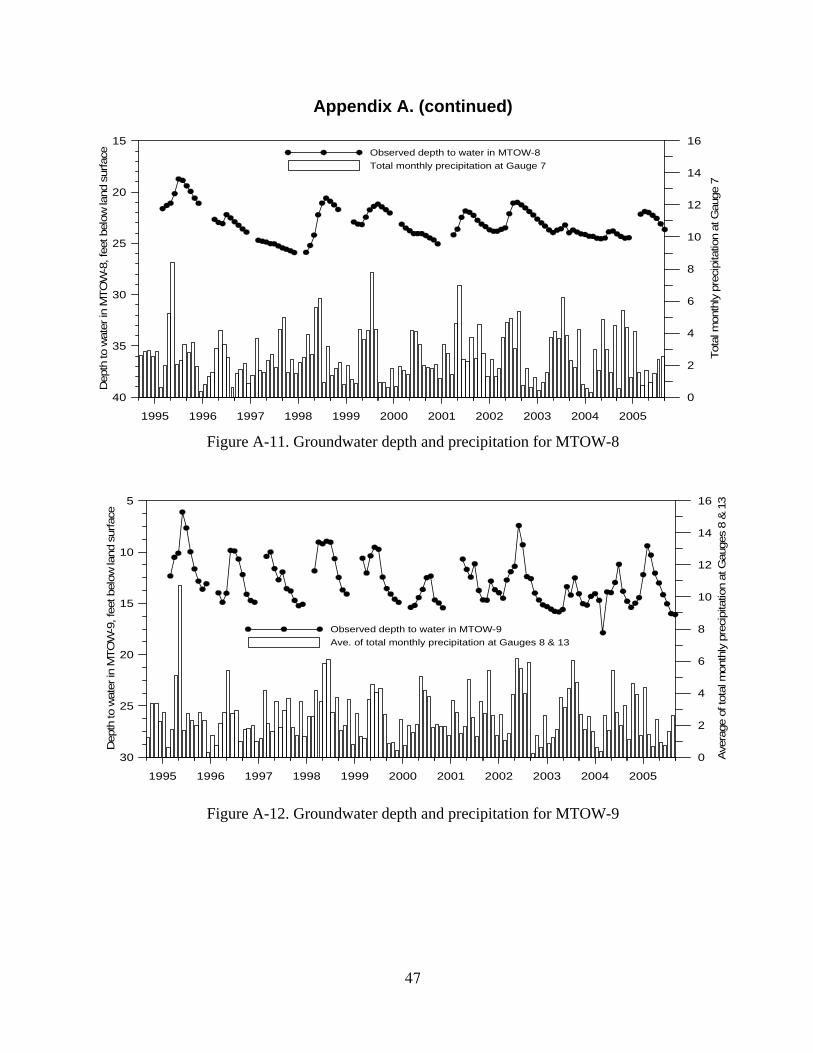
47
Appendix A. (continued)
Figure A-11. Groundwater depth and precipitation for MTOW-8
Figure A-12. Groundwater depth and precipitation for MTOW-9
0
2
4
6
8
10
12
14
16
Tota
l mon
thly
pre
cipi
tatio
n at G
aug
e 7
1995 1996 1997 1998 1999 2000 2001 2002 2003 2004 2005
40
35
30
25
20
15
Dept
h to
wate
r in
MTO
W-8
, feet
bel
ow la
nd s
urface Observed depth to water in MTOW-8
Total monthly precipitation at Gauge 7
0
2
4
6
8
10
12
14
16
Ave
rage o
f to
tal m
onth
ly p
reci
pita
tion a
t Gaug
es
8 &
13
1995 1996 1997 1998 1999 2000 2001 2002 2003 2004 2005
30
25
20
15
10
5
Dept
h to w
ate
r in
MTO
W-9
, fe
et b
elow
land
surface
Observed depth to water in MTOW-9
Ave. of total monthly precipitation at Gauges 8 & 13

48
Appendix A. (continued)
Figure A-13. Groundwater depth and Illinois River stage for MTOW-9
Figure A-14. Groundwater depth and precipitation for MTOW-10
425
430
435
440
445
450
Mean m
onth
ly IL
Riv
er st
age a
t Hava
na, f
eet-m
sl
1995 1996 1997 1998 1999 2000 2001 2002 2003 2004 2005
30
25
20
15
10
5
Depth
to w
ate
r in
MTO
W 9
, feet b
elo
w la
nd s
urface Observed depth to water in MTOW-9
Mean monthly IL River stage at Havana
0
2
4
6
8
10
12
14
16
Tota
l mon
thly
pre
cipita
tion
at G
aug
e 1
2
1995 1996 1997 1998 1999 2000 2001 2002 2003 2004 2005
45
40
35
30
25
20
Depth
to w
ater
in M
TO
W-1
0, f
eet be
low
land
surface Observed depth to water in MTOW-10
Total monthly precipitation at Gauge 12

49
Appendix A. (continued)
Figure A-15. Groundwater depth and precipitation for MTOW-11
Figure A-16. Groundwater depth and precipitation for MTOW-12
0
2
4
6
8
10
12
14
16
Ave
rage
of to
tal m
onth
ly p
reci
pita
tion a
t G
auges
22
& 2
3
1995 1996 1997 1998 1999 2000 2001 2002 2003 2004 2005
45
40
35
30
25
20
Depth
to w
ater
in M
TO
W-1
1, f
eet b
elo
w la
nd
surfac
e
Observed depth to water in MTOW-11
Avg. of total monthly precipitation at Gauges 22 & 23
0
2
4
6
8
10
12
14
16
Ave
rage
of to
tal m
onth
ly p
reci
pita
tion a
t G
auges
13
& 2
0
1995 1996 1997 1998 1999 2000 2001 2002 2003 2004 2005
30
25
20
15
10
5
Depth
to w
ater
in M
TO
W-1
2, f
eet b
elo
w la
nd
surfac
e
Observed depth to water in MTOW-12
Avg. of total monthly precipitation at Gauges 13 & 20

50
Appendix A. (concluded)
Figure A-17. Groundwater depth and precipitation for MTOW-13
0
2
4
6
8
10
12
14
16
Tota
l mont
hly
pre
cipi
tatio
n a
t Gaug
e 2
1995 1996 1997 1998 1999 2000 2001 2002 2003 2004 2005
55
50
45
40
35
30
Depth
to w
ate
r in
MTO
W-1
3, f
eet
belo
w la
nd
surface Observed depth to water in MTOW-13
Total monthly precipitation at Gauge 2

Appendix B. Observed Groundwater Levels, Imperial Valley Observation Well Network

52
Appendix B. Observed Groundwater Levels, Imperial Valley Observation Well Network
Depth to Water (feet below land surface) at Imperial Valley Network Observation Wells Date MTOW-1 MTOW-2 MTOW-3 MTOW-4 MTOW-5 MTOW-6 MTOW-7 MTOW-8 MTOW-9 MTOW-10 MTOW-11 MTOW-12 MTOW-13
3-01-1995 -.-- 8.88 13.11 9.15 27.06 16.45 13.15 21.62 12.54 27.14 30.38 -.-- -.--4-01-1995 -.-- 7.45 12.94 9.12 23.87 16.20 12.82 21.31 10.52 26.84 30.48 11.49 -.--5-01-1995 -.-- 6.69 12.65 8.92 23.50 15.95 12.63 21.09 10.12 26.48 30.32 9.67 -.--5-15-1995 -.-- 3.50 10.50 8.78 22.67 15.16 11.12 20.80 11.12 25.93 28.76 7.97 -.--6-01-1995 -.-- 2.67 8.80 8.57 21.50 14.17 10.07 20.16 6.12 25.60 27.67 8.00 -.--6-15-1995 -.-- 4.51 8.07 7.64 18.24 13.15 9.74 19.03 5.26 25.79 26.11 8.68 -.--7-01-1995 -.-- 6.15 8.74 7.03 21.43 13.31 10.30 18.73 7.66 25.97 25.88 8.64 -.--7-15-1995 -.-- 6.10 9.08 6.87 24.49 13.60 10.52 18.69 8.80 25.90 25.68 9.71 -.--8-01-1995 -.-- 8.10 9.77 6.47 26.82 14.17 11.11 18.87 9.98 26.55 26.05 10.13 -.--8-15-1995 -.-- 8.80 10.38 7.33 30.47 14.67 11.41 19.12 11.21 26.01 26.45 11.12 -.--9-01-1995 -.-- 9.65 10.96 7.58 31.28 15.11 12.00 19.40 11.65 26.42 26.79 11.52 -.--9-15-1995 -.-- 10.19 11.65 7.82 31.93 15.47 12.44 19.66 12.24 26.57 27.22 11.86 -.--
10-01-1995 -.-- 10.35 12.27 7.99 30.09 15.76 12.69 19.94 12.84 26.64 27.69 12.12 -.--10-15-1995 -.-- 10.40 12.81 8.17 32.79 16.05 12.95 20.21 13.29 26.75 28.02 12.13 -.--11-01-1995 -.-- 10.30 13.12 8.55 32.30 16.50 13.19 20.60 13.63 26.61 28.47 12.17 -.--12-01-1995 -.-- 10.35 13.62 8.85 30.70 16.60 13.45 21.10 13.09 27.00 29.43 12.39 -.--
3-01-1996 37.18 10.90 14.89 9.80 32.00 17.47 14.58 -.-- 13.98 27.90 30.40 13.30 35.524-01-1996 37.19 10.77 15.01 10.07 33.77 17.70 15.20 22.67 14.90 28.07 30.92 13.34 35.765-01-1996 37.28 9.93 15.27 10.24 33.05 17.80 14.88 22.97 14.02 28.14 31.33 13.47 36.005-15-1996 -.-- 8.84 14.97 10.34 32.04 17.63 14.72 23.09 12.90 28.14 31.36 13.03 36.086-01-1996 35.45 7.57 14.31 10.43 27.17 17.14 14.38 23.08 9.85 28.04 31.33 12.58 36.256-15-1996 -.-- 7.62 14.07 10.44 23.36 16.78 14.25 22.76 8.64 28.01 31.17 12.54 36.327-01-1996 35.23 9.45 14.17 10.64 23.69 16.85 14.40 22.20 9.90 29.10 31.09 12.88 36.477-15-1996 -.-- 10.20 14.65 10.82 25.20 17.38 14.72 22.35 10.51 29.14 31.31 13.37 36.708-01-1996 36.58 10.63 15.01 11.00 24.90 17.42 14.95 22.52 10.69 28.97 31.33 13.65 36.928-15-1996 -.-- 11.30 15.39 11.21 24.41 18.00 15.18 22.69 10.72 30.22 31.45 14.07 37.149-01-1996 37.68 11.78 15.75 11.48 27.17 18.29 15.48 22.90 12.20 30.07 31.61 14.55 37.309-15-1996 -.-- 12.02 16.12 11.75 29.16 18.72 15.82 23.09 13.55 30.22 31.85 14.81 37.50
10-01-1996 38.32 12.00 16.35 11.95 31.00 18.80 16.00 23.24 14.12 30.12 31.93 14.89 37.6311-01-1996 38.32 11.97 16.89 12.42 32.66 19.04 16.43 23.60 14.73 30.30 32.06 15.19 37.7312-01-1996 -.-- 11.99 17.23 12.73 32.74 19.15 16.72 23.91 14.90 30.20 32.22 15.36 37.71
Note: Bold numbers are the shallowest groundwater levels for the calendar year; italic numbers are the deepest groundwater levels. Shaded areas distinguish between years.

53
Appendix B. (continued)
Depth to Water (feet below land surface) at Imperial Valley Network Observation Wells Date MTOW-1 MTOW-2 MTOW-3 MTOW-4 MTOW-5 MTOW-6 MTOW-7 MTOW-8 MTOW-9 MTOW-10 MTOW-11 MTOW-12 MTOW-13
3-01-1997 38.41 10.07 18.05 13.40 27.94 19.00 17.18 24.70 10.43 29.90 33.10 15.24 37.874-01-1997 37.67 9.87 17.53 13.84 24.80 18.20 16.86 24.80 10.00 30.70 33.33 14.71 37.755-01-1997 37.27 10.50 17.27 13.95 27.95 17.98 16.78 24.88 11.62 30.42 33.40 14.65 37.566-01-1997 37.32 10.38 17.17 13.98 29.98 18.02 16.90 25.03 12.71 30.34 33.61 14.45 37.606-15-1997 -.-- -.-- -.-- -.-- -.-- -.-- -.-- -.-- -.-- 31.45 -.-- -.-- -.--7-01-1997 37.63 11.08 17.29 14.22 28.78 18.38 17.06 25.05 11.95 31.80 33.73 14.85 37.867-15-1997 -.-- 11.54 17.45 14.35 19.00 17.24 25.12 12.67 31.45 33.78 15.17 38.158-01-1997 38.28 11.98 17.77 14.56 33.10 19.44 17.57 25.25 13.57 31.99 33.90 15.52 38.598-15-1997 -.-- 12.19 17.94 14.68 33.70 19.55 17.74 25.35 14.07 31.79 33.97 15.37 38.849-01-1997 38.90 12.15 18.17 14.80 32.78 19.45 17.89 25.44 13.80 31.74 34.03 15.45 38.92
10-01-1997 38.59 12.25 18.51 14.75 35.43 19.51 18.14 25.58 14.72 31.77 34.14 15.52 38.7511-01-1997 39.46 12.36 18.77 14.64 35.20 19.55 18.35 25.72 15.24 31.78 34.23 15.70 38.3812-01-1997 -.-- 11.97 19.11 14.60 34.95 19.70 18.65 25.90 15.10 31.51 34.41 15.87 38.08
3-01-1998 38.78 8.38 19.04 14.59 30.50 18.10 17.98 25.88 11.84 30.77 34.13 14.61 37.754-01-1998 37.91 6.25 18.41 14.58 25.95 16.78 17.14 25.21 9.04 29.95 33.85 13.61 37.525-01-1998 36.67 7.00 17.65 14.64 25.21 15.70 16.38 24.20 9.20 29.73 33.63 12.97 36.856-01-1998 36.00 6.23 16.92 13.66 24.02 14.18 15.08 22.22 8.95 29.15 32.93 11.82 35.387-01-1998 35.61 5.77 16.57 13.24 24.50 13.47 14.40 21.08 9.05 28.40 31.36 11.55 33.988-01-1998 -.-- 9.13 16.27 13.00 29.10 14.42 14.40 20.60 10.65 28.79 30.47 11.87 33.609-01-1998 36.24 10.00 16.52 12.95 31.90 15.08 14.58 20.90 12.48 28.60 30.58 12.25 33.82
10-01-1998 36.48 10.55 16.72 12.78 34.30 15.68 14.72 21.25 13.70 28.60 31.10 12.65 34.0711-01-1998 -.-- 10.70 16.97 12.55 33.93 16.30 15.00 21.70 14.10 28.70 31.69 13.02 34.24
3-01-1999 35.48 8.74 16.82 12.50 27.25 15.22 14.54 22.92 10.61 28.67 31.75 12.31 35.034-01-1999 35.26 9.13 16.47 12.95 29.74 16.20 14.54 23.13 12.05 28.83 31.85 12.29 35.155-01-1999 35.16 6.42 16.27 13.25 26.73 16.06 14.48 23.17 10.38 30.28 31.63 12.01 35.256-01-1999 33.95 5.45 14.63 13.05 25.64 14.70 13.74 22.45 9.54 28.00 31.03 11.27 35.157-01-1999 34.23 7.19 13.56 12.90 26.50 14.30 13.60 21.74 9.74 27.80 30.23 11.20 34.948-01-1999 35.68 9.98 14.69 13.10 31.03 15.20 14.24 21.40 12.45 28.17 30.11 12.35 34.909-01-1999 36.30 10.82 14.83 13.30 32.84 15.92 14.55 21.18 13.56 28.10 30.37 12.85 34.88
10-01-1999 36.87 11.18 15.40 13.09 34.00 16.64 15.02 21.44 14.10 28.39 31.13 13.41 35.0611-01-1999 -.-- 11.30 15.71 13.00 34.42 17.00 15.28 21.72 14.60 28.50 31.51 13.69 35.0012-01-1999 37.43 11.45 16.05 13.05 35.79 17.35 15.55 22.04 14.91 28.65 31.97 14.01 35.08
Note: Bold numbers are the shallowest groundwater levels for the calendar year; italic numbers are the deepest groundwater levels. Shaded areas distinguish between years.

54
Appendix B. (continued)
Depth to Water (feet below land surface) at Imperial Valley Network Observation Wells Date MTOW-1 MTOW-2 MTOW-3 MTOW-4 MTOW-5 MTOW-6 MTOW-7 MTOW-8 MTOW-9 MTOW-10 MTOW-11 MTOW-12 MTOW-13
3-01-2000 38.07 11.65 17.17 13.51 36.21 18.38 16.65 23.14 15.40 29.35 33.03 14.85 35.654-01-2000 38.17 11.47 17.45 13.87 36.12 18.61 16.92 23.51 15.20 29.56 33.31 14.99 35.925-01-2000 38.26 11.74 17.63 14.05 35.38 18.71 17.13 23.77 14.44 29.85 33.51 15.11 36.156-01-2000 38.40 10.70 17.85 14.40 34.37 18.59 17.21 24.05 13.65 29.74 33.67 15.12 36.447-01-2000 38.11 8.83 17.97 14.34 31.65 17.87 16.84 24.05 12.50 29.63 33.86 14.56 36.708-01-2000 35.89 10.24 17.22 14.47 32.50 18.37 16.97 24.05 12.35 30.12 33.71 14.53 37.149-01-2000 36.59 11.39 17.37 14.60 35.40 19.02 17.33 24.24 14.68 30.60 33.83 15.27 37.54
10-01-2000 37.08 11.79 17.65 14.55 36.88 19.04 17.62 24.47 14.97 30.70 33.98 15.32 37.6511-01-2000 37.22 12.11 17.97 14.47 36.75 19.17 17.95 24.67 15.44 30.80 34.10 15.61 37.60
4-01-2001 36.18 9.19 17.77 14.59 28.07 17.49 17.54 24.17 10.69 30.13 34.18 14.83 37.305-01-2001 35.69 9.25 17.38 14.90 30.57 17.10 17.35 23.62 11.70 29.53 34.15 14.61 37.006-01-2001 35.82 9.08 17.12 14.98 32.71 16.87 17.35 22.47 12.45 29.51 34.18 14.39 36.817-01-2001 35.65 9.06 16.89 14.90 30.51 16.54 16.35 21.85 11.15 30.03 34.22 14.16 36.778-01-2001 36.93 11.50 17.51 15.00 34.70 17.35 16.97 21.98 13.75 31.21 34.68 14.98 37.039-01-2001 37.94 12.32 17.77 15.08 36.25 18.39 17.45 22.28 14.67 31.00 34.42 15.58 37.23
10-01-2001 38.18 12.58 17.97 14.94 36.55 18.76 17.60 22.75 14.70 30.98 34.63 15.90 37.2311-01-2001 37.74 11.97 17.97 14.93 32.85 18.63 17.98 23.12 12.84 30.42 34.63 15.65 37.2112-01-2001 37.64 12.10 17.88 14.69 34.08 18.46 17.97 23.37 13.67 30.40 34.63 15.69 37.061-01-2002 37.67 11.66 18.02 14.46 34.41 18.34 17.97 23.68 13.97 30.25 34.95 15.75 36.902-01-2002 37.89 10.95 18.11 14.35 35.49 18.32 18.15 23.83 14.51 29.88 34.61 15.75 36.813-01-2002 37.38 10.35 17.77 14.06 32.44 17.85 17.75 23.82 12.73 29.84 34.85 15.35 36.694-01-2002 37.31 10.57 17.69 14.00 30.58 17.64 17.64 23.64 11.92 29.84 34.68 15.19 36.625-01-2002 37.17 7.50 17.57 14.25 29.40 17.40 17.54 23.49 11.40 29.15 34.44 14.91 36.536-01-2002 34.44 7.30 15.72 13.39 22.34 15.62 16.05 22.12 7.42 28.76 34.08 13.30 35.917-01-2002 34.82 8.39 15.07 12.75 25.70 15.00 15.61 21.08 9.30 29.36 33.83 12.97 35.138-01-2002 34.82 10.00 15.62 13.82 31.10 15.93 16.17 21.01 12.40 28.73 33.66 13.71 35.369-01-2002 36.71 10.00 15.62 12.98 32.55 15.82 16.12 21.25 12.60 28.50 33.68 13.76 35.62
10-01-2002 37.06 11.09 15.97 13.21 34.32 16.20 16.36 21.55 14.00 28.79 33.88 14.17 35.6211-01-2002 37.34 11.40 16.29 13.18 35.45 16.54 16.63 21.90 14.68 28.78 34.12 14.45 35.6012-01-2002 37.58 11.58 16.49 12.88 35.10 16.93 16.88 22.24 15.15 29.02 34.35 14.74 35.68
1-01-2003 37.80 11.70 16.95 12.98 36.10 17.36 17.15 22.64 15.32 29.09 34.53 14.91 35.842-01-2003 37.94 11.84 17.10 13.17 36.60 17.70 17.34 23.00 15.57 29.26 34.78 15.07 36.043-01-2003 38.13 11.60 17.37 13.35 37.21 18.02 17.55 23.32 15.79 29.50 34.82 15.27 36.264-01-2003 37.67 10.89 17.52 13.53 36.40 18.24 17.73 23.69 15.84 29.60 34.95 15.29 36.505-01-2003 37.76 9.90 17.34 13.73 37.05 17.95 17.47 23.95 15.60 29.73 35.07 14.96 36.736-01-2003 37.11 9.82 16.95 13.69 32.90 17.37 16.82 23.72 13.38 29.92 35.07 14.58 37.017-01-2003 37.23 9.36 16.92 13.69 35.85 16.88 17.10 23.58 14.20 29.74 35.11 14.75 37.258-01-2003 38.09 10.40 18.18 13.61 32.10 16.88 17.05 23.22 12.52 30.40 35.08 14.46 37.59
Note: Bold numbers are the shallowest groundwater levels for the calendar year; italic numbers are the deepest groundwater levels. Shaded areas distinguish between years.

55
Appendix B. (concluded)
Depth to Water (feet below land surface) at Imperial Valley Network Observation Wells Date MTOW-1 MTOW-2 MTOW-3 MTOW-4 MTOW-5 MTOW-6 MTOW-7 MTOW-8 MTOW-9 MTOW-10 MTOW-11 MTOW-12 MTOW-13
9-01-2003 38.86 11.40 17.52 13.73 35.55 17.65 17.54 22.97 14.07 30.17 34.98 14.99 37.8510-01-2003 38.98 11.42 17.47 13.80 36.62 17.68 17.72 23.70 15.04 30.00 34.88 15.06 37.7211-01-2003 38.92 11.58 17.71 13.94 37.75 17.85 17.93 23.90 15.18 30.12 35.08 15.29 37.5112-01-2003 38.88 10.15 17.78 13.88 36.90 17.85 18.15 24.08 14.33 29.50 35.15 15.15 37.441-01-2004 38.78 10.64 17.85 13.75 35.30 17.71 18.05 24.14 14.06 29.52 35.13 15.08 37.352-01-2004 38.73 11.25 18.01 13.77 36.10 18.02 18.24 24.31 14.71 29.92 35.23 15.39 37.393-01-2004 38.97 11.39 18.07 13.87 37.14 18.05 18.26 24.33 17.87 29.80 35.20 15.42 37.404-01-2004 39.10 10.51 18.32 14.16 35.50 18.29 18.51 24.51 13.89 29.78 35.25 15.56 37.535-01-2004 39.02 10.45 18.30 14.57 34.85 18.34 18.55 24.55 13.96 29.88 35.21 15.59 37.706-01-2004 38.69 7.10 18.17 14.94 35.00 18.05 18.25 24.49 12.97 28.88 34.90 14.95 37.757-01-2004 37.86 8.50 17.78 14.93 30.24 18.55 18.00 23.88 11.20 29.12 34.44 14.87 38.148-01-2004 38.01 10.43 18.21 14.98 35.00 19.14 18.60 23.80 13.83 30.10 34.07 15.82 38.529-01-2004 38.58 11.14 18.52 15.10 37.30 19.70 19.00 24.08 14.80 30.00 33.98 16.14 38.70
10-01-2004 38.98 11.72 18.74 15.06 37.57 19.87 19.28 24.33 15.40 30.02 34.01 16.49 38.5511-01-2004 38.61 8.90 18.79 14.99 37.84 19.61 19.30 24.50 14.99 29.09 33.85 16.20 38.3712-01-2004 n/a 8.40 18.44 14.84 36.68 19.05 19.11 24.45 14.45 29.04 33.70 16.00 38.15
1-01-2005 36.20 8.95 17.98 14.82 31.78 18.00 18.30 n/a 12.21 28.80 33.11 15.39 37.712-01-2005 34.49 7.45 17.32 14.55 26.05 16.65 17.94 n/a 9.40 28.03 31.80 14.55 37.223-01-2005 34.52 7.55 16.86 14.22 26.61 16.32 17.75 22.16 10.30 27.70 31.13 14.37 36.704-01-2005 34.98 9.04 16.65 14.20 30.66 16.47 17.63 21.90 12.06 27.64 30.93 14.37 36.375-01-2005 35.17 9.23 16.44 14.52 32.70 16.66 17.61 22.00 13.02 27.60 31.03 14.46 36.356-01-2005 35.93 10.17 16.63 14.76 33.90 17.30 17.71 22.27 14.16 29.00 31.18 14.87 36.657-01-2005 37.28 11.78 17.37 15.00 35.95 18.40 18.51 22.57 15.05 30.36 31.43 15.49 37.458-01-2005 38.72 12.51 18.05 15.28 37.28 19.54 19.33 23.10 16.00 30.18 31.77 16.36 38.31
Note: Bold numbers are the shallowest groundwater levels for the calendar year; italic numbers are the deepest groundwater levels. Shaded areas distinguish between years.


Appendix C. Site Descriptions, Imperial Valley Rain Gauge Network

58
Appendix C. Site Descriptions, Imperial Valley Rain Gauge Network
This appendix contains site descriptions of each rain gauge site in the IVWA network as of August31, 2005. Sites that have been relocated since the network was established in August 1992 are sonoted in the "Placement" portion of their site description. Sites with shaded descriptions have beenremoved from the network.
SITE DESCRIPTION
Site Number: 1
County: Tazewell Latitude: 40° 28' 3" Longitude: 89° 50' 9"
Property Owner: Melvin Fornoff
Address: 10200 Fornoff Road, Manito, IL 61546
Telephone: 309-968-6653
Permission Date: 8-10-92
Installation Date: 8-25-92
Gauge Mfrs. No.: 4695 Gauge ID No.: SWS 5068
Placement: Near apple/pear trees, northeast of a garage. Property on east side of 450 E inTazewell County, north of 1000 N. Large dog. Gauge 15 meters northwest of lat/longreading. Station removed from the network in September 1995.
SITE DESCRIPTION
Site Number: 2
County: Tazewell Latitude: 40° 28' 42" Longitude: 89° 45' 54"
Property Owner: Ken Becker
Address: 8479 Townline Road, Manito, IL 61546
Telephone: 309-545-2207
Permission Date: 8-15-92
Installation Date: 8-25-92
Gauge Mfrs. No.: 4723 Gauge ID No.: SWS 5030
Placement: In back yard (grass) near garbage burner. Property on south side of 1100 N inTazewell County, west of 900 E. Gauge 2 meters west of lat/long reading.

59
Appendix C. (continued)
SITE DESCRIPTION
Site Number: 3
County: Tazewell Latitude: 40° 28' 56" Longitude: 89° 37' 33"
Property Owner: Lonn Schleder
Address: 11177 S 14th Street, Pekin, IL 61554
Telephone: 309-348-2447
Permission Date: 8-10-92
Installation Date: 8-25-92
Gauge Mfrs. No.: 1463 Gauge ID No.: SWS 3693
Placement: Moved 5-13-94 to a position about 60 meters north-northeast of original position,which was in a back pasture along a wire fence between a white aluminum shed and a largetree. Present position is between a garage and another shed near a well. Property on northwestcorner of the intersection of 1600 E and 1100 N. Gauge 50 meters north-northwest of lat/longreading.
SITE DESCRIPTION
Site Number: 4
County: Mason Latitude: 40° 24' 29" Longitude: 89° 54' 41"
Property Owner: Ellis Popcorn (Maureen Hanks)
Address: 24095 County Road 2330 E, Topeka, IL 61567
Telephone: 309-535-3840
Permission Date: 8-10-92
Installation Date: 8-25-92
Gauge Mfrs. No.: 7382 Gauge ID No.: SWS 6573
Placement: South of large white office building, between two trees in a grassy area. Propertyon east side of 2340 E in Mason County, northeast of Goofy Ridge. Gauge 10 meters south-southwest of lat/long reading.

60
Appendix C. (continued)
SITE DESCRIPTION
Site Number: 5
County: Mason Latitude: 40° 24' 29" Longitude: 89° 50' 19"
Property Owner: Joseph Meyer
Address: 24234 County Road 2750 E, Topeka, IL 61567
Telephone: 309-968-6378
Permission Date: 8-10-92
Installation Date: 8-25-92
Gauge Mfrs. No.: 5985 Gauge ID No.: CDA 000130
Placement: Next to stone drive in a pasture in front of house. Property on west side of 2750 Ein Mason County, south of 2500 N. Gauge 3 meters east of lat/long reading. Station removedfrom network in September 1995.
SITE DESCRIPTION
Site Number: 6
County: Mason Latitude: 40° 22' 42" Longitude: 89° 43' 16"
Property Owner: Lawrence Whiteford
Address: 22172 N County Road 3400 E, Manito, IL 61546-7988
Telephone: 309-968-6234
Permission Date: 3-22-01
Installation Date: 3-22-01
Gauge Mfrs. No.: 5295 Gauge ID No.: SWS 5309
Placement: Gauge was moved on 3-22-01 approximately 1.9 miles south-southeast of oldlocation, or about 0.4 miles north of 2180 N on 3400 E, Mason County. New location is in anopen area west of machine shed. Old location was on west side of 3300 E in Mason County,just south of 2400 N, 18 meters south of lat/long reading.

61
Appendix C. (continued)
SITE DESCRIPTION
Site Number: 7
County: Tazewell Latitude: 40° 24' 24" Longitude: 89° 37' 29"
Property Owner: David Van Orman
Address: 5801 Warner Road, Green Valley, IL 61534
Telephone: 309-352-5673
Permission Date: 8-10-92
Installation Date: 8-25-92
Gauge Mfrs. No.: 5935 Gauge ID No.: --
Placement: Moved in May 1993 to a position south of a barn with a green roof, near edge offield. Original position was 30 meters to the northeast, north of the same barn. Both positionsare northwest of the house. Property located just east of Green Valley on south side of 600 Nin Tazewell County, just west of 1600 E. Gauge 17 meters west-northwest of lat/long reading.
SITE DESCRIPTION
Site Number: 8
County: Mason Latitude: 40° 20' 56" Longitude: 90° 1' 18"
Property Owner: c/o Steve Havera, Forbes Biological Station
Address: P.O. Box 49, Havana, IL 62644
Telephone: 309-543-3950
Permission Date: 6-3-02
Installation Date: 6-3-02
Gauge Mfrs. No.: 2000 Gauge ID No.: US148085
Placement: New location as of 6-3-02, Illinois Natural History Survey station on QuiverCreek, 0.2 miles northeast of old location. From 4-20-00 to 6-3-02, was on Blakely propertylocated on north side of 1950 N in Mason County, west of 1900 E., 0.5 miles northwest of oldsite east-southeast of house near a small tree.

62
Appendix C. (continued)
SITE DESCRIPTION
Site Number: 9
County: Mason Latitude: 40° 19' 41" Longitude: 89° 55' 55
Property Owner: Mason State Tree Nursery
Address: 17855 County Road 2400 E, Topeka, IL 61567
Telephone: 309-535-2185
Permission Date: 8-9-00
Installation Date: 8-9-00
Gauge Mfrs. No.: 5986 Gauge ID No.: CDA 000132
Placement: Located about 400 yards south of office among several weather stations. Priorlocation from 5-14-93 to 8-9-00 at R.R. #1, Box 19, Topeka. Original position from 8-24-92to 5-14-93 was at R.R. #1, Box 6, Topeka.
SITE DESCRIPTION
Site Number: 10
County: Mason Latitude: 40° 19' 58" Longitude: 89° 48' 53"
Property Owner: Paul Meeker
Address: RR # 1, Box 31, Forest City, IL 61532
Telephone: 309-597-2163
Permission Date: 8-10-92
Installation Date: 8-24-92
Gauge Mfrs. No.: 4679 Gauge ID No.: SWS 5100
Placement: West of hedge row on southwest edge of home property. Property is on north sideof 1900 N in Mason County, east of 2800 E, and the gauge is about 3 meters north of 1900 E.Gauge 5 meters northeast of lat/long reading.

63
Appendix C. (continued)
SITE DESCRIPTION
Site Number: 11
County: Mason Latitude: 40° 20' 2" Longitude: 89° 44' 4"
Property Owner: Louis Moehring
Address: 32972 E County Road 1900 N, Manito, IL 61546
Telephone: 217-482-3320
Permission Date: 8-10-92
Installation Date: 8-24-92
Gauge Mfrs. No.: 3362 Gauge ID No.: SWS 4450
Placement: North side (back) of house along a walk. Property is on northwest corner ofintersection of 1900 N and 3300 E in Mason County. Gauge 12 meters southwest of lat/longreading.
SITE DESCRIPTION
Site Number: 12
County: Tazewell Latitude: 40° 20' 16" Longitude: 89° 38' 26"
Property Owner: Harold Deiss
Address: 1327 Route 29, San Jose, IL 62682
Telephone: 309-247-3535
Permission Date: 8-10-92
Installation Date: 8-24-92
Gauge Mfrs. No.: 3346 Gauge ID No.: SWS 4439
Placement: East side of Route 29 (1500 E) in Tazewell County in a grassy area southwest of ared shed. Deiss house is 1/4 mile north. Just north of Day Ditch. Gauge 2 meters south oflat/long reading.

64
Appendix C. (continued)
SITE DESCRIPTION
Site Number: 13
County: Mason Latitude: 40° 15' 43" Longitude: 90° 0' 48"
Property Owner: Don Hahn
Address: 18307 E Hahn/Stelter Rd., Havana, IL 62644
Telephone: 309-543-4660
Permission Date: 8-11-92
Installation Date: 8-25-92
Gauge Mfrs. No.: 5939 Gauge ID No.: --
Placement: Left side of front entrance drive near a short fence. Property on south side of thediagonal 1450 N, east of Route 92. Gauge 3 meters north-northeast of lat/long reading.
SITE DESCRIPTION
Site Number: 14
County: Mason Latitude: 40° 15' 52" Longitude: 89° 56' 33"
Property Owner: Wayne Patterson (650 E Taintor Rd., Springfield, IL 62702-1755)
Address: R.R. #1, Box 220, Easton, IL 62633
Telephone: 309-543-4664
Permission Date: 8-11-92
Installation Date: 8-24-92
Gauge Mfrs. No.: 4678 Gauge ID No.: SWS 5098
Placement: In a small clearing north of house. Property located on east side of 2200 E inMason County south of 1500 N. Correspondence address changed to that of Wayne Pattersonon 3-26-94. Gauge 17 meters northwest of lat/long reading. Station removed from network inSeptember 1995.

65
Appendix C. (continued)
SITE DESCRIPTION
Site Number: 15
County: Mason Latitude: 40° 15' 27" Longitude: 89° 50' 22"
Property Owner: c/o Joe Umbach
Address: 25989 E County Road 1300 N, Easton, IL 62633
Telephone: 309-562-7611
Permission Date: 8-12-92
Installation Date: 8-24-92
Gauge Mfrs. No.: 6462 Gauge ID No.: CDA 000136
Placement: Along right side of the house lane which extends north from 1410 N in MasonCounty between Route 10 and 2800 E. 1410 N runs from southwest to northeast along CentralDitch. Gauge 2 meters north-northeast of lat/long reading.
SITE DESCRIPTION
Site Number: 16
County: Mason Latitude: 40° 16' 5" Longitude: 89° 44' 9"
Property Owner: Donald Osborn, Sr.
Address: 32866 E County Road 1450 N, Mason City, IL 62664
Telephone: 217-482-5816
Permission Date: 8-11-92
Installation Date: 8-24-92
Gauge Mfrs. No.: 4666 Gauge ID No.: SWS 5059
Placement: Along right side of drive near pigpen and road (1450 N). Property located onnorth side of 1450 N just west of 3300 E. Gauge 2 meters east of lat/long reading.
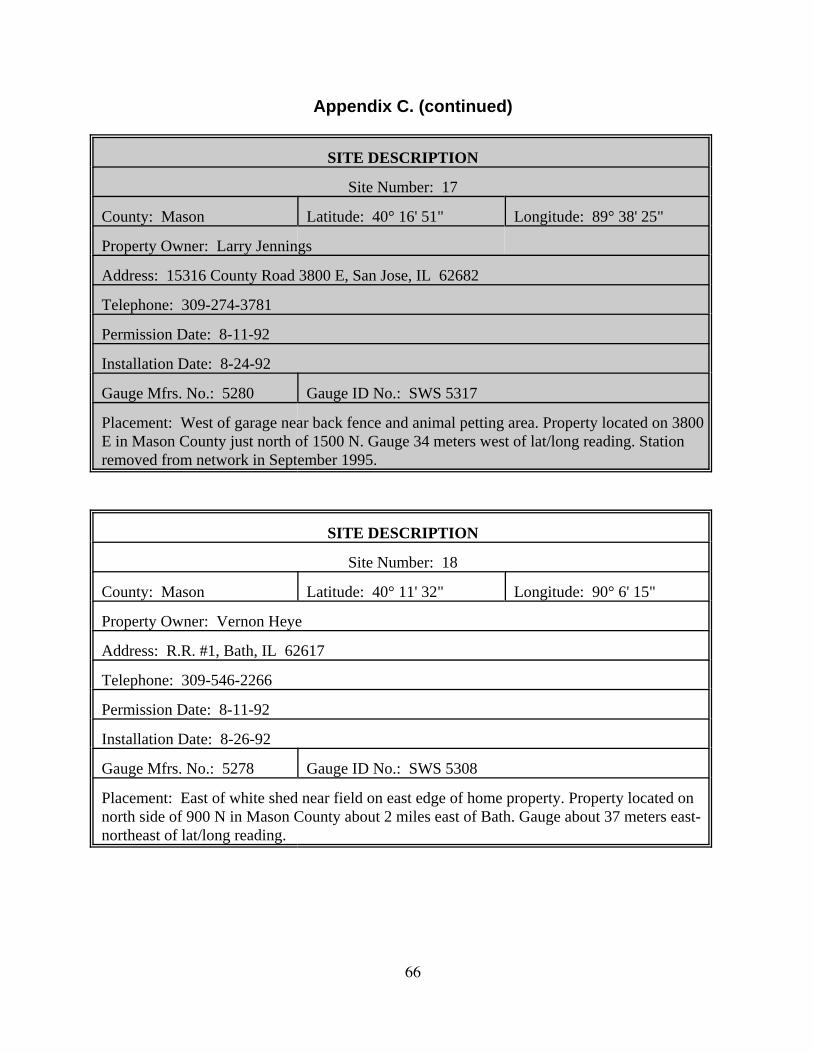
66
Appendix C. (continued)
SITE DESCRIPTION
Site Number: 17
County: Mason Latitude: 40° 16' 51" Longitude: 89° 38' 25"
Property Owner: Larry Jennings
Address: 15316 County Road 3800 E, San Jose, IL 62682
Telephone: 309-274-3781
Permission Date: 8-11-92
Installation Date: 8-24-92
Gauge Mfrs. No.: 5280 Gauge ID No.: SWS 5317
Placement: West of garage near back fence and animal petting area. Property located on 3800E in Mason County just north of 1500 N. Gauge 34 meters west of lat/long reading. Stationremoved from network in September 1995.
SITE DESCRIPTION
Site Number: 18
County: Mason Latitude: 40° 11' 32" Longitude: 90° 6' 15"
Property Owner: Vernon Heye
Address: R.R. #1, Bath, IL 62617
Telephone: 309-546-2266
Permission Date: 8-11-92
Installation Date: 8-26-92
Gauge Mfrs. No.: 5278 Gauge ID No.: SWS 5308
Placement: East of white shed near field on east edge of home property. Property located onnorth side of 900 N in Mason County about 2 miles east of Bath. Gauge about 37 meters east-northeast of lat/long reading.

67
Appendix C. (continued)
SITE DESCRIPTION
Site Number: 19
County: Mason Latitude: 40° 11' 1" Longitude: 90° 0' 19"
Property Owner: Charles W. Lane
Address: R.R. #1, Box 51, Kilbourne, IL 62655
Telephone: 309-538-4397
Permission Date: 8-11-92
Installation Date: 8-26-92
Gauge Mfrs. No.: 4718 Gauge ID No.: SWS 5081
Placement: Along a wire fence separating home property from pigpen, northwest of house.Property located on west side of Route 97 on southern end of a large curve between 900 Nand 800 N. Gauge 14 meters northwest of lat/long reading.
SITE DESCRIPTION
Site Number: 20
County: Mason Latitude: 40° 11' 46" Longitude: 89° 54' 56"
Property Owner: Wanda Krause
Address: R.R. #1, Box 109, Easton, IL 62633
Telephone: 309-562-7528
Permission Date: 8-11-92
Installation Date: 8-26-92
Gauge Mfrs. No.: 3371 Gauge ID No.: US 148830
Placement: In yard of Jon Krause just north of east-west lane and west of lane to the Krausehome. The gauge was moved to this position in early 1995. The previous location on the eastside of 2400 E in Mason County near Jon Krause mailbox was in a strawberry patch along thesame lane about 250 meters to the west on the Wanda Krause property. Gauge 150 meterseast of lat/long reading.

68
Appendix C. (continued)
SITE DESCRIPTION
Site Number: 21
County: Mason Latitude: 40° 11' 10" Longitude: 89° 49' 39"
Property Owner: John Walters
Address: 28030 E County Road 850 N, Mason City, IL 62664
Telephone: 309-562-7527
Permission Date: 8-11-92
Installation Date: 8-26-92
Gauge Mfrs. No.: 6294 Gauge ID No.: CDA 00013A
Placement: East of the house and driveway and southeast of a shed. Property located on a hillon the northeast corner of the intersection of 2800 E and 850 N in Mason County. Positionprevious to 5-20-94 was between a windmill and a bush about 25 meters west of presentposition. Gauge 25 meters east of lat/long reading.
SITE DESCRIPTION
Site Number: 22
County: Mason Latitude: 40° 10' 46" Longitude: 89° 44' 28"
Property Owner: Kirk Martin
Address: 33534 E County Road 930 N, Mason City, IL 62664
Telephone: 217-482-3509
Permission Date: 3-23-04
Installation Date: 3-26-04
Gauge Mfrs. No.: 4708 Gauge ID No.: SWS 5021
Placement: Gauge moved 1.25 miles north-northeast of previous location, 15–20 feet off localroad, with field about 70 feet away. Was on a concrete slab with two two-by-fours attachedto the base of the gauge, west of the house and lane on a ridge and located on north side of800 N in Mason County west of Route 29 and southwest of Mason City. Gauge 25 meterswest of lat/long reading.

69
Appendix C. (continued)
SITE DESCRIPTION
Site Number: 23
County: Mason Latitude: 40° 12' 0" Longitude: 89° 38' 28"
Property Owner: Dale C. Fancher
Address: 9482 N County Road 3800 E, Mason City, IL 62664-7209
Telephone: 217-482-3506
Permission Date: 8-11-92
Installation Date: 8-26-92
Gauge Mfrs. No.: 3773 Gauge ID No.: US 148832
Placement: On the west edge of a garden located north of a wood shop and the house.Property located on the west side of 3800 E in Mason County about a half mile north of Route10, east of Mason City. Gauge 30 meters north-northwest of lat/long reading.
SITE DESCRIPTION
Site Number: 24
County: Mason Latitude: 40° 6' 26" Longitude: 90° 11' 58"
Property Owner: Norman L. Fletcher
Address: 3286 N County Road 800 E, Bath, IL 62617
Telephone: 309-546-2677
Permission Date: 8-11-92
Installation Date: 8-26-92
Gauge Mfrs. No.: -- Gauge ID No.: --
Placement: North of a garage near a grapevine, northeast of the house. Property located onthe east side of 800 E in Mason County west of Route 78, just north of 300 N. Gauge 32meters northeast of lat/long reading.

70
Appendix C. (concluded)
SITE DESCRIPTION
Site Number: 25
County: Mason Latitude: 40° 6' 14" Longitude: 90° 8' 0"
Property Owner: Rocky Adkins
Address: 11669 E County Road 300 N, Chandlerville, IL 62627
Telephone: 217-458-2587
Permission Date: 8-11-92
Installation Date: 8-26-92
Gauge Mfrs. No.: 5947 Gauge ID No.: --
Placement: Next to two tanks and a sign in a small grassy area surrounded by truck access.Property located at Adkins Farms on south side of 300 N (east of Route 78) in Mason County.Gauge 2 meters south of lat/long reading. Station removed from network in September 1995.

Appendix D. Instructions for Rain Gauge Technicians

72
Appendix D. Instructions for Rain Gauge Technicians
A. Use Central Standard Time Year-Around
From November through March, Illinois is in the Central Standard Time zone, so your watchwill indicate the correct time and date to be noted on the chart. From April through Octoberwhen Illinois is in the Central Daylight Time zone, subtract one hour from your watchreading.
B. Order of Servicing
1) Old Chart
a) Unlock and open (slide up) door on the side of the instrument case and then lock doorin place to prevent it from falling.
b) Depress the bucket platform casting to mark the OFF time position on the chart (avertical trace will be written by the pen).
c) Note the time on your watch, and move the pen point and arm away from the chart bypushing out on the pen shifter.
d) Lift up on the chart cylinder that contains the chart to disengage it from the chartdrive, and remove it.
e) Remove the chart from the cylinder and write the OFF date and time on the chart onthe red line at the right end of the chart.
2) Bucket
a) Remove the collector from the top of the gauge by rotating it clockwise to disengagethe tongue-and-groove assembly.
b) Carefully lift the bucket off the weighing platform. If there is water in it and noantifreeze, dump the water on the ground.
c) Reposition the empty bucket on the platform.d) Reinstall the collector by setting it on top of the rain gauge case and turning it
counterclockwise until the tongue-and-groove assembly meshes.e) During wintertime operation, when 2 inches (about one quart) of antifreeze is in the
bucket to prevent freezing, leave the liquid in the bucket until the chart reading passesthe 6-inch mark. At that point, pour the bucket contents into a sealed container anddispose of properly. DO NOT POUR SOLUTION ONTO THE GROUND! Ifwintertime conditions prevail, recharge the empty bucket with 2 inches of antifreeze.Reposition the dry bucket on the platform and reinstall the collector assembly.
f) In the winter, stir the contents of the bucket to keep the antifreeze mixed with thewater.
g) At any time of the year, once the collector is repositioned, check the gauge to makesure the collector orifice top edge is level.
3) New Chart
a) Copy the OFF time from the old chart to the ON time on the new chart (another redline on the end of the chart), and write your site number on the chart.
b) Clip the new chart to the cylinder, making sure the crease at the right end of the chartis sharp and the chart is tight on the cylinder.

73
c) Reinstall the chart cylinder onto the chart drive, making sure the chart cylinder anddrive gears mesh. Simply push down on the cylinder and wiggle it a little. You shouldfeel some resistance if done correctly.
d) Move the pen arm and point over to the chart cylinder with the pen bracket and rotatethe cylinder counterclockwise until the pen point coincides with the correct ON timeposition.
e) Let the pen point rest right on the chart and depress the platform casting again tomake a small, vertical line denoting the ON time position. This also ensures that thepen point is writing correctly. If it is not, check the tip of the pen point to see why itis not drawing. Replace if necessary. It helps if the word “ON” is written on the chartnear the ON line for later chart editing. Rezero the pen point if necessary by turningthe fine adjustment screw. It is a good idea to “zero” the pen near the 0.25-inch markto prevent evaporation from taking the pen point below the zero line.
f) When you are sure that everything is in order, carefully unlock the door, push thedoor down, and lock it in place for another month.
4) Data Logger
a) Plug HP200X Palmtop PC into the data logger and download data.b) Transfer data to flash card.c) Mail flash card and charts to ISWS.
5) Problems
a) If you notice anything unusual about the gauge or the chart drive, write a note on theupper right corner of the old chart.
b) If you think the problem requires immediate attention, call Nancy Westcott collect at217-244-0884 or e-mail her at [email protected] to relay the information. Situationsworthy of immediate attention include questions concerning the operation describedabove, premature chart-drive stoppage, data logger problems, or unauthorizedtampering with the gauge. Immediate repairs will be scheduled if necessary.
c) Write a note describing problems and send with the charts, when mailing charts to theISWS.
d) Also, write a note or call when new supplies are needed: antifreeze, pen tips,batteries, charts, spare clock drive, envelopes, and stamps.

74
6) Annual Tasks
a) In the fall, usually November, the gauges are winterized. The evaporation shield isremoved. Antifreeze is added to the bucket. The clock batteries are changed.
b) Usually in December, batteries in the data loggers are changed by the ISWS fieldtechnician.
c) Usually in March or April, the antifreeze is removed as per 2e above, and theevaporation shield is reinstalled.
d) Over the span of two years, all gauges should be recalibrated and cleaned in the fieldby the ISWS field technician.
C. Change in Site Status
If the gauge is no longer wanted on the property, please contact Nancy Westcott. Either callher collect at 217-244-0884 or e-mail her at [email protected] immediately so that newarrangements can be made. It is important to try to keep the sites near the same locationsduring the course of this project because precipitation generally can vary greatly over shortdistances.

Appendix E. Documentation, Imperial ValleyRain Gauge Network Maintenance, 2004–2005

76
Appendix E. Documentation, Imperial Valley Rain Gauge Network Maintenance, 2004–2005
This appendix documents major maintenance work carried out at sites in the Imperial Valley raingauge network from September 1, 2004 through August 31, 2005.
1. Replaced gauge shelter at site 21 on 10-15-2004.
2. Winterized, including changing clock batteries, removing evaporation shield, and adding anti-freeze to all gauges on 11-2/3-2004.
3. Replaced data logger in gauge at site 23 on 11-9-2004.
4. Replaced batteries in all data loggers on 12-27-2004.
5. Replaced the top of the gauge at site 4 on 1-12-2005.
6. Repaired data logger wiring at site 12 on 3-2-2005.
7. Replaced data logger at site 24 on 3-2-2005.
8. Replaced data logger at site 24 on 3-24-2005.
9. Replaced data logger at site 8 and calibrated gauge on 6-3-2005.
10. Replaced electric clock at site 24 on 8-1-2005.

Appendix F. Hydrographs, Transducer Data at the Test Site

78
Appendix F. Hydrographs, Transducer Data at the Test Site
This appendix shows hydrographs of groundwater levels in each of the wells in place at the test site.The data are not continuous on each hydrograph due to removal of the transducers at various wells atvarious intervals.
Figure F-2. Water level elevation in Well 1 at the test site
5/1/03 8/31/03 12/31/03 5/1/04 8/31/04 12/31/04 5/2/05 9/1/05Date
0
2
4
6
8
10
Sta
ge
(feet
)
Figure F-1. Stage in Crane Creek at the downstream bridge
5/1/03 8/31/03 12/31/03 5/1/04 8/31/04 12/31/04 5/2/05 9/1/05Date
480
482
484
486
488
490
Gro
undw
ate
r E
leva
tion (fe
et a
bove
MS
L)
0
2
4
6
1
3
5
Pre
cipita
tion (in
ches
)
Logger Data
Observed Groundwater Elevation
Daily Precipitation at Rain Gauge 20

79
Appendix F. (Continued)
Figure F-3. Water level elevation in Well 2 at the test site
Figure F-4. Water level elevation in Well 3 at the test site
5/1/03 8/31/03 12/31/03 5/1/04 8/31/04 12/31/04 5/2/05 9/1/05Date
480
482
484
486
488
490G
rou
nd
wa
ter
Ele
vatio
n (
fee
t ab
ove
MS
L)
0
1
2
3
4
5
6
Pre
cip
itatio
n (
inch
es)
Logger Data
Observed Groundwater Elevation
Daily Precipitation at Rain Gauge 20
5/1/03 8/31/03 12/31/03 5/1/04 8/31/04 12/31/04 5/2/05 9/1/05Date
480
482
484
486
488
490
Gro
un
dw
ate
r E
leva
tion
(fe
et a
bo
ve M
SL
)
0
1
2
3
4
5
6
Pre
cip
itatio
n (
inch
es)
Logger Data
Observed Groundwater Elevation
Daily Precipitation at Rain Gauge 20

80
Appendix F. (Continued)
Figure F-5. Water level elevation in Well 4 at the test site
Figure F-6. Water level elevation in Well 5 at the test site
5/1/03 8/31/03 12/31/03 5/1/04 8/31/04 12/31/04 5/2/05 9/1/05Date
482
484
486
488
490
492
Gro
un
dw
ate
r E
leva
tion
(fe
et a
bo
ve M
SL
)
0
2
4
6
1
3
5
Pre
cip
itatio
n (
inch
es)
Logger Data
Observed Groundwater Elevation
Daily Precipitation at Rain Gauge 20
5/1/03 8/31/03 12/31/03 5/1/04 8/31/04 12/31/04 5/2/05 9/1/05Date
482
484
486
488
490
492
494
Gro
un
dw
ate
r E
leva
tion
(fe
et a
bo
ve M
SL
)
0
1
2
3
4
5
6
Pre
cip
itatio
n (
inch
es)
Logger Data
Observed Groundwater Elevation
Daily Precipitation at Rain Gauge 20, inches

81
Appendix F. (Continued)
Figure F-7. Water level elevation in Well 6 at the test site
Figure F-8. Water level elevation in Well 7 at the test site
5/1/03 8/31/03 12/31/03 5/1/04 8/31/04 12/31/04 5/2/05 9/1/05Date
482
484
486
488
490
492
494G
rou
nd
wa
ter
Ele
vatio
n (
fee
t ab
ove
MS
L)
0
1
2
3
4
5
6
Pre
cip
itatio
n (
inch
es)
Logger Data
Observed Groundwater Elevation
Daily Precipitation at Rain Gauge 20, inches
5/1/03 8/31/03 12/31/03 5/1/04 8/31/04 12/31/04 5/2/05 9/1/05Date
483
485
487
489
491
493
Gro
un
dw
ate
r E
leva
tion
(fe
et a
bo
ve M
SL
)
0
1
2
3
4
5
6
Pre
cip
itatio
n (
inch
es)
Logger Data
Observed Groundwater Elevation
Daily Precipitation at Rain Gauge 20, inches
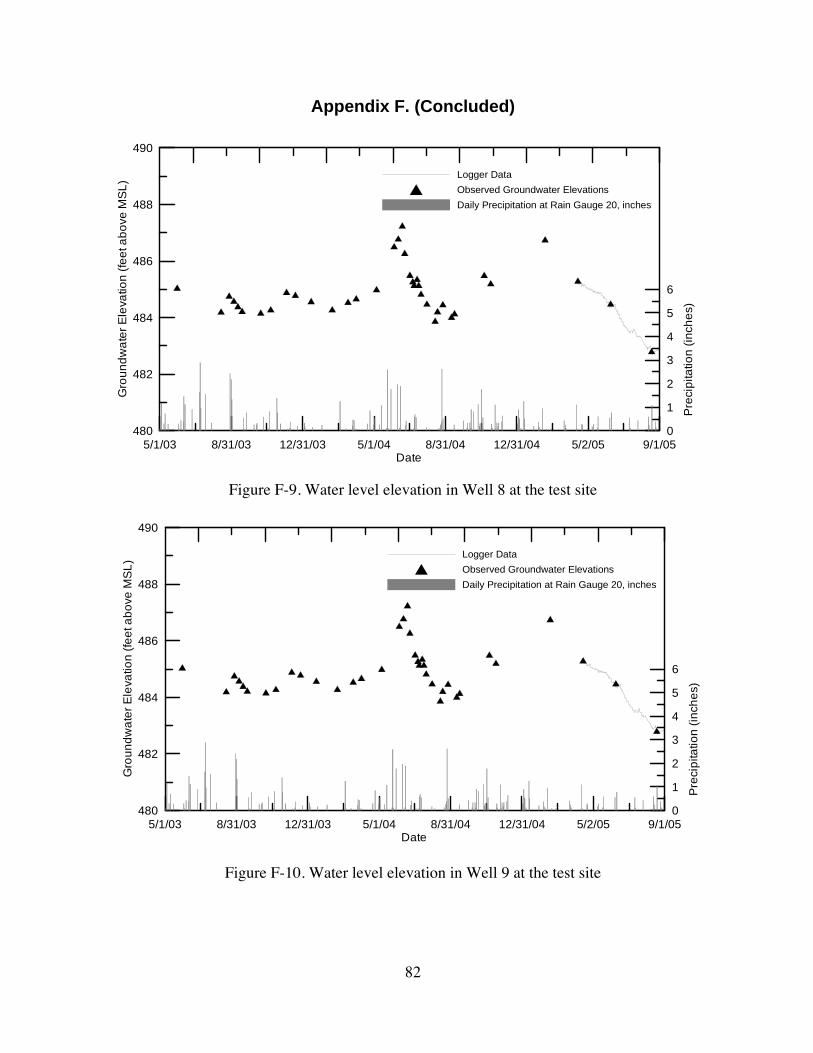
82
Appendix F. (Concluded)
Figure F-9. Water level elevation in Well 8 at the test site
Figure F-10. Water level elevation in Well 9 at the test site
5/1/03 8/31/03 12/31/03 5/1/04 8/31/04 12/31/04 5/2/05 9/1/05Date
480
482
484
486
488
490
Gro
un
dw
ate
r E
leva
tion
(fe
et a
bo
ve M
SL
)
0
1
2
3
4
5
6
Pre
cip
itatio
n (
inch
es)
Logger Data
Observed Groundwater Elevations
Daily Precipitation at Rain Gauge 20, inches
5/1/03 8/31/03 12/31/03 5/1/04 8/31/04 12/31/04 5/2/05 9/1/05Date
480
482
484
486
488
490
Gro
un
dw
ate
r E
leva
tion
(fe
et a
bo
ve M
SL
)
0
1
2
3
4
5
6
Pre
cip
itatio
n (
inch
es)
Logger Data
Observed Groundwater Elevations
Daily Precipitation at Rain Gauge 20, inches

Appendix G. Annual Precipitation, Years One–Twelve

84
N
0 1 2 3 4 5Scale of Miles
TAZEWELL CO.MASON CO.
136
122
29
29
10
97
78
Rain gauge location
TAZEWELL CO.MASON CO.
3
46 7
121110
9
8
13 16
18
19
2021
22
23
24
21
5
1415
17
3
46 7
1211109
8
13 15
1819
2021
2223
24
2
1716
1
25
25
September 1992 - August 1993
48
September 1993 - August 1994
56
56
56
56
58
58606056 54 52
50
5052
54
5458
5452
56
565454
56
32
32
34
3436
36 38
38
40
4042
42
42
4038 384042
42
44 44
46
48
46
46
136
29
122
29
1097
78
Appendix G. Annual Precipitation, Years One–Twelve(Rain gauge #16 omitted from Years 5–10)

85
N
0 1 2 3 4 5Scale of Miles
TAZEWELL CO.MASON CO.
136
29
122
29
10
97
78
26
24
24
26
28
28 26 24 24
26
26
26
Rain gauge location
3
46 7
1211109
8
1315
18
19
2021
22
23
24
2
16
25
3
46 7
121110
9
8
13 16
18
19
2021
22
23
24
21
5
1415
17
September 1994 - August 1995
September 1995 - August 1996
42 4240 40 3838
36
36
38
3836
36
38
40
40
4042
42444442
42
40
40
464642
42
40
40
42
42
TAZEWELL CO.
MASON CO.
136
122
29
29
10
97
78
Appendix G. (continued)

86
Rain gauge location
TAZEWELL CO.MASON CO.
122
29
97
78
136
29
10
N
0 1 2 3 4 5Scale of Miles
TAZEWELL CO.MASON CO.
122
29
97
78
136
29
10
3
4 6 7
121110
9
8
13 15
18
19
2021
22
23
24
2
3
46 7
12111098
1315
18
19
2021
22
23
24
2
September 1997 - August 1998
September 1996 - August 1997
28
26
30
28
26
24
26
26
28303028
4042444242
44
38
36
3638
40
42
38
36
3842
3640
40
Appendix G. (continued)

87
Rain gauge location
TAZEWELL CO.MASON CO.
122
29
97
78
136
29
10
N
0 1 2 3 4 5Scale of Miles
TAZEWELL CO.MASON CO.
122
29
97
78
136
29
10
3
4 6 7
121110
9
8
13 15
18
19
2021
22
23
24
2
3
46 7
12111098
1315
18
19
2021
22
23
24
2
September 1999 - August 2000
September 1998 - August 1999
32 30
28 3034
3638
38
36
34
32
3234
36
38
38
36
34
32
2628
3030 28 26
24
26
26
24
22
2224
24
24
Appendix G. (continued)

88
Appendix G. (continued)
0 1 2 3 4 5Scale of Miles
September 2000 - August 2001
Rain gauge location
32
32
32
3232
32
30
30
30
30
2828
28
28
34
3434
34
34

89
Appendix G. (concluded)


Appendix H. Precipitation Events, Total Precipitation, and Precipitationper Precipitation Event by Month and Season, 1992–2004

92
Appendix H. Precipitation Events, Total Precipitation, and Precipitationper Precipitation Event by Month and Season, 1992–2004
Number of precipitation events Month 1992-
931993-
941994-
951995-
961996-
971997-
981998-
991999-
002000-
012001-
022002-
032003-
04
September 10 8 6 6 6 6 8 8 10 7 3 7October 10 5 7 9 11 7 11 6 10 17 8 7November 13 7 10 3 9 8 14 17 11 12 7 9December 9 9 8 5 5 10 6 14 21 9 2 8January 9 8 5 8 13 12 19 11 18 4 6 8February 5 6 3 4 8 7 17 21 8 9 5 6March 10 6 6 7 8 8 6 9 7 12 6 12April 11 12 19 6 11 12 18 14 14 9 6 5May 16 7 16 25 15 16 15 16 14 13 10 16June 13 13 15 11 14 17 12 12 11 10 11 7July 21 9 16 10 6 15 9 11 10 10 5 14August 21 12 18 4 15 16 9 17 14 10 11 11
Fall 33 20 23 18 26 21 33 31 31 36 18 23Winter 23 23 16 17 26 29 42 46 47 22 13 22Spring 37 25 41 38 34 36 39 39 35 34 22 33Summer 55 34 49 25 35 48 30 40 35 30 27 32
Annual 148 102 129 98 121 134 144 156 148 122 80 110
Total precipitation, inchesMonth 1992-
931993-
941994-
951995-
961996-
971997-
981998-
991999-
002000-
012001-
022002-
032003-
04
September 4.21 11.56 1.49 2.00 1.63 2.55 1.61 0.87 1.93 2.35 0.39 2.67October 2.00 2.97 3.34 3.06 1.99 1.43 2.07 0.92 1.79 4.89 1.65 1.56November 6.35 2.59 3.37 1.84 2.15 3.10 2.70 0.48 2.05 2.50 0.62 3.54December 2.82 1.11 2.29 0.45 0.90 1.47 0.81 2.07 1.17 1.43 1.95 1.07January 3.52 0.96 2.90 1.01 1.28 2.59 2.84 0.63 3.35 2.64 0.61 0.67February 1.64 1.64 0.61 0.77 3.86 2.65 1.32 2.00 2.78 1.28 1.09 0.33March 3.85 0.96 1.93 1.93 1.92 4.51 1.32 1.68 1.50 1.58 1.84 2.84April 5.25 5.03 4.87 2.61 1.76 3.53 4.42 1.59 3.31 4.24 3.75 1.78May 2.61 3.11 10.33 5.37 2.94 5.21 4.65 4.39 4.89 5.43 3.20 5.55June 6.27 3.19 2.65 2.85 1.97 7.19 4.41 4.76 3.08 4.23 4.50 3.56July 11.05 3.44 2.73 2.84 2.51 2.34 4.56 4.39 1.30 3.99 6.04 2.30August 5.99 3.66 2.90 0.98 4.41 3.50 3.30 2.02 3.81 5.37 4.43 3.77
Fall 12.56 17.12 8.20 6.89 5.77 7.08 6.38 2.27 5.77 9.74 2.66 7.77Winter 7.97 3.70 5.80 2.23 6.04 6.71 4.97 4.70 7.30 5.35 3.65 2.07Spring 11.71 9.10 17.14 9.91 6.62 13.25 10.39 7.66 9.70 11.25 8.79 10.17Summer 23.31 10.29 8.28 6.68 8.89 13.03 12.27 11.17 8.19 13.59 14.97 9.63
Annual 55.55 40.21 39.42 25.70 27.31 40.06 34.02 25.81 30.97 39.91 30.06 29.64

93
Appendix H. (concluded)
Inches of precipitation per precipitation eventMonth 1992-
931993-
941994-
951995-
961996-
971997-
981998-
991999-
002000-
012001-
022002-
032003-
04
September 0.42 1.45 0.25 0.33 0.27 0.43 0.20 0.11 0.19 0.34 0.13 0.38October 0.20 0.59 0.48 0.34 0.18 0.2 0.19 0.15 0.18 0.29 0.27 0.22November 0.49 0.37 0.34 0.61 0.24 0.39 0.19 0.03 0.19 0.21 0.10 0.39December 0.31 0.12 0.29 0.09 0.18 0.15 0.14 0.15 0.06 0.16 0.65 0.13January 0.39 0.12 0.58 0.13 0.10 0.22 0.15 0.06 0.19 0.66 0.10 0.08February 0.33 0.27 0.20 0.19 0.48 0.38 0.08 0.10 0.35 0.14 0.14 0.06March 0.38 0.16 0.32 0.28 0.24 0.56 0.22 0.19 0.21 0.13 0.23 0.24April 0.48 0.42 0.26 0.43 0.16 0.29 0.25 0.11 0.24 0.47 0.42 0.36May 0.16 0.44 0.65 0.21 0.20 0.33 0.31 0.27 0.35 0.42 0.32 0.35June 0.48 0.25 0.18 0.26 0.14 0.42 0.37 0.40 0.28 0.42 0.45 0.51July 0.53 0.38 0.17 0.28 0.42 0.16 0.51 0.40 0.13 0.40 1.01 0.16August 0.29 0.31 0.16 0.25 0.29 0.22 0.37 0.12 0.27 0.54 0.74 0.34
Fall 0.38 0.86 0.36 0.38 0.22 0.34 0.19 0.07 0.19 0.27 0.15 0.34Winter 0.35 0.16 0.36 0.13 0.23 0.23 0.12 0.10 0.16 0.24 0.28 0.09Spring 0.32 0.36 0.42 0.26 0.19 0.37 0.27 0.20 0.28 0.33 0.40 0.31Summer 0.42 0.30 0.17 0.27 0.25 0.27 0.41 0.28 0.23 0.45 0.55 0.30
Annual 0.38 0.39 0.31 0.26 0.23 0.30 0.24 0.17 0.21 0.33 0.38 0.27
__________Note: The tables are based upon the total number of precipitation events in a given month, season, or year.


Appendix I. Documentation of Precipitation Eventsin the Imperial Valley, 2004–2005

96
Appendix I. Documentation of Precipitation Eventsin the Imperial Valley, 2004–2005
This appendix documents all storm event amounts, start times, and durations, and notes thosethat exceed an expected event amount (for 1-year to 100-year recurrence intervals) during the periodSeptember 1, 2004–August 31, 2005 (Table I-2). Table I-3 documents the storm event amounts foreach gauge. The maximum storm amount in a given network storm period is used to compute therecurrence interval for a given precipitation event. The same information for previous years is foundin Scott et al. (2002) and Wehrmann et al. (2004, 2005). Individual network storm durations of onehour to ten days were considered. The precipitation amounts and storm durations for 1- to 100-yearrecurrence intervals for west-central Illinois are given in Table I-1 (Huff and Angel, 1989).
To determine the return frequency of any storm in Table I-2 or I-3, obtain the storm durationfrom the tables, then look in the left-hand column of Table I-1 to locate the storm duration thatequals or just exceeds the storm duration in Table I-2 or I-3. If the precipitation for the event at anygauge in Table I-2 or I-3 exceeds the amount in Table I-1, obtain the return frequency by looking atthe heading of the right-hand column that the precipitation amount exceeds. For example, Table I-3indicates storm number 1495 has a duration of nine hours. This storm duration falls between the 6-and 12-hour storm duration in Table I-1. Assume a 12-hour storm duration. Table I-3 indicates thegauge at site 3 recorded precipitation equal to 3.24 inches. Therefore, site 3 exceeded the two-yearreturn frequency amount (2.62 inches) for a 12-hour storm.
Table I-3 indicates whether the maximum precipitation for the storm exceeds the expectedamount for the observed storm duration (one-year to 100-year recurrence intervals) considered. Astorm recurrence frequency of 50 years means that a storm of this intensity and duration would beexpected once every 50 years.

97
Table I-1. Precipitation Amounts for Different Storm Durations and Recurrence Intervals (Huff and Angel, 1989)
Storm Precipitation (inches) for given recurrence intervalduration 1-Yr 2-Yr 5-Yr 10-Yr 25-Yr 50-Yr 100-Yr
1 hour 1.18 1.42 1.77 2.09 2.50 2.86 3.25 2 hours 1.48 1.78 2.22 2.62 3.14 3.59 4.08 3 hours 1.61 1.93 2.41 2.85 3.41 3.89 4.43 6 hours 1.89 2.26 2.82 3.33 3.99 4.56 5.19
12 hours 2.17 2.62 3.27 3.87 4.63 5.29 6.0218 hours 2.28 2.75 3.46 4.09 4.90 5.59 6.3724 hours 2.52 3.02 3.76 4.45 5.32 6.08 6.9248 hours 2.81 3.38 4.19 4.86 5.78 6.62 7.5172 hours 3.05 3.70 4.55 5.26 6.15 7.25 8.16
5 days 3.48 4.17 5.11 5.84 6.96 7.98 9.2110 days 4.29 5.12 6.27 7.10 8.19 9.10 10.18

Table I-2. Documentation, Heavy Storm Amountsin the Imperial Valley, 2004–2005
98
Storm Storm Start Storm Number Network Storm Network Gauge No. Storm
Number Start Time Duration Gauges with Average Average Maximum with Recurrence
Day (CST) (Hours) Precipitation Precipitation Precipitation Precipitation Maximum Frequency
(inches) (inches) (inches)
September-041493 14 1200 3 5 0.05 0.21 0.49 131494 15 700 3 2 0.00 0.04 0.04 101495 15 1900 9 20 0.91 0.91 3.24 3 2-yr, 24-hr1496 16 700 3 6 0.01 0.04 0.04 6
October-041497 1 1900 7 20 0.36 0.36 0.51 241498 7 2100 21 20 0.58 0.58 0.95 71499 12 900 29 20 0.55 0.55 1.04 231500 14 1000 19 19 0.73 0.77 1.29 101501 15 900 15 5 0.04 0.15 0.52 231502 18 400 28 20 0.82 0.82 1.21 241503 19 1200 2 3 0.01 0.04 0.04 101504 20 700 8 8 0.02 0.04 0.05 121505 22 2100 1 2 0.00 0.02 0.04 81506 23 100 11 20 0.12 0.12 0.29 91507 26 1000 14 20 1.23 1.23 1.47 231508 27 600 9 8 0.02 0.05 0.14 31509 28 400 12 20 0.18 0.18 0.30 71510 28 2100 5 5 0.01 0.04 0.04 61511 29 500 6 9 0.02 0.04 0.05 31512 29 1700 14 20 0.49 0.49 1.00 18
November-041513 1 100 28 20 1.60 1.60 2.12 241514 3 1700 20 20 0.66 0.66 0.95 31515 17 500 11 8 0.02 0.04 0.05 31516 18 600 35 20 0.47 0.47 0.76 161517 24 100 22 20 0.69 0.69 1.31 241518 25 900 5 20 0.25 0.25 0.52 191519 27 400 16 20 0.38 0.38 0.59 71520 29 800 9 20 0.14 0.14 0.25 241521 30 500 19 20 0.34 0.34 0.43 12
December-041522 1 800 7 13 0.04 0.06 0.13 111523 5 2000 19 20 0.41 0.41 0.67 241524 6 2300 15 20 0.75 0.75 0.85 71525 10 800 2 3 0.01 0.04 0.04 181526 10 2000 6 8 0.02 0.05 0.08 19
January-051527 1 400 32 20 0.48 0.48 0.85 81528 2 2400 17 20 1.01 1.01 1.24 191529 4 1700 36 20 0.97 0.97 1.41 191530 7 1200 5 6 0.01 0.04 0.05 31531 7 2000 5 20 0.10 0.10 0.15 3

Table I-2. Documentation, Heavy Storm Amountsin the Imperial Valley, 2004–2005
99
1532 8 800 7 11 0.03 0.06 0.12 21533 9 1000 3 8 0.02 0.06 0.12 211534 10 2100 22 20 0.09 0.09 0.19 121535 11 2200 31 20 1.50 1.50 2.50 221536 13 800 10 20 0.12 0.12 0.24 211537 29 600 16 18 0.12 0.13 0.24 241538 30 300 9 14 0.03 0.04 0.05 12
February-051539 6 700 22 20 0.34 0.34 0.39 191540 7 800 19 20 0.14 0.14 0.25 231541 8 600 8 6 0.01 0.03 0.04 41542 8 1800 29 20 0.08 0.08 0.16 241543 13 300 27 20 0.84 0.84 1.20 191544 19 2300 24 19 0.09 0.10 0.20 231545 27 1500 23 20 0.13 0.13 0.20 18
March-051546 22 1300 25 20 0.41 0.41 0.55 241547 24 700 5 7 0.02 0.05 0.09 111548 24 1500 22 20 0.28 0.28 0.38 221549 30 1600 1 6 0.01 0.03 0.04 3
April-051550 6 1200 4 9 0.03 0.06 0.20 241551 11 2400 34 20 1.12 1.12 1.67 241552 21 1700 11 20 0.68 0.68 1.47 21553 22 700 14 20 0.13 0.13 0.29 241554 23 100 10 13 0.04 0.06 0.12 181555 25 2100 5 15 0.07 0.09 0.17 71556 26 600 5 8 0.02 0.04 0.04 41557 26 1400 5 6 0.01 0.05 0.08 19
May-051558 1 800 2 3 0.01 0.04 0.04 91559 9 100 4 20 0.15 0.15 0.30 71560 9 800 4 5 0.01 0.04 0.04 71561 11 1900 21 20 0.34 0.34 0.66 241562 18 2300 11 20 0.25 0.25 0.43 201563 19 1900 18 16 0.11 0.14 0.39 131564 29 1200 2 3 0.01 0.04 0.08 191565 30 300 1 2 0.00 0.04 0.04 181566 30 800 3 2 0.00 0.04 0.04 2
June-051567 4 900 4 7 0.03 0.09 0.17 101568 5 500 9 8 0.02 0.06 0.13 111569 8 1400 6 20 0.60 0.60 1.92 91570 8 2400 10 16 0.11 0.13 0.53 31571 11 1300 4 15 0.54 0.72 1.67 91572 13 2400 2 3 0.02 0.15 0.18 121573 14 600 1 3 0.01 0.04 0.04 21574 23 700 1 1 0.00 0.04 0.04 18

Table I-2. Documentation, Heavy Storm Amountsin the Imperial Valley, 2004–2005
100
July-051575 4 1200 11 8 0.07 0.17 0.41 21576 11 2300 23 20 0.68 0.68 1.09 71577 13 200 16 19 0.16 0.17 0.42 241578 24 2200 5 3 0.02 0.13 0.32 121579 26 1600 11 20 0.71 0.71 1.00 7
August-051580 4 600 6 3 0.04 0.26 0.43 71581 4 1700 18 13 0.26 0.40 0.90 221582 12 100 7 3 0.01 0.08 0.13 221583 12 1300 4 5 0.04 0.15 0.21 241584 12 2100 18 20 0.50 0.50 1.05 241585 13 1800 30 20 0.65 0.65 1.30 31586 18 2300 13 17 0.40 0.47 0.90 221587 19 2000 15 20 0.51 0.51 1.03 211588 21 2300 3 5 0.02 0.08 0.13 61589 25 1000 14 18 0.18 0.20 0.46 241590 26 500 15 14 0.04 0.05 0.13 20

__________Notes:*Duration specified in hours. Values in boldface type exceed one-year storm recurrence frequency.
101
Table I-3. Precipitation (inches) Received at Each Station from Each Storm Period during the 2004–2005 Observation Period
Storm Date Hour Duration Rain gauge site number2 3 4 6 7 8 9 10 11 12 13 15 16 18 19 20 21 22 23 24
1493 9142004 1200 3 0.08 0.00 0.04 0.00 0.00 0.00 0.33 0.00 0.00 0.00 0.49 0.00 0.00 0.00 0.13 0.00 0.00 0.00 0.00 0.001494 9152004 700 3 0.00 0.00 0.00 0.00 0.00 0.00 0.00 0.04 0.00 0.00 0.04 0.00 0.00 0.00 0.00 0.00 0.00 0.00 0.00 0.001495 9152004 1900 9 1.54 3.24 1.51 0.51 0.56 1.17 0.41 0.34 0.47 0.64 0.48 0.47 0.82 0.51 0.34 0.25 1.08 1.67 1.60 0.501496 9162004 700 3 0.00 0.00 0.00 0.04 0.00 0.00 0.04 0.04 0.00 0.00 0.04 0.00 0.00 0.00 0.00 0.00 0.00 0.00 0.04 0.04
1497 10012004 1900 7 0.29 0.14 0.21 0.34 0.35 0.30 0.41 0.34 0.34 0.49 0.48 0.35 0.30 0.46 0.42 0.43 0.35 0.30 0.37 0.511498 10072004 2100 21 0.45 0.60 0.41 0.60 0.95 0.50 0.49 0.50 0.90 0.69 0.42 0.71 0.42 0.45 0.43 0.45 0.67 0.68 0.71 0.621499 10122004 900 29 0.75 0.55 0.41 0.62 0.59 0.33 0.28 0.65 0.88 0.69 0.12 0.49 0.92 0.21 0.33 0.46 0.58 0.78 1.04 0.241500 10142004 1000 19 0.54 0.60 0.58 0.53 0.58 0.63 1.11 1.29 0.62 0.62 0.90 0.97 0.61 1.09 0.92 0.95 0.83 0.63 0.00 0.701501 10152004 900 15 0.00 0.00 0.00 0.00 0.00 0.00 0.00 0.00 0.04 0.00 0.00 0.00 0.09 0.00 0.04 0.00 0.04 0.00 0.52 0.001502 10182004 400 28 0.80 1.07 0.80 0.73 0.77 0.65 0.68 0.70 0.69 0.96 0.62 0.82 0.81 0.67 1.14 0.86 0.64 0.85 0.86 1.211503 10192004 1200 2 0.00 0.00 0.00 0.00 0.00 0.00 0.00 0.04 0.00 0.00 0.00 0.00 0.04 0.00 0.04 0.00 0.00 0.00 0.00 0.001504 10202004 700 8 0.04 0.00 0.00 0.04 0.04 0.00 0.04 0.00 0.00 0.05 0.00 0.00 0.00 0.04 0.00 0.00 0.00 0.04 0.00 0.041505 10222004 2100 1 0.00 0.00 0.01 0.00 0.00 0.04 0.00 0.00 0.00 0.00 0.00 0.00 0.00 0.00 0.00 0.00 0.00 0.00 0.00 0.001506 10232004 100 11 0.12 0.15 0.16 0.12 0.12 0.04 0.29 0.08 0.16 0.09 0.08 0.04 0.12 0.04 0.22 0.04 0.08 0.08 0.21 0.161507 10262004 1000 14 1.30 1.34 1.22 1.17 1.34 1.47 1.18 1.01 0.99 1.32 1.32 1.08 0.95 1.25 1.33 1.12 1.01 1.43 1.47 1.371508 10272004 600 9 0.00 0.14 0.04 0.00 0.04 0.00 0.00 0.00 0.04 0.00 0.00 0.00 0.04 0.00 0.04 0.00 0.00 0.04 0.01 0.001509 10282004 400 12 0.25 0.09 0.13 0.26 0.30 0.12 0.21 0.24 0.17 0.23 0.04 0.08 0.12 0.08 0.12 0.20 0.29 0.21 0.25 0.291510 10282004 2100 5 0.00 0.00 0.00 0.04 0.00 0.00 0.00 0.00 0.04 0.00 0.04 0.00 0.00 0.00 0.00 0.00 0.04 0.04 0.00 0.001511 10292004 500 6 0.00 0.05 0.04 0.00 0.00 0.00 0.04 0.04 0.00 0.05 0.00 0.00 0.00 0.04 0.04 0.00 0.00 0.00 0.05 0.041512 10292004 1700 14 0.55 0.58 0.55 0.34 0.35 0.47 0.51 0.37 0.43 0.18 0.57 0.30 0.30 1.00 0.42 0.30 0.52 0.73 0.52 0.71
1513 11012004 100 28 1.75 1.40 1.58 1.59 1.32 1.29 1.72 1.64 1.41 1.64 1.88 1.77 1.33 1.88 1.93 1.77 1.14 1.32 1.42 2.121514 11032004 1700 20 0.71 0.95 0.71 0.77 0.90 0.34 0.66 0.67 0.69 0.91 0.43 0.56 0.64 0.50 0.55 0.64 0.59 0.76 0.62 0.561515 11172004 500 11 0.04 0.05 0.04 0.00 0.00 0.00 0.04 0.00 0.00 0.00 0.00 0.00 0.00 0.04 0.00 0.04 0.04 0.00 0.04 0.001516 11182004 600 35 0.49 0.37 0.44 0.54 0.46 0.58 0.57 0.53 0.68 0.60 0.46 0.50 0.76 0.40 0.33 0.41 0.24 0.41 0.32 0.401517 11242004 100 22 0.62 0.56 0.79 0.46 0.45 0.50 0.84 0.50 0.58 0.70 0.72 0.86 0.42 0.73 1.02 1.10 0.71 0.41 0.49 1.311518 11252004 900 5 0.29 0.40 0.38 0.13 0.17 0.12 0.42 0.17 0.31 0.28 0.30 0.30 0.13 0.38 0.52 0.09 0.17 0.08 0.17 0.251519 11272004 400 16 0.41 0.57 0.28 0.45 0.59 0.20 0.37 0.36 0.49 0.48 0.20 0.41 0.33 0.20 0.28 0.34 0.44 0.46 0.54 0.251520 11292004 800 9 0.16 0.09 0.12 0.12 0.08 0.12 0.08 0.04 0.08 0.14 0.16 0.16 0.12 0.16 0.21 0.17 0.12 0.21 0.21 0.25

Table I-3. (continued)
__________Notes:*Duration specified in hours. Values in boldface type exceed one-year storm recurrence frequency.
102
1521 11302004 500 19 0.32 0.34 0.36 0.25 0.36 0.29 0.32 0.28 0.32 0.43 0.29 0.37 0.32 0.37 0.38 0.33 0.36 0.33 0.41 0.28
1522 12012004 800 7 0.04 0.09 0.00 0.08 0.04 0.00 0.08 0.04 0.13 0.05 0.04 0.00 0.00 0.04 0.00 0.00 0.04 0.08 0.00 0.041523 12052004 2000 19 0.50 0.32 0.46 0.33 0.33 0.52 0.38 0.39 0.21 0.42 0.48 0.38 0.25 0.56 0.52 0.43 0.34 0.30 0.33 0.671524 12062004 2300 15 0.72 0.81 0.76 0.76 0.85 0.80 0.76 0.84 0.73 0.82 0.78 0.78 0.68 0.75 0.73 0.64 0.76 0.76 0.67 0.671525 12102004 800 2 0.00 0.00 0.00 0.00 0.00 0.00 0.00 0.00 0.00 0.00 0.00 0.00 0.00 0.04 0.00 0.00 0.00 0.00 0.04 0.041526 12102004 2000 6 0.00 0.00 0.00 0.00 0.00 0.00 0.04 0.00 0.00 0.00 0.04 0.00 0.00 0.04 0.08 0.04 0.04 0.04 0.00 0.08
1527 1012005 400 32 0.58 0.41 0.71 0.63 0.38 0.85 0.45 0.45 0.38 0.57 0.46 0.45 0.34 0.46 0.37 0.46 0.37 0.36 0.50 0.411528 1022005 2400 17 1.17 1.09 1.03 0.85 0.90 1.07 0.96 0.96 0.98 1.14 1.00 0.93 0.84 0.91 1.24 1.03 0.88 1.02 1.14 1.051529 1042005 1700 36 0.77 0.71 0.78 0.87 0.95 0.92 1.03 0.92 0.80 1.17 0.96 1.04 0.87 1.08 1.41 1.09 0.82 1.00 1.07 1.191530 1072005 1200 5 0.04 0.05 0.00 0.04 0.04 0.00 0.00 0.00 0.04 0.00 0.04 0.00 0.00 0.00 0.00 0.00 0.00 0.00 0.00 0.001531 1072005 2000 5 0.08 0.15 0.08 0.12 0.08 0.08 0.12 0.08 0.08 0.09 0.13 0.12 0.12 0.08 0.13 0.12 0.08 0.08 0.12 0.081532 1082005 800 7 0.12 0.09 0.04 0.00 0.04 0.00 0.00 0.08 0.04 0.10 0.00 0.00 0.00 0.04 0.00 0.00 0.04 0.04 0.04 0.001533 1092005 1000 3 0.00 0.05 0.08 0.04 0.00 0.00 0.00 0.00 0.04 0.00 0.00 0.00 0.08 0.00 0.04 0.00 0.12 0.04 0.00 0.001534 1102005 2100 22 0.12 0.14 0.08 0.16 0.12 0.04 0.12 0.08 0.08 0.19 0.08 0.13 0.08 0.08 0.04 0.08 0.04 0.08 0.08 0.041535 1112005 2200 31 1.10 1.05 1.09 1.21 1.37 1.17 1.33 1.32 1.40 1.62 1.29 1.54 1.52 1.51 1.52 1.69 1.89 2.50 2.18 1.671536 1132005 800 10 0.08 0.09 0.08 0.08 0.12 0.08 0.16 0.16 0.12 0.10 0.08 0.12 0.16 0.20 0.16 0.08 0.24 0.12 0.12 0.121537 1292005 600 16 0.08 0.05 0.16 0.12 0.08 0.20 0.12 0.08 0.00 0.15 0.16 0.12 0.00 0.16 0.12 0.20 0.04 0.08 0.20 0.241538 1302005 300 9 0.04 0.04 0.00 0.00 0.04 0.04 0.04 0.04 0.04 0.05 0.04 0.04 0.00 0.04 0.00 0.00 0.04 0.04 0.00 0.04
1539 2062005 700 22 0.37 0.28 0.29 0.33 0.34 0.29 0.37 0.37 0.37 0.36 0.29 0.38 0.37 0.38 0.39 0.38 0.29 0.38 0.34 0.331540 2072005 800 19 0.12 0.14 0.12 0.16 0.12 0.08 0.12 0.12 0.12 0.13 0.12 0.12 0.08 0.17 0.17 0.16 0.16 0.17 0.25 0.121541 2082005 600 8 0.00 0.00 0.04 0.00 0.00 0.00 0.00 0.00 0.00 0.03 0.00 0.00 0.04 0.00 0.00 0.00 0.04 0.04 0.00 0.021542 2082005 1800 29 0.04 0.05 0.04 0.04 0.08 0.12 0.08 0.08 0.08 0.10 0.12 0.08 0.04 0.12 0.12 0.08 0.08 0.08 0.08 0.161543 2132005 300 27 0.93 0.69 0.89 0.79 0.82 0.79 1.00 0.86 0.62 0.75 0.76 0.80 0.74 0.83 1.20 0.96 0.71 0.92 0.87 0.901544 2192005 2300 24 0.12 0.05 0.12 0.12 0.08 0.04 0.16 0.08 0.04 0.14 0.04 0.08 0.08 0.12 0.08 0.12 0.00 0.12 0.20 0.081545 2272005 1500 23 0.12 0.14 0.08 0.12 0.12 0.12 0.16 0.08 0.12 0.13 0.12 0.16 0.12 0.20 0.16 0.12 0.16 0.16 0.12 0.16
1546 3222005 1300 25 0.45 0.33 0.45 0.29 0.47 0.49 0.37 0.29 0.34 0.42 0.41 0.41 0.45 0.41 0.50 0.42 0.33 0.33 0.41 0.551547 3242005 700 5 0.00 0.00 0.04 0.04 0.00 0.00 0.04 0.00 0.09 0.00 0.00 0.00 0.00 0.04 0.04 0.00 0.00 0.04 0.00 0.001548 3242005 1500 22 0.21 0.24 0.21 0.20 0.25 0.18 0.20 0.25 0.25 0.34 0.25 0.33 0.37 0.28 0.33 0.37 0.32 0.38 0.32 0.281549 3302005 1600 1 0.00 0.04 0.00 0.00 0.02 0.00 0.00 0.00 0.02 0.02 0.00 0.00 0.00 0.00 0.00 0.04 0.00 0.04 0.00 0.00

Table I-3. (continued)
__________Notes:*Duration specified in hours. Values in boldface type exceed one-year storm recurrence frequency.
103
1550 4062005 1200 4 0.00 0.00 0.04 0.00 0.00 0.04 0.04 0.00 0.00 0.00 0.04 0.04 0.00 0.04 0.04 0.04 0.00 0.00 0.00 0.201551 4112005 2400 34 0.70 0.46 1.23 0.63 0.55 1.29 1.21 1.50 1.09 0.97 1.05 1.45 1.02 1.26 1.19 1.19 1.29 1.64 1.05 1.671552 4212005 1700 11 1.47 0.72 1.00 0.98 0.78 1.04 0.87 0.79 0.60 0.59 0.71 0.51 0.78 0.71 0.26 0.37 0.38 0.39 0.41 0.171553 4222005 700 14 0.17 0.13 0.13 0.13 0.09 0.08 0.12 0.17 0.12 0.15 0.21 0.12 0.13 0.12 0.16 0.17 0.08 0.04 0.04 0.291554 4232005 100 10 0.00 0.05 0.04 0.00 0.04 0.04 0.04 0.00 0.00 0.04 0.04 0.00 0.00 0.12 0.08 0.00 0.04 0.04 0.04 0.121555 4252005 2100 5 0.08 0.10 0.16 0.13 0.17 0.08 0.09 0.12 0.04 0.10 0.04 0.13 0.00 0.04 0.00 0.04 0.00 0.00 0.00 0.081556 4262005 600 5 0.00 0.00 0.04 0.00 0.04 0.00 0.04 0.00 0.00 0.04 0.04 0.00 0.00 0.00 0.00 0.00 0.00 0.04 0.04 0.041557 4262005 1400 5 0.00 0.00 0.04 0.04 0.00 0.00 0.00 0.00 0.04 0.00 0.00 0.00 0.00 0.04 0.08 0.04 0.00 0.00 0.00 0.00
1558 5012005 800 2 0.00 0.00 0.00 0.00 0.00 0.00 0.04 0.04 0.04 0.00 0.00 0.00 0.00 0.00 0.00 0.00 0.00 0.00 0.00 0.001559 5092005 100 4 0.21 0.22 0.12 0.04 0.30 0.11 0.16 0.17 0.09 0.23 0.09 0.17 0.09 0.12 0.13 0.13 0.17 0.13 0.21 0.041560 5092005 800 4 0.00 0.00 0.00 0.00 0.04 0.00 0.00 0.00 0.00 0.00 0.00 0.00 0.00 0.00 0.04 0.04 0.00 0.04 0.04 0.001561 5112005 1900 21 0.12 0.32 0.25 0.43 0.17 0.36 0.62 0.29 0.17 0.32 0.30 0.30 0.43 0.37 0.39 0.29 0.38 0.34 0.34 0.661562 5182005 2300 11 0.04 0.18 0.08 0.38 0.34 0.32 0.34 0.37 0.39 0.32 0.25 0.21 0.21 0.25 0.17 0.43 0.12 0.12 0.21 0.211563 5192005 1900 18 0.13 0.13 0.13 0.00 0.09 0.01 0.00 0.16 0.04 0.00 0.39 0.00 0.04 0.08 0.21 0.30 0.12 0.30 0.08 0.041564 5292005 1200 2 0.00 0.00 0.00 0.00 0.00 0.01 0.00 0.00 0.00 0.00 0.00 0.00 0.00 0.00 0.08 0.04 0.00 0.00 0.00 0.001565 5302005 300 1 0.00 0.00 0.00 0.00 0.00 0.00 0.00 0.00 0.00 0.00 0.00 0.00 0.00 0.04 0.04 0.00 0.00 0.00 0.00 0.001566 5302005 800 3 0.04 0.00 0.00 0.00 0.00 0.00 0.00 0.00 0.00 0.00 0.00 0.00 0.00 0.00 0.00 0.00 0.00 0.00 0.00 0.04
1567 6042005 900 4 0.04 0.00 0.00 0.00 0.00 0.00 0.08 0.17 0.00 0.00 0.00 0.00 0.08 0.08 0.00 0.00 0.08 0.00 0.00 0.091568 6052005 500 9 0.04 0.00 0.00 0.00 0.04 0.00 0.00 0.00 0.13 0.00 0.08 0.04 0.00 0.00 0.04 0.04 0.00 0.00 0.08 0.001569 6082005 1400 6 0.63 0.72 0.08 1.25 0.56 0.09 1.92 0.71 0.73 0.19 1.11 0.34 0.60 0.33 0.65 0.51 0.25 0.86 0.25 0.261570 6082005 2400 10 0.04 0.53 0.08 0.00 0.04 0.17 0.00 0.38 0.00 0.18 0.04 0.17 0.00 0.08 0.04 0.04 0.04 0.04 0.04 0.211571 6112005 1300 4 0.17 1.02 0.25 1.16 0.70 0.00 1.67 1.01 0.87 0.00 0.00 0.78 0.61 0.00 0.21 0.78 0.68 0.81 0.09 0.001572 6132005 2400 2 0.00 0.00 0.00 0.09 0.17 0.00 0.00 0.00 0.00 0.18 0.00 0.00 0.00 0.00 0.00 0.00 0.00 0.00 0.00 0.001573 6142005 600 1 0.04 0.00 0.04 0.00 0.00 0.00 0.00 0.00 0.00 0.00 0.00 0.00 0.00 0.00 0.00 0.00 0.04 0.00 0.00 0.001574 6232005 700 1 0.00 0.00 0.00 0.00 0.00 0.00 0.00 0.00 0.00 0.00 0.00 0.00 0.00 0.04 0.00 0.00 0.00 0.00 0.00 0.00
1575 7042005 1200 11 0.41 0.00 0.04 0.00 0.00 0.04 0.17 0.00 0.00 0.00 0.13 0.00 0.00 0.21 0.30 0.00 0.00 0.00 0.00 0.081576 7112005 2300 23 0.78 0.68 0.66 0.50 1.09 0.64 0.59 0.47 0.67 0.99 0.64 0.54 0.67 0.54 0.75 0.59 0.72 0.71 0.69 0.621577 7132005 200 16 0.12 0.18 0.08 0.17 0.25 0.09 0.33 0.16 0.25 0.14 0.04 0.12 0.25 0.08 0.08 0.12 0.21 0.21 0.00 0.421578 7242005 2200 5 0.00 0.00 0.00 0.00 0.00 0.00 0.00 0.00 0.00 0.32 0.00 0.00 0.04 0.00 0.00 0.04 0.00 0.00 0.00 0.00

Table I-3. (concluded)
__________Notes:*Duration specified in hours. Values in boldface type exceed one-year storm recurrence frequency.
104
1579 7262005 1600 11 0.87 0.73 0.97 0.78 1.00 0.78 0.76 0.67 0.77 0.83 0.84 0.60 0.51 0.71 0.61 0.43 0.43 0.61 0.75 0.46
1580 8042005 600 6 0.00 0.00 0.00 0.00 0.43 0.00 0.00 0.00 0.00 0.22 0.00 0.13 0.00 0.00 0.00 0.00 0.00 0.00 0.00 0.001581 8042005 1700 18 0.46 0.82 0.28 0.00 0.30 0.21 0.00 0.00 0.00 0.10 0.04 0.00 0.00 0.67 0.04 0.00 0.21 0.90 0.88 0.291582 8122005 100 7 0.00 0.00 0.00 0.00 0.00 0.00 0.00 0.00 0.00 0.00 0.00 0.00 0.00 0.00 0.00 0.00 0.00 0.13 0.04 0.081583 8122005 1300 4 0.00 0.09 0.00 0.00 0.00 0.00 0.00 0.00 0.00 0.00 0.00 0.00 0.00 0.00 0.00 0.00 0.17 0.13 0.13 0.211584 8122005 2100 18 0.34 0.36 0.33 0.30 0.21 0.97 0.38 0.25 0.43 0.22 0.84 0.35 0.34 0.97 0.57 0.56 0.43 0.52 0.55 1.051585 8132005 1800 30 1.16 1.30 1.25 0.94 1.07 1.08 0.63 0.68 0.50 0.84 0.47 0.37 0.33 0.37 0.45 0.28 0.33 0.29 0.28 0.411586 8182005 2300 13 0.00 0.00 0.04 0.00 0.13 0.21 0.34 0.76 0.70 0.86 0.31 0.38 0.56 0.58 0.43 0.34 0.30 0.90 0.50 0.581587 8192005 2000 15 0.58 0.90 0.55 0.56 0.34 0.48 0.34 0.34 0.17 0.64 0.09 0.39 0.48 0.21 0.30 0.74 1.03 0.90 0.63 0.501588 8212005 2300 3 0.00 0.00 0.08 0.13 0.00 0.00 0.00 0.00 0.00 0.05 0.00 0.04 0.00 0.00 0.00 0.00 0.00 0.00 0.08 0.001589 8252005 1000 14 0.04 0.00 0.12 0.08 0.00 0.16 0.13 0.16 0.13 0.10 0.21 0.17 0.08 0.25 0.35 0.39 0.17 0.43 0.21 0.461590 8262005 500 15 0.04 0.00 0.00 0.04 0.04 0.00 0.04 0.00 0.04 0.05 0.08 0.00 0.00 0.04 0.04 0.13 0.04 0.04 0.04 0.04
