2 gdi engine development acc to eu 6 - avl
TRANSCRIPT

GDI engine development according EU 6
AVL SEMINAR, Oliver Fritz

2
EmissionEU-1 EU-2 EU-3 EU-4 EU-5a EU-5b EU-6
1992 1996 2000 2005 2009 2011 2014
Moderate Reduction (<30%) Large Reduction (>30%)
CO
PositiveIgnitionEngines(Gasoline)
2720 2200 2300 1000 1000 1000 1000
HC 200 100 100 100 100
NMHC 68 68 68
HC + NOx 970 500
NOx 150 80 60 60 60
PM only GDI 5 4,5 4,5
PN 6E12
mg/km
mg/km
mg/km
mg/km
mg/km
mg/km
#/km
2720 1000 640 500 500 500 500
970 560 300 230 230 170700
500 250 180 180 80
140 80 50 25 5 4,5 4,5
6E11 6E11
CO
CompressionIgnitionEngines(Diesel)
HC + NOx
NOx
PM
PN
mg/km
mg/km
mg/km
mg/km
#/km
Light duty emissions legislationEU Limits

3
PM-PN correlation
Grey solid symbols are data from the PMP light duty inter-laboratory exercise with the light duty golden instrument (Rotating disk type from Matter Eng.). Colored open symbols are data with APCs at various laboratories. Each point is a different vehicle or a different fuel (exception for D (DPF) PMP, which is the golden vehicle, all labs results are given). D=Diesel, DPF=Diesel Particulate Filter, MPI=Multi Point Injection, G-DI=Gasoline Direct Injection, LPG=Liquefied Petroleum Gas.
Comparison of the PN with the regulated PM emissions for different heavy duty engine technologies. Grey solid symbols are data from the PMP heavy duty inter-laboratory exercise with the heavy duty Golden instrument (SPCS prototype). Colored open symbols are measurements with APCs at JRC and AVL. Each point is a different engine or test cycle. DOC=Diesel Oxidation Catalyst, DPF=Diesel Particulate Filter, SCR=Selective Catalytic Reduction for NOx.
Giechaskiel et al. 2010, MST, in press.
No correlationNo correlation

4AVL P. Hollerer, VDI Forum Stuttgart 2010-12-070 100 200 300 400
Part
icu
late
nu
mb
er
[#]
Reduction of particulate number emission of GDI engines by calibration
EU6 –PN Limit proposal 6,0 E12#/km
time
0
500 600 700 1100 1200
SP
EE
D [km
/h]
0
60
120
What are the Challenges for EU6 emission calibration?
� EU6: New emission target for PN
� Find new strategies for PN reduction
� HW definition and combustion layout PN optimized
� Implementation of new functionalities for PN
� Update calibration process, methods and measurement equipment for particulates
800 900 1000

5AVL P. Hollerer, VDI Forum Stuttgart 2010-12-07
OutletInlet Spark plug
Injector MPI
InsideMixture formationOutside ����
����
� Differences MPI vs. GDI
Soot is a phenomenon of insufficient preparation of the air-fuel mixture.
It occurs mainly at direct injection engines, due to less time for homogenization.
OutletInlet
Injector GDI
Spark plug
Particulate generation
Wall fuel film:
MPI � manifold GDI � in Cylinder
6AVL P. Hollerer, VDI Forum Stuttgart 2010-12-07
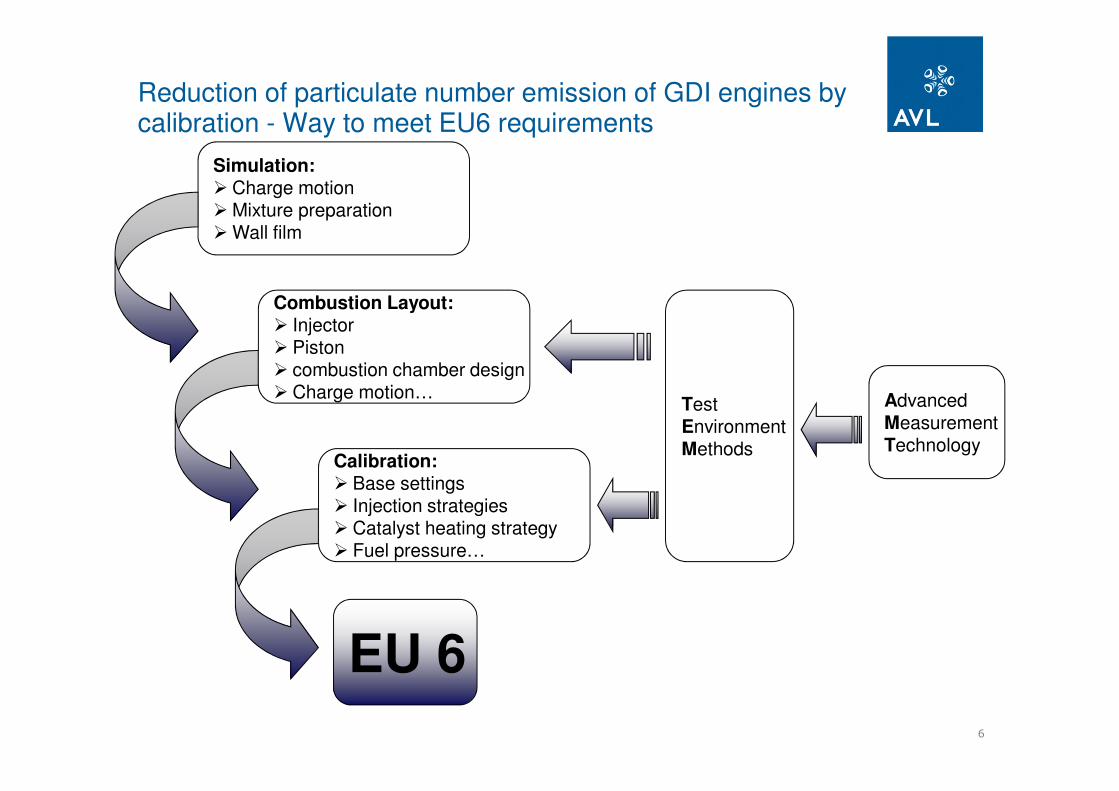
Simulation:� Charge motion� Mixture preparation � Wall film
Combustion Layout:� Injector � Piston� combustion chamber design� Charge motion…
Calibration:� Base settings� Injection strategies� Catalyst heating strategy� Fuel pressure…
EU 6
Advanced Measurement Technology
Test EnvironmentMethods
Reduction of particulate number emission of GDI engines by calibration - Way to meet EU6 requirements

7AVL P. Hollerer, VDI Forum Stuttgart 2010-12-07
Advanced Measurement Technology
Microsoot Sensor
Particle counter
Opaci-meter
PNPM
Emission Bench
VisioFEM Gasoline
Visio
Measurement Technology
AdvancedEmissionMeasurementTechnology

8AVL P. Hollerer, VDI Forum Stuttgart 2010-12-07
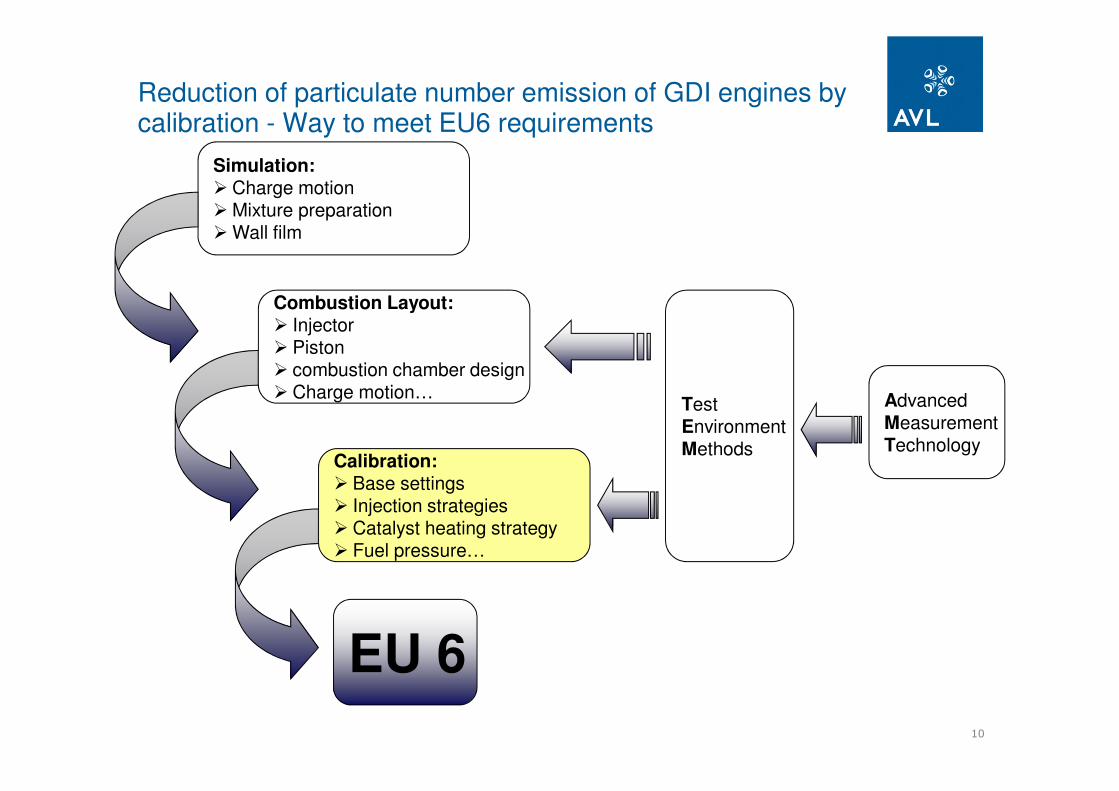
Simulation:� Charge motion� Mixture preparation � Wall film
Combustion Layout:� Injector � Piston� combustion chamber design� Charge motion…
Calibration:� Base settings� Injection strategies� Catalyst heating strategy� Fuel pressure…
EU 6
Advanced Measurement Technology
Test EnvironmentMethods
Reduction of particulate number emission of GDI engines by calibration - Way to meet EU6 requirements
9AVL P. Hollerer, VDI Forum Stuttgart 2010-12-07
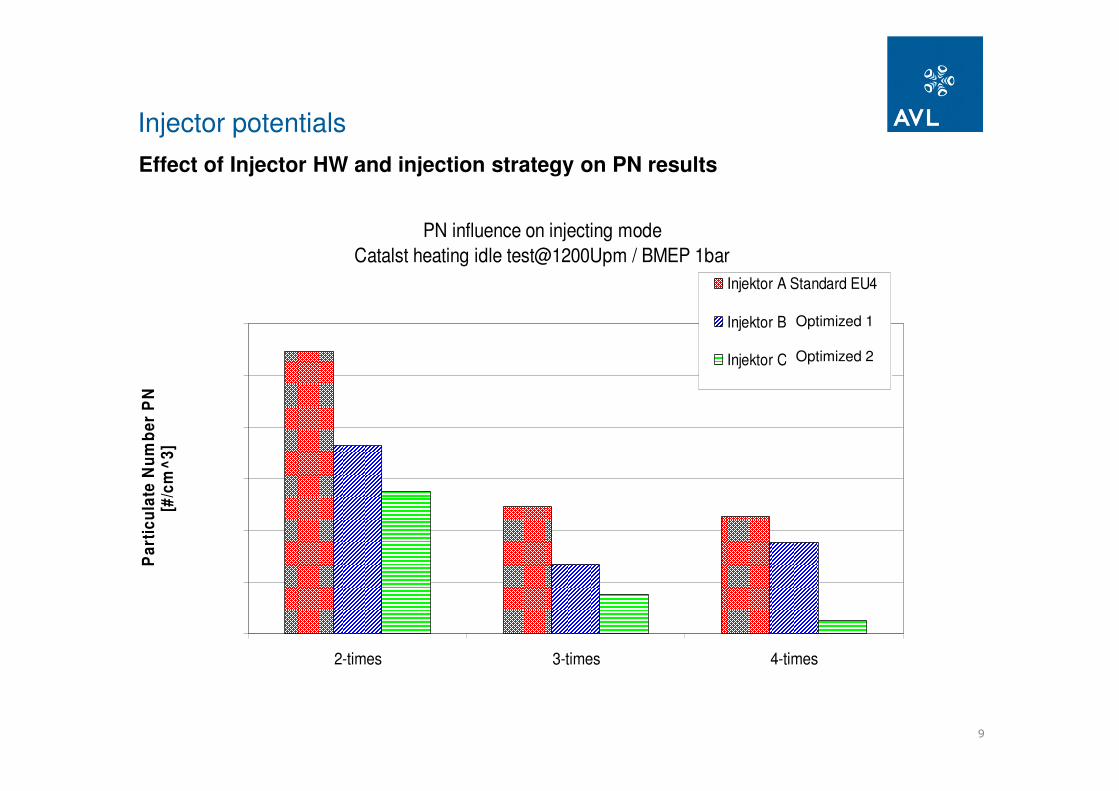
Effect of Injector HW and injection strategy on PN results
s
PN influence on injecting mode
Catalst heating idle test@1200Upm / BMEP 1bar
0,0E+00
5,0E+05
1,0E+06
1,5E+06
2,0E+06
2,5E+06
3,0E+06
2-times 3-times 4-times
Pa
rtic
ula
te N
um
be
r P
N[#
/cm
^3
]
Injektor A Standard EU4
Injektor B Optimierung 1
Injektor C Optimierung 2
Injector potentials
Optimized 1
Optimized 2
10AVL P. Hollerer, VDI Forum Stuttgart 2010-12-07
Simulation:� Charge motion� Mixture preparation � Wall film
Combustion Layout:� Injector � Piston� combustion chamber design� Charge motion…
Calibration:� Base settings� Injection strategies� Catalyst heating strategy� Fuel pressure…
EU 6
Advanced Measurement Technology
Test EnvironmentMethods
Reduction of particulate number emission of GDI engines by calibration - Way to meet EU6 requirements
11AVL P. Hollerer, VDI Forum Stuttgart 2010-12-07
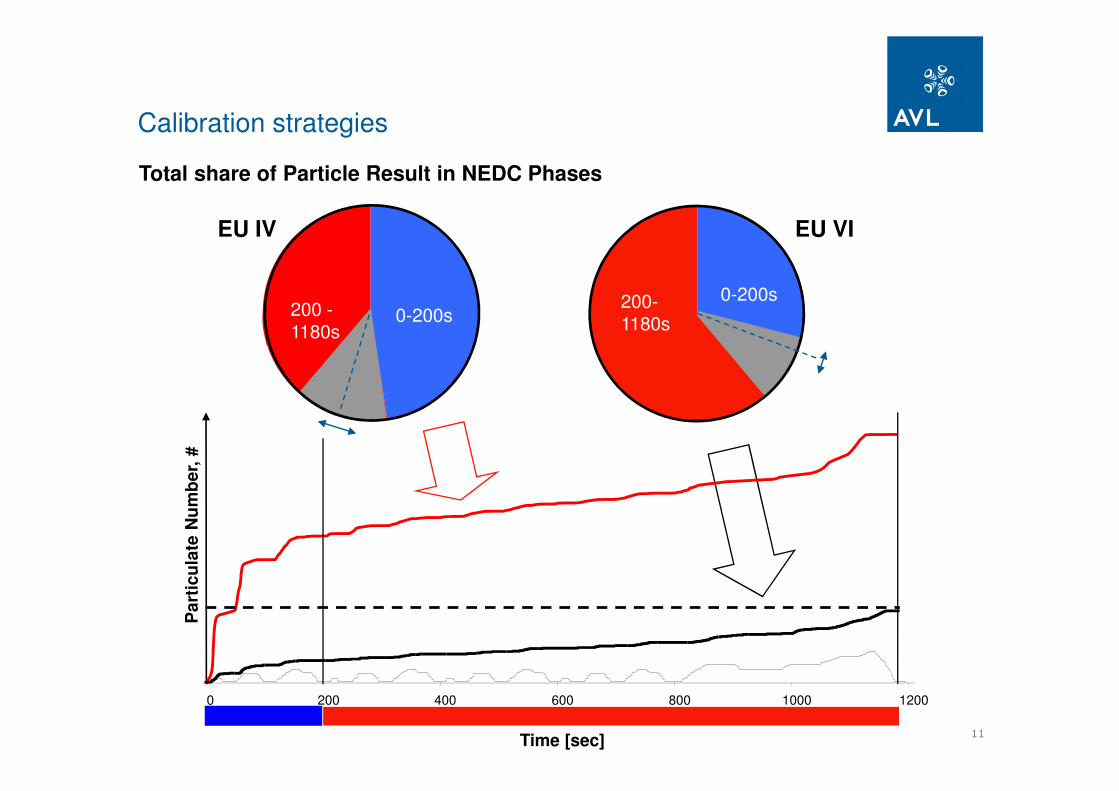
Calibration strategies
0-200s200-1180s
0-200s200 -1180s
Part
icu
late
Nu
mb
er,
#
0 200 400 600 800 1000 1200
Time [sec]
Total share of Particle Result in NEDC Phases
EU IV EU VI
12AVL P. Hollerer, VDI Forum Stuttgart 2010-12-07
0 100 200 300 400 500 600 700 800 900 1000 1100 1200recorder_tim e [s]
SP
EE
D [
km
/h]
0
40
80
120
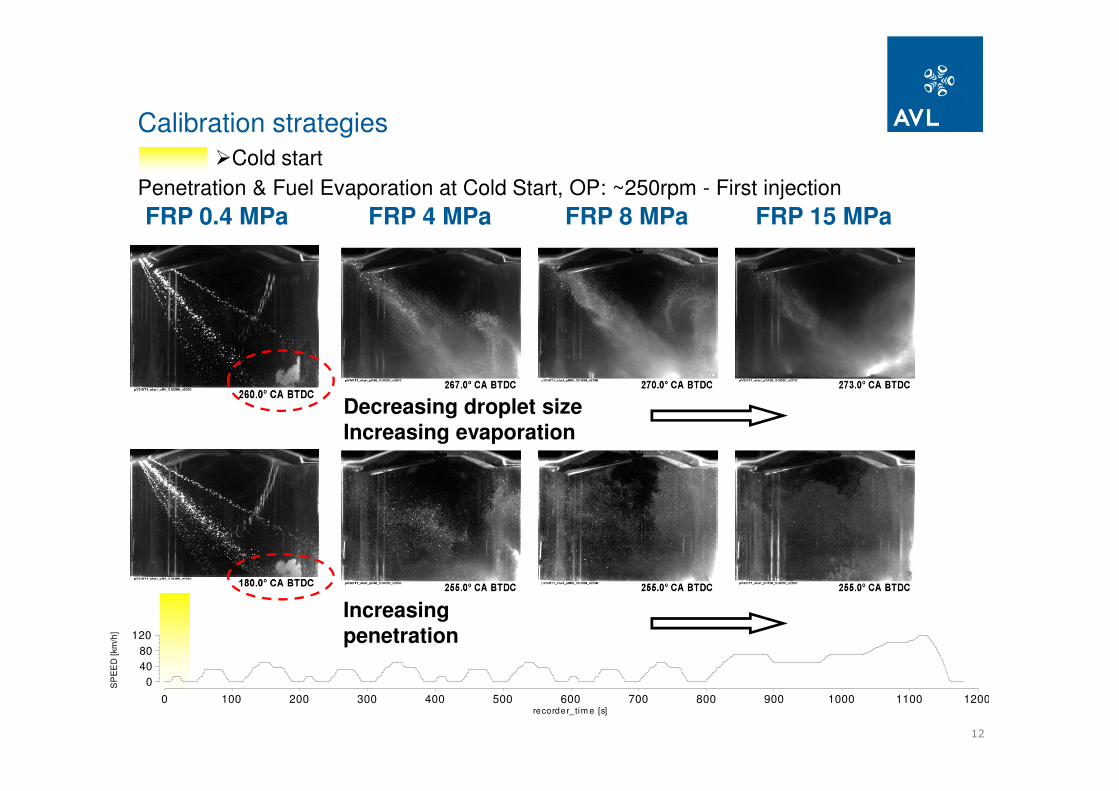
FRP 0.4 MPa FRP 15 MPa FRP 4 MPa FRP 8 MPa
Decreasing droplet sizeIncreasing evaporation
Increasing penetration
Penetration & Fuel Evaporation at Cold Start, OP: ~250rpm - First injection
�Cold start
Calibration strategies

13AVL P. Hollerer, VDI Forum Stuttgart 2010-12-07
COMBUSTION QUALITY
14AVL P. Hollerer, VDI Forum Stuttgart 2010-12-07
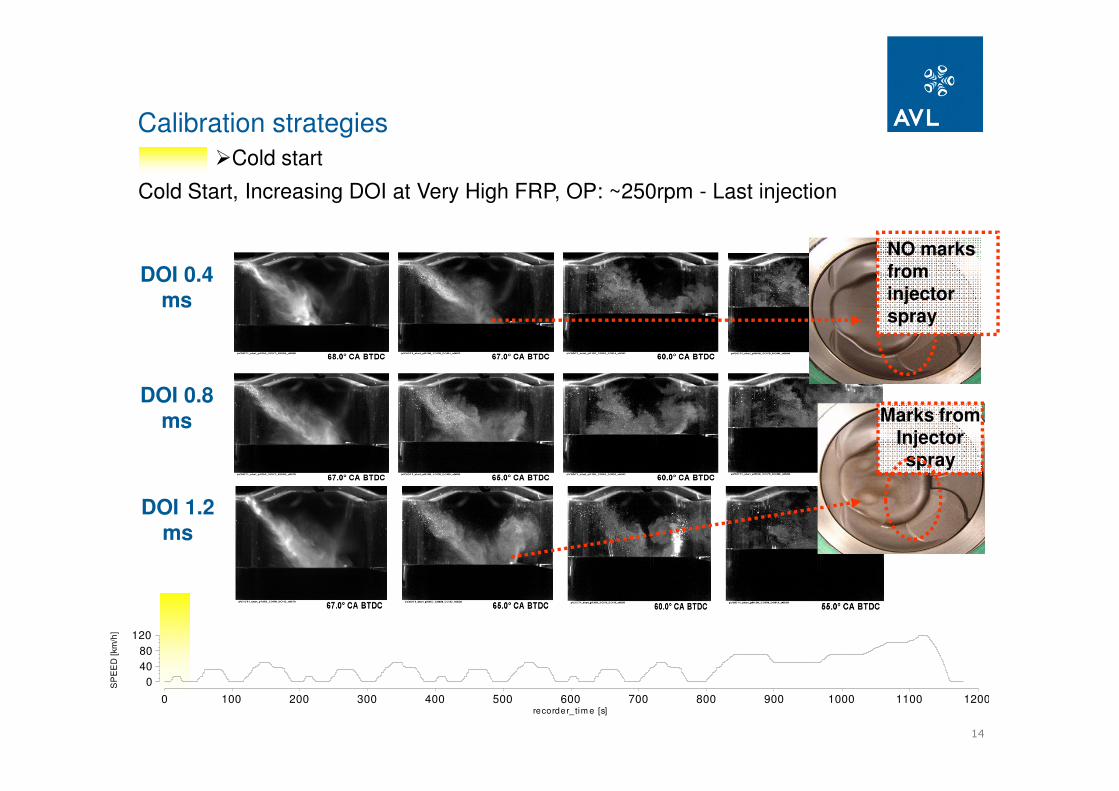
DOI 0.4 ms
DOI 0.8 ms
DOI 1.2 ms
Cold Start, Increasing DOI at Very High FRP, OP: ~250rpm - Last injection
Marks from Injector spray
NO marks from injector spray
0 100 200 300 400 500 600 700 800 900 1000 1100 1200recorder_tim e [s]
SP
EE
D [
km
/h]
0
40
80
120
�Cold start
Calibration strategies

15AVL P. Hollerer, VDI Forum Stuttgart 2010-12-07
0 100 200 300 400 500 600 700 800 900 1000 1100 1200recorder_tim e [s]
SP
EE
D [
km
/h]
0
40
80
120
Particulates >23 nm in tailpipe exhaust
�Cold start injection strategy – Multiple injection
Calibration strategies
Single Injection
Double Injection
Triple Injection
Quadruple Injection
Time - s
0 5 10 15 20 25
Part
icu
late
Nu
mb
er
–p
/ccm

16AVL P. Hollerer, VDI Forum Stuttgart 2010-12-07
�Catalyst heating (base settings)
� Catalyst heating idle test @1200rpm (cooled liquids – water&oil 20°)
EOI
last injectionlate earlier
BF
SC
, T
HC
, N
Ox,
CO
OP, F
SN
, P
N, P
M
Particle mass
Particle number
Filter smoke number
Opacity
EOI sweep
0 100 200 300 400 500 600 700 800 900 1000 1100 1200recorder_tim e [s]
SP
EE
D [
km
/h]
0
40
80
120
Calibration strategies
17AVL P. Hollerer, VDI Forum Stuttgart 2010-12-07
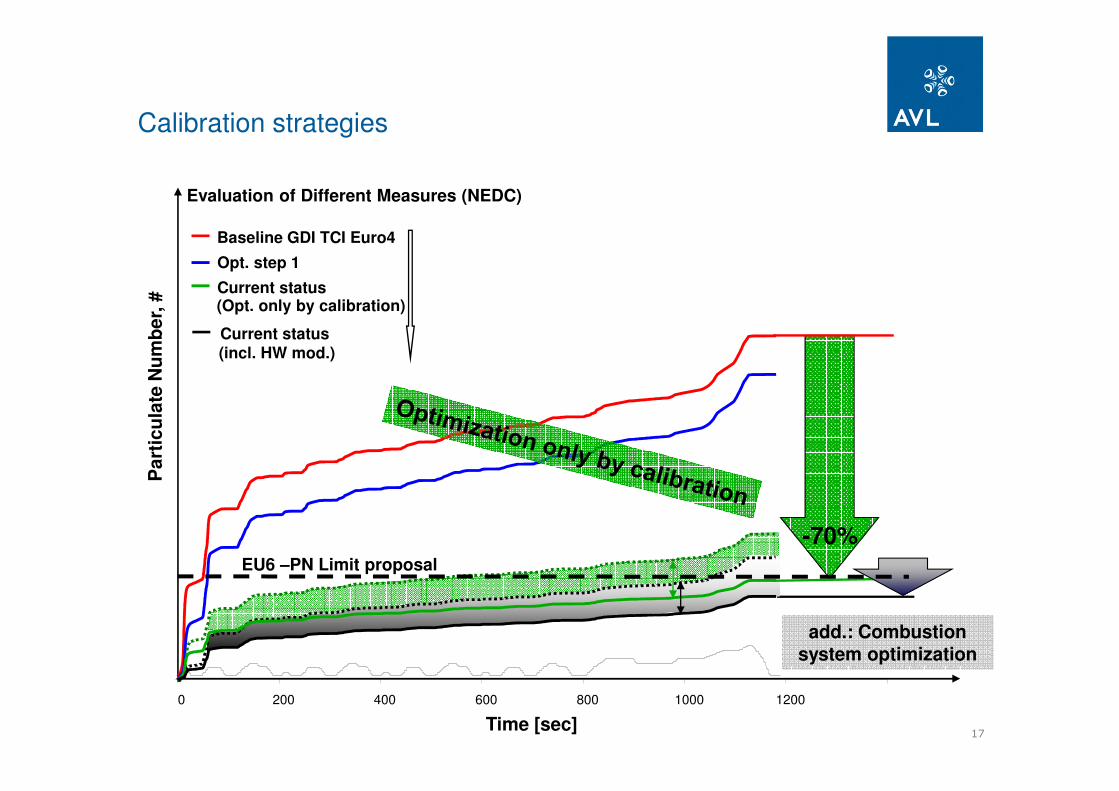
Part
icu
late
Nu
mb
er,
#
-70%EU6 –PN Limit proposal
Evaluation of Different Measures (NEDC)
0 200 400 600 800 1000 1200
Time [sec]
Baseline GDI TCI Euro4
Current status(Opt. only by calibration)
add.: Combustion system optimization
Current status (incl. HW mod.)
Opt. step 1
Calibration strategies
18
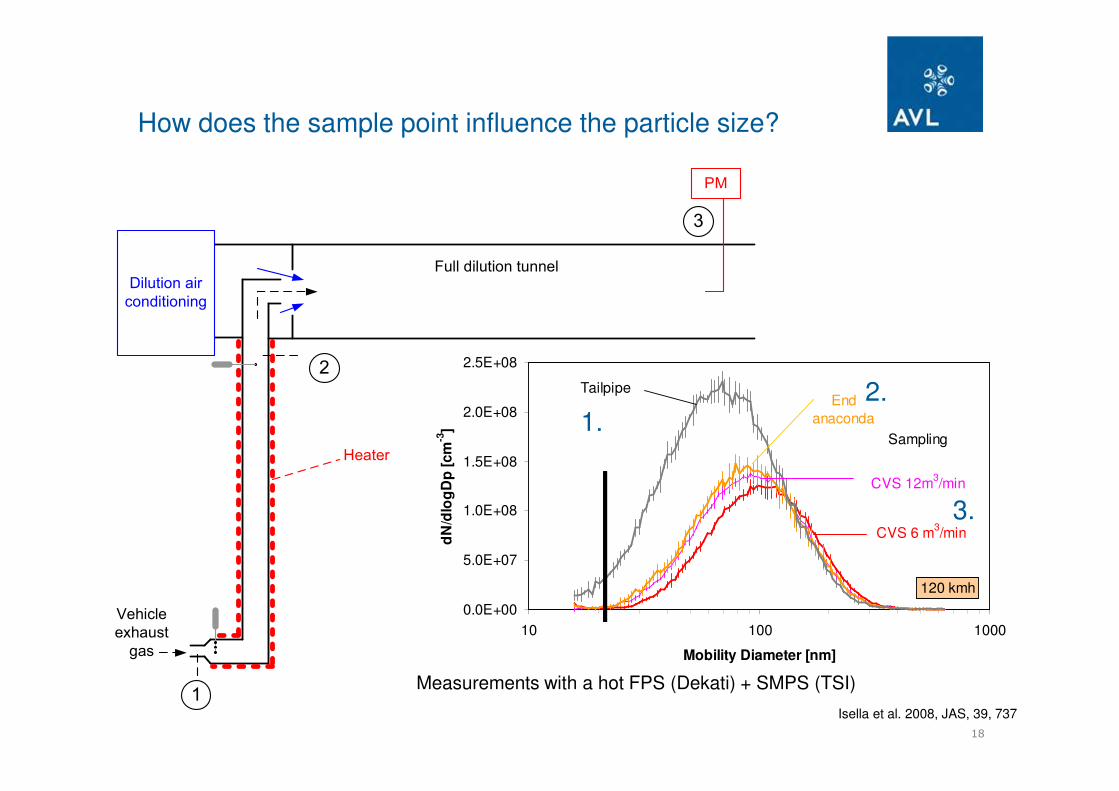
How does the sample point influence the particle size?
Dilution air
conditioning
Vehicle
exhaust
gas
Full dilution tunnel
1
2
PM
3
Heater
0.0E+00
5.0E+07
1.0E+08
1.5E+08
2.0E+08
2.5E+08
10 100 1000
Mobility Diameter [nm]
dN
/dlo
gD
p [
cm
-3]
Tailpipe
Sampling
End
anaconda
CVS 12m3/min
CVS 6 m3/min
120 kmh
1.2.
3.
Measurements with a hot FPS (Dekati) + SMPS (TSI)
Isella et al. 2008, JAS, 39, 737

19
Particle formation
20
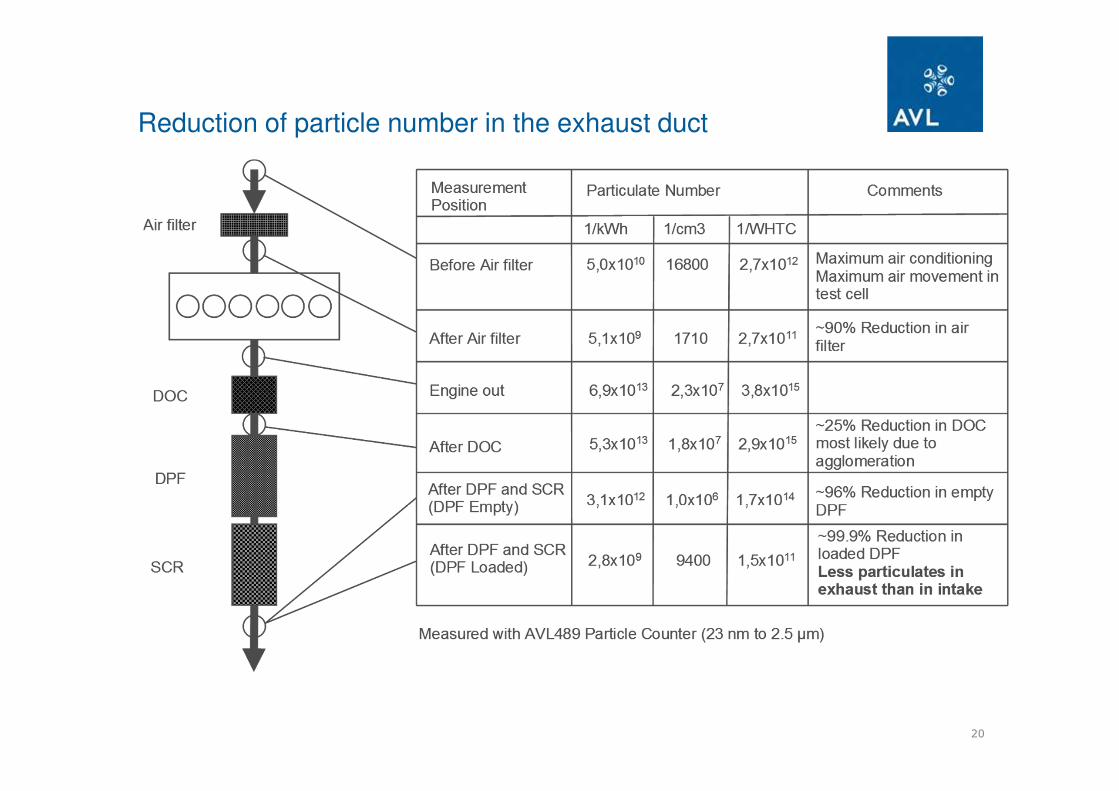
Reduction of particle number in the exhaust duct

21
Two ways to measure the particles a GDI engine
AVL Micro Soot Sensor
AVL Particle Counter
22
Three ways to measure the particles of a GDI engine
Photo acoustic principle
- Able to detect very low soot values
- dynamic measurement signal specially for dynamic testrun
development
- R&D only (except HDIUC in USA)
Light scattering (particle counting)
- legislative requirement of solid particle measurement
- dynamic measurement
Filter Smoke Method (FSN)
- only for steady state application (R&D only)
23
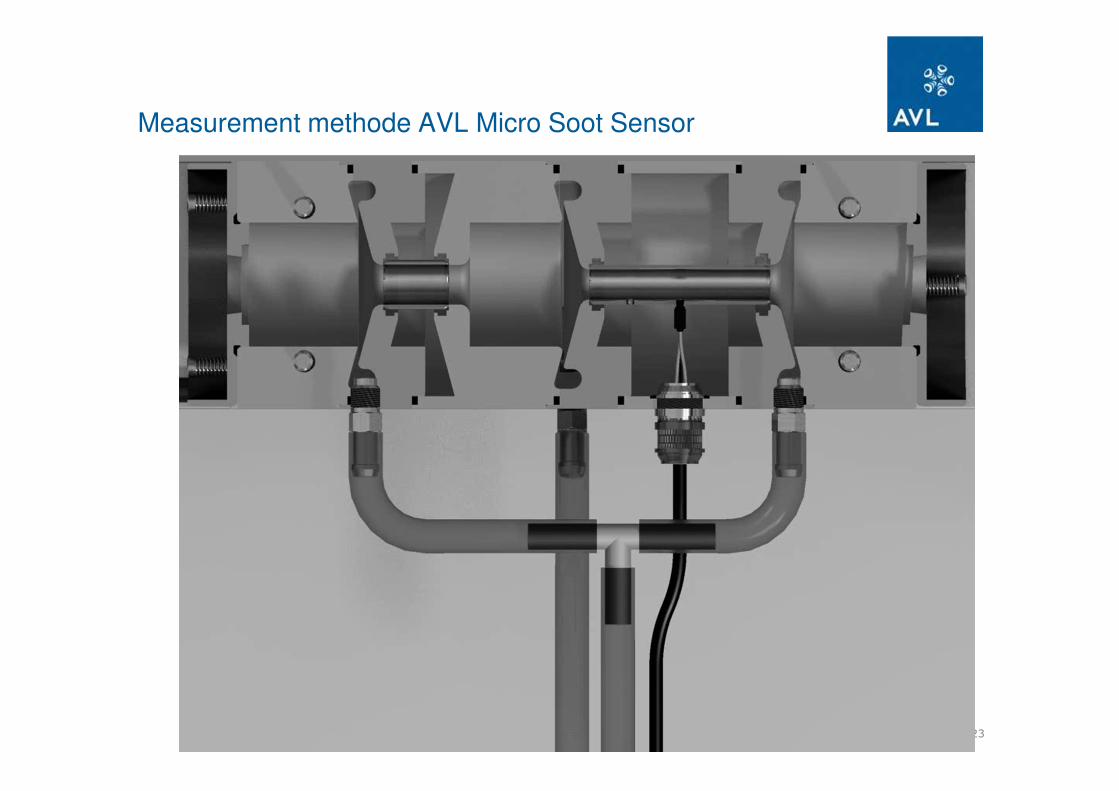
Measurement methode AVL Micro Soot Sensor

24
0.00
0.20
0.40
0.60
0.80
1.00
1.20
1.40
1.60
1.80
0 200 400 600 800 1000 1200
Zeit [s]
Ru
ß [
mg
/cm
3]
0.00
0.04
0.08
0.12
0.16
500 600 700 800 900 1000 1100
Zeit [s]
Ru
ß [
mg
/cm
3]1,6L GDI Cold Start
Measurement results on GDI engines with MSS
Cold Start Tests
Especially for the transient optimization MSS is a suitable tool
Because the high sensitivity the MSS can be used to measure soot emissions of GDI engines

25
Measurement Methode AVL Particle Counter
Evaporation Tube
Dilution Tunnel (CVS)
PND1PNC: Particle
Number Counter
PND2
VPR: Volatile Particle Remover
Dilution air in To critical flow venturi
C HEPA
Particle number diluter 2
Particle number diluter 1
>23nm
Condensation Particle Counter (CPC) for particle counting
AVL Primary Diluter PND1
or

26
APC – MEASUREMENT RESULTS
0.0E+00
5.0E+10
1.0E+11
1.5E+11
2.0E+11
2.5E+11
3.0E+11
3.5E+11
4.0E+11
4.5E+11
5.0E+11
1 111 221 331 441 551 661 771 881 991 1101
0.0E+00
5.0E+12
1.0E+13
1.5E+13
2.0E+13
2.5E+13
GDI [#/s] MPI [#/s] GDI [#] MPI [#]
0.00
60.00
120.00
1 111 221 331 441 551 661 771 881 991 1101
SPEED km/h

27
Correlation of PN - PM
Euro 5: 4.5 mg/km and 6x10^11 p/km � 5x10^12 p/km
Euro VI: 10 mg/kWh and 6-8x10^11 p/kWh � 1x10^13 p/kWh
Giechaskiel et al. 2012, AST in press
28
0
2
4
6
8
10
12
14
16
18
20
0 500 1000 1500 2000 2500 3000 3500 4000 4500 5000
t [s]
so
ot
[mg
/m3]
0.0E+00
1.0E+07
2.0E+07
3.0E+07
4.0E+07
5.0E+07
6.0E+07
7.0E+07
8.0E+07
PN
C [
#/c
m3]
415S soot conc mg/m3
MSS soot conc mg/m3
APC #/cm3
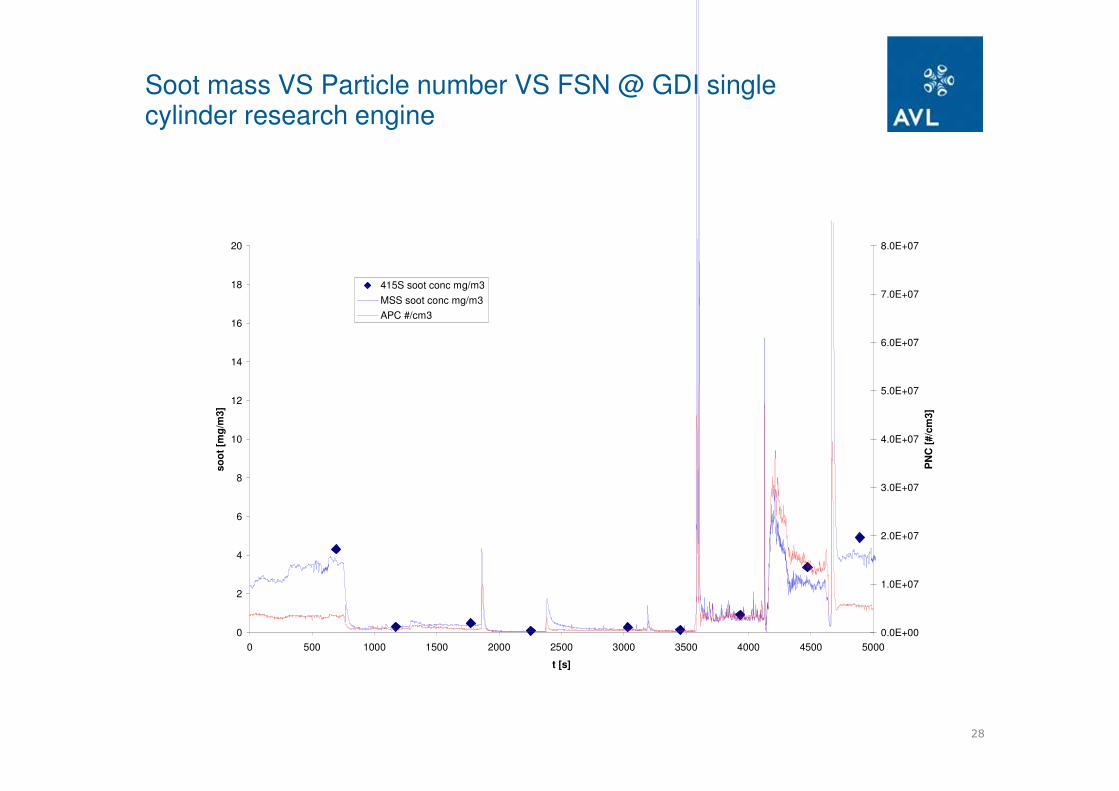
Soot mass VS Particle number VS FSN @ GDI singlecylinder research engine
29
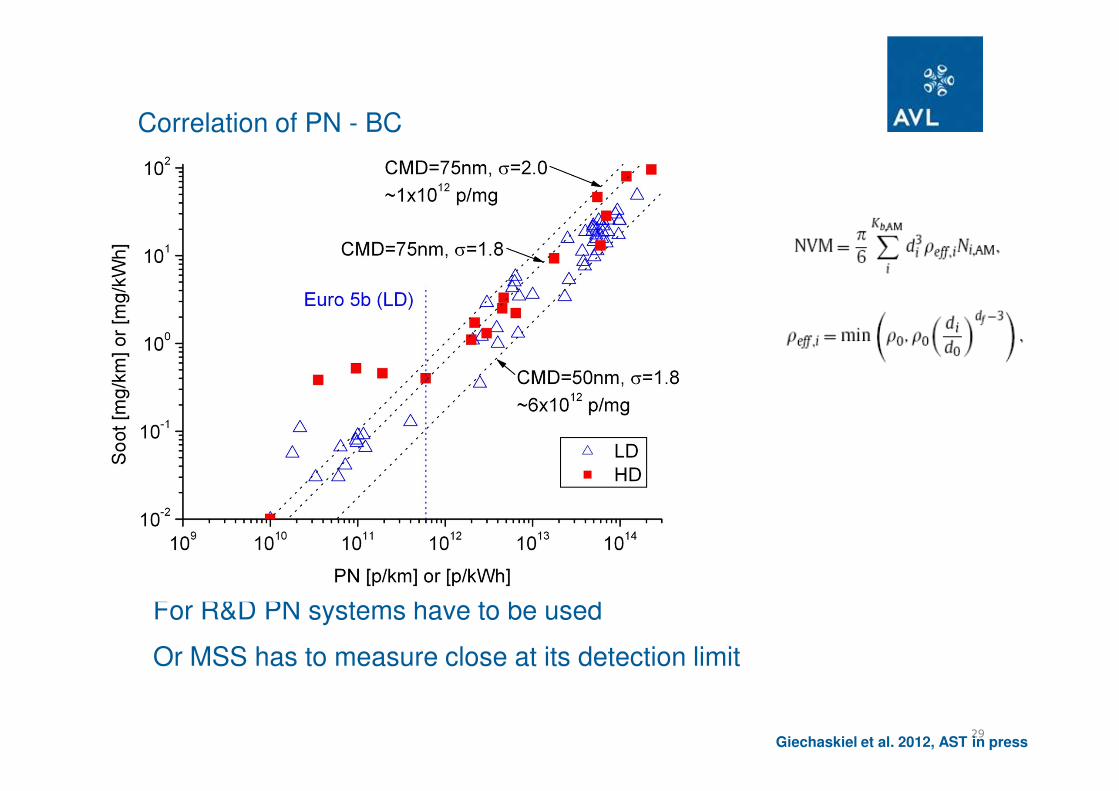
Correlation of PN - BC
For R&D PN systems have to be used
Or MSS has to measure close at its detection limit
Giechaskiel et al. 2012, AST in press
30
0.001
0.01
0.1
1
10
1.0E+08 1.0E+09 1.0E+10 1.0E+11 1.0E+12 1.0E+13 1.0E+14
Particle number [#/km]
So
ot
[mg
//km
]
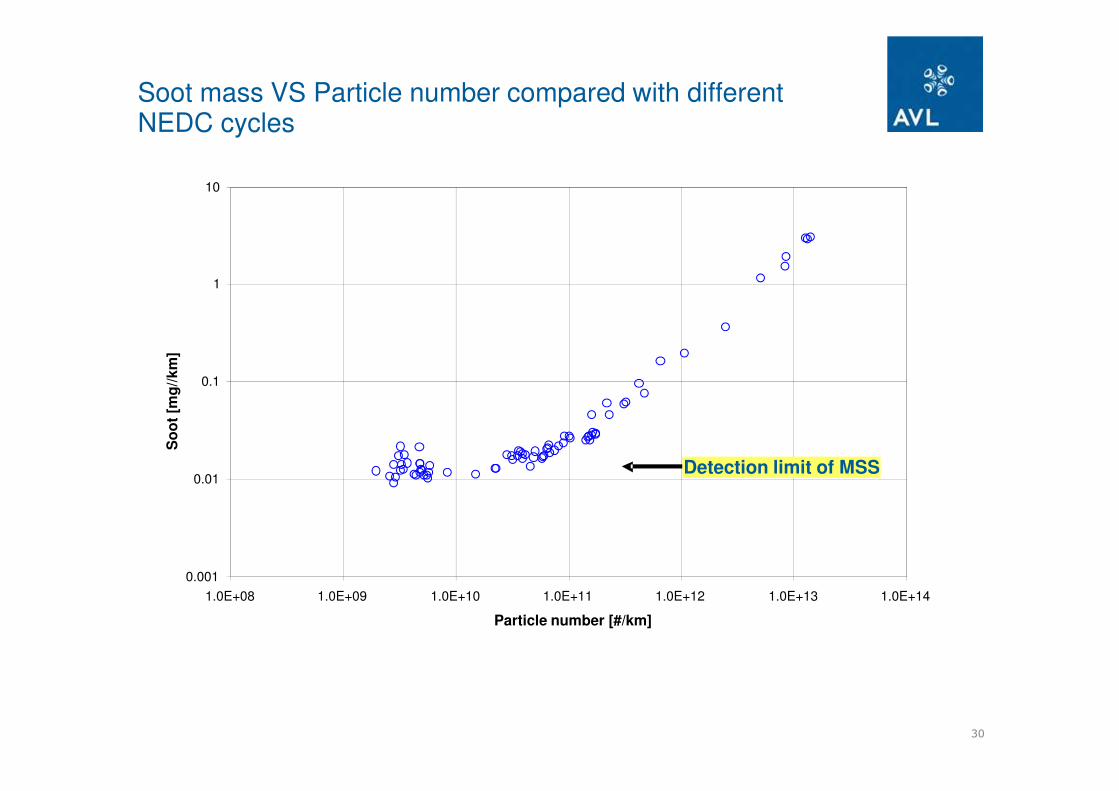
Detection limit of MSS
Soot mass VS Particle number compared with different NEDC cycles
31AVL P. Hollerer, VDI Forum Stuttgart 2010-12-07
Summary
EU 6 defines PN limits for GDI engines
Reaching this limits without particle filter is possible if proper hardware is used and
calibration is done
Proper measurement equipment is required in order to detect the low soot as well as the
number
- Soot measurement (R&D applications)
- Particle counting (for number of particles, legislative requirement)
Measurement technique needs to be combined with proper optimization methods
With intelligent application strategies EU 4 Hardware PM emissions can be already
majorly reduced
Comparison between number and soot mass exists