1statistics 741, chappell - spring 2012 rick chappell, ph.d. professor, department of biostatistics...
TRANSCRIPT

1 Statistics 741, Chappell - Spring 2012
Rick Chappell, Ph.D.Professor,Department of Biostatistics and Medical InformaticsDepartment of StatisticsUniversity of Wisconsin Madison
University of Wisconsin – MadisonDepartment of Biostatistics and Medical Informatics
Defining Biochemical Recurrence inProstate Cancer

2 Statistics 741, Chappell - Spring 2012
I. Obviously Dependent Censoring“Retiring to Arizona” or “Going back to the farm”
II. Dependent Administrative CensoringInduced by time trends
III. The ASTRO Definition of Biochemical Recurrence in Prostate Cancer
IV. Why Backdating is a Problem
And many comments on it
IV. Conclusions
Outline

3 Statistics 741, Chappell - Spring 2012
I. Obviously Dependent Censoring
Consider a simple situation without censoring:
x
x
x
xTime

4 Statistics 741, Chappell - Spring 2012
The K-M curve is the empirical CDF:
x
x
x
x
1
0
Time

5 Statistics 741, Chappell - Spring 2012
If the healthiest in terms of remaining life are selectively censored (negatively dependent censoring) then the K-M curve is biased downward:
x
x
O
O
1
0
x
xTime

6 Statistics 741, Chappell - Spring 2012
If the sickest are selectively censored (positively dependent censoring) then the K-M curve is biased upward:
x
x
x
x
1
0
o
oTime

7 Statistics 741, Chappell - Spring 2012
II. Dependent Administrative Censoring
Even when the sole source of censoring is administrative (event hasn’t yet occurred at the time of analysis), it can be dependent with failure time.
Pointed out by Kaplan & Meier (1958), credited to Sartwell and Merrell (1952), Am. J. Pub. Health 42, “Influence of the dynamic character of chronic disease on the interpretation of morbidity rates”.

“For example, in a study of survival after an operation, a change in surgical technique five years before the data are analyzed will affect the survival times only of those with observation limit less than five years [p. 470].”
Consider an extreme example:
1980 200 accrued 50% failure in 1981
1983 2000 accrued 50% failure in 1986
The rest are cured. An analysis is performed in 1995.

0 years 5
0 years 5
0 years 5
K-M estimate for 1980 cohortof 200 analyzed in 1985
K-M estimate for 1983 cohortof 2000 analyzed in 1985
K-M estimate for combined sampleof 2200 analyzed in 1985
1
.5
0
1
.5
0
1
.5
0
+
=

10 Statistics 741, Chappell - Spring 2012
Thus, even though the long-term failure rate in both cohorts is 50%, the K-M curve remains near 100%.
This is not a sample-size issue: the confidence intervals for the previous example are narrow (and can be made arbitrarily narrower by choosing higher sample sizes).
Note that censoring is solely administrative.

11 Statistics 741, Chappell - Spring 2012
III. The ASTRO Definition of Biochemical Failure (BF) in Prostate Cancer
The American Society for Therapeutic Radiology and Oncology consensus statement on guidelines for PSA following radiation therapy (1997):
“Three consecutive rises in prostate-specific antigen (PSA) after reaching the PSA nadir constitute BF. The date of failure is the midpoint between the nadir and the first of the three consecutive rises in PSA.”
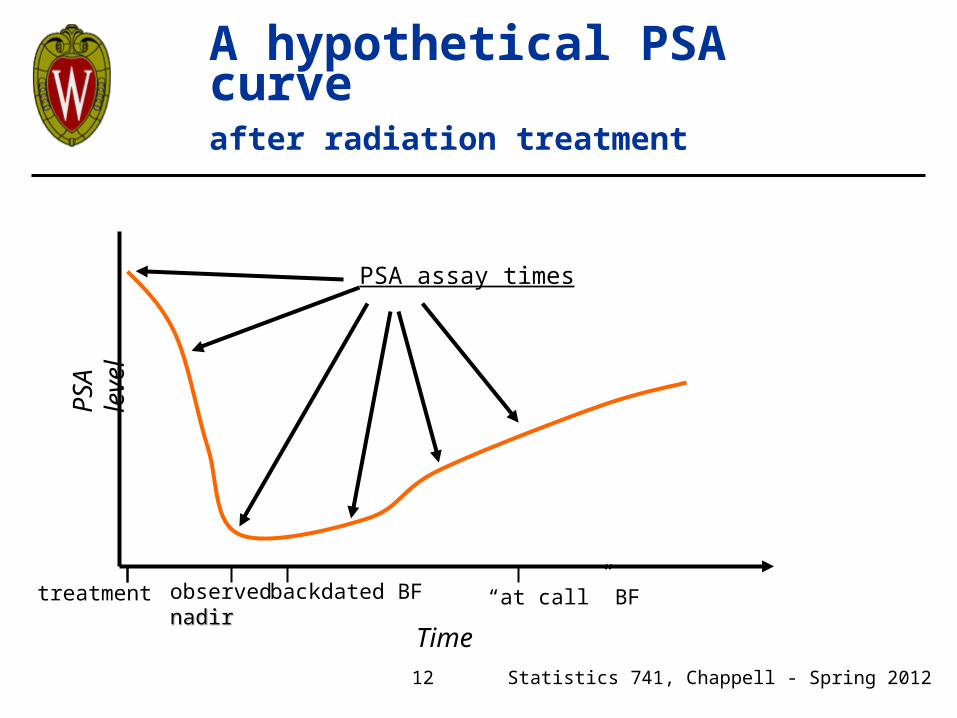
12 Statistics 741, Chappell - Spring 2012
A hypothetical PSA curveafter radiation treatment
PS
A
leve
l
PSA assay times
treatment observednadirnadir
backdated BF “at call” BF
Time

13 Statistics 741, Chappell - Spring 2012
IV. Why Backdating is a Problem
Problems with definition quickly noticed by Vicini et al., attributed to inadequate followup.
They examined a series of prostate cancer patients treated with radiation and followed for up to 12 years.
They artificially censored patients at a range of followups, recalculated backdated BF times, and plotted K-M curves.

Vicini, F.A., Kestin, L.L., and Martinez, A.A. The importance of adequatefollow-up in defining treatment success after external beam irradiation forprostate cancer. IJROBP 1999; 45:553-561.

15 Statistics 741, Chappell - Spring 2012
Their conclusion: need more followup – at least 5, preferably 10 years.
Vicini and others recommended that most or all patients be followed “at least beyond the time point at which actuarial results are examined”.
This is problematic considering the lengthy progress of the disease, frail patient population.
Also, even in Vicini’s results, the actuarial curves start to be biased even before attempted followup (see plot).

16 Statistics 741, Chappell - Spring 2012
Subsequent comments:
One proposed solution was to also back-date the censoring times. But if there were no rises in PSA, to when
would the censoring be backdated? How would this curve be comparable to
others, which are usually “at call”?
17 Statistics 741, Chappell - Spring 2012
Subsequent comments (cont.):
The backdated definition is said to have high sensitivity. But backdating can move the BF date from
after the CF to before if CF occurs between the nadir and the third rise.
Thus the “sensitivity” is to CF events which occur before the BF is determined (see slide 12).
Even so, Thames (2003) found on-call definitions with superior sensitivity.
18 Statistics 741, Chappell - Spring 2012
Subsequent comments (cont.):
The fundamental statistical problem: When, for a failure to be observed at time t,
followup to about t + 2 years is required, we know that followup and failure are dependent; usually, given failure at t, we know nothing of further followup.
As with the previous two examples, dependent censoring biases the K-M curve.

19 Statistics 741, Chappell - Spring 2012
Other remarks:
Two purposes for predicting CF:1) To determine in a clinical trial whether a patient
relapsed; and
2) To plan therapy for a patient.• For the first, the entire patient history is
relevant. E.g., suppose a patient had 3 rises in PSA then a decrease, followed by 10 years all clear? He shouldn’t be said to relapse.
• For the second, only current information can be used. A patient with 3 rises might well be given salvage therapy.

20 Statistics 741, Chappell - Spring 2012
Other remarks (cont.):
For each purpose, timing is important (but presently ignored). E.g.,
Is it useful to detect a CF in two months?
Not very, because CF would have been detected anyway and treatment not delayed much.
Is it useful to detect a CF in ten years?
Perhaps not, because that CF might not be important to the patient. Its prevention may not be worth additional treatment.
When is it useful to predict a CF?

21 Statistics 741, Chappell - Spring 2012
Subsequent comments (cont.):
Taylor (see Wang and Taylor, 2001 for an application to AIDS) has jointly modeled PSA and CF in order to obtain the best prediction possible at any given time in a patient’s history.
For treatment purposes, a complex model yielding a probability of CF by (say) 3 years seems best, but results in a “black box” definition of biochemical failure.

22 Statistics 741, Chappell - Spring 2012
V. Conclusions
Prognostic methods for prostate cancer can be improved upon and may depend upon their purpose.
Dependent censoring produces bias, avoidable only by complete
Even a large sample size can’t correct the problem.

23 Statistics 741, Chappell - Spring 2012
V. Conclusions
Prognostic methods for prostate cancer can be improved upon and may depend upon their purpose.
Dependent censoring produces bias, avoidable only by complete
Even a large sample size can’t correct the problem.
If this is so obvious, why have thousands of patients been enrolled on trials with backdated endpoints?