1 rick chappell professor department of statistics and department of biostatistics and medical...
TRANSCRIPT

1
Rick ChappellProfessor
Department of Statistics andDepartment of Biostatistics and Medical
InformaticsUniversity of Wisconsin
University of Wisconsin – Madison
Non-inferiority trialsStat 641 – Fall 2010
2
I. Definition of Equivalence Trials with a Motivating Example II. Specifying the Null Hypothesis III. Consequences of the Choice
IV. Consequences of not Trying to Find an Effect
Outline

3
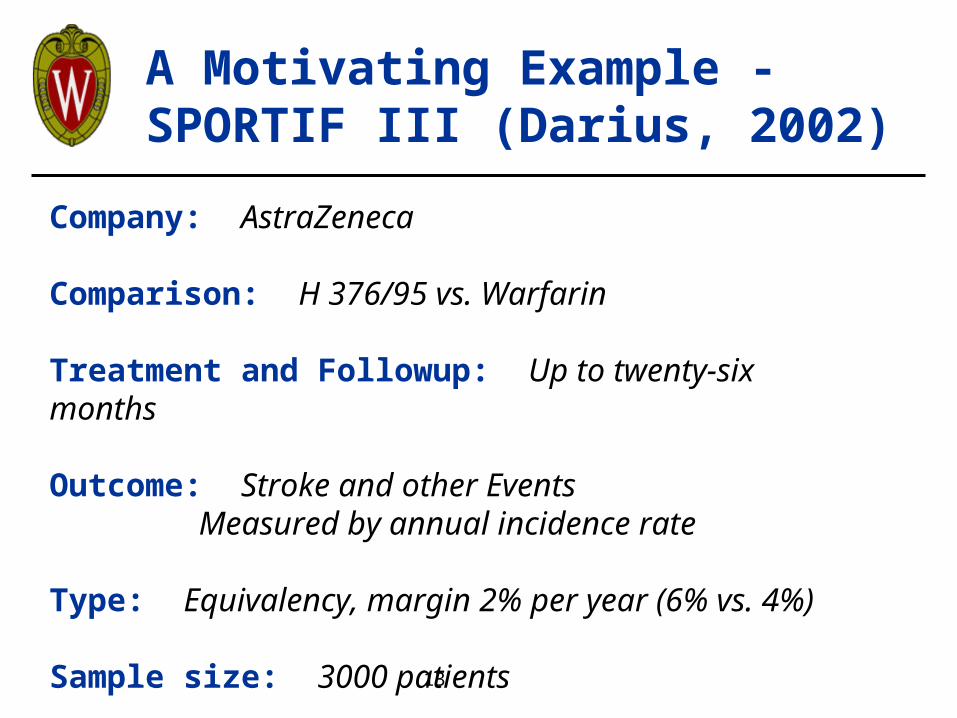
Company: AstraZeneca
Comparison: H 376/95 (Ximelagatran) vs. Warfarin
Treatment and Followup: Up to twenty-six months
Outcome: Stroke and other Events Measured by annual incidence rate
Type: Equivalency, margin 2% per year (6% vs. 4%)
Sample size: 3000 patients
I. A Motivating Example - SPORTIF III (Darius, 2002)
4
Consider treatment rate T and control rate C: • A Superiority Trial examines the treatment effect C - T attempts to show it to be positive (when small values are good). • A higher sample size n yields more power to precisely estimate C – T and detect a difference in effects.
Definition of Equivalence Trial
5
• An Equivalence (non-inferiority, active control) Trial examines C – T and attempts to show it to be not too small.
• Naively, one can put a confidence interval on C - T and
claim success if it does contain 0. The chance of this is
maximized with lower n.
6
Require that trial limits margin to be greater than a "prespecified [negative] degree of inferiority"
[ICH E-3],
C – T > .
Temple and Ellenberg (2002) point out that this is a "not-too-much-inferiority trial".
Here also a higher n, by giving more precision toestimate C - T, raises the chance of success.
Solution
7
Another Thorny Consideration
+4%
BE
NE
FIT
0
DRUG 2DRUG 1
EQUIVALENT EQUIVALENT EQUIVALENT
Suppose you represent a drug manufacturer conducting a clinical trial and you know that the trial’s results would be used to help a future competitor show its drug to be noninferior to yours. Then the narrower your confidence intervals, the easier you make it for your competitor! You are motivated to make your results as imprecise as possible, while still permitting FDA approval.
8
II. Specifying the Null Hypothesis
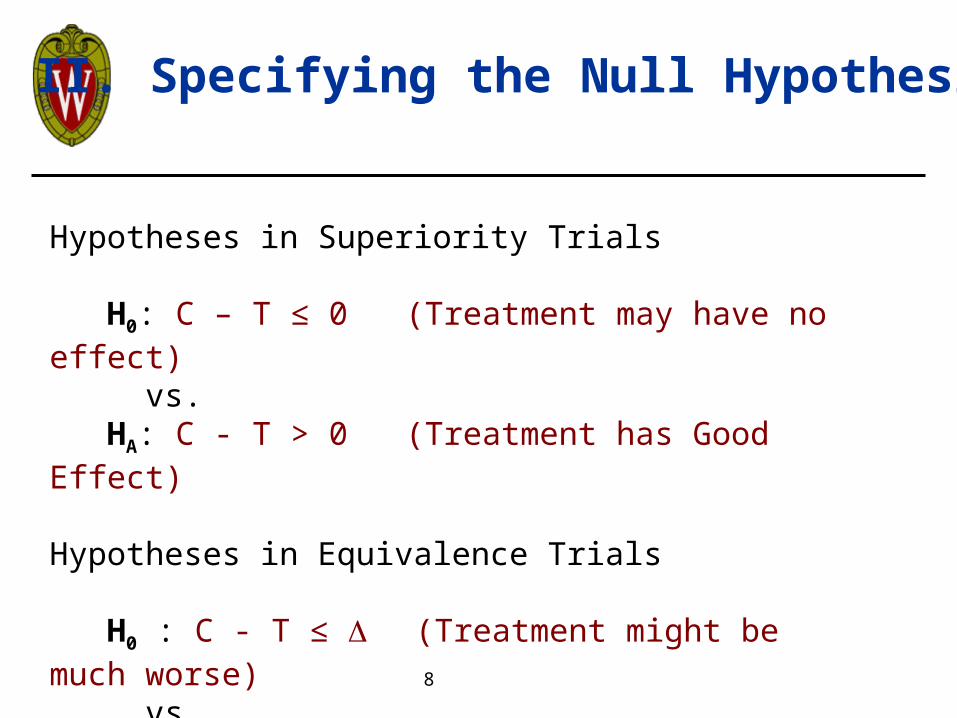
Hypotheses in Superiority Trials H0: C – T ≤ 0 (Treatment may have no effect) vs. HA: C - T > 0 (Treatment has Good Effect) Hypotheses in Equivalence Trials H0 : C - T ≤ (Treatment might be much worse) vs. HA : C – T > (Treatment isn’t much worse)
9
Ways Effects can be Defined for a Time-to-Event Trial
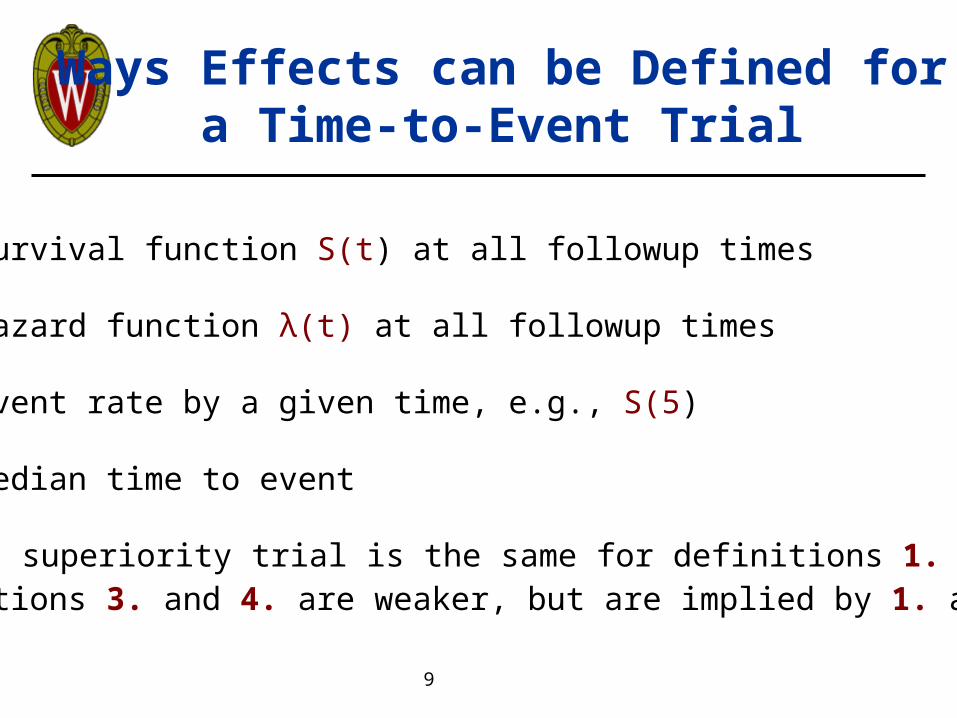
1. Survival function S(t) at all followup times 2. Hazard function λ(t) at all followup times 3. Event rate by a given time, e.g., S(5) 4. Median time to event H0 in a superiority trial is the same for definitions 1. and 2.Definitions 3. and 4. are weaker, but are implied by 1. and 2.

10
"In Superiority Trials, all Null Hypotheses are the Same but allAlternatives are Different."
- Tolstoy?
11
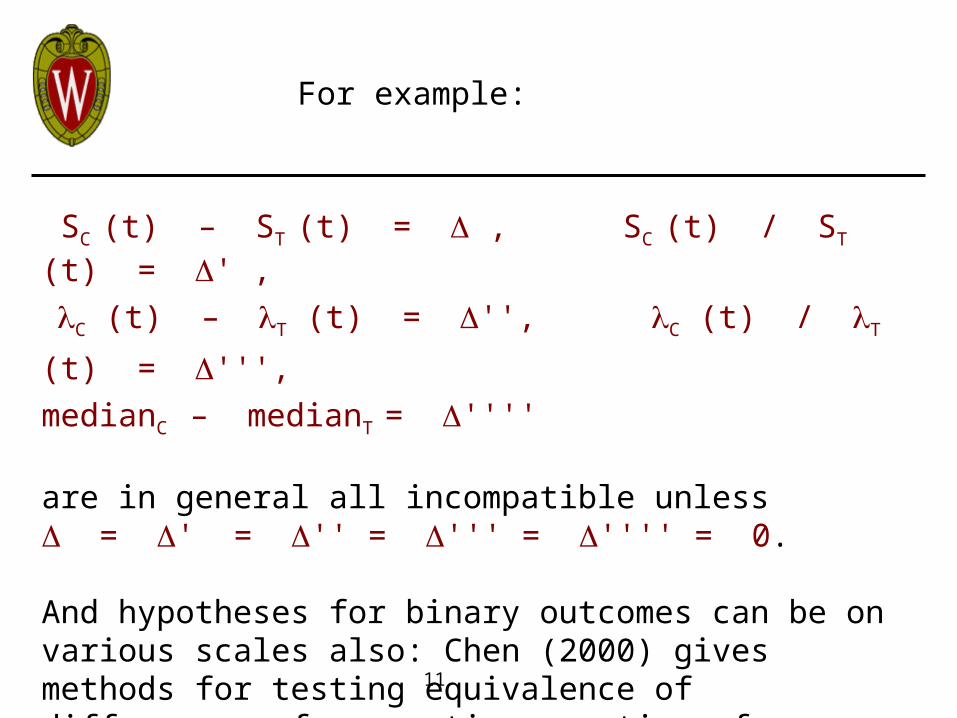
SC (t) – ST (t) = , SC (t) / ST (t) = ' ,
C (t) – T (t) = '', C (t) / T (t) = ''',
medianC – medianT = '''' are in general all incompatible unless = ' = '' = ''' = '''' = 0.
And hypotheses for binary outcomes can be on various scales also: Chen (2000) gives methods for testing equivalence of differences of proportions, ratios of proportions, and odds ratios.
For example:
12
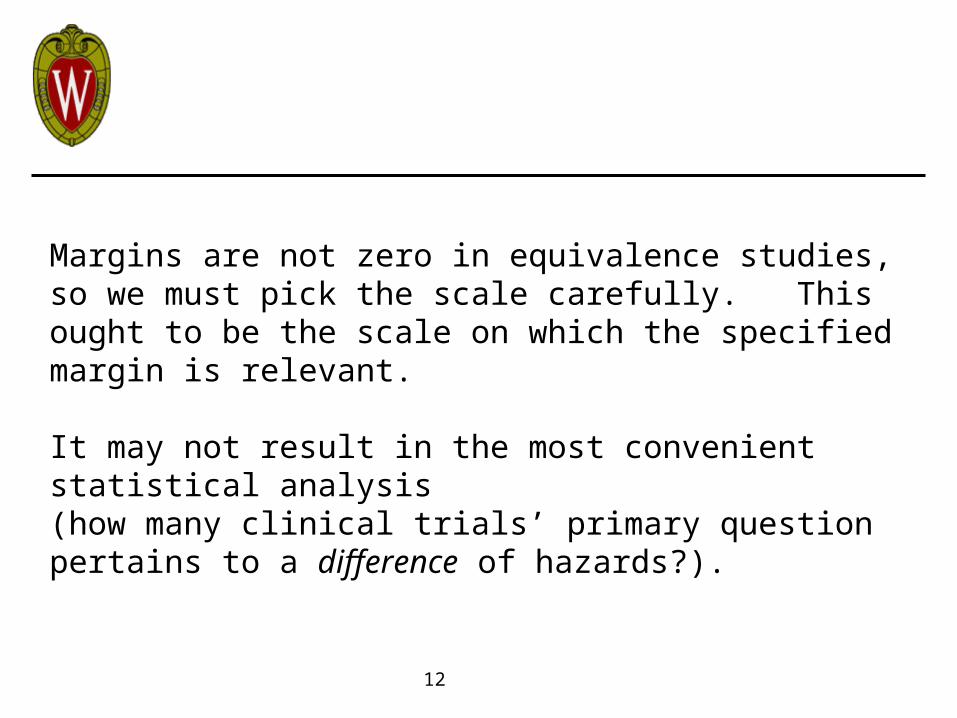
Margins are not zero in equivalence studies, so we must pick the scale carefully. This ought to be the scale on which the specified margin is relevant.
It may not result in the most convenient statistical analysis(how many clinical trials’ primary question pertains to a difference of hazards?).
13
Company: AstraZeneca
Comparison: H 376/95 vs. Warfarin
Treatment and Followup: Up to twenty-six months
Outcome: Stroke and other Events Measured by annual incidence rate
Type: Equivalency, margin 2% per year (6% vs. 4%)
Sample size: 3000 patients
A Motivating Example - SPORTIF III (Darius, 2002)
14
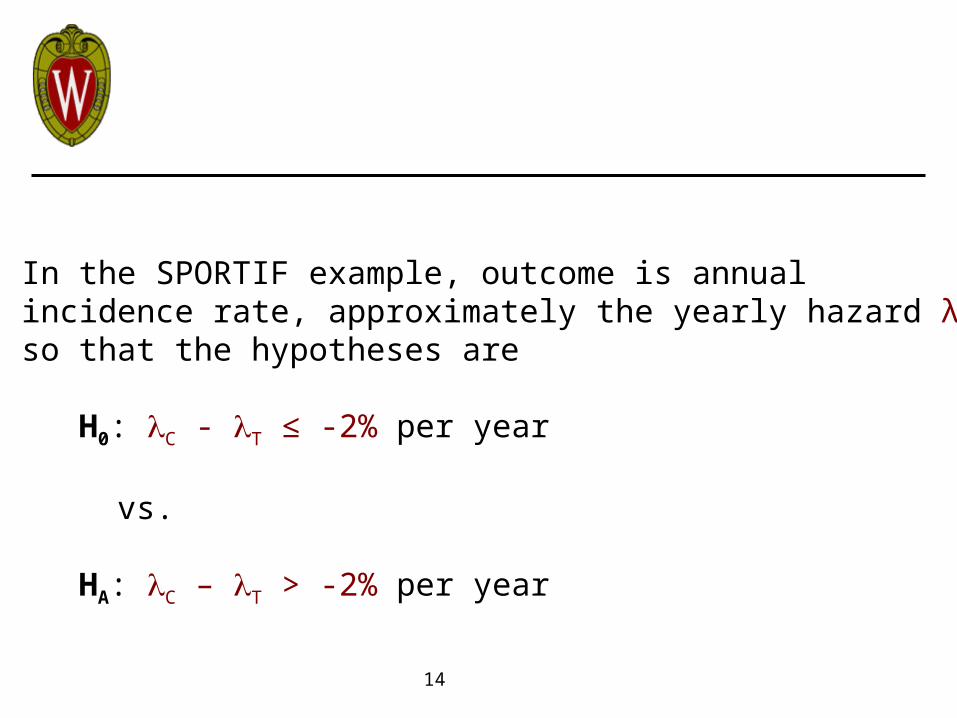
In the SPORTIF example, outcome is annual incidence rate, approximately the yearly hazard λ,so that the hypotheses are H0: C - T ≤ -2% per year
vs.
HA: C – T > -2% per year
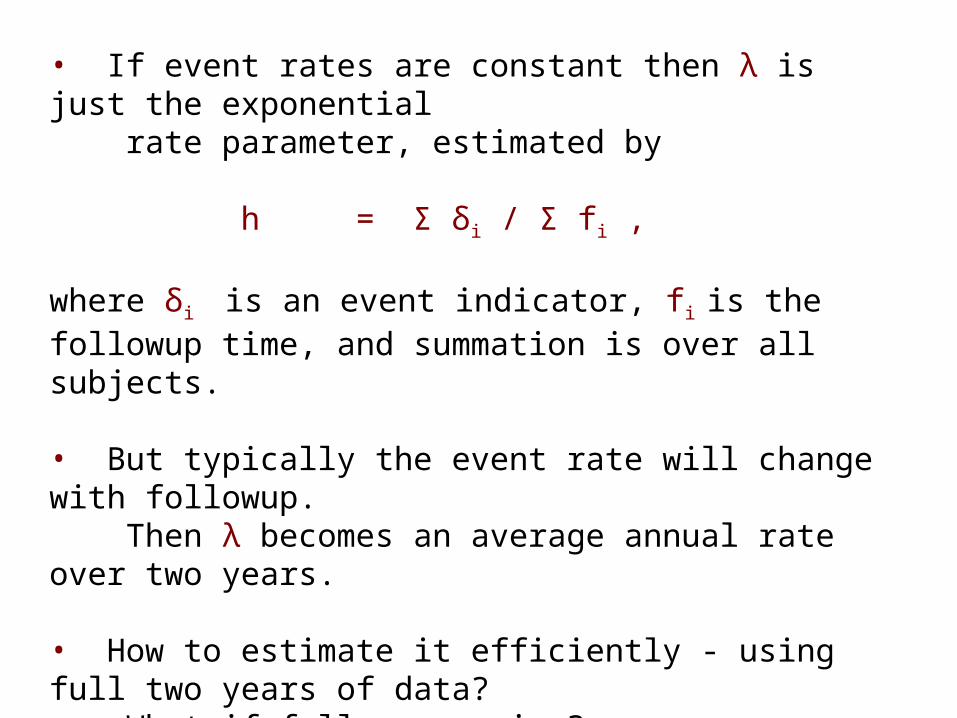
• If event rates are constant then λ is just the exponential rate parameter, estimated by h = Σ δi / Σ fi ,
where δi is an event indicator, fi is the followup time, and summation is over all subjects. • But typically the event rate will change with followup. Then λ becomes an average annual rate over two years. • How to estimate it efficiently - using full two years of data? What if followup varies? • How to estimate it robustly - not assuming any parametric distribution?
16
III. Consequences of the Choice(s)
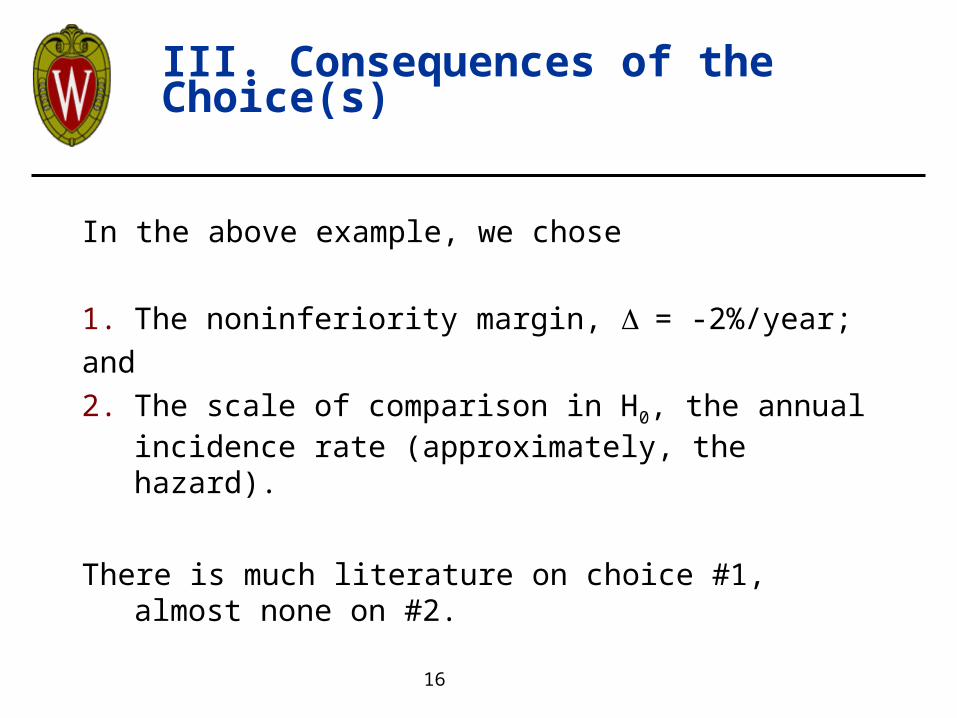
In the above example, we chose
1. The noninferiority margin, = -2%/year;
and
2. The scale of comparison in H0, the annual incidence rate (approximately, the hazard).
There is much literature on choice #1, almost none on #2.
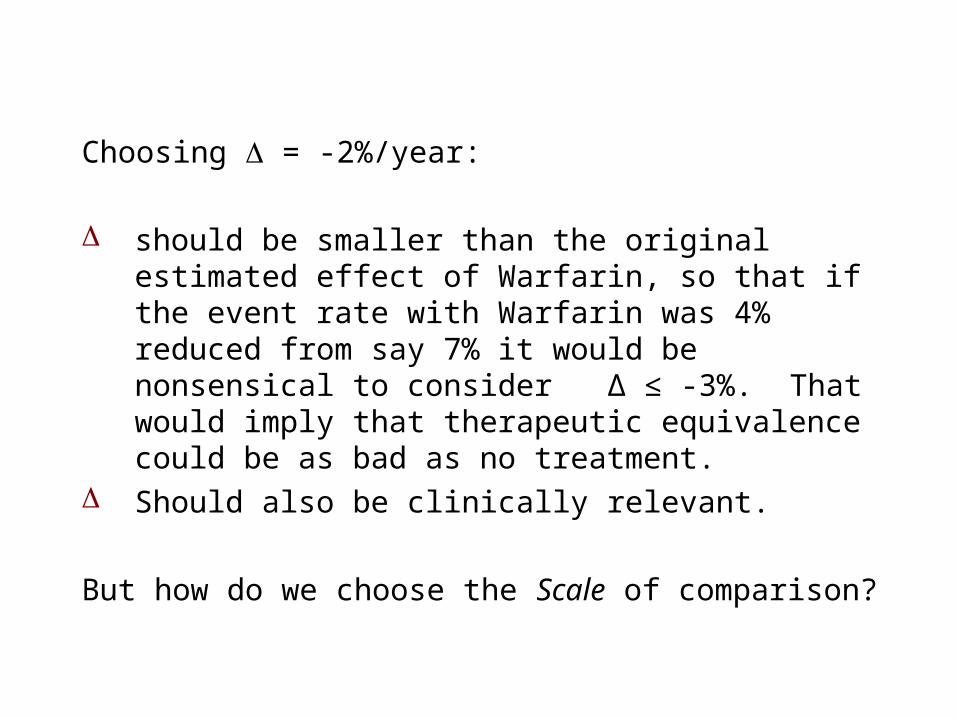
Choosing = -2%/year:
should be smaller than the original estimated effect of Warfarin, so that if the event rate with Warfarin was 4% reduced from say 7% it would be nonsensical to consider Δ ≤ -3%. That would imply that therapeutic equivalence could be as bad as no treatment.
Should also be clinically relevant.
But how do we choose the Scale of comparison?
18
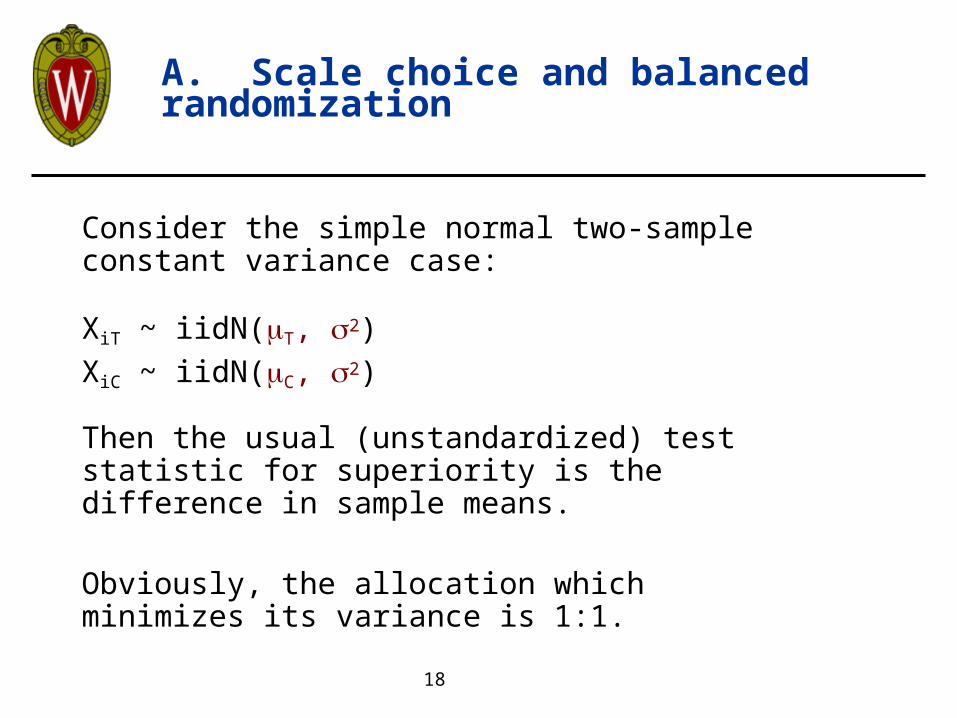
A. Scale choice and balanced randomization
Consider the simple normal two-sample constant variance case:
XiT ~ iidN(T, 2)
XiC ~ iidN(C, 2)
Then the usual (unstandardized) test statistic for superiority is the difference in sample means.
Obviously, the allocation which minimizes its variance is 1:1.
19
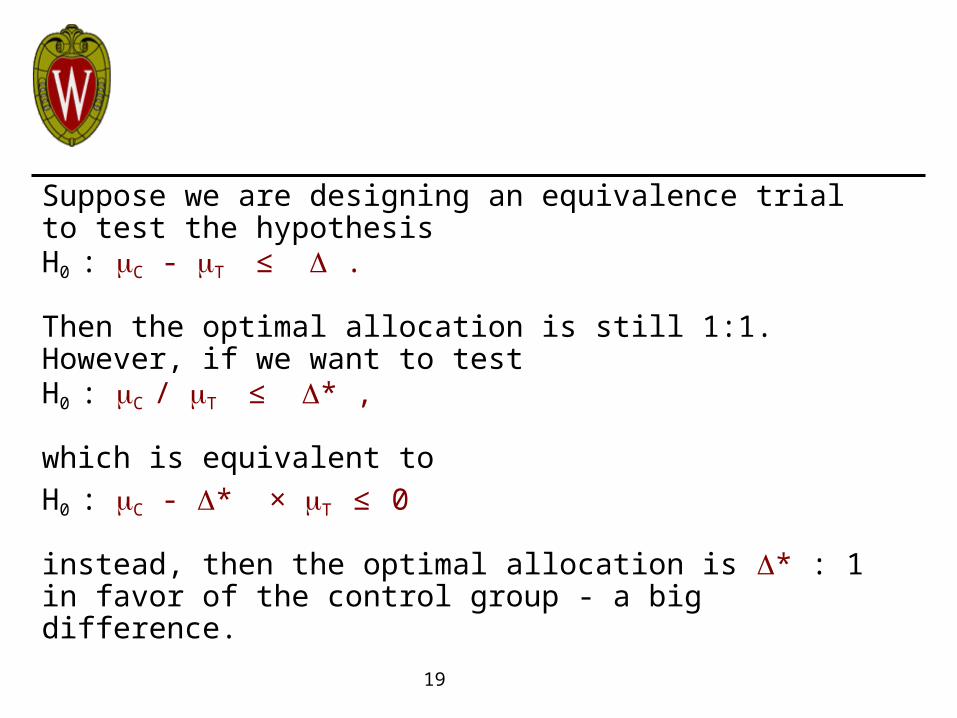
Suppose we are designing an equivalence trial to test the hypothesisH0 : C - T ≤ .
Then the optimal allocation is still 1:1. However, if we want to testH0 : C / T ≤ * ,
which is equivalent to
H0 : C - * × T ≤ 0
instead, then the optimal allocation is * : 1 in favor of the control group - a big difference.
20
Suppose we are designing an equivalence trial to test the hypothesisH0 : C - T ≤ .
Then the optimal allocation is still 1:1.
This statement is false if C and T are probabilities, even if we are dealing with additive noninferiority. Sample proportions’ variances differ under H0 .
21
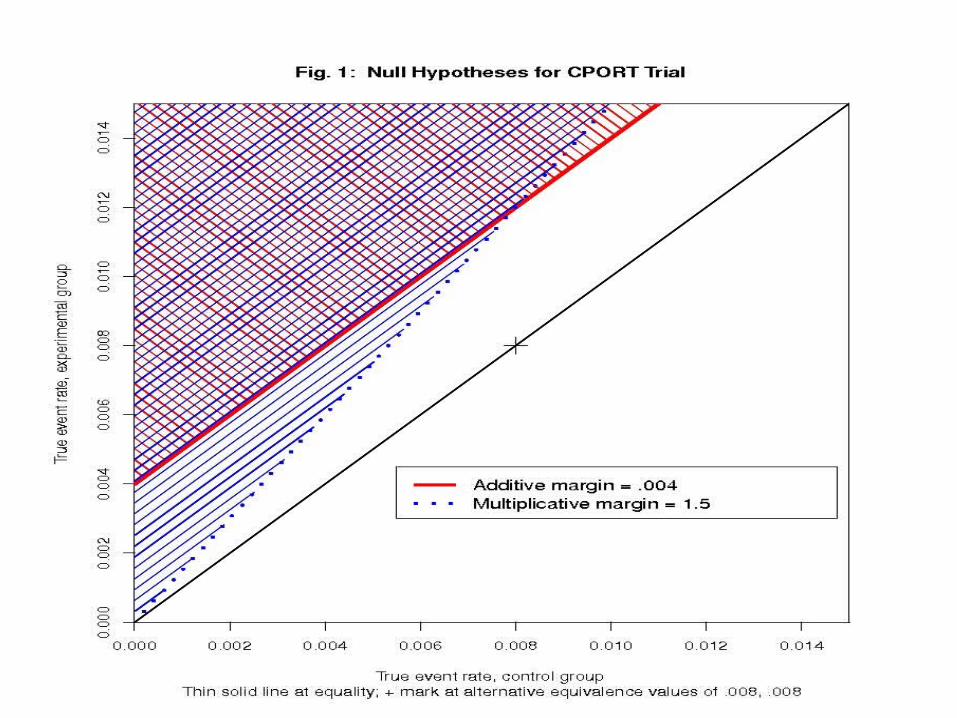
B. Scale choice and power
Suppose, in a trial (percutaneous coronary intervention, PCI) with binary “failure” outcome, we are deciding between the null hypothesis of additive inferiority
H0: C - T ≥ -.004
and that of multiplicative inferiority
H0: C / T ≥ 2/3.
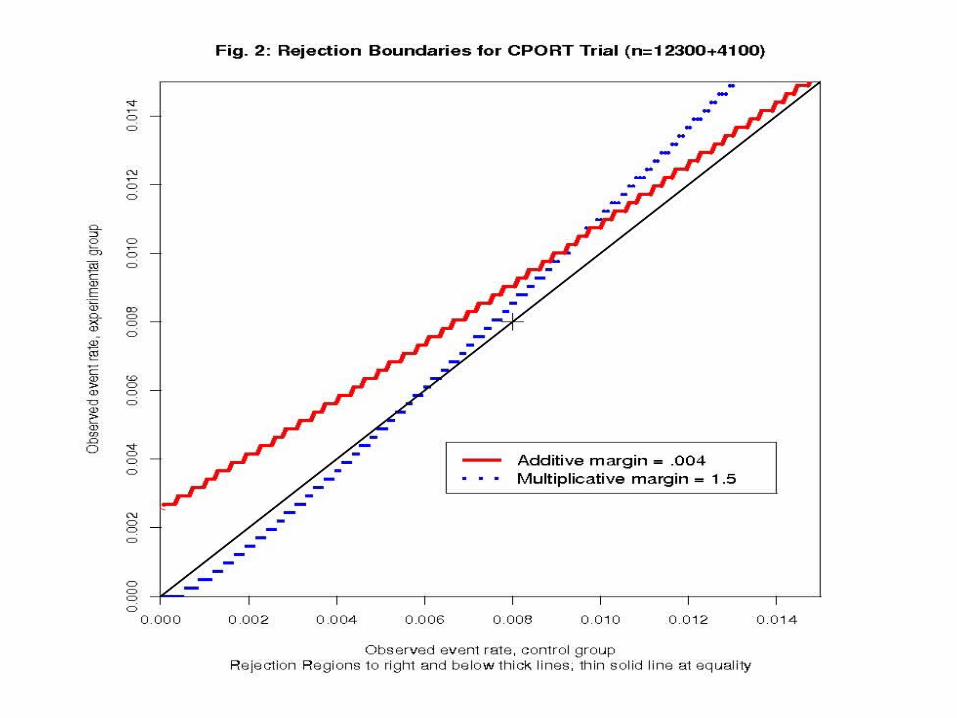
These are identical at C = .008. Should power be the same for the common alternative
HA: T = C = .008?
24
Answer: no (surprisingly, to me and the trial’s principal investigator).
For proportions less than .01, the range in which we are interested, the hypothesis of multiplicative noninferiority is much more demanding and requires a larger sample size:
About 21,000 instead of 14,000!
25
An Unusual Choice of Scale for the Sake of Clinical Relevance
We may be interested in equivalence on differentscales depending on the parameter’s size. For example, consider a trial with a binary outcome whose rates in two groups are p1 and p2 . We might be interested in their difference for small p1 or their ratio for large p1.
If so, we could have a pair of mixed hypotheses:
26
π* if pΔp p
π* if pΔp:pH
1212
11120
π* if pΔp p
π* if pΔppH
1212
1112A :
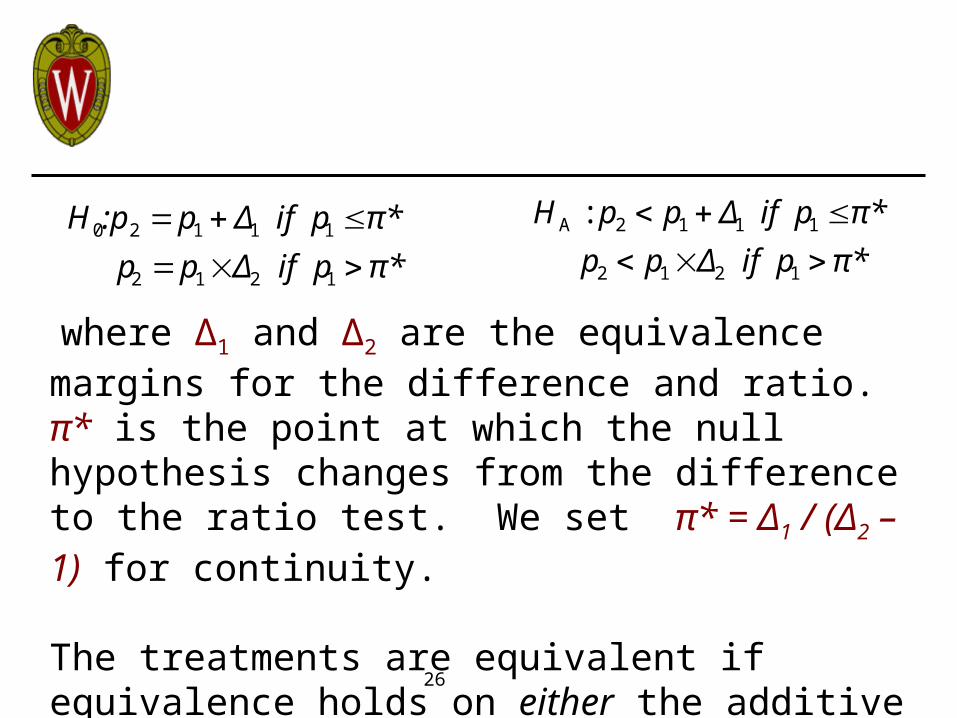
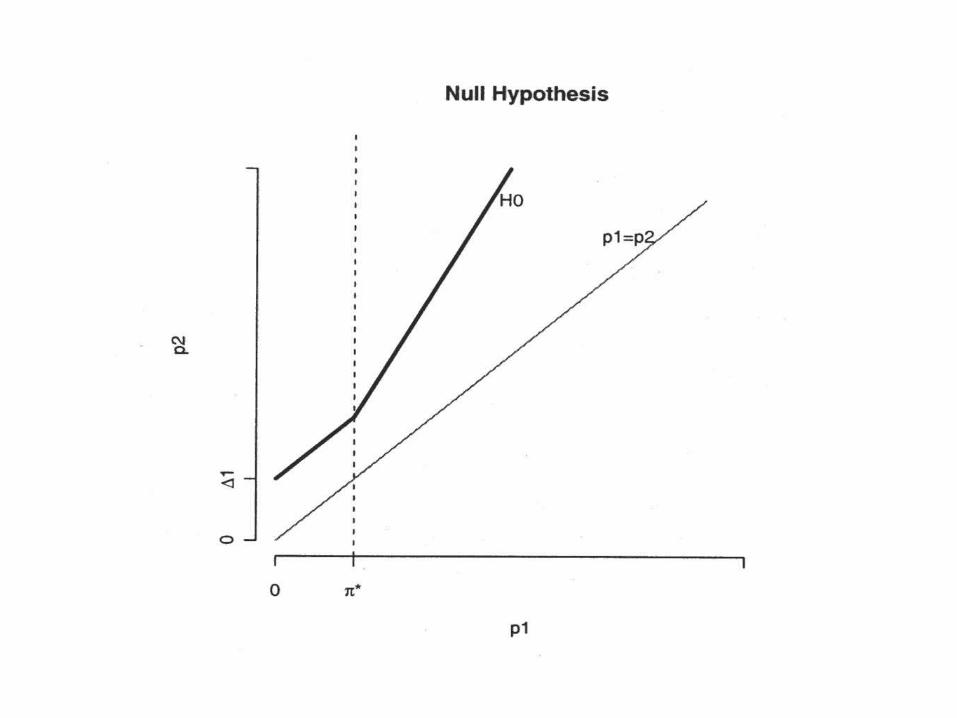
where Δ1 and Δ2 are the equivalence margins for the difference and ratio. π* is the point at which the null hypothesis changes from the difference to the ratio test. We set π* = Δ1 / (Δ2 – 1) for continuity.
The treatments are equivalent if equivalence holds on either the additive or multiplicative scale. Alternatively, we could require both to hold.
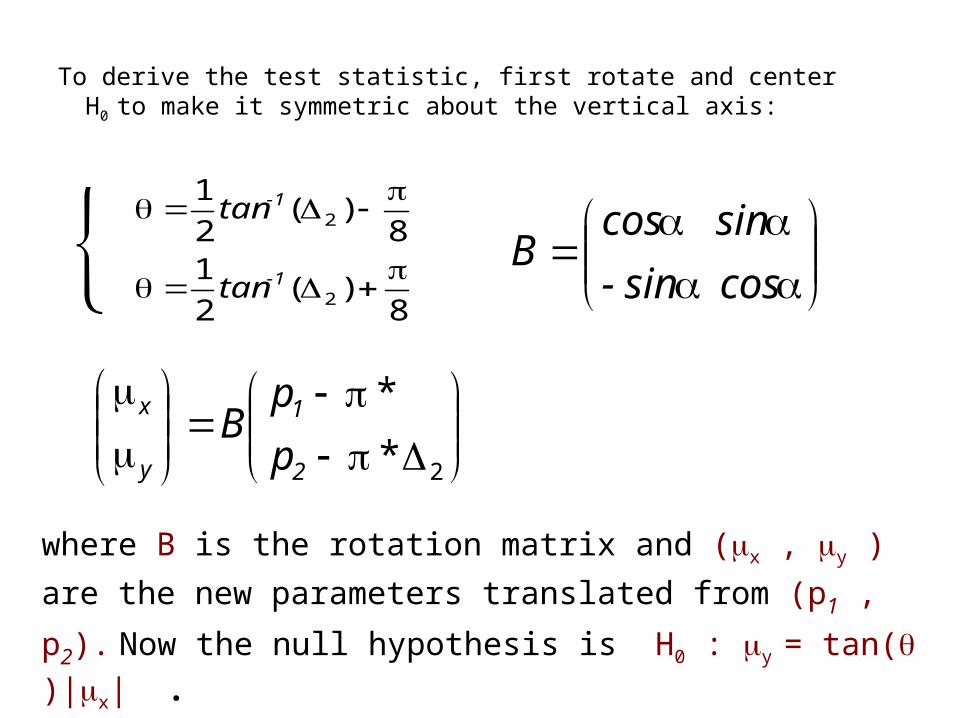
To derive the test statistic, first rotate and center H0 to make it symmetric about the vertical axis:
82
182
1
2
2
)(
)(
1-
1-
tan
tan
cos sin-
sincosB
2*
*
2
1
y
x
p
pB
where B is the rotation matrix and (x , y ) are the new
parameters translated from (p1 , p2). Now the null hypothesis
is H0 : y = tan( )|x| .
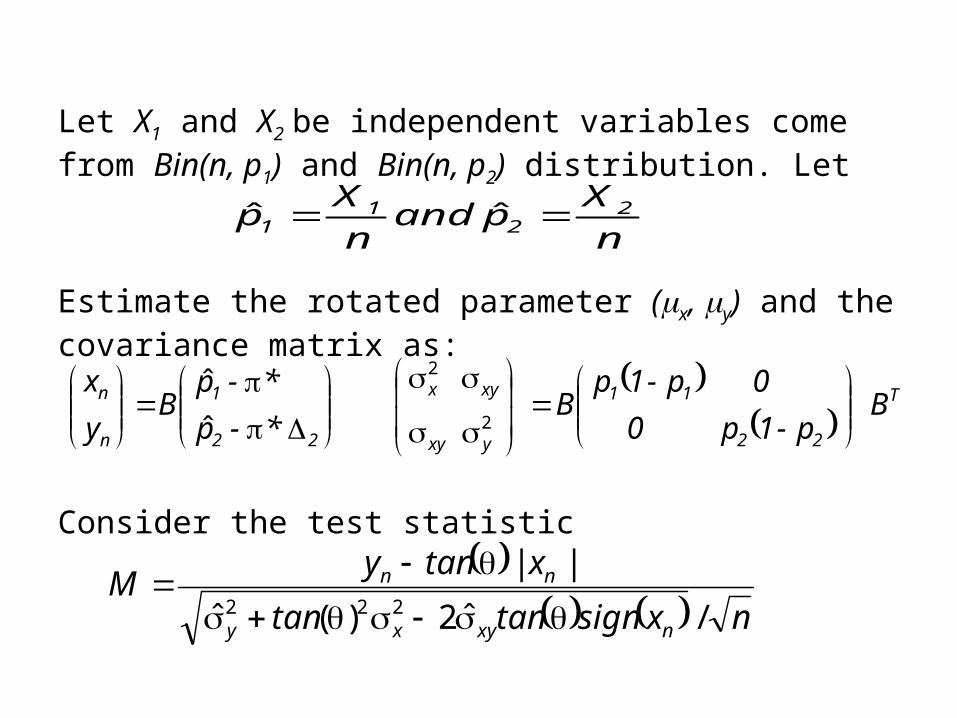
Let X1 and X2 be independent variables come from Bin(n, p1) and Bin(n, p2) distribution. Let
Estimate the rotated parameter (x, y) and the covariance matrix as:
Consider the test statistic
n
Xp and
n
Xp 2
21
1 ˆˆ
B
p-1p 0
0 p-1pB
*-p
*-pB
y
x T
22
11
yxy
xyx
22
1
n
n
2
2
ˆ
ˆ
nxsigntantan
xtanyM
nxyxy
nn
/ˆ)(ˆ
||
2222

30
M converges to the standard normal distribution at all differentiable points of H0.
At points far from π* , M is equivalent to statistics from the relevant difference or normal test.
But at π* , M is converges to a mixture of normal and half-normal distributions. This can be shown by deriving results for a hyperbolic H0 and letting the hyperbola converge to a bent line.
31
Leads to questions about other notions of quality in clinical trials besides sample size:
- noncompliance
- drug impurity
- loss to follow-up
- enrollment of ineligibles
- other protocol violations
V. Consequences of “Not Trying to Find an Effect”
32
However, they have fundamentally different effects depending on the type of study they afflict: • In Superiority Trials conducted with proper randomization and blinding, these violations degrade the treatment effect C - T and are thus conservative: they bias results towards a conclusion of no effect. • In Equivalence Trials, even with proper randomization and blinding, these violations can degrade the treatment effect and are thus anti-conservative: they can bias results towards a conclusion of equivalence.
Obviously we want to minimize protocol violations in all trials.

33
"No participants should be withdrawn from the analysis due to lack of adherence. The price to be paid is a possible decrease in power." - Friedman, Furberg and DeMets, referring to superiority trials. General agreement, including in ICH guidelines: "An analysis using all available data should be carried out for all studies intended to establish efficacy" [ICH E-3].
Intent to Treat Revisited Is it still the ironclad standard for primary analysis?
34
“”Intent to Treat” Analysis in the
presence of noncompliance
• Has decreased power compared to situation with full compliance
and • Results in estimate of C - T biased towards 0 - conservative in superiority trials - anticonservative in equivalence trials
35
"As Treated" Analysis in the presence of noncompliance
• Also has decreased power compared to situation with full compliance:
and • Biases the estimate of C - T in an unknown fashion
- ? in superiority trials
- ? in equivalence trials

36
Stick to Intent to Treat in equivalence trials but
• Take Care to maximize quality of the data• Pay Attention to patterns of quality during the trial• Summarize aspects of quality in the report
Quality "Before, During and After”.
Recommendation:
37
ICH E-9 says that in an equivalence trial, the role of the full analysis (intent-to-treat) data set "should be considered very carefully." What percent of noncompliance is unacceptable?

• ICH E-10 states:"The trial should also be conducted with high quality (e.g., good compliance, few losses to follow-up)." • It also has useful advice:"The trial conduct should also adhere closely tothat of the historical trials." • That is, the design and patient population should be similarto previous trials used to determine evidence of sensitivity to drug effects.
• My conclusion:If noncompliance is less than that achieved in prior trials which showed efficacy, good. But if not, beware (same logic as in choice of Δ).
39
Other interesting problems:
We don’t just want to know if Ximelagatran is noninferior to Warfarin, we want to know if it “works” - if it is better than Placebo. We infer about:
Effect of Xi. vs. Pl. = Effect of Xi. Vs. Wa. +
Effect of Wa. Vs. Pl.
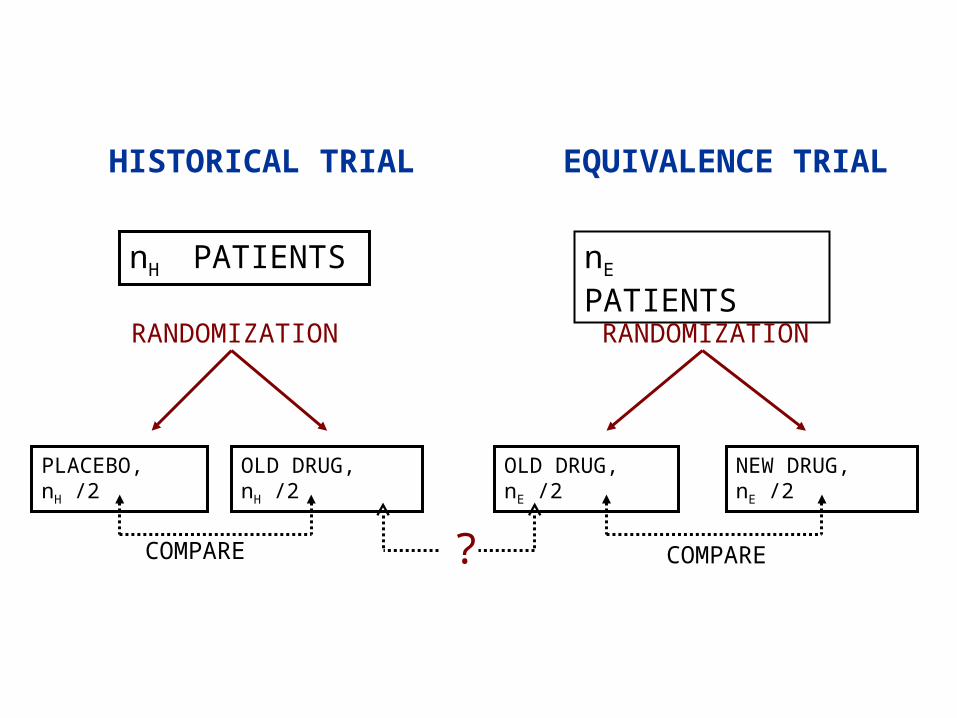
HISTORICAL TRIAL EQUIVALENCE TRIAL
nH PATIENTS nE PATIENTS
RANDOMIZATION RANDOMIZATION
PLACEBO, nH /2 OLD DRUG, nH /2 OLD DRUG, nE /2 NEW DRUG, nE /2
?COMPARE COMPARE
41
• Past trials give Historical Evidence of Sensitivity to Drug Effects (HESDE)
• HESDE is relevant only if populations in two trials are similar
Inference’s validity depends on randomization and comparison with past trial in order to estimate treatment effect without direct comparison with placebo
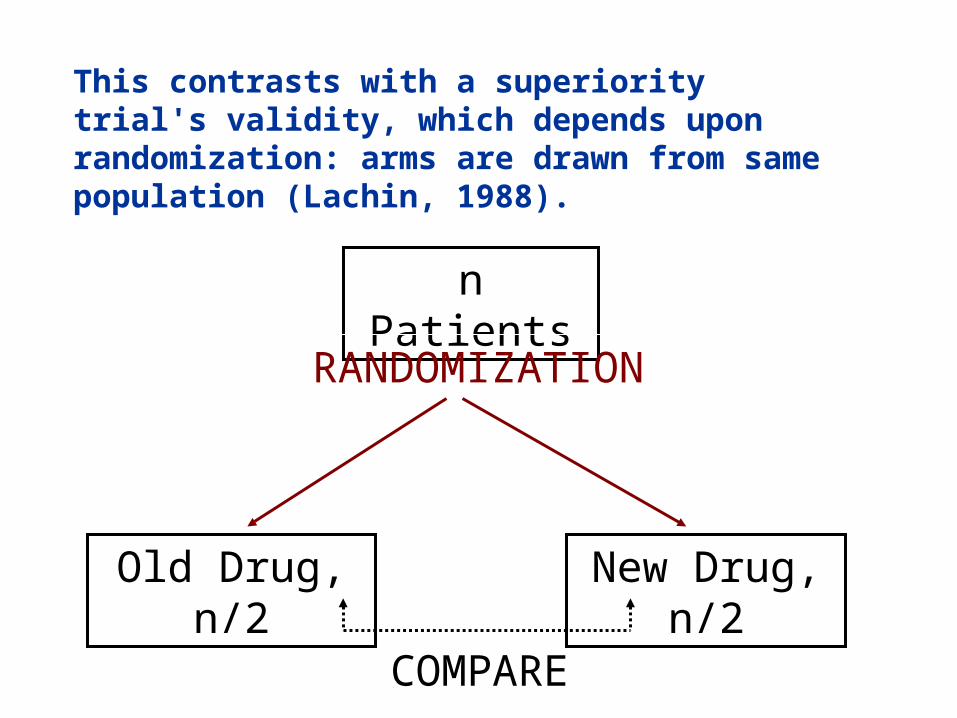
This contrasts with a superiority trial's validity, which depends upon randomization: arms are drawn from same population (Lachin, 1988).
n Patients
RANDOMIZATION
Old Drug, n/2 New Drug, n/2
COMPARE
43
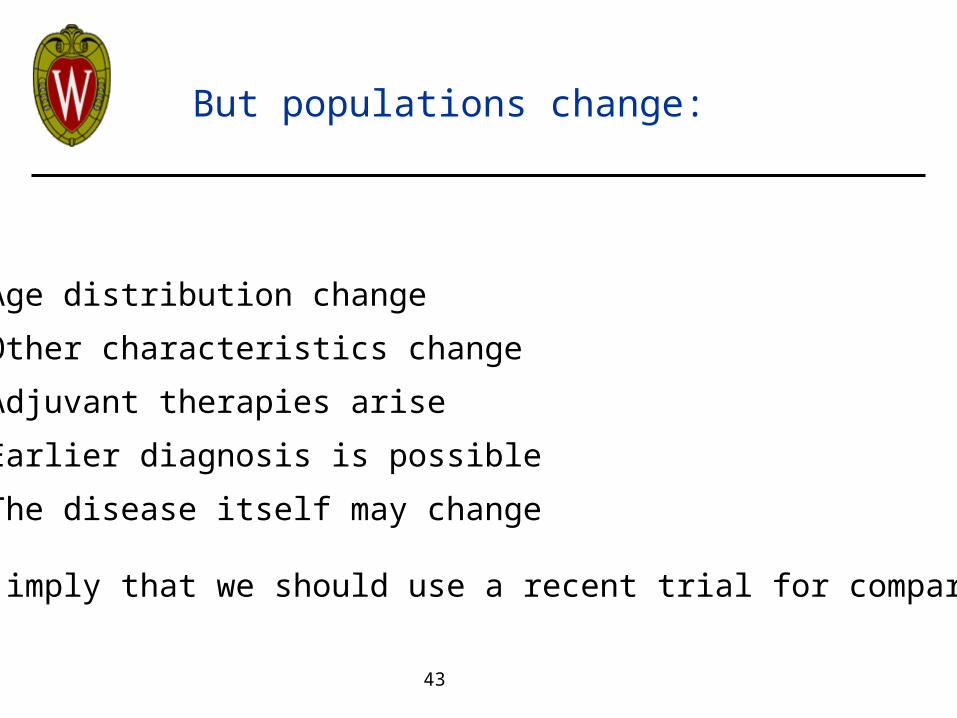
• Age distribution change
• Other characteristics change
• Adjuvant therapies arise
• Earlier diagnosis is possible
• The disease itself may change These imply that we should use a recent trial for comparison.
But populations change:
44
There is a problem with continuously comparing to the most recent trials: ”Equivalency Drift“ (referred to as “Bio-creep” in one FDA guidance).
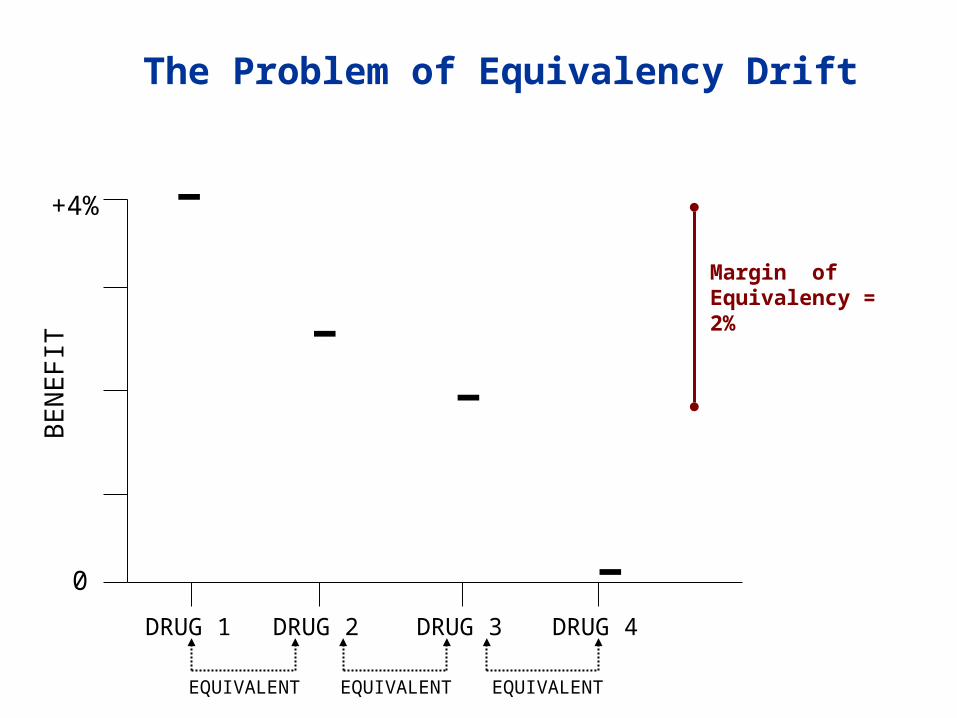
The Problem of Equivalency Drift
+4%
BE
NE
FIT
0
DRUG 2 DRUG 3 DRUG 4DRUG 1
EQUIVALENT EQUIVALENT EQUIVALENT
BE
NE
FIT
0
+4%
DRUG 1 DRUG 2 DRUG 3 DRUG 4
EQUIVALENT EQUIVALENT EQUIVALENT
Margin of Equivalency = 2%
-
--
-
46
One last (favorable!) consequence
+4%
BE
NE
FIT
0
DRUG 2DRUG 1
EQUIVALENT EQUIVALENT EQUIVALENT
Suppose we have multiple alternative hypotheses of equivalence and require them all to hold. Then the naïve individual testing approach is conservative.
47
References
Chen, J.J., Tsong, Y., and Kang, S. “Tests for equivalence or non-inferiority between two proportions. Drug Information Journal. 34, pp. 569-578 (2000).
Friedman, L.M., Furberg, C., and DeMets, D.L. Fundamentals of Clinical Trials, Springer-Verlag, New York (1998).
Halperin, J.L. “Ximelagatran compared with warfarin for prevention of thromboembolism in patients with nonvalvular atrial fibrillation: Rationale, objectives, and design of a pair of clinical studies and baseline patient characteristics (SPORTIF III and V).” Am. Heart J. 146, pp. 431-8 (2003).
International Conference on Harmonisation of Technical Requirements for Registration of Pharmaceuticals for Human Use. Guidances
E3: Structure and Content of Clinical Study Reports (1995);E9: Statistical Principles for Clinical Trials (1998); andE10: Choice of Control Group in Clinical Trials (2000).
http://www.ich.org/ich5e.html#ReportsLachin, J.M. "Statistical properties of randomization in clinical trials.“ Controlled Clinical Trials
9, pp. 289-311 (1988).Temple, R. and Ellenberg, SS. “Placebo-controlled trials and active-control trials in the
evaluation of new treatments. Part 1: ethical and scientific issues.” Annals of Internal Medicine 133, pp. 455-63 (2000).