1q2017 financial results
TRANSCRIPT

UNLOCKING THE POTENTIAL
OF OUR MARKETPLACE
1Q2017 Financial Results
26 April 2017
DRIVING
SUSTAINABILITYAND INCLUSIVENESS

AGENDA
2
KEY FINANCIAL HIGHLIGHTS
MARKET PERFORMANCE
MOVING FORWARD
APPENDICES

KEY FINANCIAL HIGHLIGHTS
HIGHLIGHTS FOR 1Q2017
OPERATING REVENUE
OPERATING EXPENSES
3

Highlights For 1Q2017Best 1st quarter financial performance since 2008
Financial Items 1Q2017
1Q2017
vs.
1Q2016
1Q2017
vs.
4Q2016
Operating Revenue (RM million) 134.7 6.8% 19.7%
Operating Expenses (RM million) 63.8 0.8% 16.5%
PATAMI (RM million) 56.6 13.4% 12.9%
EPS (sen) 10.6 14.0% 12.8%
Cost to Income Ratio 45% 2 percentage points 1 percentage point
Annualised ROE 26% 2 percentage points
Higher operating revenue due to increase in securities trading revenue.
Higher operating expenses mainly due to higher manpower cost and service fees.
1Q2017 vs. 1Q2016:
4

Increase in securities trading revenue mainly contributed by higher domestic institution
and retail trades.
Derivatives trading revenue decreased following the revision of guarantee fee rate to
0.3% p.a. imposed on margin on contracts’ open positions (2016: 0.5% p.a.).
Lower BSAS trading revenue resulting from lower trades due to competition.
126.1
126.1 142.6 137.4 132.8 132.8
136.2
1.9% 5.3% 134.7
+ 10.1 -1.3- 0.7
- 0.6 + 0.4+ 0.5 - 0.1 + 0.3
1Q2016 1Q2017
4.5%17.7%
(RM mil)
57.167.2
22.521.2
4.74.013.3
12.79.49.88.18.65.3
5.25.76.0
1Q2016 1Q2017
Total
RM134.7 mil
Securities Trading Revenue
Derivatives Trading Revenue
Listing & Issuer Services
Depository Services
7%
Market Data
Member Services & Connectivity
BSAS Trading Revenue
Total
RM126.1 mil
Operating RevenueGrowth contributed mainly by higher securities trading revenue
14.9%
Growth contribution by revenue streams:
4.3% 5.8%
Conference Fee & Exhibition
Related Income
6.2%
5

33.3 34.0
6.1 6.14.6 3.85.0 4.8
5.7 7.2
8.6 7.9
1Q2016 1Q2017
Total
RM63.3 mil
Total
RM63.8 mil
1%
Staff costs
Depreciation & amortisation
Marketing & development
IT maintenance
Service fees
Other operating expenses^
+ 0.7 - 0.8
- 0.2
+ 1.5
1Q2016 1Q2017
(RM mil)
4.0%
8.2%2.1%
Operating Expenses1Q2017 operating expenses increased marginally by 1%
Movement of expenses:
63.363.8
Note^ - Other operating expenses include building maintenance, administrative expenses and CDS expenses.
Staff costs increased due to the annual salary increment.
Increase in service fees due to higher number of derivatives contract traded and weaker
RM against USD.
Lower marketing and development expenses as certain initiatives will be carried out in
the following quarters.
Decrease in other operating expenses mainly due to lower building maintenance
expenses incurred.
17.4%
6
-0.7
26.3%

MARKET PERFORMANCE
SECURITIES MARKET OVERVIEW
DERIVATIVES MARKET OVERVIEW
ISLAMIC CAPITAL MARKET OVERVIEW
7

2925
34
Securities Market OverviewGlobal money flow into Asian equities led to higher trading activities
Average Daily Value (ADV)(RM mil) Market Capitalisation (RM bil) Fund Raised from New Listings &
Secondary Market (RM bil)
1,006 959
1,350
436288
544539
443
484
1Q2016 4Q2016 1Q2017
1,981
1,690
2,378
40.7%
20.0%
Velocity (%)
1,641.731,740.09
FBMKLCI
1,717.58
0.20.9
1.3
4.6 3.3
1Q2016 4Q2016 1Q2017
4.2
4.8
0.2
No. of New Listing
Fund raised from new listings
Fund raised from secondary market
ADV of Domestic Institutions
ADV of Retail
ADV of Foreign Institutions Market Capitalisation
2
4 4
180%
1.5
5.5%
31 Mar 2016 31 Mar 201731 Dec 2016
12.5%
8
8.0%
1,707
1,667 1,801

ADC of Crude Palm Oil Futures
Volatility of Crude Palm Oil Prices
Derivatives Market OverviewFCPO continues to drive growth in ADC
OthersADC of FBMKLCI Futures
Volatility of FBMKLCI
18%24% 21%
13%7% 7%
1Q2016 4Q2016 1Q2017
77%
23%
81%
19%
7.3%
44.5
13.1
44.5
10.6
57.9 55.3
Average Daily Contracts (ADC) (’000) & Volatility Open Interest (No. of contract)
85%
15%
12.3%
52.5
9.4
62.1
9
31 Dec 2016
237,232
31 Mar 2017
262,155
26 May 2016
337,267

Islamic Capital Market OverviewLower trades on BSAS due to competition from other providers
20.8 20.4 21.8
14.2
29.6 30.6
1Q2016 4Q2016 1Q2017
34.0
50.0
4.8%
52.4
16.2 12.6
13.6
2.5
3.23.8
1Q2016 4Q2016 1Q2017
18.7
15.8
10.1%
17.4
111
124 130
No. of Shariah Compliant
Stocks (%)No. of Trading Participants
Bursa Suq Al-Sila’ ADV (RM bil) Market Capitalisation of Shariah
Compliant Stocks (RM bil)
No. of Sukuk
Value of Listed Sukuk (USD bil)
74% 74% 74%22
24 25
7.0%54.1%
Domestic Foreign Market Capitalisation of Shariah
Compliant StocksADV of Domestic participants
ADV of Foreign participants
1,214
1,050
1,123
31 Mar 2016 31 Mar 201731 Dec 2016
7.0%
7.5%
10

MOVING FORWARD
MOVING FORWARD
11

Bursa Malaysia will continue with its initiatives in creating a vibrant and sustainable Malaysian
capital market. The focus is on improving the market ecosystem and investor’s experience. Efforts
will also be intensified in developing new products and services, in line with the aim to diversify
reliance on trading income. The outlook for the three markets are outlined below:
SECURITIES MARKET• The performance in Securities Market is forecasted to continue with the expected improvements
in the global as well as domestic economic conditions.
DERIVATIVES MARKET• Uncertain weather conditions and volatile crude oil prices continued to underpin trading of FCPO
contracts, while FKLI trading is very much correlated to movements in FBMKLCI.
• Activities are expected to be influenced by the need to manage portfolio risk and volatility in
commodity prices and the FBMKLCI.
ISLAMIC CAPITAL MARKET• While trades on Bursa Suq Al-Sila’ (BSAS) continue to face strong competition locally and globally,
we will continue with our efforts to expand our niche in the Islamic Finance sector.
• Bursa Malaysia-i, as the world’s first fully integrated end-to-end Shariah-compliant investing
platform, is expected to further attract a wider pool of both domestic and foreign investors.
12
MOVING FORWARD

13

1,435
1,209 1,387
1,793
2,161
1,579 1,732
1,341
1,841
1,439 1,595
1,430
1,643
2,308
2,002
1,686
2,068 2,053 2,196
1,901 2,081
1,913 1,933 2,042 1,981
1,842 1,740 1,690
2,378
1Q10 2Q10 3Q10 4Q10 1Q11 2Q11 3Q11 4Q11 1Q12 2Q12 3Q12 4Q12 1Q13 2Q13 3Q13 4Q13 1Q14 2Q14 3Q14 4Q14 1Q15 2Q15 3Q15 4Q15 1Q16 2Q16 3Q16 4Q16 1Q17
35
2831
3742
3034
27
34
27 2825
28
3731
2530 29 30 28 30 28 29 30 29 27 26 25
34
53
34 34 33 3328 30 29 30 27
34
2,179
1,181 1,129 1,454
1,699 1,573 1,915 2,053 1,991
1,812
2,378
2007 2008 2009 2010 2011 2012 2013 2014 2015 2016 1Q17
Turnover Velocity (%)
Quarterly ADV Traded & Velocity
Average Daily Value Traded (OMT, RM mil)
Average Daily Value Traded (OMT, RM mil)Turnover Velocity (%)
Annual ADV Traded & Velocity
Securities Market Trading Activity
14
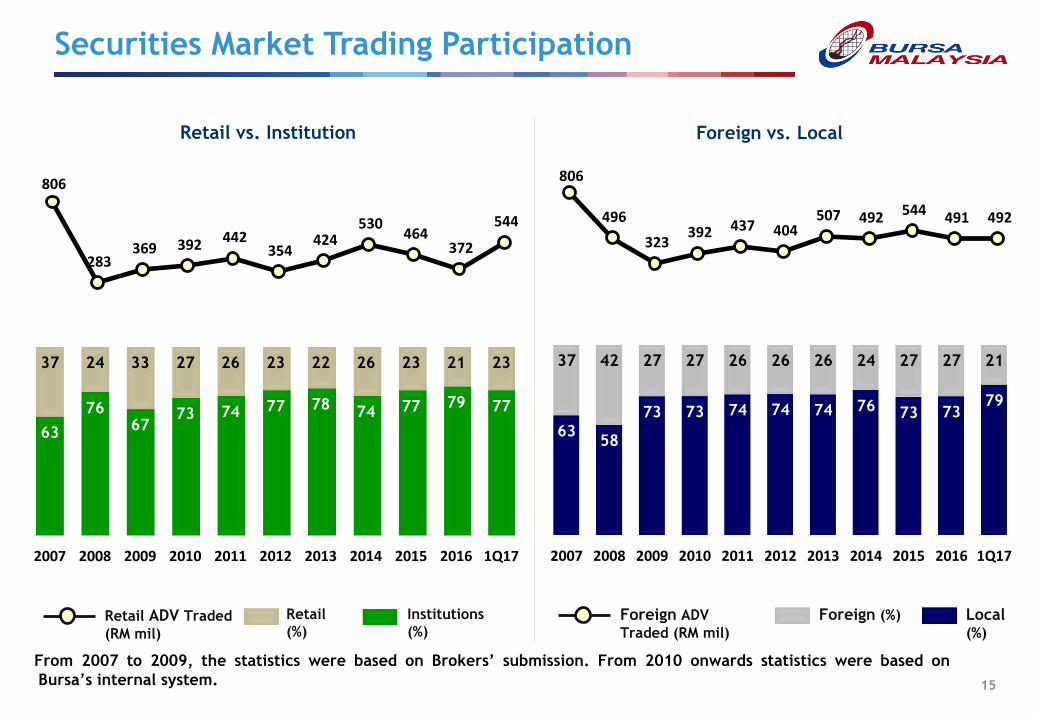
806
283 369 392 442
354 424
530 464
372
544
63
7667
73 74 77 7874 77 79 77
37 24 33 27 26 23 22 26 23 21 23
2007 2008 2009 2010 2011 2012 2013 2014 2015 2016 1Q17
6358
73 73 74 74 74 76 73 7379
37 42 27 27 26 26 26 24 27 27 21
2007 2008 2009 2010 2011 2012 2013 2014 2015 2016 1Q17
From 2007 to 2009, the statistics were based on Brokers’ submission. From 2010 onwards statistics were based on
Bursa’s internal system.
Retail
(%)
Institutions
(%)Local(%)
Foreign (%)Retail ADV Traded
(RM mil)
Foreign ADV
Traded (RM mil)
Retail vs. Institution Foreign vs. Local
Securities Market Trading Participation
806
496
323 392 437 404
507 492 544 491 492
15

Securities Market Foreign Ownership
24.4
24.0
24.3
22.8
22.322.5
23.0 23.0 23.022.8
23.0 23.022.8 22.8
22.6
22.3 22.3 22.322.4
Based on Market Capitalisation (%)
16

Foreign Inflow/Outflow
Monthly foreign inflow/outflow from 2012 to Mar 2017
6,065
428
-4,282
-1,760
1,0211,605
-315 -450
-3,934
-972
420942
4,355
-6,000
-4,000
-2,000
0
2,000
4,000
6,000
8,000 Monthly foreign inflow/outflow from Mar 2016 to Mar 2017(RM mil)
2016
TNFO: RM3.2 bil
17
-10,000
-5,000
0
5,000
10,000
2015
TNFO: RM19.7 bil
2012
TNFI: RM13.6 bil
2013
TNFI: RM2.6 bil2014
TNFO: RM6.9 bil
TNFI: Total Net Foreign Inflow
(RM mil)
TNFO: Total Net Foreign Outflow
1Q2017
TNFI: RM5.7 bil
2007
2008
2009
2010
2011
2012
2013
2014
2015
2016
1Q
17
1Q
11
2Q
11
3Q
11
4Q
11
1Q
12
2Q
12
3Q
12
4Q
12
1Q
13
2Q
13
3Q
13
4Q
13
1Q
14
2Q
14
3Q
14
4Q
14
1Q
15
2Q
15
3Q
15
4Q
15
1Q
16
2Q
16
3Q
16
4Q
16
1Q
17
15
%
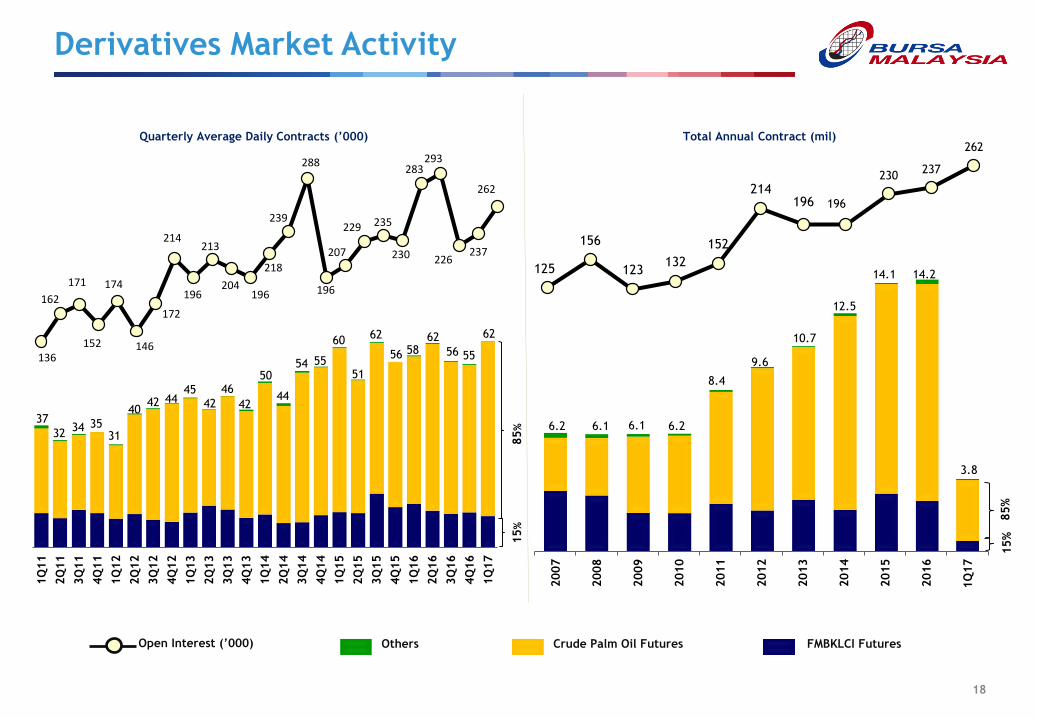
136
162
171
152
174
146
172
214
196
213
204196
218
239
288
196
207
229 235
230
283293
226
262
237
40
Quarterly Average Daily Contracts (’000)
31
42
35
60
Total Annual Contract (mil)
Crude Palm Oil FuturesOthersOpen Interest (’000)
15%
85%
6.2 6.1 6.1 6.2
8.4
9.6
FMBKLCI Futures
37
`
`
85
%
3234
4445
42
46
42
10.7
50
12.5
44
54
Derivatives Market Activity
55
14.2
62
51
62
56
3.8
58
18
56
62
55
as
125
156
123132
152
214196 196
230237
262
14.1

15 15 20 21 19 15 18 20 18 14 13
4146
5244
42
2828 24
23
1917
2
2
3
22
21 2
5
32
4237
2633
37
55 53 54 55
6468
2007 2008 2009 2010 2011 2012 2013 2014 2015 2016 1Q17
(%)FKLI
25 2736 34 34 36 33 34 31 28 28
3438
2726 24 19
17 1515
16 16
11
11
1 11
1
22 15 17
1513
12
10 15 2121 22
18 20 1925 28
3239
35 32 34 34
2007 2008 2009 2010 2011 2012 2013 2014 2015 2016 1Q17
(%)FCPO
Local
Domestic Retail
Domestic
Institutions
Foreign Institutions Local
Domestic RetailDomestic
Institutions
Foreign Institutions Foreign Retail
Derivatives Market Demography
19

Islamic Capital Market Activity
20
0.8 0.9 1.1 1.1 1.3 1.5 1.6 1.8 2.6 2.4 2.7 3.2 3.7 3.7
5.9
8.5
10.4 12.0
14.4
16.9 16.1
12.7 12.2 12.6 13.6
0.2 0.2 0.2 0.3 0.3 0.7 0.9
1.2 1.1 1.0
1.1 1.5
1.4 1.5
1.4
1.4
1.5
1.6
1.6
2.1 2.6
2.7 3.0 3.2
3.8
1Q
11
2Q
11
3Q
11
4Q
11
1Q
12
2Q
12
3Q
12
4Q
12
1Q
13
2Q
13
3Q
13
4Q
13
1Q
14
2Q
14
3Q
14
4Q
14
1Q
15
2Q
15
3Q
15
4Q
15
1Q
16
2Q
16
3Q
16
4Q
16
1Q
17
BSAS Average Daily Value
Local ADV Foreign ADV
(RM bil)

www.bursamalaysia.com
RASMONA ABDUL RAHMAN
603-2034 7175
Disclaimer :
Bursa Malaysia and its Group of Companies (the Company) reserve all proprietary rights to the contents of this Presentation.
Whilst the Company endeavours to ensure that the contents in the presentation booklet are accurate, complete or have been obtained from sources
believed by the Company to be accurate and reliable, neither the Company nor the Presenter make any warranty, express or implied, nor assume any legal
liability or responsibility for the accuracy, completeness or currency of the contents of this Presentation.
In no event shall the Company be liable for any claim, howsoever arising, out of or in relation to this presentation booklet to the recipient of this
presentation booklet and/or to any other third party.
© Bursa Malaysia 2017
E-mail : [email protected]
RAFIDAH AZIZ
603-2034 7262
INVESTOR RELATIONS CONTACT INFORMATION