1q14 presentation of results
TRANSCRIPT

May 7, 2014
Presentation of 1Q14 Results
Ramon Vazquez
1Q14 Results
2
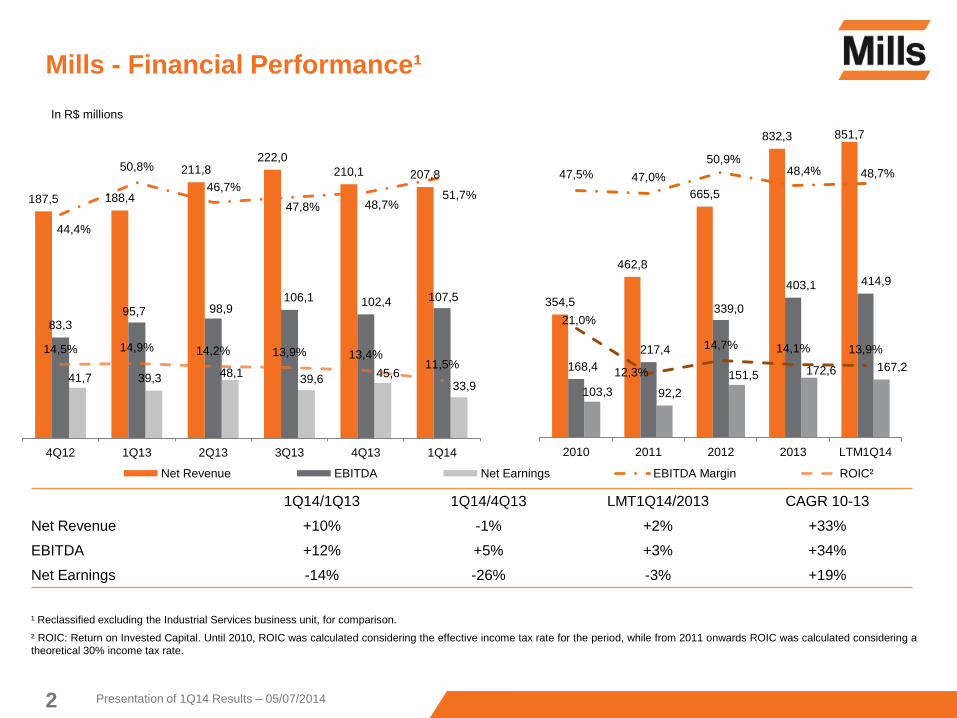
Mills - Financial Performance¹
¹ Reclassified excluding the Industrial Services business unit, for comparison.
² ROIC: Return on Invested Capital. Until 2010, ROIC was calculated considering the effective income tax rate for the period, while from 2011 onwards ROIC was calculated considering a
theoretical 30% income tax rate.
1Q14/1Q13 1Q14/4Q13 LMT1Q14/2013 CAGR 10-13
Net Revenue +10% -1% +2% +33%
EBITDA +12% +5% +3% +34%
Net Earnings -14% -26% -3% +19%
Presentation of 1Q14 Results – 05/07/2014
In R$ millions
187,5 188,4
211,8 222,0
210,1 207,8
83,3 95,7 98,9
106,1 102,4 107,5
41,7 39,3 48,1 39,6
45,6 33,9
44,4%
50,8%
46,7%
47,8% 48,7% 51,7%
14,5% 14,9% 14,2% 13,9% 13,4% 11,5%
4Q12 1Q13 2Q13 3Q13 4Q13 1Q14
Net Revenue EBITDA Net Earnings EBITDA Margin ROIC²
354,5
462,8
665,5
832,3 851,7
168,4
217,4
339,0
403,1 414,9
103,3 92,2
151,5 172,6 167,2
47,5% 47,0%
50,9% 48,4% 48,7%
21,0%
12,3%
14,7% 14,1% 13,9%
2010 2011 2012 2013 LTM1Q14

Rental 85%
Technical support services
1%
Sales 8%
Others 6%
By service category
Heavy Construction
29%
Real Estate 24%
Rental 47%
By business unit
3 Presentation of 1Q14 Results – 05/07/2014
Net revenues totaled R$ 207.8 million in 1Q14

4
We launched an expense reduction program to minimize the
effect of higher G&A allocated in the remaining business units
after the sale of Industrial Services
13,9 16,7
12,6 16,5 15,9
21,9 22,3
22,9 20,8 22,0
15,5
16,0 18,3
19,5 19,6
8,8
8,9 12,5 9,6
1,1
1Q13 2Q13 3Q13 4Q13 1Q14
Industrial Services
Rental
Real Estate
Heavy Construction
-12%
+3% 63.8
66.4 66.4¹
58.5
51.3
54.9 53.9 56.8
¹Excluding capital gain from the sale of the Industrial Services business unit
60.1
Presentation of 1Q14 Results – 05/07/2014

In R$ million
1Q14/1Q13 1Q14/4Q13 LTM1Q14/2013 CAGR 10-13
Net Revenue +8% -13% +2% +12%
EBITDA +5% -12% +1% +14%
Heavy Construction – Financial Performance
5
* Excluding the positive effect of tax reversal in the amount of R$ 1.5 million in 3Q13.
1 ROIC: Return on Invested Capital. Until 2010, ROIC was calculated considering the effective income tax rate for the period, while from 2011 onwards ROIC was calculated considering a
theoretical 30% income tax rate.
Presentation of 1Q14 Results – 05/07/2014
47,3 47,5
55,1 55,7 55,7 58,6
51,0
20,2
24,3 25,1
29,4 28,2 29,3 25,6
42,7%
51,3%
45,5%
52,8% 50,6%
49,9%
50,2%
14,8%
18,6% 17,8%
20,9% 19,7%
19,1%
14,0%
4Q12 1Q13 2Q13 3Q13 3Q13* 4Q13 1Q14
Net Revenue EBITDA EBITDA Margin ROIC¹
154,3
131,6
174,1
217,0 220,5
73,6 57,8
84,3
108,1 109,4
47,7%
43,9%
48,5% 49,8% 49,6%
24,1%
12,1%
17,2% 19,2%
17,9%
2010 2011 2012 2013 LTM1Q14

• Transposition of the
São Francisco river*
• Comperj refinery*
• Subway line 5 – SP*
• Raposo Tavares
highway
• Belo Monte
hydroelectric power
plant*
• Norte-Sul railroad*
• Jurong shipyard
• Olympic park
• Silver monorail line-
SP*
• Gold monorail line-
SP*
• Pulp mill expansion-
RS*
Evo
luti
on
of
reve
nu
e g
en
era
tio
n
(B
asis
10
0=
Ma
xim
um
mo
nth
ly r
eve
nu
e in t
he
life
of co
nstr
uctio
n)
Length of time of Mills participation in the construction work – average cycle is 24 months
• Belo Monte hydroelectric
power plant
• Vale’s S11D project
• Norte-Sul railroad
• Oeste-Leste railroad
• North beltway
• Subway lines 4 e 5 – SP
• Companhia Siderúrgica
do Pecém steel mill
• Paraguaçu shipyard
• Salvador subway
• Goiânia airport
• Confins airport
• Pulp mill expansion- RS
• Colíder and Teles Pires
hydroelectric power plants
• Comperj refinery
• Transposition of the São Francisco
river
• Cais das Artes
• Vale projects
• East beltway- SP
• Gold monorail line- SP
• Subway line 4 – RJ
• BRT Transcarioca
• Libra terminal
• Cuiabá light rail
• Jacu-Pêssego highway
• Jirau hydroelectric power
plants
• Abreu e Lima refinery
• Natal airport
• Fortaleza airport
• Viracopos and Guarulhos
airport
• Brasília airport
• Confins airport
• Metropolitan Arch – RJ
• Surroundings of
Maracanã
• Gerdau projects
• Minas-Rio pipeline
New
contracts*
Contracts with growing
volume of equipment
Contracts with high volume
of equipment Contracts in the
demobilization process
* New streches
Important contracts per stage1 in the evolution of monthly
revenue from Heavy Construction projects
6
1 In 1Q14
Presentation of 1Q14 Results – 05/07/2014

7
New products that offer gains of productivity and security
Mills Light
Lifting carts
Presentation of 1Q14 Results – 05/07/2014

1Q13/1Q14 1Q14/4Q13 LTM1Q14/2013 CAGR 10-13
Net Revenue -8% +10% -2% +35%
EBITDA -15% +37% -5% +29%
Real Estate – Financial Performance
8
1 ROIC: Return on Invested Capital. Until 2010, ROIC was calculated considering the effective income tax rate for the period, while from 2011 onwards ROIC was calculated considering a
theoretical 30% income tax rate.
Presentation of 1Q14 Results – 05/07/2014
In R$ million
66,0 64,9 66,5
72,4
54,2
59,5
26,1 27,7 24,6 24,4
17,1
23,5
39,6%
42,8%
37,0% 33,7%
31,5%
39,4%
12,6% 12,8%
9,3% 8,2%
3,2%
6,6%
4Q12 1Q13 2Q13 3Q13 4Q13 1Q14
Net Revenue EBITDA EBITDA Margin ROIC¹
105,1
155,8
238,0
258,0 252,6
43,9
66,0
113,4
93,8 89,5
41,7% 42,4% 47,7%
36,4% 35,4%
23,5%
14,3%
15,7%
8,1% 6,7%
2010 2011 2012 2013 LTM1Q14
9
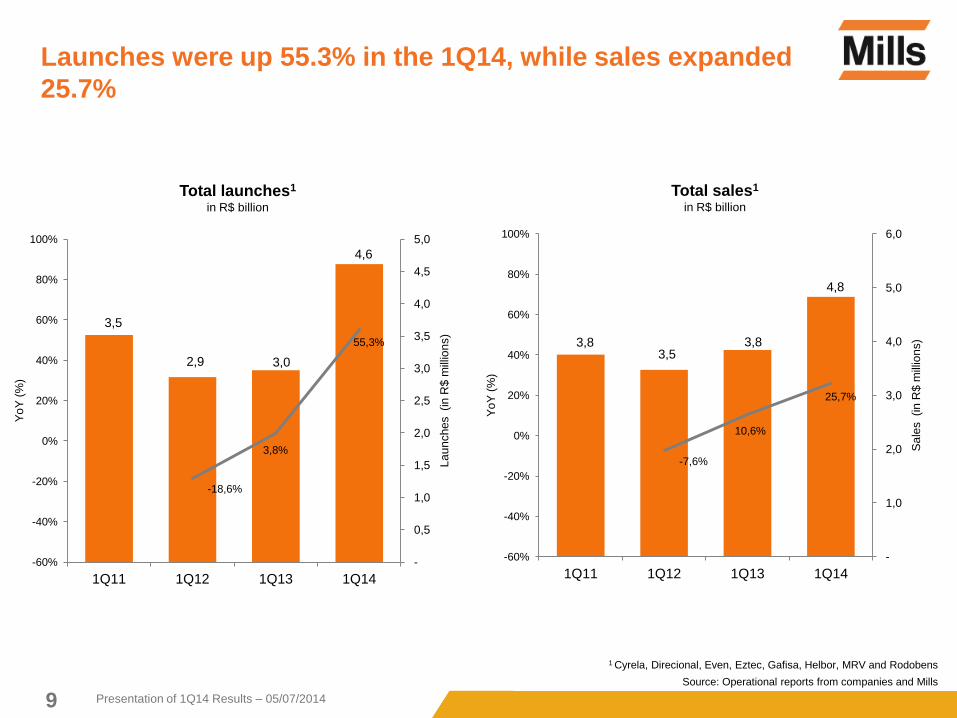
3,5
2,9 3,0
4,6
-18,6%
3,8%
55,3%
-60%
-40%
-20%
0%
20%
40%
60%
80%
100%
-
0,5
1,0
1,5
2,0
2,5
3,0
3,5
4,0
4,5
5,0
1Q11 1Q12 1Q13 1Q14
Yo
Y (
%)
La
un
ches (in R
$ m
illio
ns)
1 Cyrela, Direcional, Even, Eztec, Gafisa, Helbor, MRV and Rodobens
Source: Operational reports from companies and Mills
Total launches1
in R$ billion
Launches were up 55.3% in the 1Q14, while sales expanded
25.7%
3,8 3,5
3,8
4,8
-7,6%
10,6%
25,7%
-60%
-40%
-20%
0%
20%
40%
60%
80%
100%
-
1,0
2,0
3,0
4,0
5,0
6,0
1Q11 1Q12 1Q13 1Q14
Yo
Y (
%)
Sa
les (in R
$ m
illio
ns)
Total sales1
in R$ billion
Presentation of 1Q14 Results – 05/07/2014

1Q13/1Q14 1Q14/4Q13 LTM1Q14/2013 CAGR 10-13
Net Revenue +28% +0.1% +6% +55%
EBITDA +34% +4% +7% +58%
Rental – Financial Performance
10
1 ROIC: Return on Invested Capital. Until 2010, ROIC was calculated considering the effective income tax rate for the period, while from 2011 onwards ROIC was calculated considering a
theoretical 30% income tax rate.
Presentation of 1Q14 Results – 05/07/2014
In R$ million
74,2 76,1
90,1 93,9
97,2 97,3
36,9
43,6 49,3
52,3 56,0
58,4
49,8%
57,3%
54,7% 55,7% 57,7%
60,1%
16,9% 19,1% 18,5% 18,1% 17,5% 17,1%
4Q12 1Q13 2Q13 3Q13 4Q13 1Q14
Net Revenue EBITDA EBITDA Margin ROIC¹
95,1
175,4
253,5
357,3
378,5
51,0
93,6
141,2
201,2 216,1
53,6% 53,4% 55,7% 56,3%
57,1%
19,2% 16,5% 18,2%
18,1% 17,8%
2010 2011 2012 2013 LTM1Q14

Award - “IPAF training center of the year
11
Source: Mills
Presentation of 1Q14 Results – 05/07/2014
IAPA Award
ceremony
England –
April 2014
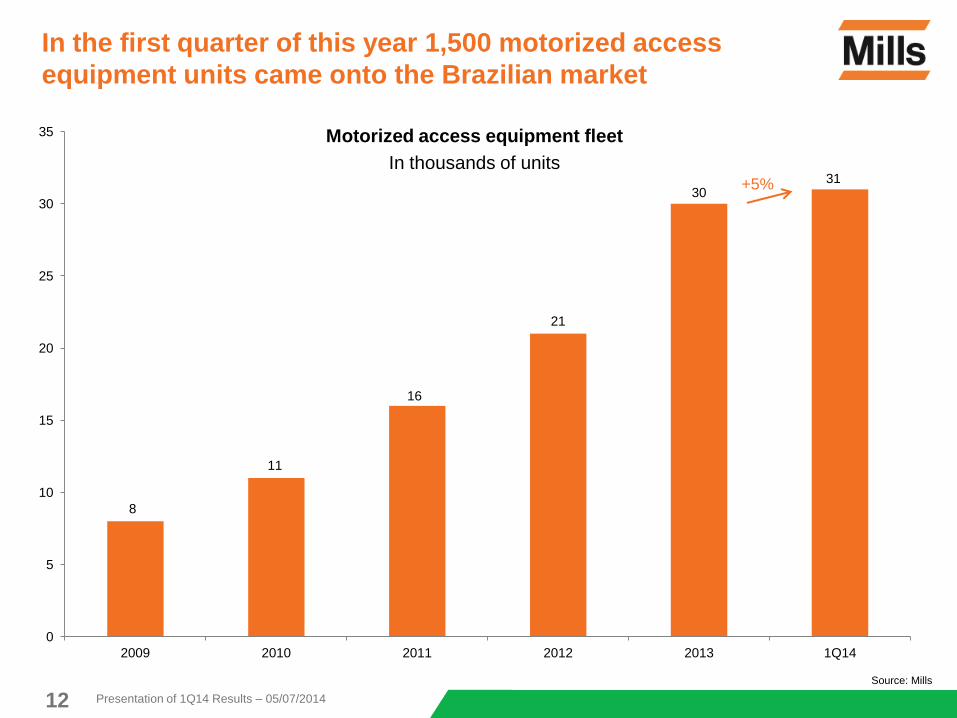
In the first quarter of this year 1,500 motorized access
equipment units came onto the Brazilian market
12
Motorized access equipment fleet
In thousands of units
Source: Mills
Presentation of 1Q14 Results – 05/07/2014
+5%
8
11
16
21
30 31
0
5
10
15
20
25
30
35
2009 2010 2011 2012 2013 1Q14

Growth Plan

74 47 51
106
15
104 185
60
90
4
131
163
161
267
73
15
18
20
36
10
324
413
292
499
102
2010 2011 2012 2013 1Q14
Rental
Real Estate
Heavy Construction
In R$ million
Capex ¹
Realized 1Q14 /
2014 Capex Budget
(%)
41%
18%
43%
Mills invested R$ 93 million in rental equipment in 1Q14
14
¹ Reclassified excluding the Industrial Services business unit, for comparison.
Presentation of 1Q14 Results – 05/07/2014
Total 40%
Rental equipment
