1.determine if the relation shown is a function. cleary...
TRANSCRIPT
Algebra I – Final exam Review June 2013
Name: __________________________________ Period: ________
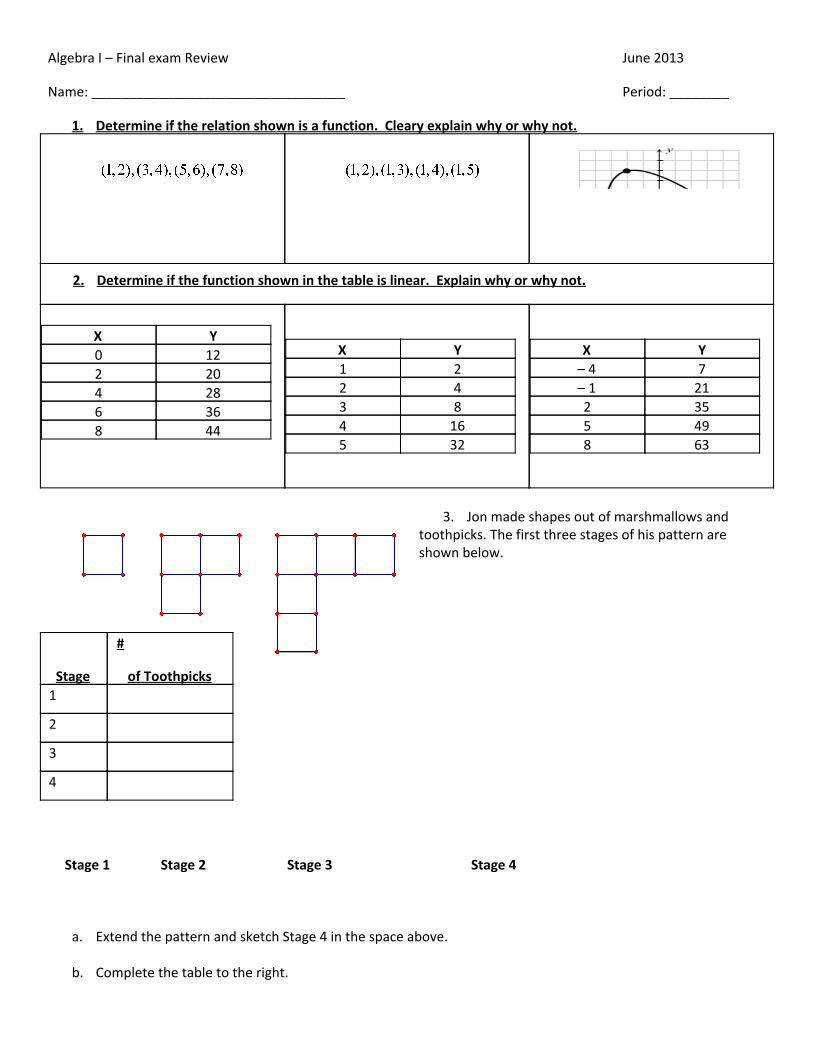
1. Determine if the relation shown is a function. Cleary explain why or why not.
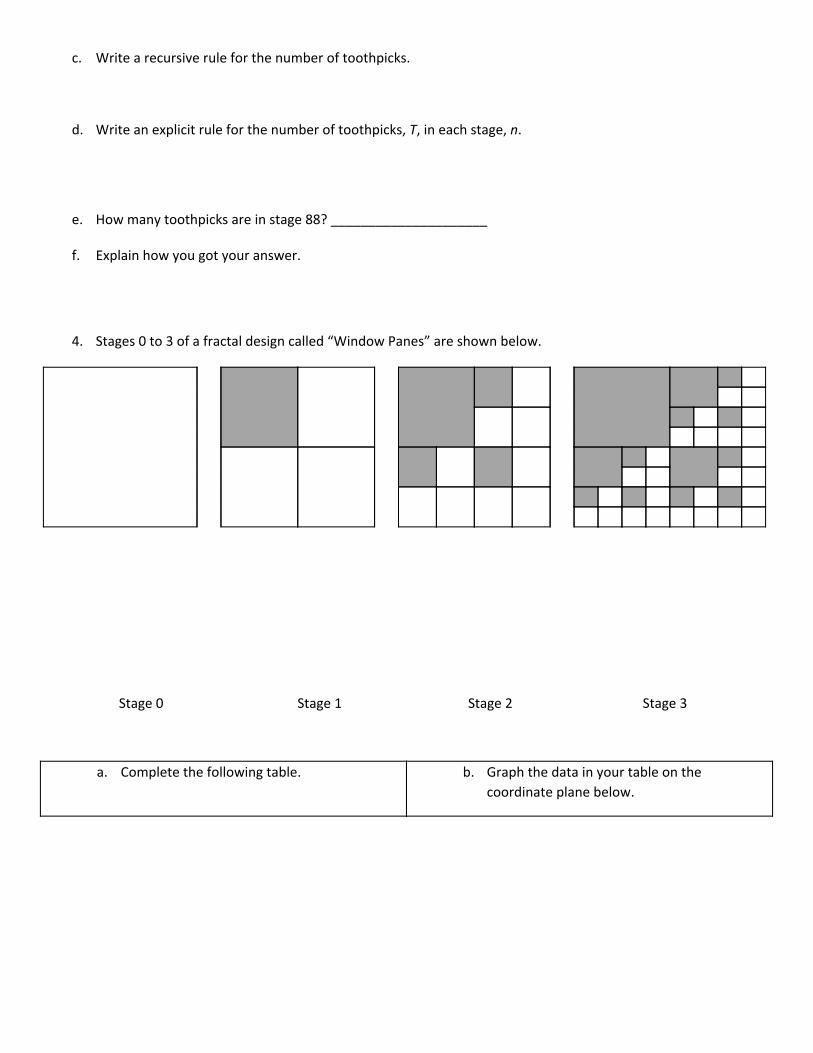
2. Determine if the function shown in the table is linear. Explain why or why not.
X Y 0 12 2 20 4 28 6 36 8 44
X Y 1 2 2 4 3 8 4 16 5 32
X Y – 4 7 – 1 21 2 35 5 49 8 63
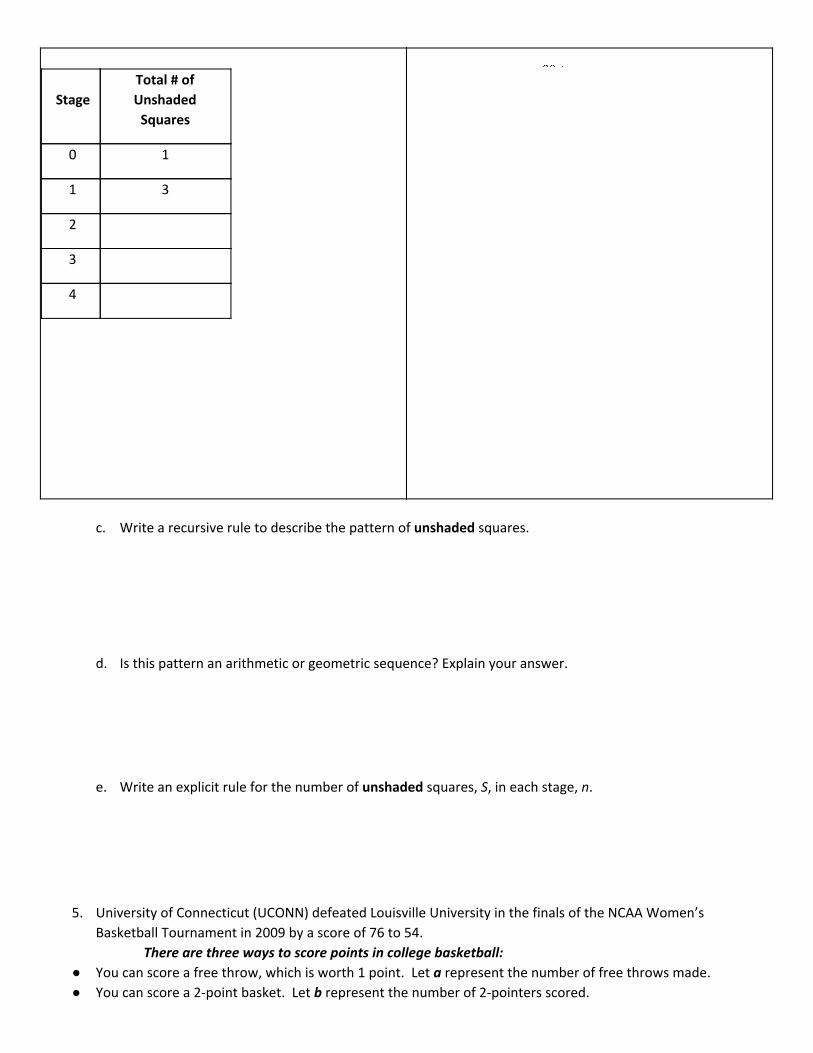
3. Jon made shapes out of marshmallows and
toothpicks. The first three stages of his pattern are shown below.
Stage
#
of Toothpicks 1
2
3
4
Stage 1 Stage 2 Stage 3 Stage 4
a. Extend the pattern and sketch Stage 4 in the space above.
b. Complete the table to the right.
c. Write a recursive rule for the number of toothpicks.
d. Write an explicit rule for the number of toothpicks, T, in each stage, n.
e. How many toothpicks are in stage 88? _____________________
f. Explain how you got your answer.
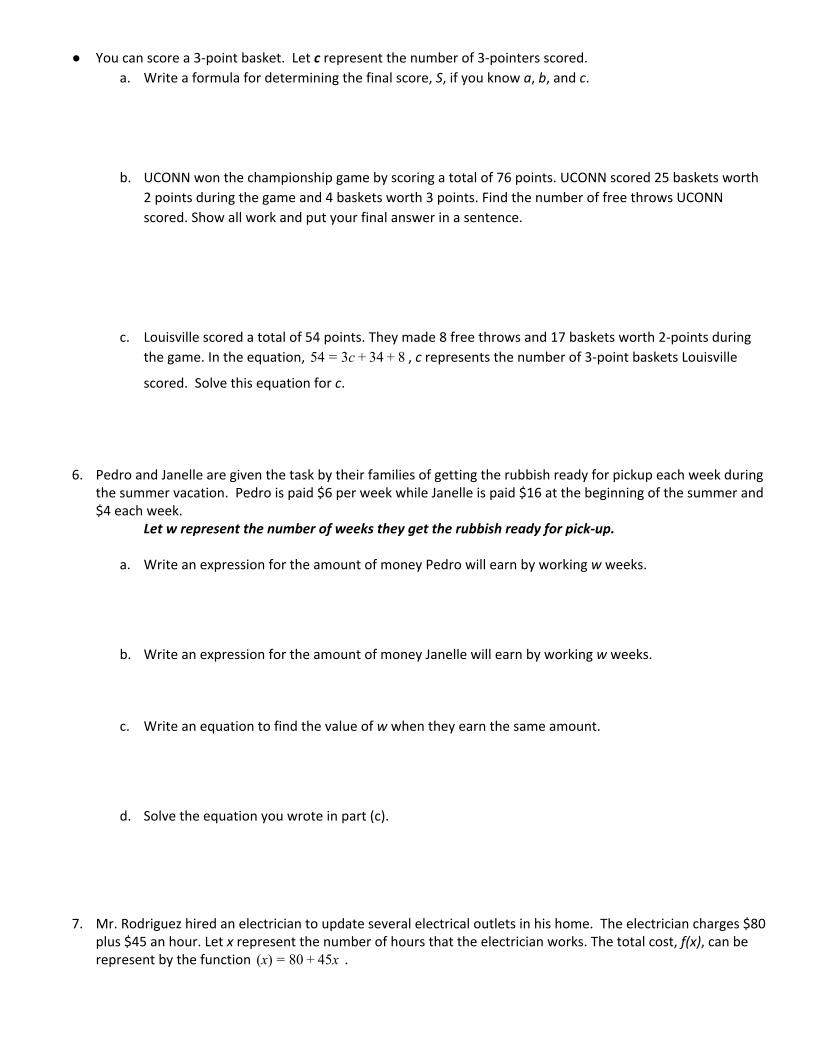
4. Stages 0 to 3 of a fractal design called “Window Panes” are shown below.
Stage 0 Stage 1 Stage 2 Stage 3
a. Complete the following table. b. Graph the data in your table on the
coordinate plane below.
Stage
Total # of
Unshaded
Squares
0 1
1 3
2
3
4
c. Write a recursive rule to describe the pattern of unshaded squares.
d. Is this pattern an arithmetic or geometric sequence? Explain your answer.
e. Write an explicit rule for the number of unshaded squares, S, in each stage, n.
5. University of Connecticut (UCONN) defeated Louisville University in the finals of the NCAA Women’s
Basketball Tournament in 2009 by a score of 76 to 54.
There are three ways to score points in college basketball:
● You can score a free throw, which is worth 1 point. Let a represent the number of free throws made.
● You can score a 2-point basket. Let b represent the number of 2-pointers scored.
● You can score a 3-point basket. Let c represent the number of 3-pointers scored.
a. Write a formula for determining the final score, S, if you know a, b, and c.
b. UCONN won the championship game by scoring a total of 76 points. UCONN scored 25 baskets worth
2 points during the game and 4 baskets worth 3 points. Find the number of free throws UCONN
scored. Show all work and put your final answer in a sentence.
c. Louisville scored a total of 54 points. They made 8 free throws and 17 baskets worth 2-points during
the game. In the equation, , c represents the number of 3-point baskets Louisville4 c 45 = 3 + 3 + 8
scored. Solve this equation for c.
6. Pedro and Janelle are given the task by their families of getting the rubbish ready for pickup each week during
the summer vacation. Pedro is paid $6 per week while Janelle is paid $16 at the beginning of the summer and $4 each week.
Let w represent the number of weeks they get the rubbish ready for pick-up.
a. Write an expression for the amount of money Pedro will earn by working w weeks.
b. Write an expression for the amount of money Janelle will earn by working w weeks.
c. Write an equation to find the value of w when they earn the same amount.
d. Solve the equation you wrote in part (c).
7. Mr. Rodriguez hired an electrician to update several electrical outlets in his home. The electrician charges $80 plus $45 an hour. Let x represent the number of hours that the electrician works. The total cost, f(x), can be represent by the function .x) 0 5x( = 8 + 4
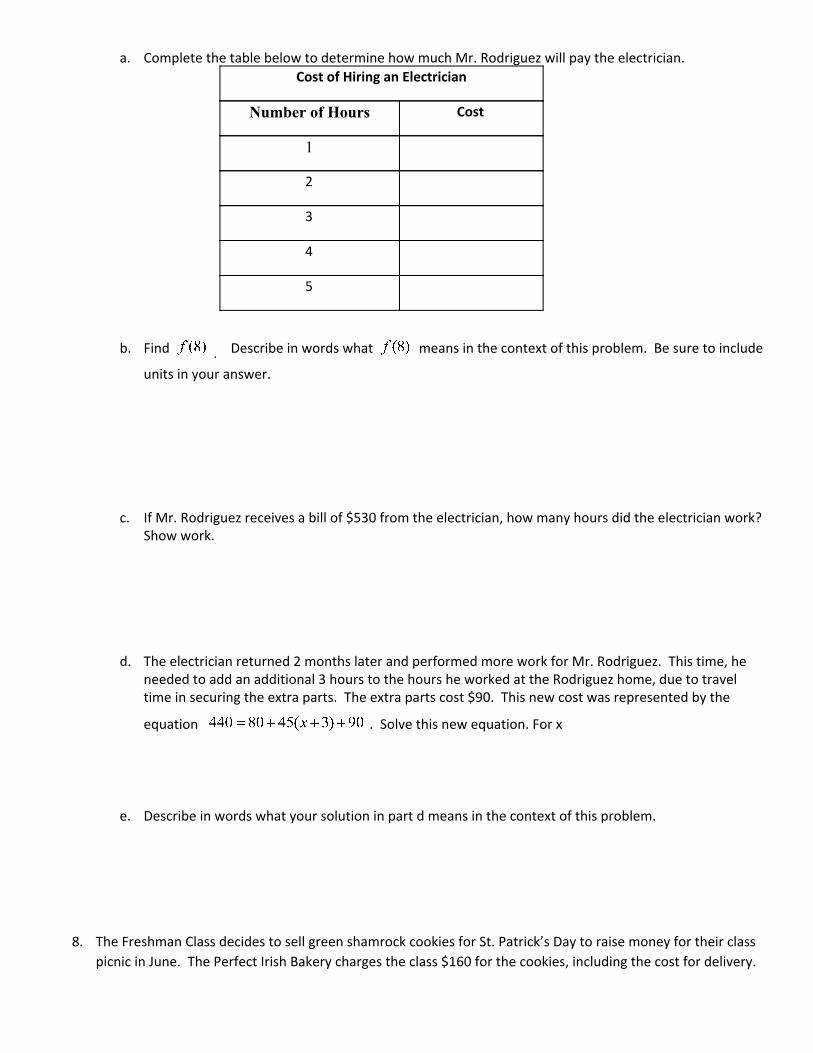
a. Complete the table below to determine how much Mr. Rodriguez will pay the electrician. Cost of Hiring an Electrician
Number of Hours Cost
1
2
3
4
5
b. Find Describe in words what means in the context of this problem. Be sure to include .
units in your answer.
c. If Mr. Rodriguez receives a bill of $530 from the electrician, how many hours did the electrician work?
Show work.
d. The electrician returned 2 months later and performed more work for Mr. Rodriguez. This time, he needed to add an additional 3 hours to the hours he worked at the Rodriguez home, due to travel time in securing the extra parts. The extra parts cost $90. This new cost was represented by the
equation . Solve this new equation. For x
e. Describe in words what your solution in part d means in the context of this problem.
8. The Freshman Class decides to sell green shamrock cookies for St. Patrick’s Day to raise money for their class
picnic in June. The Perfect Irish Bakery charges the class $160 for the cookies, including the cost for delivery.
The class decides to sell the cookies for $2.00 each. Let x represent the number of cookies sold, and y
represent the net profit.
a. Identify the slope (rate of change).
b. Explain the real-world meaning of the slope.
c. What is the y-intercept?
d. Explain the real-world meaning of the y-intercept.
e. Write an equation involving x and y that represents this situation.
f. When will the class break-even (neither make nor lose money). Explain how you arrived at your
answer.
g. If the class sells 500 cookies, what will the profit be? Show your work.
9. You are going away to camp for a week and you are deciding between two meal plans. The Hungry Hungry
Hippo meal plan costs $130 for the week, plus $0.50 per drink. The Thirsty Camper meal plan costs $105.00 a
week and $ 1.00 per drink.
a. Identify the variables for the total weekly cost and number of drinks per week.
b. Write an equation for the Hungry Hungry Hippo plan.
c. Write an equation for the Thirsty Camper plan.
d. Find the solution to this system of equations by using either substitution or elimination. Show you work. Be sure to solve for both variables.
e. Interpret this solution in the context of the problem.
f. Could you graph both equations to determine the solution? Would this be the preferred method of solving the problem. Explain.
10. The Blast Off Music Company makes CDs and DVDs. The company can make a total of 500 CDs and DVDs each
day. It costs $8 to make each CD and $10 to make each DVD. The company can spend $4800 for production
costs each day. How many individual CDs and DVDs can The Blast Off Music Company make in one day?
a. Define your variables and write a system of linear equations to model the situation.
b. Solve the system of equations and explain your solution in terms of the context of the problem.
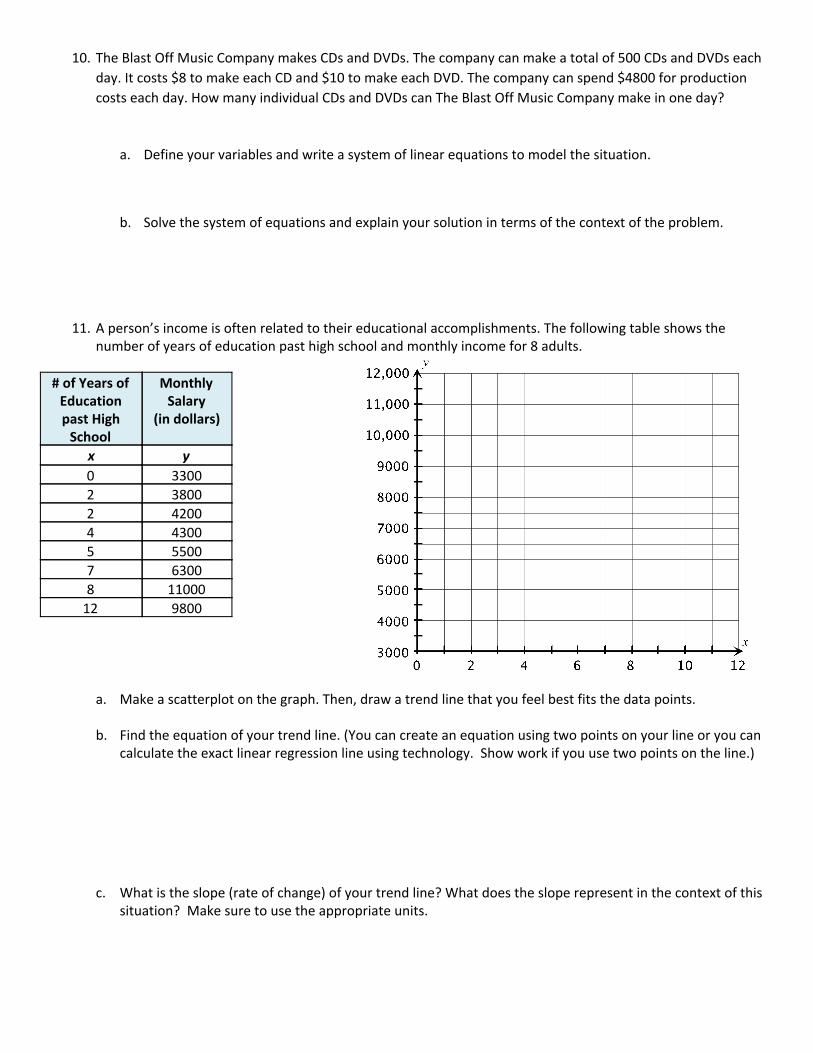
11. A person’s income is often related to their educational accomplishments. The following table shows the number of years of education past high school and monthly income for 8 adults.
# of Years of Education past High
School
Monthly Salary
(in dollars)
x y
0 3300 2 3800 2 4200 4 4300 5 5500 7 6300 8 11000
12 9800
a. Make a scatterplot on the graph. Then, draw a trend line that you feel best fits the data points.
b. Find the equation of your trend line. (You can create an equation using two points on your line or you can
calculate the exact linear regression line using technology. Show work if you use two points on the line.)
c. What is the slope (rate of change) of your trend line? What does the slope represent in the context of this situation? Make sure to use the appropriate units.
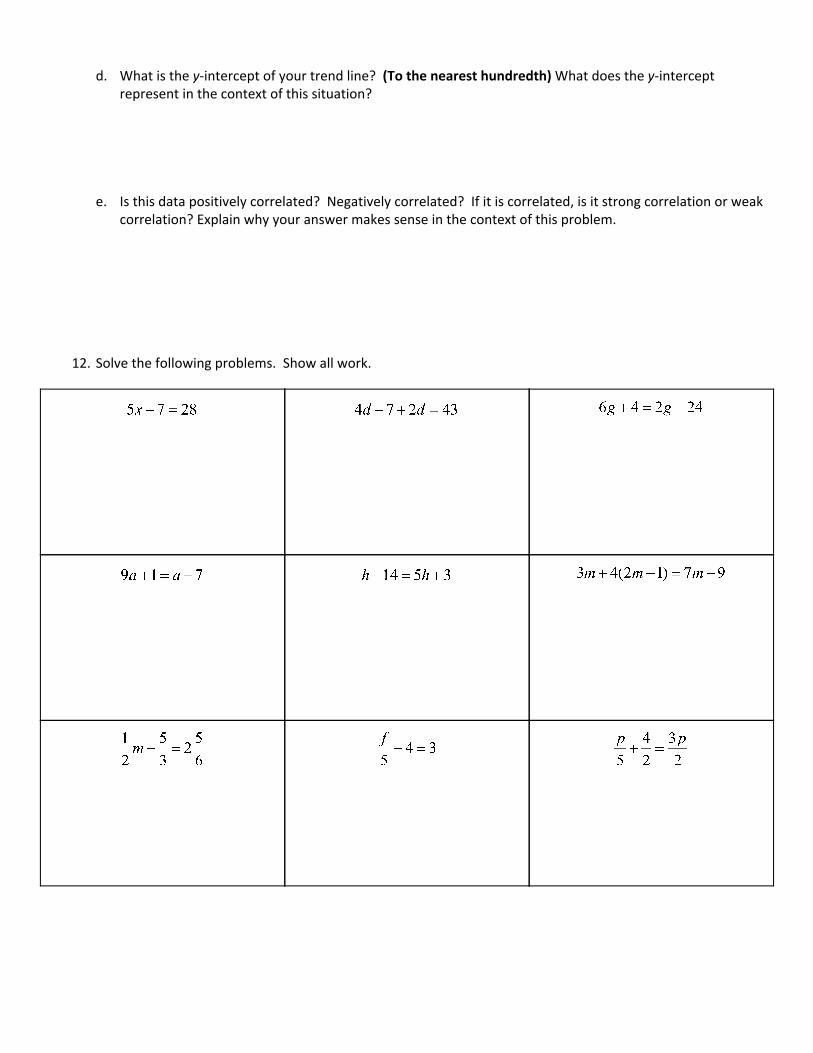
d. What is the y-intercept of your trend line? (To the nearest hundredth) What does the y-intercept
represent in the context of this situation?
e. Is this data positively correlated? Negatively correlated? If it is correlated, is it strong correlation or weak correlation? Explain why your answer makes sense in the context of this problem.
12. Solve the following problems. Show all work.
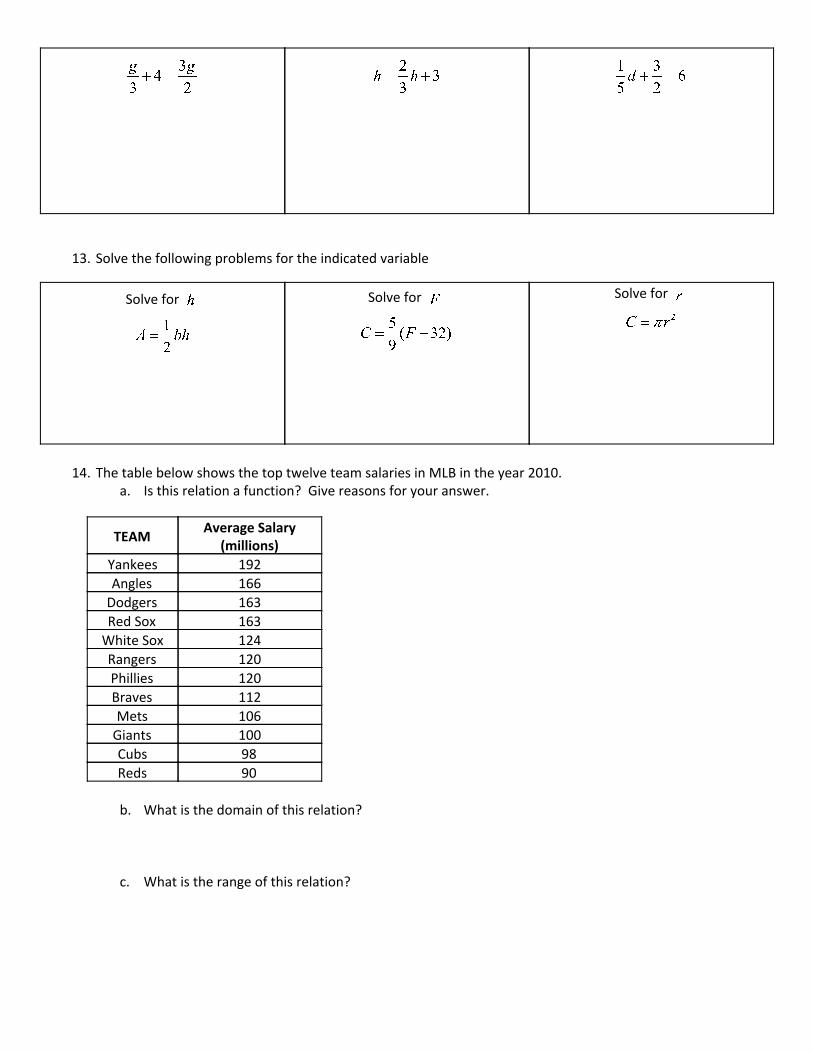
13. Solve the following problems for the indicated variable
Solve for
Solve for
Solve for
14. The table below shows the top twelve team salaries in MLB in the year 2010.
a. Is this relation a function? Give reasons for your answer.
TEAM Average Salary
(millions) Yankees 192 Angles 166
Dodgers 163 Red Sox 163
White Sox 124 Rangers 120 Phillies 120 Braves 112 Mets 106
Giants 100 Cubs 98 Reds 90
b. What is the domain of this relation?
c. What is the range of this relation?
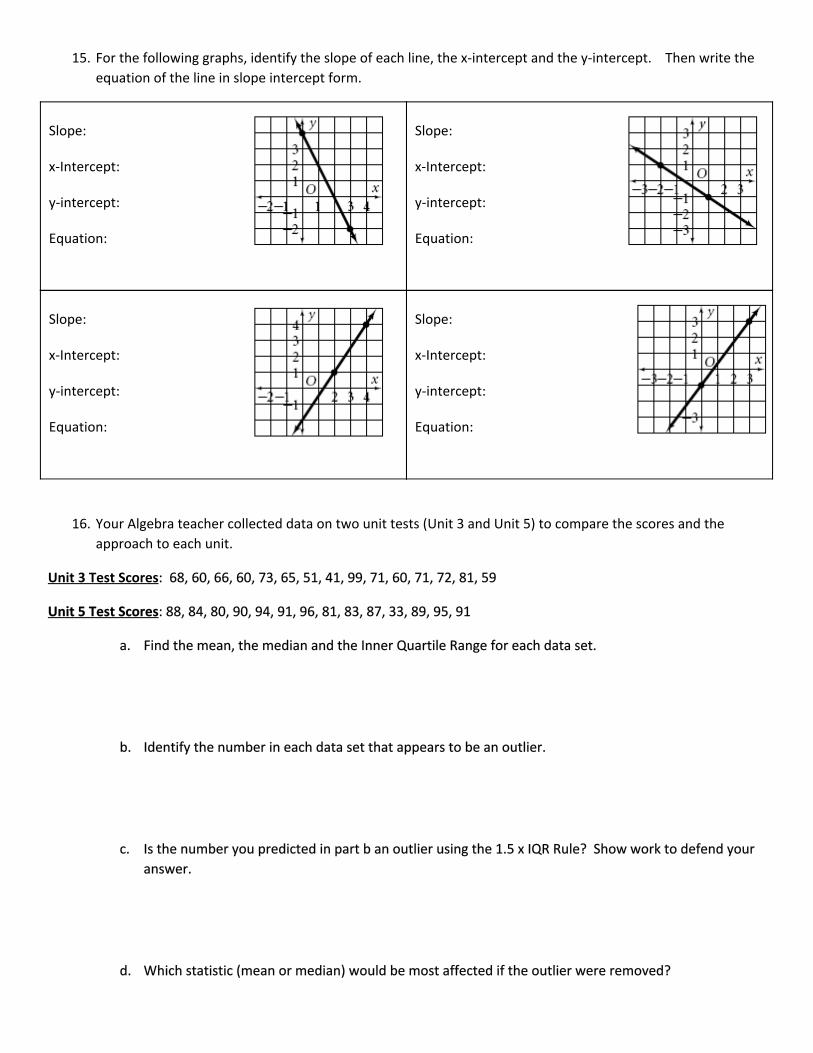
15. For the following graphs, identify the slope of each line, the x-intercept and the y-intercept. Then write the
equation of the line in slope intercept form.
Slope: x-Intercept: y-intercept: Equation:
Slope: x-Intercept: y-intercept: Equation:
Slope: x-Intercept: y-intercept: Equation:
Slope: x-Intercept: y-intercept: Equation:
16. Your Algebra teacher collected data on two unit tests (Unit 3 and Unit 5) to compare the scores and the
approach to each unit.
Unit 3 Test Scores: 68, 60, 66, 60, 73, 65, 51, 41, 99, 71, 60, 71, 72, 81, 59
Unit 5 Test Scores: 88, 84, 80, 90, 94, 91, 96, 81, 83, 87, 33, 89, 95, 91
a. Find the mean, the median and the Inner Quartile Range for each data set.
b. Identify the number in each data set that appears to be an outlier.
c. Is the number you predicted in part b an outlier using the 1.5 x IQR Rule? Show work to defend your
answer.
d. Which statistic (mean or median) would be most affected if the outlier were removed?
e. What conclusions, if any, can you make based on this data?
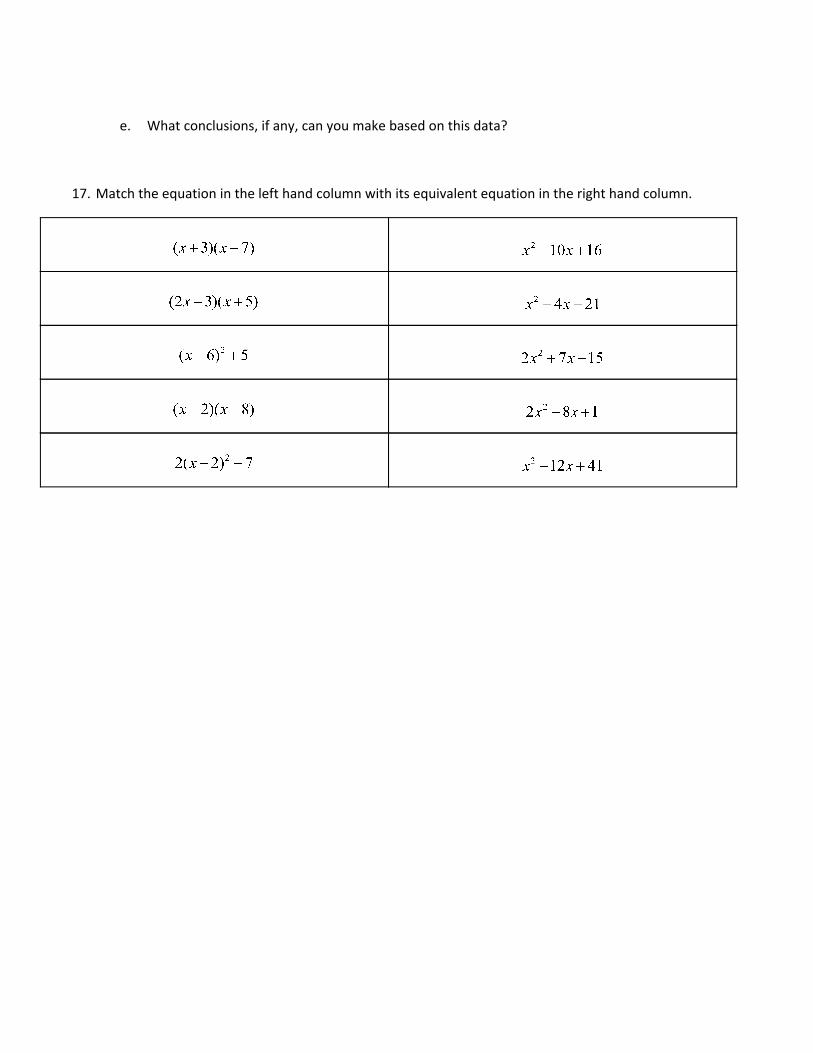
17. Match the equation in the left hand column with its equivalent equation in the right hand column.