1997 design and analysis of interactive video networks and
TRANSCRIPT

University of WollongongResearch Online
University of Wollongong Thesis Collection University of Wollongong Thesis Collections
1997
Design and analysis of interactive video networksand serversScott Anthony BarnettUniversity of Wollongong
Research Online is the open access institutional repository for theUniversity of Wollongong. For further information contact the UOWLibrary: [email protected]
Recommended CitationBarnett, Scott Anthony, Design and analysis of interactive video networks and servers, Doctor of Philosophy thesis, Department ofElectrical, Computer and Telecommunications Engineering, University of Wollongong, 1997. http://ro.uow.edu.au/theses/1359


A Thesis entitled
Design and Analysis of Interactive Video
Networks and Servers
Submitted to the University of Wollongong
in fulfilment of the requirements for the degree of Doctor of Philosophy
Scott Anthony Barnett Bachelor of Computer Engineering (Honours I)
University of Wollongong
Date of submission: March 1997

Dedicated to the memory
of my Father,
who continues, every day,
to show me the way.

II
Abstract
Interactive video systems will form the basis of a vast range of new
telecommunications services set to emerge in the coming years.
Interactive video services enable the user to select and control the
playback of video objects located on a remote server, in real-time.
Telecommunications, storage and compression technologies are
maturing and converging rapidly to make interactive video achieva
ble in the wide area. These interactive video services will transform
information and entertainment systems in a fundamental way, the
true impact of which is difficult to predict.
This thesis presents a unified treatment of some of the issues related
to interactive video service provision. Currently, there is m u c h
research being conducted on various aspects of these systems. The
complex nature of large-scale interactive video systems has, how
ever, often lead to the use of significant simplifying assumptions or
isolated treatments of specific sub-problems. While these efforts are
valuable, this thesis takes a more holistic approach. A top-down
approach is used to perform a cost comparison of an entire network
architecture, before considering various aspects of the system in
more detail.
As a result of an extensive literature survey and preliminary investi
gations, several areas are isolated for further consideration. Specifi
cally, the use of disk-array based storage for video servers is
considered in detail. Performability analysis is employed to compare
various disk-array architectures from a combined performance and
reliability perspective. Further, a new packing scheme is introduced
for allocating video objects to the various disk arrays within a server.
This scheme is shown to give considerable efficiency improvements
over existing packing heuristics.

Ill
Before transmission of video can commence, a video server must
ensure that sufficient resources are available to support the call.
Traditional call-admission control (CAC) procedures are shown to
lead to high delay variability due to poor load balance. A new C A C
scheme is proposed which utilises significant information about
server state to improve load balance and reduce delay variability.
The thesis concludes with a methodology suitable for designing
large-scale interactive video systems suitable for supporting video-
on-demand style applications. The method applies the analytic tools
presented earlier in the dissertation to provide the engineer with a
robust method for top-down system design.
The results of this thesis lead to the conclusion that interactive video
systems can be constructed cost-effectively utilising existing storage
and networking technologies. The costs are, however, substantial
and a high level of market penetration will be required to ensure that
such systems are profitable in the medium-term.

IV
Statement of Originality
This is to certify that the work described in this thesis is entirely my
own, except where due reference is made in the text.
No work in this thesis has been submitted for a degree to any other
university or institution.
Signed
Scott Anthony Barnett
18 March, 1997

V
Acknowledgments
First I would like to thank my thesis supervisor, Professor Gary
Anido. His knowledge and support has always been inspiring.
I also must thank all my colleagues at The Institute for Telecommu
nications Research. Lorraine de Vere, Chris Stacey and Tony Liu
deserve special mention, and I wish them all well in the completion
of their studies. This research group has certainly provided a fertile
grounding from which to conduct my research.
On a more personal level, I must thank my mother, Barbara, and my
brother, Karl, for their support through all my years of study. With
out support like theirs 1 would never have even attempted to come so
far.
My final and most heartfelt thanks go to my wonderful girlfriend,
Louise. Without her love and encouragement, who knows.

VI
Table of Contents
Abstract ii
Statement of Originality iv
Acknowledgments v
Table of Contents vi
List of Figures ix
List of Abbreviations xii
1.Introduction 1
1.1 Background 1 1.2 Overview 2
1.3 Contributions 4 1.4 Publications 7
1.4.1 Journal Publications 7 1.4.2 Conference Publications 7
2.Review of Current Efforts in Interactive Video Delivery 9
2.1 Introduction 9
2.2 Interactive Video Services and Technologies 10 2.2.1 Definition of Interactive Video 10 2.2.2 Example Applications 12 2.2.3 Key Technologies 15
2.3 Network Design Issues 20 2.3.1 VBR Video Transmission over ATM 20 2.3.2 Network Architectures for Interactive Video 21
2.4 Server Design Issues 25 2.4.1 Storage Hierarchies for Interactive Video 27 2.4.2 Disk Arrays for Video Service 32 2.4.3 Disk Layout and Scheduling 39 2.4.4 Call Admission Control, Load Balancing and Delay 50 2.4.5 Support for Interactive Services 56 2.4.6 Techniques for Load Reduction 59 2.4.7 Reliability of Large Disk Arrays 61
2.5 Prototype and Trial Systems 63 2.5.1 Laboratory Prototypes 63 2.5.2 Publicly Deployed Field Trials 64
2.6 Relevant Standardisation Work 65 2.7 Summary 66
2.7.1 Deficiencies in the Existing Literature 66

VII
3.1nteractive Video Network Design 68
3.1 Introduction 68 3.2 Network Architecture and Costs 69 3.3 Server Cost Model 71
3.3.1 Magnetic Disk Cost Model 75 3.4 Homogeneous vs Heterogeneous Disk Arrays 79
3.4.1 Video Popularity Model 79 3.4.2 Homogeneous Storage Costs 83 3.4.3 Heterogeneous Storage Costs 88
3.5 Distributed vs Centralised Approaches to Storage 92 3.6 Caching Algorithms for the Front End Server 96
3.6.1 Video Popularity Variation Model 97 3.6.2 Caching Algorithms 102 3.6.3 Performance of Caching Algorithms 104
3.7 Conclusion 108
4.1nteractive Video Server Design 111
4.1 Introduction 111 4.2 Storage Hierarchies 112 4.3 Disk Arrays 113
4.3.1 Reliability Problems and RAID 114 4.3.2 Striping in Disk Arrays 116
4.4 Cost of RAID 3 vs RAID 5 117 4.4.1 Throughput vs Block Size 118
4.5 Performability of RAID 3 vs RAID 5 127 4.5.1 Performance of Disk Arrays 128 4.5.2 Reliability of D+1 Disk Arrays 134 4.5.3 Performability 148
4.6 Case Studies 151 4.6.1 Effect of Disk Reliability 151 4.6.2 Maintenance Costs 152 4.6.3 Cost vs Revenue 154
4.7 Conclusion 156
5,Object Allocation for Disk Array Based Video Servers 158
5.1 Introduction 158 5.2 Homogeneous vs Heterogeneous Disk Arrays 159 5.3 Mathematical Description 162 5.4 Blocking Probability 164
5.4.1 Effect on Disk Array Throughput 167 5.5 Two Dimensional Vector Packing Analogy 169
5.5.1 Input Parameters 171 5.6 Upper and Lower Bounds 173 5.7 Heuristics 174
5.7.1 Review of Existing Bin Packing Heuristics 175 5.7.2 The Same-Shape-Biggest-First Heuristic 179
5.8 Case Studies 184
5.9 Conclusion 193

VIM
6.Call Admission Control for Disk Array Based Servers
6.1 Introduction 6.2 Operation of Coarse-Grained Disk Arrays 6.3 Simple CAC Scheme 6.4 Predictive CAC Scheme
6.4.1 Interactivity Considerations 6.4.2 Blocking Probability
6.5 Case Studies 6.5.1 No Interactivity 6.5.2 Interactivity Delay 6.5.3 Effect of Streams per Disk 6.5.4 Effect of Disks per Array 6.5.5 Effect of Level of Interactivity
6.6 Conclusion
7.Case Study: Interactive Video Network Design
7.1 Introduction 7.2 Design Methodology 7.3 Scenario Description and Constraints 7.4 Network Design and Cost Estimate 7.5 Performability Analysis 7.6 Throughput Analysis 7.7 Blocking and CAC Analysis 7.8 Disk Size Selection and Object Packing
7.8.1 Front-End Server 7.8.2 Core Video Server
7.9 Conclusion
8.Conclusion
8.1 Overview 8.2 Network Design 8.3 Server Design 8.4 Object Allocation 8.5 Admission Control 8.6 Design Methodology 8.7 Further Work
References
Appendix A.
Appendix B.
195
195 197 199 205 209 212 214 214 217 221 222 225 228
230
230 231 233 234 235 236 237 238 238 239 241
243
243 244 245 245 246 247 247
249
263
266
Appendix C. 272

IX
List of Figures
Figure Title Page
2.1 Typical frequency of hiring popular videos 14
2.2 M P E G frame temporal relationships 16
2.3 Generic interactive video network architecture 18
2.4 Network architecture and costs assumed by [Papa95] 22
2.5 Illustration of storage hierarchy for interactive video servers 28
2.6 The mechanical components of a disk drive (from [Ruem93]) 33
2.7 A comparison of fine and coarse grained striping 35
2.8 Illustration of various seeking schemes 41
2.9 Buffer trajectories for various seeking schemes 42
2.10 Differences between several region based block allocation schemes 47
2.11 Illustration of block division multiplexing of video streams. 48
2.12 Various levels of R A I D arrays 62
3.1 Bandwidth savings in core network by using caching 70
3.2 Disk cost vs capacity 77
3.3 Disk cost vs seek time 78
3.4 Cumulative distribution of video popularity 81
3.5 Empirical model of video popularity 82
3.6 Total storage cost vs selected disk capacity 84
3.7 Bandwidth and capacity utilisations 85
3.8 Bandwidth and capacity utilisation versus movie rank 86
3.9 Efficient operating points for various disk sizes 87
3.10 Selection of discrete disk sizes for individual movie objects. 90
3.11 Comparison of homogeneous and heterogeneous schemes 90

X
3.12 Storage cost vs percentage of requests served by FES 94
3.13 Life cycle of "River Wild" 97
3.14 Example output from algorithmic popularity model 99
3.15 Cumulative frequency of highest ranking achieved 101
3.16 Cumulative frequency of weeks in chart 101
3.17 Cumulative frequency of area under chart 102
3.18 Cache performance for various policies 105
3.19 Cache performance for slowly moving charts 107
3.20 Cache performance for rapidly moving charts 107
4.1 A disk array based video server architecture 113
4.2 Comparison of fine and coarse grained striping 117
4.3 Cost of R A I D 3 and R A I D 5 implementations 126
4.4 Cost of R A I D 3 and R A I D 5 disk and buffering 126
4.5 R A I D 3 maintains throughput after a single failure 129
4.6 Load on each disk in a R A I D 5 array is doubled after a failure 130
4.7 Viewers vs Time of Day 132
4.8 Markov Chain for array reliability 134
4.9 Probabilities of state obtained via simulation and analysis 140
4.10 General form of mechanical failure curves 141
4.11 Hazard and reliability curves of the Weibull model. 142
4.12 Probabilities of state for a range of Weibull distributions 144
4.13 Probabilities of state for a range of disk M T T F ' s and M T T R ' s 146
4.14 Example of reward earned for R A I D 3 and R A I D 5 150
4.15 Reward earned vs M T T F for throughput of 500 streams 152
4.16 Maintenance for a 3 year period for R A I D 3 and R A I D 5 153
4.17 Revenue earned and total cost difference vs streams supported 154
4.18 Revenue earned and total cost difference (ignoring buffering) vs
streams supported 156
5.1 Illustration of heterogeneous and homogeneous disk striping. 162
5.2 Comparison of models for blocking probability 168
5.3 Statistical multiplexing for various blocking probabilities 169
5.4 Allocating movies to a striping group with three disks 171
5.5 Probability density and distribution functions for movie length 173
5.6 Example packing obtained by F F G A R algorithm 181
5.7 High-level flowchart of SSBF packing heuristic 184
5.8 Improved packing performance of SSBF 185
5.9 Cumulative probabilities for (a) G(l,m,l,0) and (b) G(2,m,l,0) distribu
tions 188
5.10 Excess required and utilisation achieved by packing heuristics 189

XI
5.11 Excess required and utilisation achieved by various packing heuristics versus the number of objects packed 191
5.12 Comparison of packing efficiency vs number of objects selected as the biggest remaining objects 192
5.13 Execution time of various packing heuristics vs the number of objects packed. 193
6.1 Operation of a coarse-grained disk array. 199
6.2 Delay incurred by (a) a poorly balanced system, versus (b) a well bal
anced system 200
6.3 Distribution of number of active streams 202
6.4 Expected minimum and maximum loads on various size arrays 204
6.5 Delay and load for the Simple C A C scheme 205
6.6 Delaying a new request by one cycle to improve load balance 207
6.7 Predictive C A C algorithm 208
6.8 Delay and load for the Predictive C A C scheme 210
6.9 The operation of the predictive C A C scheme for admission and interac
tivity requests within a disk array based server 213
6.10 Blocking probability vs utilisation 214
6.11 Cumulative frequency of delay for each scheme 216
6.12 95th percentile of delay versus array utilisation for each scheme 217
6.13 Mean admission and interactivity delays 219
6.14 95th percentile admission and interactivity delays 221
6.15 Admission and interactivity delays vs streams served223
6.16 Admission and interactivity delays vs disks per array 224
6.17 Admission and interactivity delays vs disks per array-no blocking 225
6.18 Admission and interactivity delays vs level of interactivity. 227
7.1 Top-down design procedure for interactive video networks 233
A. 1 Optimisation of movie allocation example 265 A.2 Algorithm for heterogeneous disk array optimisation 266 B. 1 Mean admission and interactivity delay vs number of streams 268
B .2 95th percentile delays vs number of streams 269 B .3 Mean delays vs number of disks per array 270 B .4 95th percentile delays vs number of disks 271 B .5 Mean delay vs number of disks per array - no blocking 272 C. 1 Contour plots showing regions of feasible operation for admission and
interactivity delay constraints. 275 C.2 Feasible regions for loose call admission and interactivity delay con
straints 27 7

XII
List of Abbreviations
2DVP Two-Dimensional Vector Packing
ADSL Asymmetric Digital Subscriber Line
ARIA Australian Record Industry Association
ATM Asynchronous Transfer Mode
B-ISDN Broadband Integrated Services Digital Network
CAC Call Admission Control
CATV Community Antenna Television
CBR Constant Bit Rate
CDL Constant Data Length
CPE Customer Premises Equipment
CPU Central Processing Unit
CTL Constant Time Length
DASD Direct Access Storage Device
DAVIC Digital Audio-Visual Council
EDF Earliest Deadline First
FES Front End Server
FF First Fit (or Fast-Forward)
FFD First Fit Decreasing
GOP Group of Pictures
GSS Grouped Sweeping Scheme
HFC Hybrid Fibre Coax
IAL Interleaved Annular Layout
ITU-T International Telecommunication Union, Telecommunication Standardisation Sector
IVOD Interactive VOD
MPEG Motion Pictures Expert Group
MPEG-2-TS MPEG-2 Transport Stream
MTTF Mean Time To Fail
MTTR Mean Time To Repair
NVOD Near VOD

XIII
PCBR
PPV
QoS
QVOD
RAID
RAM
REW
SCSI
SSBF
STB
SVOD
TV
TVOD
VBR
VCR
VL
VOD
VS
Pseudo-CBR
Pay-Per-View
Quality Of Service
Quasi-VOD
Redundant Arrays of Inexpensive (or Independent) Disks
Random Access Memory
Rewind
Small Computer Systems Interface
Same Shape Biggest First
Set Top Box
Staggered V O D
Television
True V O D
Variable Bit Rate
Video Cassette Recorder
Video Library
Video-On-Demand
Video Server

Introduction 1
1. Introduction
Education is not the filling of a pail, but the lighting of afire.
- William Butler Yeats
1.1 Background
With the evolution of the Broadband Integrated Services Digital Net
work (B-ISDN), new telecommunications services are becorning via
ble. Although we cannot begin to imagine all the future services that
will be offered, it is true that many of them will require transmission
of multimedia with associated quality-of-service (QoS) guarantees.
Specifically, video data (with synchronised audio) will form a major
component of the traffic on future public cornmunication networks.
Further, it is likely that m u c h of this video information will be stored
and supplied to customers from remote video servers. This is distinct
from video data that is generated and consumed in real time as
would be the case in video-conference style applications. In this the
sis we are concerned with the efficient storage and transmission of
pre-recorded video in an interactive fashion to a large number of
users.
W e define interactive video services as those in which the user has
some degree of individual control over the content of the video being
received. The antithesis of this is the broadcast video services cur
rently available to most consumers around the world. The most com
m o n example of an interactive video application is Video-on-Demand
which can be readily thought of as a replacement for video rental

Introduction 2
stores. Video-on-Demand, however, is just one example of an appli
cation that requires interactive video services.
Numerous technologies have recently matured to make the provision
of interactive video services possible. As such the various difficulties
of providing interactive video services have typically been studied in
isolation, from the viewpoint of the technology concerned. It is one of
the goals of this thesis to present a unified discourse on the major
issues in interactive video provision while also providing important
contributions in several areas. Specifically the dissertation aims to
develop a methodology through which an interactive video network
can be designed that is efficient, effective and reliable.
1.2 Overview
This dissertation examines the important issues regarding the provi
sion of interactive video services in a public area broadband net
work. A preHminary examination of the topic reveals several
important areas for consideration. Video compression, storage tech
nologies, network architectures and protocols for ensuring QoS all
require investigation. In an attempt to provide a logical structure, a
top-down approach is used in this discourse. That is, high-level net
working concerns are considered first and used to identify important
areas of interest, before investigating the details of various compo
nents of the network architecture. A summary of each chapter is
presented next.
Chapter 2 presents a critical review of current efforts in supporting
interactive video, and identifies the shortcomings of some of the cur
rent work. This provides the motivation for the rest of the disserta
tion in which we take a unified approach to the problem of providing
interactive video services to a large customer population. Chapter 2
also serves as a survey of the technologies that are required to pro
vide interactive video services.

Introduction 3
Chapter 3 examines the network design problem. Specifically we
investigate the optimal dimensioning and placement of video servers
and caches within a large-scale network to ensure m a x i m u m cost
effectiveness. The output of Chapter 3 is a method of using distrib
uted storage with appropriate caching policies to minimise both stor
age and bandwidth costs within the network.
With a network architecture essentially in place, Chapter 4 examines
server design in order to determine the most efficient architecture
for video provision. W e examine hierarchical and disk based storage.
Specifically, performability analysis is used to compare the various
RAID (Redundant Arrays of Inexpensive Disks) options available in
the use of magnetic disk technology. Performability analysis is a
technique introduced to allow reliability and performance measures
to be considered jointly, and a review of relevant literature is pro
vided within Chapter 4. Further, this chapter presents and investi
gates the trade-off between reliability and blocking probability of
large disk arrays.
Given a server storage architecture and a set of video objects to be
served, Chapter 5 develops a placement policy for ensuring a mini
mal blocking probability for any user request. This problem is shown
to be analogous to existing work in operations research. Relevant lit
erature is reviewed and we compare our solutions with earlier pro
posals with favourable results.
Following the results of Chapters 4 and 5, Chapter 6 looks at the
problem of call-admission to a coarse-grained disk array. Analytical
and simulation methods reveal that the load is not inherently well-
balanced in a coarse-grained disk array. This poor balance can be
seen to manifest itself as highly variable delay to viewer admission
and interactivity requests. A call-admission control (CAC) scheme is
developed to improve this load balance and consequently reduce
admission delay for new requests and interactivity delay for existing
requests.

Introduction 4
Chapter 7 utilises techniques developed in earlier chapters to form a
logical design procedure for wide-area interactive video systems.
This original design process is illustrated by way of an extensive case
study.
Chapter 8 concludes the thesis with a summary of the major results
obtained in the earlier chapters.
The following table provides an illustration of how the major topics
discussed fit into a top-down approach, and also demonstrates the
different timescales at which each aspect would typically occur.
Table 1.1 Top-down structure of thesis
Aspect of Operation
Network Design
Server Design
Disk Array Design (Object Placement)
Admission Control
Timescale
10's of years
Years
Days/Weeks
Seconds/Minutes
Discussed in Chapter
3
4
5
6
1.3 Contributions
Below is a list of the major contributions of this thesis. Contribu
tions are sorted in approximate order of appearance, with section
numbers indicating where the point is first discussed in the thesis
and relevant publications also shown in parentheses. The fact that
the contributions span a number of diverse topic areas is a legacy of
the fact that interactive video systems are a direct result of the con
vergence of a number of maturing technologies.
1. Development of a cost model for magnetic disk drives based on a
large survey of current prices from a variety of manufacturers
(Section 3.3.1) ([Barn98]).
2. Accurate characterisation of Video-On-Demand workload based
on available statistical data from the literature (Section 3.4.1)
([Barn95b] [Barn96c]).

Introduction 5
3. Proposal of a heterogeneous storage system based entirely on disk
array technology (Section 3.4.3) ([Barn95a] [Barn96c]).
4. Cost analysis of distributed and centralised storage in a wide-area
interactive video network based on realistic network architecture
(Section 3.5) ([Barn95a] [Barn96c]).
5. Development and validation of an accurate model of the dynamics
of video popularity versus time (Section 3.6.1) ([Barn95b]).
6. Invention of appropriate caching algorithms to ensure cache cur
rency in distributed interactive video systems (Section 3.6.2)
([Barn95b]).
7. Modelling of sustainable throughput for RAID 3 and RAID 5 disk
arrays (Section 4.4.1) ([Barn96b][Barn98]).
8. Determination of minimum cost configuration for a disk array
given throughput and capacity constraints (Section 4.4.1)
([Barn96b][Barn98]).
9. Development of time-dependent reward structures for RAID 3 and
RAID 5 disk arrays which account for penalties due to disk failure
in a read-only environment (Section 4.5.1) ([Barn96b] [Barn98]).
lO.Development and solution of a three-state Markov chain for relia
bility of RAID disk arrays, accounting for single and multiple fail
ures and repair times (Section 4.5.2) ([Barn98]).
11.Relaxation of Markovian assumptions on reliability and demon
stration that the model is insensitive to such assumptions
(Section 4.5.2.1).
12.Integration of performance and reliability aspects of disk array
operation into a performability model suitable for evaluating reve
nue earning potential (Section 4.5.3) ([Barn98]).

Introduction 6
13.Demonstration that RAID 5 disk arrays are generally preferable to
RAID 3 by way of extensive cost versus revenue comparisons
(Section 4.6) ([Barn96b] [Barn98]).
14.Mathematical description of the video object allocation problem
and identification of the problem as a variant of the NP-hard two-
dimensional vector packing (2DVP) problem (Section 5.3)
([Barn96e]).
15.Derivation of the applicability of Erlang's B formula to accurately
model disk array blocking probability (Section 5.4).
16.Proposal and justification of a Gamma distributed model for
movie length distributions (Section 5.5.1).
17.Development of useful upper and lower bounds on the solution to
the 2DVP problem (Section 5.6).
18.Demonstration of the poor performance of existing heuristics for
solution of the 2DVP problem with appropriate input distributions
(Section 5.7.1) ([Barn96e] [Barn96d]).
19.Proposal of a new problem specific heuristic, Same-Shape-Big
gest-First (SSBF), for near optimal solution of the 2DVP problem
under appropriate assumptions for video object allocation
(Section 5.7.2) ([Barn96e] [Barn96d]).
20.Confirmation of the significant improvements afforded by SSBF
over previous heuristics (Section 5.8) ([Barn96d]).
21 .Demonstration that coarse-grained disk arrays exhibit significant
short-term load imbalance under conventional call-admission
control schemes (Section 6.3).
22.Demonstration that such load imbalance leads to unnecessarily
high call admission delay variation in large disk arrays
(Section 6.3) ([Barn96a] [Barn97]).

Introduction 7
23.Invention of a new "predictive" CAC scheme which utilises
detailed array state information to improve array load balance
(Section 6.4) ([Barn96a] [Barn97]).
24.Demonstration that the predictive CAC scheme reduces delay var
iance, and allows simple differentiation between admission and
interactivity requests, permitting different QoS levels for each
(Section 6.5) ([Barn97]).
25.Analysis of the sensitivity of the predictive CAC scheme to various
system parameters, including disk array size, disk throughput
and the level of user interactivity (Section 6.5).
26.Proposal and application of a top-down design methodology suita
ble for interactive video systems. (Section 7.2) ([Barn96d]).
1.4 Publications
Publications arising directly from work presented in this thesis are
listed below:
1.4.1 Journal Publications
S. A. Barnett, G. J. Anido, "A Cost Comparison of Distributed and
Centralised Approaches to Video On Demand", IEEE Journal on
Selected Areas in Communications, Volume 14 Number 6, August
1996.
S. A. Barnett, G. J. Anido, "Performability of Disk-Array Based Video
Servers", ACM/Springer-Verlag Multimedia Systems Journal, to
appear Volume 6 Number 2, 1998.
1.4.2 Conference Publications
S. A. Barnett, C. H. E. Stacey, G. J. Anido, H. W. P. Beadle, H. Brad-
low, "A Prototype Information Service Architecture in a Distributed

Introduction 8
ATM Environment", Proceedings of ATNAC '94, 5-7 December 1994,
Melbourne, Australia.
S. A. Barnett, G. J. Anido and H. W. P. Beadle, "Caching Policies in a
Distributed Video-On-Demand System", Proceedings of ATNAC'95,
11-13 December 1995, Sydney, Australia.
S. A. Barnett, G. J. Anido and H. W. P. Beadle, "A Storage Cost Anal
ysis of Video-On-Demand Architectures", Proceedings of ATNAC'95,
11-13 December 1995, Sydney, Australia.
S. A. Barnett, G. J. Anido, "An Efficient Non-Hierarchical Storage
System for Video Servers", In Proceedings of the Multimedia Japan
96 (International Symposium on Multimedia Systems). March 18-20,
1996, Yokohama, Japan.
S. A. Barnett, G. J. Anido, "Design of Large-Scale Interactive Multi
media systems", Networks 96, Sydney, Australia, November 1996.
S. A Barnett, G. J. Anido, "A Comparison of RAID Architectures for
Video Services", Proceedings of ATNAC'96, 3-6 December 1996, Mel
bourne, Australia.
S. A. Barnett, G. J. Anido, "A Call Admission Control Scheme for
Maintaining Load Balance in a Disk Array Based Video Server", Pro
ceedings of ATNAC'96, 3-6 December 1996, Melbourne, Australia.
S. A. Barnett, G. J. Anido and H. W. P. Beadle, "Predictive Call
Admission Control for a Disk Array Based Video Server", IS&T/SPIE
Symposium on Electronic Imaging: Science and Technology - Multi
media Computing and Networking 1997, February 8-14 1997, San
Jose, California, USA.

Review of Current Efforts in Interactive Video Delivery 9
2. Review of Current Efforts in Interactive Video Delivery
If fifty million people say a foolish thing, it is still a foolish thing.
- Anatole France
2.1 Introduction
The literature is replete with recent publications dealing with inter
active video delivery. The scope of these publications is broad, cover
ing topics from hypermedia and video-indexing to statistical
multiplexing gain and modelling of V B R video traffic. For the pur
poses of this thesis, the literature can be divided into two main cate
gories: networking issues and server issues. It is therefore
advantageous to divide the review presented in this chapter along
the same lines. Before presenting a critical review of recent litera
ture, however, we introduce interactive video services and describe
some of the important technologies that will be required for its deliv
ery (Section 2.2). In Section 2.3 we review networking aspects of
interactive video delivery before examining the current state of tech
nology in video servers in Section 2.4. Section 2.5 discusses trial
systems and Section 2.6 gives an overview of standardisation in the
area of interactive video. A summary of the chapter with regard to
the remainder of the thesis is presented in Section 2.7.

Review of Current Efforts in Interactive Video Delivery 1Q
2.2 Interactive Video Services and Technologies
Interactive video (or interactive TV) is a new service that gives con
sumers greater control over their program content than exists with
conventional television systems. The viewer is able to select from an
extensive range of video titles and affect the playback of these titles
with VCR like control. Such a service is now possible due to recent
advances in telecommunications and computing technology, com
bined with the convergence of the two.
To the consumer, interactive video will bring applications like Video-
On-Demand, Home-Shopping and Network Games. These applica
tions, along with a myriad of others will all be enabled by the same
interactive video systems which are currently under development.
The following sections define what interactive video services must
provide to the applications; example applications are discussed and
the enabling technologies for interactive video are introduced.
2.2.1 Definition of Interactive Video
First, an important distinction is made. We define interactive video
as a service. Such a service is used by applications, which are con
trolled by users. The interactive video service will be used by all
manner of applications in possibly quite different ways. Video-on-
demand, for example, will playback long movies with little interac
tion, while home-shopping will require short clips with potentially
high levels of interaction.
An interactive video system consists of three major components:
video servers, a network and a viewers terminal (commonly called a
Set-Top Box or STB) [Furh95]. Video material is stored on the server
(in a compressed digital format), transmitted across the network,
decoded by the STB and displayed on a standard TV. The video is
interactive since the customer controls the selection and start time
of the stream as well as performing interactive (VCR style) com
mands during playback.

Review of Current Efforts in Interactive Video Delivery 11
The precise nature of the interactivity required by viewers is still
largely unknown. Many market trials and surveys are currently
underway, attempting to ascertain data on this and other issues (see
Section 2.5.2). In the absence of such information, some assump
tions regarding the capabilities required of an interactive video serv
ice are required. An absolute minimum set of functionality that must
be enabled by any interactive video server would include:
• allow selection of a video clip of the customers choice from a large
selection
• commence playback of the selected video object within a short
time
• allow pausing of the current stream during playback and resump
tion of playback upon request
In order to provide a much more useful service, these basic abilities
should be augmented with search facilities such as:
• jumping to a random location within the current video stream
• fast-play in both forward and reverse directions within the cur
rent video (ideally this would be available at variable rates)
It should be noted that a DAVIC compliant device [Digi95] is required
to support all of these functions plus several others which are dis
cussed in more detail in Section 2.6.
Various levels of interactivity have been classified by several authors.
Generally they are classified in terms of the current most popular
application: Video-On-Demand (VOD). In [Chan94c], Chang et al.
use the terms IVOD (Interactive VOD), SVOD (Staggered VOD) and
NVOD (Near VOD) to classify various granularities of interactivity.
IVOD provides a dedicated stream per viewer and virtual VCR con
trol. SVOD generates streams at intervals of a few minutes and view
ers gain interactivity by jumping between streams. NVOD is a
coarser version of SVOD with streams generated at intervals
3 nnn9 03204534 1

Review of Current Efforts in Interactive Video Delivery 12
between 5 and 30 minutes. The authors of [Budd95] use a similar
three-level classification using the terms, dedicated viewing, shared
viewing with constraints and shared viewing respectively. [Delo94]
defines just two types of services (IVOD-i and IVOD-d), representing
instantaneous and delayed interactive VOD. These map into Chang
et al's IVOD and SVOD respectively.
In [Litt95] and [Gelm91] a five level classification scheme is intro
duced. We list them in order of increasing cost, starting with No-
V O D which corresponds to broadcast TV. The next level is pay-per-
view (PPV) where users are billed if they are watching but have no
control over the stream. Quasi-VOD (Q-VOD) services group custom
ers together based on the requested stream and start playback only
when the group is sufficiently large. Near V O D (N-VOD) starts
streams at regular intervals regardless of the number of customers.
Finally True-VOD (T-VOD) starts a stream immediately for each cus
tomer request. This is clearly the most expensive and most interac
tive option.
It is clear that the required level of interactivity of a video service is
poorly denned and as such it becomes difficult to compare different
video server designs that support interactivity to various extents.
The level to which interactivity is supported will be seen to have a
considerable effect on interactive video server design and system
cost.
2.2.2 Example Applications
Video-On-Demand, Home Shopping, Multiuser Games, Digital
Libraries and Pay-per-view TV are all applications that will use inter
active video services in some form. Undoubtedly the future will see
other applications which have not yet been conceived. The applica
tion that has captured the imagination to date has been described as
a replacement for video rental stores: Video-On-Demand.

Review of Current Efforts in Interactive Video Delivery 13
By storing and serving feature length movies across a public broad
band network it will be possible to obviate the need for video rental
stores. Video-On-Demand (VOD) is the application aimed at provid
ing this facility. V O D will be used as a case study throughout this
dissertation. V O D is a useful case study for interactive video for sev
eral reasons. Firstly, the concept is well developed and its require
ments are relatively well understood. Second, market research
shows this to be clearly the most popular potential application
among the general public [Ano95]. Finally, statistics are available
from video rental stores which will aid in the design of V O D applica
tions and hence interactive video services. Considering that a typical
video rental store contains about 10,000 different videos each of
which is on average 90 minutes long it becomes apparent that the
provision of V O D is far from trivial. Recent trials of appropriate tech
nologies have confirmed some of the difficulties in providing interac
tive video service to a large population.
A single feature length film requires at least 2 G B of storage when
compressed according to the MPEG-2 (Motion Pictures Experts
Group) standard (see Section 2.2.3). As such, an interactive video
server supporting V O D will require terabytes of storage if it is to
replace the local video store. Also a single video stream requires 3-
4Mbps of server and network bandwidth for its entire duration and
so the throughput required from a video server is also very high.
Since some video titles are more popular than others, this through
put requirement will be unevenly spread across the objects stored on
the server. By investigating the access patterns of videos from rental
stores we can gain useful insight into the problem of video server
and network design.
Statistics regarding the access patterns for videos at video rental
stores are scarce. However, from the few published figures available,
it is possible to gain an indication of the basic statistics of the hiring
process. In [Bure94] a pie chart is shown (reproduced in Figure 2.1)
which indicates the extreme skew in the distribution of movie popu-

Review of Current Efforts in Interactive Video Delivery 14
Top 20 Movies
Top 21-40 movies
Top 41-60 movies
Rest of the movies (thousands)
Figure 2.1 Typical frequency of hiring popular videos from video rental stores. Reproduced from [Bure94]
larity. Some authors have assumed even steeper skews with [Tetz96]
suggesting that 10-20% of requests could be for a single title.
Given that average video rental stores have of the order of 10,000
different titles on offer, it is clear that the distribution of movie popu
larity at any time is initially a rapidly decaying function with a very
long tail representing a large number of relatively unpopular titles.
This popularity distribution is commonly modelled by Zipf s Law (see
[Dan95a] [Nuss95] [Cher95b] [Chen95] [Wolf95]). This model is
largely based on the work of Chervenak [Cher94], who showed,
based on very limited data (one weeks video rental statistics), that
the popularity of the top 40 movies is fairly well matched by the Zipf
distribution. The extrapolation of this model to 1,000s of movies will
be shown in Chapter 3 to be invalid.
Other earlier authors use geometric distributions [Doga94b], trun
cated geometries [Bers94] or simpler piecewise linear models
[Ghaf94] [Tetz94]. In Chapter 3 we compare various approaches and

Review of Current Efforts in Interactive Video Delivery 15
develop a new model which is shown to be a better fit to the available
empirical data.
It is also important to realise that the popularity distribution for a
set of videos changes over time. New videos are released, current
popular videos lose popularity over time and others gain popularity.
With limited empirical data available on such temporal behaviour an
accurate model is difficult to define. In [Dan94c] the authors attempt
to model changing popularities by transforming a Zipf distribution
such that it is continuous and periodic. The distribution is then
rotated over time to effectively change the popularities of different
titles. [Wolf95] uses a weighted sum of four Zipf distributions with
the weightings changing with the time of day. As such this simulates
popularity fluctuation on short time scales, but not on longer time
scales. Neither of the above approaches has been shown to match
well with empirical data. In Chapter 3, we define an algorithmic
model for popularity change, which is shown to give good perform
ance when compared to empirical data.
2.2.3 Key Technologies
Many authors attribute the current interest in interactive video to
the concurrent maturity of several different technologies. Specifi
cally, video compression, high-bandwidth access network architec
tures, ATM switching, and magnetic storage technology (discussed
in Section 2.4.1 and 2.4.2) have all developed separately but can
now be integrated to provide interactive video services to the home
[Mino95].
2.2.3.1 Video Compression
Raw digitised video requires bandwidth on the order of 100 Mbps.
[Bers94] quotes figures ranging from 45Mbps for NTSC television to
800Mbps for HDTV. Fortunately, video is inherently highly redun
dant. By accounting for both spatial and temporal redundancies,
video compression algorithms are able to achieve compression ratios

Review of Current Efforts in Interactive Video Delivery 16
up to 40:1 (but not the 100:1 often cited). By far the most commonly
used video compression algorithm is MPEG [LeGa91], which has
been standardised for use in interactive video applications [Digi95].
MPEG-2 is designed to give VCR quality video at a bit rate of about
3-6Mbps [Dixi95].
MPEG video uses three different frame types to exploit much of the
temporal redundancy in video: I, P and B frames. I frames are intra-
coded, this means that they make no reference to other frames. P
frames are predictive and make use of information in the preceding I
(or P) frame to reconstruct the current image. B frames are bidirec
tional and use information from an I or P frame both before and after
the current frame to reconstruct the image. Figure 2.2 shows a
sequence of frames and illustrates their temporal dependencies.
Figure 2.2 MPEG frame temporal relationships
I frames are repeated periodically so that in the case of an error the
picture can be fully restored when the I frame arrives. The set of
frames lasting from one I frame to the frame before the next I frame
is called a Group of Pictures (GOP). A single GOP will generally
equate to between 1/2 and 2 seconds of video. Due to the varying
type or amount of compression used on each frame type (and at the
slice and macroblock levels), an MPEG stream is variable bit rate

Review of Current Efforts in Interactive Video Delivery 17
(VBR). Of course different content in each frame means that even
frames of the same type can differ considerably in size. As a guide,
however, the ratio of I:P:B frame sizes is approximately 4:2:1
[Chen94a]. To simplify transmission, techniques are available to
make the stream Constant Bit Rate (CBR) at the GOP level (ie.
Pseudo-CBR or PCBR [Chan94b]). These techniques rely on feedback
mechanisms which result in a variable quality output to ensure each
GOP is the same number of bits [Chan94a]. It should be noted that
even with open-loop VBR encoded video streams, the variability at
the GOP level is much lower than the variability in bit rates of indi
vidual frames. A useful discussion of MPEG statistics at various lev
els is provided in [Panc94].
Although not discussed here in any detail, MPEG-2 provides 'Trans
port Streams" which contain synchronised video, audio and data
streams. As such interactive video systems are only required to
transmit a single stream without concern for synchronisation
between streams. Efficient mechanisms for encapsulating Transport
Stream packets into ATM cells have also been investigated in
[Lin96b].
2.2.3.2 Access Network Architectures
Recent technological advances have seen broadband communication
to the home become a reality. The use of existing copper plant for
several megabits per second of downstream bandwidth has been
made possible by ADSL (Asymmetric Digital Subscriber Line) tech
nology [Chen94c]. Overcoming the upstream bandwidth limitation of
this ADSL are architectures such as Hybrid-Fibre Coax (HFC) which
is currently widely deployed for analog CATV networks. Numerous
other network technologies are also becoming cost effective. Even
radio technology has recently been proposed for residential area
broadband services [Celi96]. All of these architectures share the con
cept of separate access and backbone networks (Chan94c]. We
depict a generic network architecture in Figure 2.3 which highlights

Review of Current Efforts in Interactive Video Delivery 18
the requirement for a headend (or Front End Server (FES)) at the
junction of the core and access networks.
Figure 2.3 Generic interactive video network architecture
The generic network architecture of Figure 2.3 requires the use of a
Front-End Server which transfers the video signal from the core net
work to the access network. The precise function of this device is
dependent on the network technologies being employed but as a
minimum it will perform demultiplexing and physical layer conver
sions. Other functions may include billing, authentication, and
admission control. As such considerable functionality will certainly
be required at the FES [Chan94c]. This makes the FES an essential
network element independent of the networking technology or topol
ogy used.
Although assumptions can be made regarding the core and access
network topologies (as is done in [Nuss95] and [Papa95] (see
Section 2.3.2) in this thesis no such assumptions are made. The net-

Review of Current Efforts in Interactive Video Delivery 19
work analysis presented in Chapter 3 makes no assumptions
regarding the network, other than that concerning the existence of
FES's. Instead the analysis focuses on storage costs of various server
placement and dimensioning options. This makes the analysis
robust and ensures the validity of the results regardless of network
architecture.
2.2.3.3 Asynchronous Transfer Mode
In order to efficiently transmit different data types with highly varia
ble rate and QoS requirements an effective networking protocol is
required. It is almost universally accepted that Asynchronous Trans
fer Mode (ATM) will form the basis of the B-ISDN. A T M effectively
combines packet and circuit switching technologies to provide effi
cient transport for all manner of traffic. A T M transmits fixed-size
cells in a connection-oriented paradigm and employs statistical mul
tiplexing techniques to efficiently carry different traffic types. For a
useful introduction to A T M see [Boud92].
A T M provides several different service classes for different types of
traffic. The realtime V B R and C B R service types are most useful for
interactive video services since they provide a guarantee on delay
and jitter experienced by all cells in the stream. More details on serv
ice classes for interactive video can be found in [Rich95]. W e don't
provide any further consideration of A T M technology here as it is not
a focal point of this thesis.
It is clear that numerous technologies have now matured and con
verged to a point where interactive video services are viable. With a
basic understanding of these technologies in place we proceed in the
following sections to review the current efforts made toward making
such services an economical reality. W e begin with the network
design issues.

Review of Current Efforts in Interactive Video Delivery 20
2.3 Network Design Issues
Transmission of digital interactive video poses interesting problems
for network designers. Essentially, the problem is to transmit an
inherently variable bit rate stream with strict real-time constraints
while maintaining high network utilisation and predictable quality of
service to other traffic. The overall network topology is constrained
by technological factors as well as financial and geographical ones.
The current literature addresses these issues with varying degrees of
rigour.
Work on the design of interactive video networks can be divided into
two main categories. First, we consider the issue of transmitting var
iable-bit-rate video traffic over ATM links. Much work has been done
focusing on the multiplexing of MPEG video sources to obtain effi
cient utilisation of broadband network links. The second issue con
cerns server dimensioning and placement within the broadband
network. This work must consider the salient properties of interac
tive video when designing the network. We consider each issue in
turn.
2.3.1 VBR Video Transmission over ATM
The MPEG-2 video compression algorithm is capable of providing
VHS quality video with data rates of about 3-6Mbps [Dixi95]. It is
highly likely that a first generation of video servers will use this algo
rithm for storage and transmission of video streams.l As already
mentioned, ATM is the networking technology to be used for the B-
ISDN. As such, we require an efficient scheme for transmitting
MPEG-2 over ATM. Recent work [Lin96b] has defined an efficient
method of packing MPEG-2-TS packets into ATM cells for transmis
sion. The problem then becomes one of transporting these cells
across a network in compliance with a set of QoS requirements. Cur-
1. Note that in the remainder of this thesis we use the term "video" to refer to a combination of video and audio as is contained in MPEG-2 Transport Streams (MPEG-2-
TS).

Review of Current Efforts in Interactive Video Delivery 21
rently, many trial systems simply use peak-rate allocation which
would seem to be inefficient for the VBR nature of MPEG-2 data. In
academia there have been considerable efforts in VBR video model
ling in order to obtain statistical gains during transmission. [Aldr96],
[Kana94], [Habi96] and [Krun95] are representative of recent efforts
involved with the transmission of VBR video data over ATM style net
works. The issue of VBR video transmission is not a focus of this
thesis and so is not discussed here in any more detail.
2.3.2 Network Architectures for Interactive Video
Due to the high bandwidth requirements of digital video, the net
work architecture (and server placement) must be given careful con
sideration. As already seen in Figure 2.3 the network can be divided
into two basic sections: the core network and the access network.
Customers are connected to an access network. Individual access
networks are connected together by a core network with higher
capacity. In general, a customer will request information which is
stored in a server located somewhere "within" the core network.
Given such a network architecture we must consider how best to
locate and dimension our servers in order to rninimise cost. Some
authors have looked at this problem, but their work is flawed by
some unrealistic assumptions.
In [Loug94] a methodology is proposed for server placement and rep
lication which is analogous to the use of RAID in disk arrays.
Lougher et al. suggest the use of mirroring (where servers are dupli
cated around the network) or striping where each server only stores
a portion of each movie and they co-operate to serve a given request.
Such a scheme requires servers to be highly reliable since a single
server outage will result in all servers being unusable. Also many
connections will be required between users and servers, for the
retrieval of each video stream. This scheme is unnecessarily complex
and cannot be seen to give any significant advantages. Lougher et al.

Review of Current Efforts in Interactive Video Delivery 22
present no results to suggest that such a scheme is workable and as
such we ignore this proposal pending future work.
[Papa95] introduces the idea of a Personal Service Agent (PSA). A
PSA is a broker responsible for co-ordinating the retrieval and trans
mission of a video stream from a storage provider through a network
provider to the user. They then formulate an extremely unrealistic
distributed architecture and develop heuristics to serve user
requests at minimum cost. The authors assume a network structure
as shown in Figure 2.4.
Bandwidth costs decrease as we y^ proceed further down the tree
Users
Servers Costs
Si ^ Mm $0.1/hr
yr So /M
1
S3g
$1.0 \
Wk %V> ?/hr ^
$0.8 /
Ik / m $0.3/hr r
< ) v ) \ J U1 u2 u3
\ Storage costs increase a<5 W P nrnrppri fnrthpr
, down the tree.
Figure 2.4 Network architecture and costs assumed by [Papa95]
Note that the cost of a unit of storage increases as we descend the
graph toward the end user, while transmission cost decreases. These
assumptions are totally unjustified. Although transmission costs
may decrease closer to the access network, there is no reason to
believe that storage costs increase. Also the authors make no
attempt to model video popularity and instead assume that the PSA
has advanced knowledge of all future movie requests. Based on
these assumptions the authors heuristically solve the simplified
problem of determining the optimum caching schedule at the servers

Review of Current Efforts in Interactive Video Delivery 23
located at different levels of the graph. The solution is straightfor
ward, but unlikely to be useful in a realistic network scenario where
the author's assumptions will not hold. A more realistic model is to
assume that a fixed amount of storage will be available at each level
of the hierarchy and that it is best to use this storage as efficiently
as possible. It is this model that is used in Chapter 5 where efficient
solutions are developed.
In [Bisd95] and [Bisd96] the authors consider the case of a group of
video servers distributed around a network with a total storage suffi
cient to store all movies, but where each server can only store a sub
set of the complete set of movies. The problem then becomes one of
determining the optimal location of the different movies and how
best to allocate the available storage resources of each server. The
solution presented is to store multiple copies of popular movies,
while ensuring enough space is reserved to be able to store all the
movies somewhere. The authors go on to consider a tree structured
network with a large number of levels. Storing a movie lower in the
tree (closer to users) results in more copies being required (at least
one at each server at that level) but a decrease in bandwidth costs
since the movie is transmitted from lower in the network. The
authors correctly note that bandwidth requirements decrease line
arly, while storage requirements increase exponentially as we move
down the tree. They assume, without justification, that these
requirements are directly proportional to the associated costs in
both cases. By their own admission Bisdikian and Patel present only
limited, preliminary numerical results which indicate that consider
able storage should be located fairly low down in the network hierar
chy. This paper and the following one by Yoshida et al. both suffer
from a simplistic model of server cost which fails to account for the
combination of storage and bandwidth requirements of the video
server.
[Yosh96] is a recent study of object allocation to servers distributed
across a network. In a similar manner to [Papa95] and [Bisd95], the

Review of Current Efforts in Interactive Video Delivery 24
authors formulate a simplified problem and use mathematical pro
gramming and heuristic approaches to find solutions. In the case of
[Yosh96] for example, total system cost is represented by a single
coefficient (C) multiplied by the number of video objects stored
within servers around the network. For the case studies presented,
C is arbitrarily assigned a value of 10. No effort is made to account
for individual object sizes or popularities, or the physical nature of
the storage provision within each server. Despite the unrealistic cost
models used, the results of [Yosh96] tend to indicate that small
caches should be distributed around the network, located as close to
customer populations as possible.
[Nuss95] provides a detailed discussion of networking requirements
for interactive video. Nussbaumer et al. derive analytic models for
cost of servers and links in a tree structured network. Assuming a
Zipf distribution of movie popularity they study the placement of
caching within different levels of the hierarchy. Results show that
over a wide range of parameters, caching at a level of about 8 0 % of
the depth of the tree is optimal. This is said to correspond to just
above the head-end. The analysis presented in [Nuss95], however,
assumes that video server cost is directly proportional to the total
popularity of the movies being stored. They make this assumption
despite the recognition that the cost of a server is related to both the
number of movies stored and their relative popularities. Although
the cost function used by Nussbaumer et al. may apply if the system
is bandwidth limited, the authors make no effort to show that this is
the case. Further, an appropriate model of disk cost (where cost is a
concave function of disk capacity) would have further altered the
cost model and hence the results seen in [Nuss95]. This work is con
sidered in more detail in Chapter 3 where a more appropriate cost
model is proposed.
It is clear that previous literature has approached the problem of
network dimensioning and server placement from various directions.
All approaches, however, feature some form of cost model for storage

Review of Current Efforts in Interactive Video Delivery 25
and/or bandwidth. In Chapter 3, we use a more detailed model of
server cost (one based on a physically realisable model of server
architecture) to perform a similar analysis to that of Nussbaumer et
al. The analysis is, however also unique in that no assumptions are
made regarding physical network structure (other than the existence
of core and access networks). Further, demand and change in
demand are modelled more accurately than is done in [Nuss95], as
well as incorporating bandwidth and storage costs along with a vali
dated model of disk cost.
Having considered network design issues, we proceed to now con
sider a subset of the myriad of server design issues.
2.4 Server Design Issues
Video servers are the source of video data which is then transmitted
across a wide-area network. Applications such as those identified in
Section 2.2.2 rely on these servers to provide real-time video content
to customers. In a large network the quantity of video traffic that will
be supplied by these servers will be immense. In effect a video server
is a massive I/O machine capable of sustaining many megabytes per
second throughput with rninimal delay or jitter. The problems asso
ciated with constructing such a server and making it cost effective
are many. Much literature is currently appearing dealing with each
of these problems, normally in an isolated manner.
The overwhelming theme in this literature is that the area of video
servers is yet to mature with fundamental results still being pro
duced. Papers are currently appearing with such frequency that it is
difficult for each to fully account for work contained in the others. As
a result we see similar ideas developed concurrently with slightly dif
ferent emphases. This section aims to unify this constantly expand
ing body of knowledge by identifying the major options for different
aspects of video server design. It becomes clear that there are several

Review of Current Efforts in Interactive Video Delivery 26
fundamental choices to be made in video server design and with
thorough reference to the literature we compare these choices and
identify key trade-offs with each. It should be noted that the trend of
considering interactive video in terms of the video-on-demand appli
cation is followed, although most of the results presented can be
generalised to other interactive systems.
A design brief for an interactive video server is quite concise. Essen
tially, it must store and serve a large number of videos to a large
customer population with real-time constraints. More verbosely, a
video server must:
• store a large number of objects (videos) each of which, after com
pression still occupies in the order of two gigabytes of storage.
• retrieve these objects independently to a large number of custom
ers with strict real-time constraints.
• support interactivity in the form of random searches, pauses and
other requests.
• respond to user requests with a minimum delay
• be reliable and dimensioned to be highly available to the viewing
population (ie. guarantee a low blocking probability)
• cost little enough to enable a rapid and widespread penetration
into a large proportion of the market
One aspect that has a major effect on server design is interactivity.
The type and quality of interactivity dictates many aspects of server
design. As will be shown, m u c h of the literature ignores interactivity
issues altogether. Perhaps this is because the interactivity require
ments of users are currently not well understood and as such it is
difficult to design servers in the most efficient manner. Throughout
the remainder of this chapter we will illustrate where interactivity
requirements effect server design.

Review of Current Efforts in Interactive Video Delivery 27
As already discussed in Section 2.2.2 a set of video objects will
exhibit an extreme locality of reference, whereby a small number of
items constitute a large number of requests. In order to meet the cri
teria set out above with such a varying popularity function, clearly a
video server must be able to allocate bandwidth resources depend
ent on the demand for a particular object and independent of other
demands. The server must also be able to vary this allocation over
time in response to changes in movie popularity.
When we consider that the most popular movie may be requested
concurrently by hundreds of users we clearly require a storage sub
system with extremely high bandwidth availability2. At the other end
of the scale we have the least popular movies, which although
requiring basically the same storage capacity, are hardly ever
requested and as such require very little bandwidth. This realisation
immediately prompts the idea of a storage hierarchy in order to meet
the highly variable demands for bandwidth for different objects.
2.4.1 Storage Hierarchies for Interactive Video
The discussion above has shown that Video-on-Demand applica
tions will generate widely varying access rates for different objects. It
is reasonable to believe that this will also be the case for other inter
active video applications. As such an interactive video server must
be able to efficiently handle objects with similar capacity require
ments but very different bandwidth requirements.
It is intuitively pleasing to use a storage hierarchy to satisfy this var
iation in demand. A storage hierarchy would consist of various dif
ferent types of storage chosen to cater for the bandwidth
requirements of the objects being stored in it. In other words popular
movies can be stored in fast storage (RAM), less popular movies
stored on magnetic disk or optical disk, while very unpopular movies
2. Note that in True-VOD every customer request translates directly to an extra stream of bandwidth. With other levels of service this can be reduced (refer to Section 2.4.6 for more details).

Review of Current Efforts in Interactive Video Delivery 28
could be archived on tape. [Bure95] presents a useful discussion of
different storage media and their position in a storage hierarchy
determined according to access speed and cost per unit of storage.
Figure 2.5 illustrates the concept of storing movies at different levels
of the hierarchy according to popularity.
Figure 2.5 Illustration of storage hierarchy for interactive video servers
The literature abounds with proposals and analyses of such hierar
chical storage systems in a number of different forms. W e consider
each device in turn.
2.4.1.1 Magnetic Tape
Tape systems exhibit the lowest cost per megabyte of storage and as
such make an attractive option for archival storage of large bodies of
data [Cher95b] [Keet94]. High-end tape systems also exhibit reason
able sustained bandwidth but interactivity is poor due to the
sequential nature of the medium and delay can be high if robots are
used to load the requested tape. Pipelining mechanisms are pro
posed in [Ghan95a] and [Lau95b] with the aim of decreasing interac
tivity delays. Although such schemes can clearly provide lower
delays, it is at the cost of more wasted time spent in tape swapping
and consequently a lower utilisation of the system for reading.
[Doga94b] proposes the use of "staging" disks which act a a smooth
ing buffer between the tape drives and the client playout buffers.
They also propose the use of "leading" disks which allow immediate

Review of Current Efforts in Interactive Video Delivery 29
start by storing the beginning of each title on disk and retrieving the
remainder from tape once playback has commenced. These schemes
ameliorate some of the problems of tape based multimedia but
increase total system costs.
2.4.1.2 Optical Disks
The use of optical disks for real-time audio retrieval is considered in
[Yu89], but since the mechanical characteristics of such devices are
similar to magnetic disks and their bandwidth is considerably infe
rior they are not often considered for use in interactive video sys
tems. A cost analysis of optical disks has been performed by both
[Keet94] and [Cher95a] with agreement in the conclusion that they
cannot be efficiently used in high-demand interactive video applica
tions.
2.4.1.3 Magnetic Disk
Magnetic disk is universally agreed upon as a most suitable storage
medium for interactive video applications. Magnetic disks are not
inherently well-suited to such strictly real-time applications, but
solutions are available that minimise the problems. We consider the
issues involved and proposed schemes for the use of magnetic disks
(and disk arrays) in Section 2.4.2. Since disks are available with var
ying sizes and bandwidths it is possible to create a storage hierarchy
using disk technology alone. This idea is first proposed by us in
[Barn95a] [Barn96c] and is presented in detail in Chapter 3.
2.4.1.4 Random Access Memory
The use of RAM for extremely popular requests has been suggested
by numerous authors. [Doga94b] for example suggests that if a mov
ies popularity is more than 144 times its length it should be stored
in RAM. Of course this figure is heavily dependent on the assumed
cost and characteristics of each medium. Similarly, [Stol95] deter
mines an appropriate cutoff between disk and RAM for popular

Review of Current Efforts in Interactive Video Delivery 30
titles. [Tetz94] also suggests that in time random access memory will
be a necessary part of the interactive video storage hierarchy. Work
by others (including Dan et al. in [Dan94c]) draws the opposite con
clusion that RAM is never an economical solution for storing entire
movies. In Chapter 5 we will present results based on disk array
based storage that form a fundamental argument against the need
for R A M for storing entire movies.
2.4.1.5 Evaluation of Hierarchical Systems
A consensus on the design of the storage system in a video server is
far from being reached. Magnetic disks will most certainly feature in
the hierarchy. Optical disks will probably not be used, at least until
the current drives improve considerably. Tape and RAM each have
proponents and opponents. Several authors state (without proof)
that disk is too expensive to provide the entire storage requirements
of an interactive video server [Cher94]. As such tape is commonly
assumed to exist in the storage system [Lau95b] [Lau96] [Ghan95a].
In general the studies analysing the cost of hierarchical systems
have, to date, been unrealistic. This section reviews the existing lit
erature in this area.
When providing interactive services it is the cost per stream that
must be ininimised [Cher95a]. This is because customers will be
charged for the bandwidth they consume, not based on the number
of objects held on any particular server. A low cost per unit of stor
age does not necessarily translate to a low cost per stream. Once this
realisation is made it is no longer obvious that tape based systems
provide economical advantages. Indeed Tetzlaff et al. presents a sim
ple framework for the comparison of various storage systems which
illustrates the importance of considering the cost per stream as a fig
ure of merit [Tetz94]. Using some simplifying assumptions, Tetzlaff
et al. develop a simple analytic expression to determine the number
of storage devices required in a given multimedia server. Using this
model they evaluate several storage approaches based on the cost

Review of Current Efforts in Interactive Video Delivery 31
per stream. Tetzlaff concludes that RAM will have a place within the
storage hierarchy for interactive video, but due to the high cost per
stream, current tape systems are not a viable alternative.
A tool for cost estimation of hierarchical storage servers has been
developed by Doganata and Tantawi [Doga95] based on work pre
sented in [Doga94b] and [Doga94a]. This tool uses simple analytic
models to determine the optimal division of movies to levels of the
storage hierarchy. The assumptions and models used are quite
unrefined and as such potentially inaccurate. Particularly, tape
drives are assumed to be non-blocking; implying that a tape drive is
always available for a new request. In an overdimensioned system
this may be true, but given the high cost of tape drives, queueing will
take place and increase the predicted delays.
In her PhD thesis [Cher94], Chervenak evaluates video-on-demand
as a potential application of tertiary storage. Also, in [Cher95a] the
authors compare disk arrays (or farms) with an hierarchical system
using a discrete-event simulation. Although only basic designs of
each system are simulated, the models appear quite valid and incor
porate realistic cost estimates of the various devices. The conclusion
reached is that neither tape drives nor optical disks can be employed
in real-time multimedia servers in a cost effective manner.
Keeton et al. [Keet94] presents a similar simulation study and draws
the same conclusion. That is, that tape based systems do not pro
vide sufficient throughput to be economically justifiable in a large-
scale interactive video server.
Of course all of the above results are highly dependent on the
assumptions made concerning the cost and performance of the vari
ous devices. The rapidly changing and highly variable costs of such
devices make these results difficult to generalise, and as will be seen
in Chapter 3 this continues to be the case, with any cost model being
almost immediately out of date.

Review of Current Efforts in Interactive Video Delivery 32
As already mentioned, a consensus on the utility of hierarchical
storage is yet to be reached. Given that magnetic disk technology is
required in any interactive video server, we focus (as does the litera
ture) on the adaptation of this technology to such a real-time service.
Indeed it will be proposed (in Chapter 4) that disk technology can be
used for the entire storage system in an economical fashion. None of
the current research has conclusively shown that hierarchical sys
tems can achieve such a goal.
In the next section we consider disks and disk arrays and the litera
ture concerning their use for real-time storage and retrieval. A large
focus of the remainder of this thesis is aimed at showing that disks
can be used to meet the entirety of storage requirements in a video
server.
2.4.2 Disk Arrays for Video Service
All previous work discussing video servers recommends the use of
disk arrays in some form, in the storage hierarchy. Although disks
have limitations in real-time applications, they currently seem to
provide the best trade-off between cost, capacity and throughput.
This section introduces the basic consideration of using disk arrays
to serve real-time video. We start with a general discussion of disk
technology. The following sections discuss some of the active
research in this area.
Magnetic disks3 have long been the dominant form of mass storage
in computer systems. For most systems they provide a suitable bal
ance of high throughput and low cost per bit as well as small physi
cal size. Ruemmler and Wilkes provide an excellent discussion of
magnetic disk technology and of appropriate models to be used to
determine the performance of disk drives in various environments
[Ruem93] [Ruem94].
3. The terms magnetic disk, hard disk, and disk drive are all used synonymously in this thesis.

Review of Current Efforts in Interactive Video Delivery 33
A typical disk drive will consist of several platters all attached to a
c o m m o n spindle which rotates at a fixed speed. Each platter surface
has an associated disk head that is responsible for both reading and
writing of data. All disk heads are moved synchronously with only
one head actively reading at any time. Each platter is divided into a
large number of concentric circles called tracks. (Each track is fur
ther divided into sectors). The corresponding tracks on all surfaces
form a cylinder. The drive reads from different tracks within a cylin
der, without moving the heads, by performing a head switch. A n
illustration of a hard disk is shown in Figure 2.64.
Figure 2.6 The mechanical components of a disk drive (from [Ruem93])
W h e n a request is serviced by a disk, the following sequence of
events takes place:
• the heads seek to the appropriate track of the disk (a seek con
sists of four phases: speed-up, coast, slow-down and settle)
• once the heads have settled the disk rotates until the appropriate
sector is under the head and then reading takes place
4. Although not illustrated in the figure, most modern disks have more sectors per track at the outside of the disk, than at the inside. Since angular velocity is constant, this results in a higher data rate from the outside tracks than the inside.

Review of Current Efforts in Interactive Video Delivery 34
• the head continues transferring data until the request is complete
or until if reaches the end of the track.
• At the end of a track it will perform a head switch to read the next
track in the cylinder, once a cylinder is exhausted it will seek to
the next track to continue serving the request.
In order to increase capacity and throughput, individual disks can
be combined together in arrays. Disk arrays are essentially just
groups of individual disks. Data is placed across all the disks in the
array using various forms of "striping". By striping the data across a
set of disks we can gain a dramatic increase in disk bandwidth as
well as capacity. If there are D disks in the array an idealised
increase of up to D times the bandwidth and D times the capacity is
possible. Disk arrays have the inherent problem of decreased relia
bility which quickly prompted the idea of Redundant Arrays of Inex
pensive5 Disks (RAID) [Patt88]. RAID uses additional redundant
disks to increase the overall reliability of the RAID system in the
event of a disk failure.
We postpone the discussion of the reliability aspects of RAID arrays
until Section 2.4.7. Here, we discuss the fundamental choices of
data placement on disk arrays. There are essentially two ways to
stripe data across a set of disks: fine-grained and coarse-grained
striping [Gang94]. Both forms of striping involve placing sections of
an object on each of the disks in the array. The difference is in the
size of the sections, and the service policy. Refer to Figure 2.7.
Fine-grained striping is otherwise known as bit or byte level striping.
Data is striped in very small sections across disks and requests are
serviced in parallel by all the disks in the array. This implies that
every disk in the array contains a fraction of every accessible block.
When a request is received by the disk array, all disks act in a syn-
5. Note that "Independent" (or even "Individual" [Frie96]) now commonly replaces "Inexpensive" in the RAID acronym.

Review of Current Efforts in Interactive Video Delivery 35
chronised fashion to retrieve the request, with each disk retrieving
1/D of the request.
Coarse-grained striping allocates larger blocks of each object to each
disk in a round robin fashion. Hence, a large request will be served
by accessing each disk in succession, while smaller requests are sat
isfied by a request to a single disk of the array.
Fine Grained Striping
Array Controller
Clients
Coarse Grained Striping
Array Controller
Clients
Figure 2.7 A comparison of fine and coarse grained striping in disk arrays with 3 disks serving a total of 3 requests in each case
Fine-grained striping gives a higher throughput for each individual
request (ideally by a factor of D, although this is unobtainable), while
coarse-grained striping shares the load over a large number of disks

Review of Current Efforts in Interactive Video Delivery 36
and hence potentially reduces the waiting time of a request in a typ
ical system. Note, however, that even for a single disk, the time to
retrieve a video block is lower than the playout time. As such an
increased data transfer rate per request (as provided by fine-grained
striping) is not required in interactive video systems. There are, how
ever, other trade-offs between the two techniques.
Fine-grained striping can be seen to provide a high degree of paral
lelism while coarse-grained gives high concurrency. Parallelism
means that all disks are cooperating to serve each request, but only
one request is served at a time. Concurrency implies that several
requests are being served simultaneously, but at a lower rate.
[Keet95] investigates this trade-off in the context of scalable video
storage. A simulation study concludes that for light loads fine
grained striping is preferable, while during heavy loads the coarse
grained, highly concurrent approach performs better. [Seo95] com
pares concurrent versus parallel layout policies for data streams
which require synchronisation (eg. audio and video). They draw a
similar conclusion to [Keet95]: that concurrent approaches are pref
erable in cases of high load. These results can be validated by com
paring single multiserver queues (which represent coarse-grained
arrays) with single server queues with a suitably increased service
rate (fine-grained arrays). It is easy to show that under high loads a
highly concurrent approach is better in terms of delay. At low loads
we can expect lower delays with a parallel approach. More detail is
presented on this idea in Chapter 4. [Gang94] notes that fine
grained striping is generally best employed in environments where
transfer time dominates seek times. This implies that large video
blocks must be transferred to maintain high efficiency in these
arrays. Large blocks directly translate to large playout buffers.
Coarse-grained striping does not impose this problem, since each
video block is stored on only one disk. [Ng89] reaffirms this point but
fails to present thorough quantitative results regarding the trade
offs between fine and coarse-grained striping in an interactive video

Review of Current Efforts in Interactive Video Delivery 37
environment. The significant oversight of each of the above works is
that they don't adequately account for the requirement of redun
dancy in disk arrays, which significantly affects performance.
Redundancy considerations present in RAID arrays add a level of
complexity not considered in the comparisons discussed above. In
Section 2.4.7 it will be seen that RAID 3 and RAID 5 systems use
fine and coarse grained striping respectively, combined with redun
dancy to provide high capacity and throughput as well as system
reliability. In Chapter 4, we develop analytical expressions, based on
performability analysis, which accurately compare the trade-offs
between fine and coarse-grained striping including the effects of
redundancy.
There is actually a continuum of layouts between the limits of fine
and coarse grained striping. In [Paek95] the authors present a dis
cussion of a scheme referred to as multiple segmentation. This paper
refers to fine-grained striping as balanced placement (all disks serv
ice each request), and coarse-grained striping as periodic placement
(one disk services each request in round robin fashion). Multiple
segmentation divides each video block into a variable number of seg
ments for storage on the disk array. The number of segments dic
tates the degree of parallelism of retrieval. In an 8 disk array the
segmentation can be 1 (coarse grained), 2, 4 or 8 (fine-grained). By
considering this continuum the authors show that there is a trade
off between delay and interactivity. Fewer segments give higher disk
utilisation, but also result in greater delays for interactivity. More
segments decrease the disk utilisation (due to smaller block sizes)
but reduce the worst-case delay for interactivity. Unfortunately a
detailed analysis is not presented in this paper and the average case
performance of the schemes are not compared. The authors suggest
that the appropriate number of segments can be chosen based on
the demand and interactivity requirements of a particular video
object. They state that different videos can be segmented differently,
but don't consider what effect this will have on the scheduling algo-

Review of Current Efforts in Interactive Video Delivery 38
rithms used for each disk, the memory management routines, or on
the call-admission control scheme required. Considerably more work
is required before such a scheme can be deemed workable.
A similar scheme called Staggered Striping is presented in [Bers94].
This scheme is promoted primarily for systems where the bandwidth
requirement of a single stream exceeds the bandwidth capability of a
disk. By using several disks of an array in parallel, the aggregate
bandwidth can be increased to satisfy these high bandwidth
streams. In the vast majority of cases, however, the stream data rate
will be considerably less than the capability of a single disk (3-
6Mbps for MPEG compressed video, while a single magnetic disk can
sustain bandwidths of at least 20Mbps, see Chapter 4) and as such
these schemes are not considered further here.
An important consideration is the limit on the number of disks in
each array. Currently this is largely dictated by the interconnection
technologies used to connect the individual drives (eg. SCSI systems
have a very limited bandwidth of 20MB/sec). New technologies such
as ATM are, however, now being applied in the local environment
[Hayt91] [Hayt93] [Chan95]. These scalable technologies will remove
this constraint and as such it is assumed in this thesis that very
large disk arrays (on the order of 100 disks) will be feasible in the
near future [Mour96]. The size of such arrays will then be dictated
by reliability constraints as discussed in Chapter 4.
Regardless of whether coarse or fine-grained striping is used, each
disk in an array operates similarly. In either case, each disk has a
set of requests to service within a given period of time to ensure that
continuity requirements are met. In the following section we discuss
methods to ensure that such constraints are guaranteed. The dis
cussion is based on a single disk, but applies equally to the entire
array.

Review of Current Efforts in Interactive Video Delivery 39
2.4.3 Disk Layout and Scheduling
When attempting to serve interactive video from magnetic disks we
must consider first how to place the data on the disk, and second
how to schedule its retrieval. It soon becomes apparent that these
two considerations are closely related (although the mapping is not
unique), and as such we discuss them in combination in this sec
tion.
Disks are mechanical devices and as such request service times are
difficult to accurately predict. The time to service a given request
depends on the size of the request, it's location, and the current
location of the disk heads. In order to serve interactive video we
must ensure that requests are serviced within some time constraint
to ensure continuity of playback to the customer. A number of tech
niques are available to guarantee that service deadlines are either
deterministicalfy or statistically guaranteed.
Magnetic disk drives typically have a considerably higher bandwidth
than compressed video streams require (refer to Section 2.4.2). As
such a single magnetic disk should be capable of serving several
separate streams to clients. Even if a disk only stores one video
object (eg. movie) it is required to be able to serve multiple instances
shifted in time (or phases). In other words a single disk will be time-
multiplexed among a number of streams.
It is infeasible to serve an entire movie to a client at the maximum
disk rate. This will require massive buffers at the client, and cause
long queueing delays to other requests. As such video must be
stored and served in small "video blocks" each of which can be buff
ered at the client before playout. The next block should not be
retrieved from disk until the previous block has almost completed
playout.
Compressed video is inherently variable bit rate (VBR). As such a
fixed block size will have a variable duration of playback. We thus

Review of Current Efforts in Interactive Video Delivery 40
have a choice of Constant Data Length (CDL) or Constant Time
Length (CTL) video blocks [Chan94b]. CDL storage uses a constant
block size resulting in straightforward memory management and
block placement on disks. The ensuing variability in playout time,
however, means that CDL placement requires complex disk schedul
ing algorithms and cannot guarantee jitter-free video delivery
[Chan94b]. CTL blocks vary in size making allocation more difficult,
but playback for a fixed time, simplifying disk scheduling. For the
fundamentally read-only environment of video-on-demand, CTL
storage is generally considered to be preferable since it affords more
efficient scheduling of the disk head movement. CDL, however, has
the advantage of minimising fragmentation problems when data is
frequently being modified. The trade-offs between CTL and CDL are
well considered in [Chen95] and [Chan96a].
Regardless of whether CTL or CDL blocks are used, the block sizes
will be relatively small in order to minimise the buffering require
ments both within the video server and at the client. As such, a sin
gle disk will be multiplexed between requests on a fairly short time
scale. There are a number of approaches to achieving this multiplex
ing, each of which will be discussed in some detail below. A good
survey of disk scheduling algorithms for multimedia is presented in
[SteI95].
2.4.3.1 Basic Approach
To retrieve several different blocks from a disk, the heads must seek
from one block to the next before retrieval. The most obvious, and
least efficient, technique for multiplexing disk heads among a
number of requests is to move the disk heads to the location of each
video block in order of request arrival (ie. effectively random order).
Given a random set of requests, the disk heads will simply move to
the correct location, read the video block and move to the next block.
Figure 2.8 (a), illustrates the idea. Note that in this instance the
video blocks are being served in no particular order (since request

Review of Current Efforts in Interactive Video Delivery 41
order m a y change) from one round to the next. Hence we observe a
large inefficiency both in terms of seek overhead and buffer require
ments.
Total Time
tr
a) Basic 132 327
219 328 607
Service Order
Seek (tracks)
2H|]- | 2,1,4,3 1355
785 834
T|—| 3,2,1,4 1004
835
tr
b) SCAN
tc _A Round C) Robin
ti
to Grouped Sweeping
') Scheme (2 Groups)
ti
jT]-j][]—| 4,1,2,3 702
| } — | 3,4,1,2 616
fj-QF]—| 1,2,3,4 1209
3}—| 1, 2, 3, 4 953
2 ] - ^ ] — | 1,2,3,4 1209
3}—| 2,1,4,3 616
xj x = request number y y = cylinder location
Figure 2.8 Illustration of various seeking schemes, a) Basic, b) SCAN scheduling to minimise seeking c) Round Robin scheduling to minimise buffering d) Grouped Sweeping Scheme minimises buffering and seeking jointly
It is clear that there are two aspects that require optimisation: seek
time and buffer requirements.

Review of Current Efforts in Interactive Video Delivery 42
Buffer Level 2B-
a) SCAN
B
to Buffer Level 4
B
. Round °> Robin
Buffer Level A 3 B / 2 —
c) Grouped Sweeping Scheme
(2 Groups)
Service Period
Playout cannot commence until ^ to prevent starvation
Playout commences following read completion
Playout commences attime^+to)^
Time
Time
Must be read before (t2+t-|)/2 according to G S S
Time
Figure 2.9 Buffer trajectories for a) SCAN b) Round Robin c) Grouped Sweeping Scheme (refer to [Toba93] for more detail)

Review of Current Efforts in Interactive Video Delivery 43
2.4.3.2 Seek Optimising Schemes
These schemes service requests in cycles and aim to schedule the
head movement so as to minimise the total seek time. The most com
mon cycle based algorithm is the SCAN algorithm [Stei95] and varia
tions of this (eg. C-SCAN [Wong94]). Using SCAN, the maximum total
seek distance per round is limited to the number of cylinders on the
disk. It is shown in [Wong94] and separately in [Oyan94b] that the
maximum seek time occurs when the blocks to be retrieved are
evenly spaced from the inner to the outermost cylinders. This is due
to the concave relationship between seek time and seek distance
measured in cylinders. The disadvantage of the SCAN algorithm is
that a stream that was served first during one round may be served
last during the next. Figure 2.8 (b) illustrates this idea, with stream
3 being served at the end of round 0 and again immediately at the
beginning of round 1. This can occur regularly depending on the
disk layout used, or with intelligent layout may be limited to when a
user relocates to a different position in the video. To cope with this
re-ordering of streams double buffering is required, ie a total of two
times the video block size of buffering is needed per user [Wong94]
[Sona95]. This buffer requirement is illustrated in Figure 2.9(a).
From Figure 2.8 (b) we also observe that the tracks in the centre of
the disk are served more frequently than those at the outside. It is
for this reason that placing popular material in the middle tracks as
suggested by [Pang96], results in higher throughput since we are
almost guaranteed to be crossing the middle tracks on every sweep.
The double buffering requirement incurred by serving streams in dif
ferent orders in each service round can be removed by using
schemes which maintain the order of service between cycles. These
schemes will result in reduced buffer requirements, at the expense
of higher seek overheads.

Review of Current Efforts in Interactive Video Delivery 44
2.4.3.3 Buffer Optimising Schemes
Round robin schemes keep the service order constant during each
cycle. This minimises the buffer requirement per stream, since play
out can commence immediately a data block has finished reading
(see Figure 2.9(b)). The disadvantage is that seek schedules may no
longer be optimal. In an absolute worst case the heads may have to
perform a full stroke for every request. This will result in potentially
very poor disk utilisation. Figure 2.8 (c) shows the seek schedule
required by round robin schemes to keep the service order constant
between cycles.
[Rang93], [Vin93], [Chan94b] and [Loug92] all assume worst case
seek times between requests, which implies round-robin scheduling.
None of these papers, however, presents it as being necessary for
optimising buffer requirements.
Earliest-Deadline First is a variant of the round-robin algorithm
adapted from CPU scheduling. As stated in [Stei95] this algorithm
results in excessive seek times and makes it difficult to provide guar
antees of service to individual clients. Adaptations of EDF have been
proposed which alleviate this problem to some degree. These algo
rithms are discussed next.
2.4.3.4 Optimising both Buffer and Seeking
The Grouped Sweeping Scheme (GSS) [Yu92] aims to combine the
merits of the cycle based and deadline based schemes. Requests are
divided into groups where the groups are always served in order. The
requests within each group, however, are served by the SCAN policy.
This ensures that each block for a given stream will be retrieved at
nearly the same time (minimizing buffer requirements) while also
allowing efficient scheduling to be used within each group. The total
seek time will always be less than or equal to that obtained by
round-robin schemes, while the buffer requirement will be less than
or equal to that of SCAN based schemes. How great the improvement

Review of Current Efforts in Interactive Video Delivery 45
is in each case is determined by the number of groups. If one group
is used the scheme degenerates to SCAN, while if there is only one
request per group the scheme becomes pure round-robin. Interest
ingly, in the paper by Yu [Yu92], the recommended group size for
large numbers of requests is one. This is because SCAN scheduling
obtains the highest throughput from disk, which is required for a
large number of streams. In this instance there is no advantage over
the SCAN approach. An example seek schedule for GSS with 4
requests divided into 2 groups is shown in Figure 2.8(d). The worst-
case buffer requirement for a single stream of a GSS group is shown
in Figure 2.9(c). The buffer use shown agrees with the calculations
of [Toba93].
SCAN-EDF (where requests are grouped together according to dead
line and served by the SCAN algorithm within each group) has also
been proposed as an improvement to the EDF scheme [Redd94]. It
should be noted that this scheme operates precisely the same as the
Grouped Sweeping Scheme, and as such the discussion presented
above applies. Indeed the results produced by [Yu92] and [Redd94]
for the two schemes are in good agreement. Although made under
different assumptions, both analyses indicate that GSS/SCAN-EDF
policies provide a slight advantage over SCAN policies alone in terms
of buffer size required to served a given number of requests. They
both have significant advantages over the standard round-robin or
EDF schemes. [Toba93] also presents a discussion of the buffer
requirements of GSS scheme and shows that the buffer require
ments lie between those of SCAN and round-robin scheduling. This
paper does not, however, go on to consider the effect that the GSS
scheme has on disk throughput. It should be further noted that the
Sorting Set algorithm proposed in [Gemm93] is also based on the
same principle as GSS and SCAN-EDF.

Review of Current Efforts in Interactive Video Delivery 46
2.4.3.5 Limiting Interaction
The schemes discussed above represent a continuum of approaches
available to support interactive video from disk while minimising
buffering requirements and/or maximising throughput. Truly effi
cient seeking and round-robin scheduling can both be achieved
simultaneously, however, only if interactivity is not allowed. By
appropriately placing data on the disk initially and admitting
streams to an appropriate place in the service round (which may
occasionally cause slight jitters for existing streams [Bers95]), the
order of retrievals can be maintained for the entire duration of play
back. Layout schemes to achieve this are straightforward and
involve placing the video either contiguously or interleaved with oth
ers across the disk from outside to inside (or vice versa). A scheme
proposed in [Birk95] takes this idea further by allowing elevator
scheduling by placing one block in the outer tracks and the next
block on the inner tracks of the disk. This scheme has the added
benefit that it ensures a constant average data rate even on disks
with multiple zones. [Bers95] uses a similar scheme to provide
"Just-In-Time" scheduling which aims to retrieve a block only
slightly prior to its playout. Berson et al. claim that this gives an
order of magnitude decrease in buffering requirements over seek-
mimmising cycle-based schemes. This claim is unjustified by the
paper and a considerably more detailed analysis is required to con
firm this conclusion.
The above schemes although efficient, still incur a full stroke seek
for every round of retrievals. By constraining the layout and admis
sion of new streams this can be further improved. Several schemes
propose the division of the disk surface into regions such that
retrieved of blocks in each round only access a single region
([Oyan94b] [Ghan95b] [Cohe95]).
[Oyan94a] shows that such a scheme is a considerable improvement
over the grouped-sweeping scheme in terms of the number of

Review of Current Efforts in Interactive Video Delivery 47
Region Blocks
0,7,8,.
1,6,-
2,5,.
3,4,..
Oyang, Ghandeharizadeh (REBECA)
Region
v •(
'c A
Blocks
0,4,8,...
3,7,...
1,5,...
2,6,...
Cohen (Interleaved
Annular Layout)
Figure 2.10 Differences between several region based block allocation schemes
streams supported for a given buffer size. O n c e again, however, such
s c h e m e s only w o r k if interactivity is not supported. [Cohe95] pro
poses Interleaved Annular Layout (IAL) w h e r e b y the regions are
interleaved in s u c h a w a y as to prevent the need for a long seek from
the centre to the outside of the disk w h e n the innermost region is
reached. A similar effect is achieved b y Region Based Block Alloca
tion ( R E B E C A ) proposed in [Ghan95b] b y placing the blocks within
regions using a "folded" type of layout. T h e s a m e technique is used
in [Oyan94a]. T h e idea of region based block allocation is illustrated
in Figure 2.10. w h i c h illustrates the difference between the propos
als.
Taking the idea of region based block allocation to its extreme con
clusion is a set of approaches w h e r e n o seeking is involved at all.
This m e t h o d places different streams o n the disk using block-divi
sion multiplexing across the disk surface. T h e disk h e a d merely
sweeps from the outermost track to the innermost, reading all the
data in sequence. A s the disk head sweeps (almost) deterministically
across the surface block division multiplexing translates to time-
division multiplexing of the outgoing streams. B y spreading the data
of a single stream across the disk with appropriate block a n d spac-
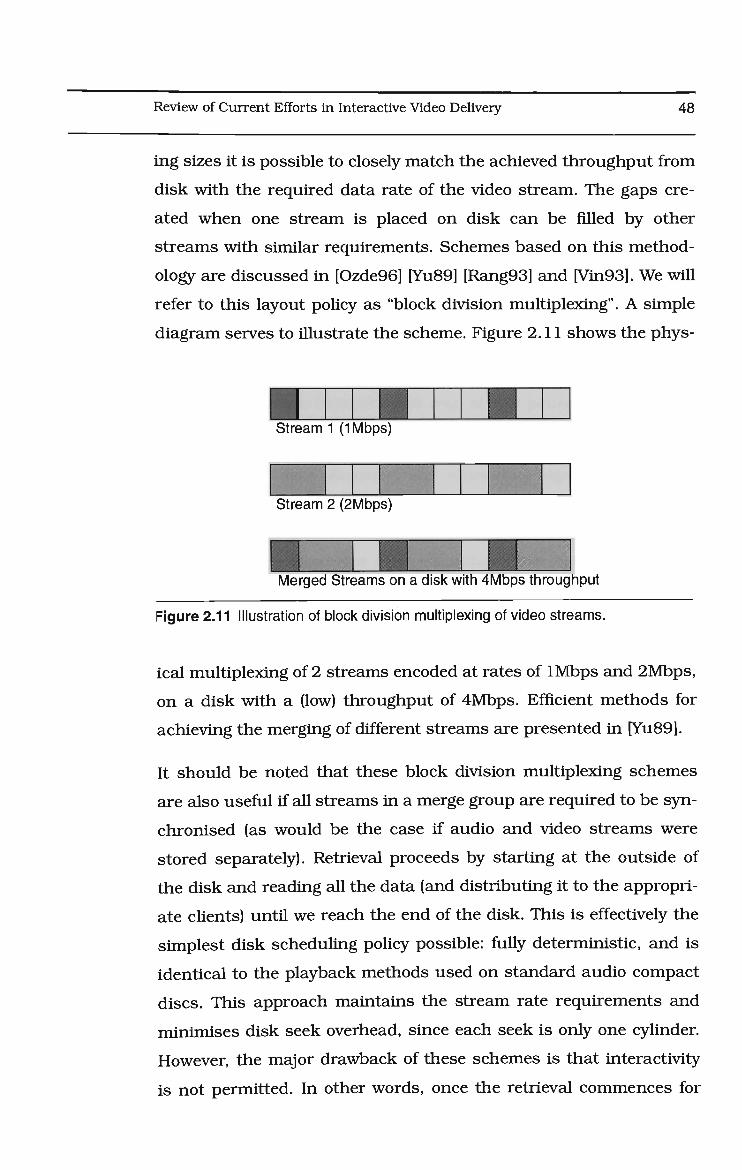
Review of Current Efforts in Interactive Video Delivery 48
ing sizes it is possible to closely match the achieved throughput from
disk with the required data rate of the video stream. The gaps cre
ated when one stream is placed on disk can be filled by other
streams with similar requirements. Schemes based on this method
ology are discussed in [Ozde96] [Yu89] [Rang93] and [Vin93]. W e will
refer to this layout policy as "block division multiplexing". A simple
diagram serves to illustrate the scheme. Figure 2.11 shows the phys-
Stream 1 (1Mbps)
Stream 2 (2Mbps)
Merged Streams on a disk with 4Mbps throughput
Figure 2.11 Illustration of block division multiplexing of video streams.
ical multiplexing of 2 streams encoded at rates of 1Mbps and 2Mbps,
on a disk with a (low) throughput of 4Mbps. Efficient methods for
achieving the merging of different streams are presented in [Yu89].
It should be noted that these block division multiplexing schemes
are also useful if all streams in a merge group are required to be syn
chronised (as would be the case if audio and video streams were
stored separately). Retrieval proceeds by starting at the outside of
the disk and reading all the data (and distributing it to the appropri
ate clients) until w e reach the end of the disk. This is effectively the
simplest disk scheduling policy possible: fully deterministic, and is
identical to the playback methods used on standard audio compact
discs. This approach maintains the stream rate requirements and
minimises disk seek overhead, since each seek is only one cylinder.
However, the major drawback of these schemes is that interactivity
is not permitted. In other words, once the retrieval commences for

Review of Current Efforts in Interactive Video Delivery 49
any stream, there is no facility to pause or relocate since all other
streams would also be effected. If seeking between block retrievals is
permitted (as is the case in [Vin93]) then the properties created by
the merge pattern are forfeited. This merge technique may still, how
ever, be useful to reduce the problem of fragmentation which may
occur with contiguous allocation.
The drawback associated with all of the above schemes that aim to
optimise both buffer space and seek schedules is that interactivity is
not well supported. In most cases even simple pause and resume or
relocation functions can only be supported with long delays.
It is clear that data placement and scheduling algorithms must be
used in combination to provide high throughput from disk arrays.
By lirniting the interactivity of users, very efficient schemes have
been devised to maximise disk utilisation while minimising buffer
requirements. Interactivity requirements of video servers necessitate
the use of less efficient but more robust algorithms which allow relo
cation of streams without starvation of existing streams in a service
round.
In summary, disk layout and scheduling policies have been a focus
of recent literature. These policies have been aimed at removing the
problems of the variable delay of disk seeks when serving real-time
requests. A number of approaches have been recommended, all
based on existing scheduling algorithms. It is now possible to place
video on disk and retrieve it with high efficiency if interactivity is not
required. However, providing interactivity requires the use of less
efficient policies which effectively increase the load on the video
server and therefore also increase total system cost. Without a
detailed understanding of user requirements it is difficult to deter
mine the level of support required for interactivity. Papers to date
have been forced to make simplifying assumptions regarding this.
For the purposes of this thesis, a round-robin based scheduling
scheme is generally assumed based on CTL blocks which correspond

Review of Current Efforts in Interactive Video Delivery 50
to an integer multiple of a GOP. Given these scheduling and layout
policies, a video server needs mechanisms to perform call admission
control on new streams. These admission schemes should aim to
maintain a balanced load in the server and to rninirnise delay to new
requests.
2.4.4 Call Admission Control, Load Balancing and Delay
When a new request arrives, the video server must determine
whether it can service it without disrupting any of the requests cur
rently in service. If it can, the call is admitted and playback pro
ceeds, else the call is blocked or queued until resources are
available. This process is termed Call Admission Control (CAC). In a
video server it is likely that a user will tolerate some amount of delay
before playback starts. If necessary the server may delay a request
for some time before service begins, otherwise the call must be
blocked (rejected).
Call-admission control in telecommunication networks is extremely
well studied. However, in the case of interactive video servers the sit
uation is sufficiently different to warrant re-examination. Tradition
ally, network CAC has relied on a statistical description of the traffic
(eg. Peak-Cell Rate and Mean Cell Rate) in order to give a statistical
guarantee of service (eg. small loss probability). In a telecommunica
tions network, future traffic loads are difficult to accurately predict.
Even individual clients cannot be aware of how much traffic they
themselves will generate in the future. It is for this reason that only a
few parameters are used in attempting to characterise each traffic
source at call admission time. In the case of interactive video, how
ever, the situation is considerably different. Since a video server
stores all of the data that is to be transmitted, it has detailed future
knowledge of the load that is to be placed on it. As such it would
seem reasonable to assume that a video server can potentially per
form much more aggressive admission control than has been possi
ble in other data networks.

Review of Current Efforts in Interactive Video Delivery 51
Early CAC schemes proposed for interactive video systems were
based on the existing idea of using a statistical profile of the traffic to
determine overflow probabilities. These schemes are effective
because the statistics can be quite detailed (full distributions being
easily determined) and are known to be accurate. Using these statis
tics in combination with a model of disk drive performance, overflow
probabilities can be calculated. Should the total overflow probability
of the existing streams and the new admission fall below some
threshold then the new stream is admitted. Statistical call-admis
sion control schemes have been proposed by numerous authors.
Often these schemes assume some average or worst case statistics of
disk seek and service time for each request. Papers by [Rama95]
[Chan94b] [Vin93] [Gemm92] and [Redd94] all fall into this category
of worst-case admission control. [Chan94b] provides a thorough
consideration of the statistics of MPEG encoded VBR video and pro
vides computationally efficient schemes for ensuring a given loss
rate for several priorities of customers. By allowing several priorities
of customer (each with different QoS requirements) the service
scheme can gracefully reduce service to clients that are more toler
ant of loss. Such a technique is useful when FF and R E W interac
tions by a user cause an increase in load on the server (see
Section 2.4.5). A priority scheme also allows the server to admit
slightly more customers with low QoS guarantees than a single-pri
ority admission algorithm could. One downfall of Chang et al's
approach, however is that they also only consider worst case disk
seek times although this does prove to be a safe upper bound.
The paper by [Vin94a] improves on this scheme by individually con
sidering the statistics for each separate stream. Also they model the
seek time as a (simple) distribution rather than the average or worst
case. The results show that this statistical scheme gives much better
performance (in terms of clients admitted) than its worst case coun
terpart. Vin, however, does not allow multiple priorities of clients. It
would seem that a combination of the two schemes would form an

Review of Current Efforts in Interactive Video Delivery 52
efficient statistical call-admission control scheme. Utilising even
more detailed data about each video object, however, has the poten
tial to lead to even more efficient, deterministic, admission tech
niques.
The video server has total knowledge of the bit rate requirements of
all the streams it is requested to serve. By using this more detailed
temporal information instead of just the statistics of the trace, it
would seem reasonable to expect higher utilisations and admission
rates than are possible with the statistical approach. Such an
approach is referred to as deterministic call admission control, since
the guarantees provided are absolute. Several authors have recently
proposed deterrninistic call admission control schemes based on this
idea [Ryu96] [Lau95a]. Such methods may, however, provide poor
support for interactivity since each interaction (or pause /restart) is
treated as a new call admission and as such is subject to a CAC test.
A detailed deterministic CAC scheme is presented in [Neuf96] but no
results are presented regarding its performance. It is clear that the
improvement gained by using deterministic admission will be closely
related to the characteristics of the video data being stored and of
the storage subsystem itself. A recent paper by Chang and Zakhor
[Chan96a] uses real MPEG compressed video streams to study the
benefit of deterministic admission control schemes. The paper indi
cates that a 10-20% increase in the number of streams admitted is
possible, with only a slight (5-7%) increase in interactivity delay.
The primary downfall of the existing CAC schemes (including
[Vin94a] and [Chan94b]) is that they often don't consider the individ
ual resources in a video server before admission. Specifically they
tend to admit streams to a given disk group provided that the whole
group is not serving the maximum number of streams. This method
is sufficient in fine-grained striping groups where all disks co-oper
ate on all requests. In coarse-grained striping groups, however, we
must consider the load on each disk individually before admitting a
stream. It may be beneficial to delay or block admission in order to

Review of Current Efforts in Interactive Video Delivery 53
maintain a balanced load across the array. In Chapter 6 we utilise
similar techniques to those described above to determine limits on
disk throughput, before using these limits to investigate the benefits
of selectively delaying admission of certain requests. A scheme
termed "Predictive CAC" is developed which is shown to provide sig
nificant advantages in terms of admission delay, without requiring
any additional server resources.
2.4.4.1 Load Balancing
The idea of load-balancing has a number of meanings in the context
of interactive video networks and servers. At the highest level, an
interactive video network consists of a large number of servers. It is
important that viewer load is shared evenly across each server. As
already mentioned, several authors have investigated this problem
([Loug94] [Fede94] [Nuss95]), and it is further discussed in Chapter
3. It is also important, however, that load is balanced across storage
subsystems (eg. disk arrays) within a server and across devices
(disks) within each subsystem (array).
Each individual video server will consist of several (perhaps many)
disk arrays each storing different movies and each disk array may
consist of a large number of disks. Once again it is important from
an efficiency perspective, that each of these disk arrays is equally
utilised. If a storage hierarchy is used, the situation is even more
complex. Several papers deal with the problem of ensuring a bal
anced load between arrays, [Litt95] [Dan94a] [Wolf95] [Barn96e].
[Litt95] draws the useful (although obvious) conclusion that a sys
tem operates most efficiently if all storage devices (disks or disk
arrays) have an equal probability of being accessed. The authors
suggest that movies should be stored on individual disks, and repli
cated to meet the throughput requirements as necessary. They state
that the problem of allocating movies to disks is NP-hard, but make
no attempt to derive any form of solution to the problem. Also, the

Review of Current Efforts in Interactive Video Delivery 54
authors fail to consider the benefits of disk striping in order to avoid
the extra cost incurred by video replication.
[Dan94a] is one of a series of papers by Dan et al. This paper pro
poses a scheme called the Dynamic Segment Replication Policy.
Given an initial configuration of movies on disk arrays, this scheme
aims to maintain a balanced load by dynamically shifting popular
movie segments to lightly loaded arrays. The authors compare this
scheme to one which uses static movie placement and show that the
dynamic scheme can provide considerable improvement. There are,
however, a number of issues that are unclear from the paper. First, it
is unclear what penalty the authors assume the copying of segments
incurs to the load on the system. Specifically, in a RAID based disk
array, write operations are considerably more expensive than read
operations and this may not have been accounted for in the simula
tion model used by Dan et al.
Second, the initial placement technique used for the static policy is
open to question. The static policy relies on the load being well-bal
anced when movies are initially allocated to disks, and its perform
ance is very sensitive to this placement. The authors have used the
intuitively appealing idea of "folding" the ordered set of movies onto
the disk arrays. Unfortunately, for the Zipf distribution which is
assumed to model popularity, this does not result in a particularly
well balanced system. In fact for the parameters chosen by the
authors, the least loaded disk array has just 7 0 % of the load of the
most loaded array, while the mean load is only 8 0 % of the maxi
mum. It is reasonable to expect that the static policy will not per
form particularly well under these conditions.
A paper by Wolf et al. [Wolf95] examines both static and dynamic
schemes for load balancing between arrays, in a scheme called
"DASD Dancing". The authors use techniques based on graph theory
to allocate (statically) movie copies to disk arrays in such a way that
load is generally well balanced and so that, should load imbalance

Review of Current Efforts in Interactive Video Delivery 55
occur, load can be shifted (or danced) from overloaded to under
loaded disk arrays. By creating a highly connected graph of disk
arrays (by ensuring that many arrays store copies of the same mov
ies) load can be easily moved from one array to another during play
back (dynamically). Simulation experiments are used to demonstrate
that the proposed scheme does indeed lead to improved load balance
(over greedy or single copy schemes) and that this in turn leads to a
higher system throughput.
The method proposed is quite complex, and although successful is
based on a number of assumptions. Wolf et al. assume that all mov
ies require the same storage capacity and as such that all disk
arrays can store the same number of movies. This implies that all
movies are the same length and encoded to the same bit rate. Also,
the maximum degree of disk striping (the number of disks in each
array) in this study is limited to 8. Other authors assume that disk
arrays of tens or hundreds of disks will be required to efficiently
meet customer demand [Mour96]. The restriction of only 8 disks per
array leads to large amounts of duplication being required to serve
the popular movies which in turn is what leads to the improved per
formance of the proposed "DASD Dancing" scheme. Obviously this
duplication of titles results in wasted storage capacity, when the
duplication is actually only being used to gain an increase in band
width. With larger disk arrays duplication is rarely required and the
scheme proposed by Wolf et al. will provide no benefit.
In Chapter 5 an efficient heuristic is developed which requires no
duplication of movie titles, and guarantees to meet storage and
throughput requirements for a large user population.
The problem of balancing the load within a disk array is not well
considered. In a fine-grained array this is no problem, since all disks
move synchronously to serve requests in parallel, and as such are
perfectly balanced. In a coarse-grained disk array, however, call-
admission control schemes must be used to keep the load balanced

Review of Current Efforts in Interactive Video Delivery 56
across the disks in the array. We discuss this issue in more detail
and introduce schemes for maintaining a balanced load in a coarse
grained disk array in Chapter 6.
2.4.5 Support for Interactive Services
To be widely deployed, video servers will be required to support at
least elementary interactivity. We regard the very basic interactivity
requirements as pause, restart, and relocate. The next level of sup
port which will be required for many applications is variable speed
playback in both forward and reverse directions. To mimic VCR
technology a single speed fast play (FF) and fast reverse (REW) will
suffice. Ideally, however, a range of speeds in both forward and
reverse directions would be available. To date most of the literature
has focused on providing simple fixed-rate fast-play and fast-rewind
schemes.
The appearance of the current "shuttle search" (fast play) feature on
VCR's is merely an artefact of the technology used to provide it. As
such, attempting to mimic this appearance with a completely differ
ent technology may not be feasible. The schemes that have been pro
posed to deliver N times fast play to date can be categorised as
follows [Shen95]:
• Retrieve frames at an increased rate [DS94]
These schemes increase the load on the video server, the client
decoder and the network as well as increasing the buffering required
in between [Budd95]. An N times speed-up results in N times the
load on all of these resources. Also the client decoder may not be
able to decode compressed video at the higher rate. Although this
scheme is the most obvious it is clearly the least efficient and will
not be supported by large-scale video servers.

Review of Current Efforts in Interactive Video Delivery 57
• Retrieve every Nth frame [Shen95]
By dropping the frames between every Nth frame and maintaining
the same nett frame rate, the client decoder and network perceive no
difference between the fast-play and normal stream. This scheme
will also present a very natural appearance to the customer.
Retrieving every Nth frame from the video server will, however,
increase the server load considerably depending on the data layout
strategy used. With only small amounts of data being read from each
video block the seek time required is much larger than for a normal
play request which can be satisfied by a single contiguous read. Also
if a compression scheme like MPEG [LeGa91] is used, interframe
dependencies will exist. This means that a given frame cannot be
decoded without information from neighbouring or nearby frames.
As such only fixed rates of fast-play will be supported using this
scheme, and the load on the server (and network) will be further
increased due to the fact that I and P frames are considerably larger
than B frames (refer to Section 2.2.3.1).
[Shen95] overcomes these problems by storing the normal playback
stream partitioned into three substreams. This partitioning removes
the frame interdependencies and reduces the resolution of the fast-
play stream to maintain the same bit rate even though only I and P
frames are being transmitted. Thus, if a user is in fast-play mode,
the server retrieves a number of small blocks (just the base sub-
stream), while in normal playback mode one large block is retrieved
per cycle. The authors develop an analysis which (although in disa
greement with a simulation) indicate that load is not effected very
much regardless of the number of streams in fast-forward mode.
Nagpal and Kanakia in [Nagp96] describe a system which transmits
only I frames and maintains a constant bit rate by reducing the
number of frames per second (rather than the resolution as pro
posed by Shenoy et al.). The authors state that this is directly analo
gous to the fast-search functions found on laser disc players which

Review of Current Efforts in Interactive Video Delivery 58
have been shown to be acceptable to users. The paper does not con
sider how this style of frame skipping would effect the load on the
video server or how it would be supported by the client.
• Retrieve every Nth Group of Pictures [Chen94a]
[Chen94a] originally proposed a scheme whereby every Nth GOP is
retrieved and played back normally. Since a GOP generally corre
sponds to about l/2 to 2 seconds of video this results in a somewhat
"sporadic" fast-play. Chen et al. develops two schemes for support
ing such interaction and performs visual experiments to suggest
that this style of fast-play is visually acceptable to the user.
This style of fast-play is very different to what is currently seen in
VCR technology, and the user response to this is currently open to
question. In [Nagp96] the perceptual effect is described as being
highlights rather than fast motion. However, it has significant
advantages in that it supports various rates of fast-play without
increasing storage or bandwidth requirements on the server.
[Budd95] develops methods for ensuring that load remains balanced
(in the long term) across all disks in an array even during fast play
using this "sequence variation scheme".
• Encode separate streams [Saka96]
By encoding and storing separate streams for fast-play, reverse-play
etc. we can easily switch the video server to the different streams in
response to commands from the user. With appropriate coding
parameters, the stream bit rate, and hence load on the server can be
kept constant for all streams. The drawbacks of this approach are
that extra storage overhead is required and variable fast-play speeds
are not supported.
This method seems to be quite straightforward for providing high-
quality fast-forward. For this reason it is currently being used in
prototype and deployed systems, but is not generating much interest

Review of Current Efforts in Interactive Video Delivery 59
in the research community. Chapter 6 assumes this implementation
of interactivity functions when considering call-admission control.
2.4.6 Techniques for Load Reduction
It is clear that interactive video servers will be required to source
extremely high data rates into the core network. It is, however, possi
ble to reduce the load placed on the server. By combining several
streams together to be served as one by the server and then multi
casting them across the network to multiple users, considerable cost
savings at the server may be possible. In its simplest form this idea
is most commonly known as Near-Video on Demand. As discussed
in Section 2.2.1 such a service provides limited interactivity (pause
and resume at a granularity in the order of minutes).
It is possible to reduce server load while still maintaining full inter
activity for streams that require it. Three techniques have been pro
posed to serve several customers with a single multicast stream
[Golu95]:
• Bridging
[Kama94] and [Dan94c] both propose this technique which revolves
around buffering individual requests' data for a short period and
serving closely following requests from this buffer. If a group of
streams are all temporally close together, then only the first stream
is read from disks with the remainder of the group being served from
buffer. [Dan94c] develops efficient algorithms for such a scheme and
demonstrates their effectiveness through extensive simulation. A
cost analysis also reveals that small amounts of buffering can be
justified in terms of the total system cost. This cost analysis, how
ever, assumes unrealistically high costs of disk drives and low costs
of RAM. If this imbalance were corrected it would be unlikely that
the use of R A M could be justified even with these intelligent caching
schemes.

Review of Current Efforts in Interactive Video Delivery 60
[Nuss95] also proposes the use of bridging on a network wide basis
by caching a small portion of programs at a head-end server.
• Batching
[Dan94b] proposes the use of batching where an initial user request
may be delayed in order to allow several streams to use the same
video instance. By incurring such a delay the likelihood of a user
reneging is increased, but this is minimised by selecting an appro
priate batching interval. Contingency streams are reserved in the
server to allow a user to split from the current batch when interac
tivity is required.
The paper by Dan et al. only supports pause and resume interactiv
ity. Fast-play and other interactive features are not discussed. Also
the authors assume that a contingency channel will be available for
use by any stream. In reality contingency channels will have to be
allocated for each disk array or individual disk, which will increase
the number required considerably.
Similar schemes are discussed in [Alme96] and [Jada95] with similar
limitations.
• Piggybacking
A final technique for combining streams together is called adaptive
piggybacking [Golu95]. This scheme relies on the observation that
viewers will not notice a speed-up or slowdown of a video stream
provided it is within +/- 5% of the nominal rate. As such if two
streams are close together, the leading one can be slowed down
slightly and the trailing one can be sped up until the two streams
meet. At which time the server is only required to source one stream
which is then multiplexed to the customer.
The slightly faster and slower streams will, however, require either
specialised encoding hardware to generate in real-time or will need
to be stored separately, incurring an expensive storage overhead.

Review of Current Efforts in Interactive Video Delivery 61
Although Golubchik et al. show that this mechanism can indeed
reduce the load on a video server, it is far from being mature and
requires considerably more investigation.
In general, reducing load in a truly interactive video server relies on
a fairly low level of interactivity for each user. The studies to date
assume this low-level of interactivity although market surveys are
not available to reinforce this assumption. For the remainder of this
thesis we assume that fully interactive video is supported by the
video server without any of the load reduction features mentioned
above.
2.4.7 Reliability of Large Disk Arrays
Despite the number of papers discussing the use of disk arrays for
interactive video, the number that deal with reliability issues is sur
prisingly small. Most work merely refers the reader to standard RAID
literature (eg. [Patt88] [Chen94b]) without considering how RAID
architectures really impact the performance of interactive video sys
tems.
Originally, RAID systems were proposed to give high data survivabil
ity for critical applications where data loss was not tolerable. In
interactive video the requirement for redundancy arises from a dif
ferent perspective. Interactive video servers must be highly available.
In other words they must be able to serve a maximum number of
requests for a high percentage of the time they are in operation. Los
ing data is not actually a concern since all data is assumed to be
held on archival storage (eg. tape) anyway and can always be
restored from there should data loss occur. In Figure 2.12 we show
the various RAID levels currently denned. For a detailed discussion
of each level we refer the reader to [Chen94b] or for a more readable
and recent introduction to [Frie96].
The standard RAID systems maintain throughput following disk fail
ure to a varying extent. Although some papers have investigated the

Review of Current Efforts in Interactive Video Delivery 62
Figure 2.12 Various levels of RAID arrays (from [Chen94b])
performance of RAID systems in failure mode [Munt90] [Ng92], the
literature to date has not really considered the effect that this has on
video server design, with its unique workload. The two levels of RAID
that have generated most interest are levels 3 and 5. Both of these
provide a parity disk to survive single disk failures. The difference
between the schemes is that RAID 3 implements fine-grained strip
ing while RAID 5 uses coarse-grained striping. The discussion in
Section 2.4.2 implies that RAID 5 may be preferable in a fully opera
tional state. When degraded performance is accounted for, however,
the situation becomes more complex. Indeed, numerous contradic
tory references regarding this issue appear in recent publications.

Review of Current Efforts in Interactive Video Delivery 63
[Cohe95] [Chan95] both recommend the use of RAID 3 disk arrays
(which use fine-grained striping) since they do not degrade under
failure and also since implementation is claimed to be simpler than
the most common alternative, RAID 5. It should be noted that
[Seo95] actually claims the opposite: that coarse-grained arrays are
easier to implement. The use of RAID 5 is implied by numerous
papers which employ coarse-grained striping [Shen95] [Chen94a],
and RAID 5 is specifically recommended by [Orji96] and [Ng92]
amongst others.
No rigorous comparison between the various redundancy options
has been conducted for interactive video servers. [Mour96] presents
some options for dealing with reliability problems in large arrays,
but these ideas are based purely on qualitative observations and no
analysis of any of the proposed schemes is provided. In Chapter 4 we
address this fact and present a detailed performability analysis of
redundant disk arrays in an interactive video service environment.
2.5 Prototype and Trial Systems
Current implementations of interactive video servers can be divided
into two categories: laboratory prototypes and field trials.
Laboratory prototypes are generally unrealistically small and built
solely to test proposed schemes and architectures. Field trials, how
ever, are constructed on a much larger scale and are currently being
deployed all over the world. The primary purpose of these is to
assess the customer demand for interactive video services and test
different products as well as developing appropriate pricing and
marketing strategies.
2.5.1 Laboratory Prototypes
Laboratory prototypes have a definite purpose in that they account
for all the factors of the physical system often ignored (due to the dif-

Review of Current Efforts in Interactive Video Delivery 64
ficulty in accurately modelling them) in even detailed simulations. At
the same time, prototypes are often unrealistically small and as
such the trends observed in these systems cannot be reliably extrap
olated to a large-scale system.
Numerous prototype systems have been constructed by various
researchers in order to test algorithms and techniques proposed.
Although we won't review these schemes in any detail here, we refer
the reader to the following papers for more details: [Genn95]
[Rama95] [Gemm94] [Chan95] |Pang96] [Saka96] [Lin96a] [Crut94]
[Loug92] [Fede94] [Chen94a].
2.5.2 Publicly Deployed Field Trials
Recent popular literature contains a number of articles concerning
field trials of interactive video services. Refer to [Perr96] for a list of
ongoing trials. These trials have the common goal of trying to ascer
tain the likely market interest and required pricing structures for
interactive video services. Although little information is publicly
available regarding the success of these trials, one thing is becoming
clear. Customers are not willing to pay very m u c h for what they per
ceive as an enhanced version of cable TV. One survey returned the
following results [Ano95]:
• Movies-on-demand type applications will be by far the most popu
lar use of interactive video servers for the foreseeable future.
• Customers will only pay between $30 and $50 per month for
access to these services.
This indicates that it is reasonable to focus on the movie-on-demand
application of interactive video for the foreseeable future, and also
that interactive video services must be built as cost-effectively as
possible in order to return a profit. Both of these points are adopted
to guide some of the directions of this dissertation.

Review of Current Efforts in Interactive Video Delivery 65
Very few technical details regarding these trials are publicly availa
ble. It is clear however, that the trial roll-outs have been done at
great expense; considerably more than could be justified in a full-
scale deployment. As such considerable development must take
place before wide-area commercial deployment is possible. Effec
tively this means that the problem of providing interactive video over
a broadband network has not been solved in a cost effective manner.
Hence we see the current high-level of research interest in this issue.
2.6 Relevant Standardisation Work
As with any area of telecommunications, standardisation of interac
tive video network architectures is essential. Numerous standardisa
tion bodies are actively working on various aspects of interactive
video systems. Perhaps the most influential is The Digital Audio-Vis
ual Council (DAVIC). DAVIC was formed specifically to consider end
to end issues related to digital audio and video and seeks to reuse
standards from other bodies wherever possible, in order to stream
line the standardisation process. DAVIC released version 1.0 of its
standard document in 1995 [Digi95]. As with any standard this doc
ument is comprehensive and detailed and seems to be widely
accepted among manufacturers. DAVIC 1.0 lists a range of function
alities that must be supported by any DAVIC compliant system. For
example, interactivity with VCR like control is required, including
fast and slow play in both forward and reverse and pause and ran
dom skipping within a video object. The actual nature of these facili
ties, however, is not specified in the standard.
Since this thesis is primarily concerned with implementation issues
and optimisations, standards are not of particular importance. As
such we won't provide a detailed review of any of the standards here.
We will however, refer to them through the course of the thesis where
necessary.

Review of Current Efforts in Interactive Video Delivery 66
2.7 Summary
It is impossible to cover all the issues related to interactive video
service provision in a single review. In this chapter we have tried to
identify the major efforts and indicate where this thesis provides new
contributions. Some of the contributions of this project are exten
sions of earlier work, while others consider new issues that have not
been specifically considered before. It is not our aim to repeat the
perfectly good work of others, instead their work is re-used where
possible and extended or generalised where necessary.
This chapter has provided a critical review of existing efforts in the
provision of interactive video. Throughout the course of this discus
sion a number of deficiencies in existing work have become clear.
This dissertation does not attempt to address all of these. Instead we
focus on some of the important issues that occur at different levels
of interactive video network and server design. The aim is to develop
and validate mechanisms for ensuring that interactive video net
works can be deployed cost effectively and with a high degree of reli
ability. The next section summarises the main shortcomings of the
current literature with respect to this dissertation. The items
addressed by this dissertation can be found in the list in Section 1.3.
2.7.1 Deficiencies in the Existing Literature
• The consideration of appropriate network architectures have used
unrealistic assumptions regarding server cost, network architec
ture and workload.
• Cost analyses use widely varying component cost estimates often
apparently chosen to support the argument being presented.
• There is no consistent understanding of a minimum set of
requirements to be supported by a video server.
• No framework exists for the comparison of the different proposals
for interactive video service.

Review of Current Efforts in Interactive Video Delivery 67
• Accurate models of video object popularity and its change over
time have not been developed or validated.
• A detailed comparison of disk striping techniques especially with
reference to reliability issues has not been performed.
• A n initial placement policy for balancing load between disk arrays
has not been developed. This is despite several publications which
point out the importance of this load balancing.
• Call-admission control schemes which maintain a balanced load
within a coarse-grained disk array have not been developed.
• A complete design procedure for interactive video systems has not
been presented.

Interactive Video Network Design 68
3. Interactive Video Network Design
Men occasionally stumble over the truth, but most of them pick them
selves up and hurry off as if nothing happened.
- Winston Churchill
3.1 Introduction
A top-down investigation of interactive video networks must neces
sarily begin with the network configuration. This chapter examines
the network architectures and compares the options for server con
figuration and placement in a wide area network. Specifically, dis
tributed and centralised storage architectures are compared under a
realistic model of storage and network cost. The chapter also
presents efficient caching algorithms which enable a distributed
approach to storage to be most cost-effective in terms of both storage
and bandwidth expenditure.
Section 3.2 considers the network architecture appropriate for inter
active video and the costs of various components of the network.
From this examination, Section 3.3 focuses on server costs and
develops a cost model for disk based video servers. A novel hierarchi
cal disk based server architecture is proposed in Section 3.4 and
compared with the homogeneous approach assumed earlier.
Section 3.5 uses the server cost model to analyse the cost of distrib
uted and centralised approaches to storage. A distributed approach
relies on the use of caches to store the most popular movies close to
Interactive Video Network Design 69
customer populations. Algorithms for maintaining cache currency
are developed in Section 3.6. The conclusion presented in
Section 3.7 reveals that a distributed approach can be expected to
be the most reliable and cost effective method of providing interac
tive video services to a large user population.
3.2 Network Architecture and Costs
Chapter 2 presented a graphical representation of a generic network
architecture (see Figure 2.3). Any number of technologies and topol
ogies could be used in such a network. The distinction between core
and access networks is however, always present. The AT&T inte
grated consumer video services platform, for example, uses an ATM
backbone in the core network and either ADSL or HFC technology in
the access network [Blah95]. The access network is connected to the
core network by way of an appropriate gateway (termed a Front End
Server in Figure 2.3). A similar architecture is presented in
[Chan94c] which uses a SONET ring with add-drop multiplexers in
the wide area network. Here Video Dialfone Gateways form the
access point for the customer into the core network. Due to infra
structure costs it is clear that core and access networks will rely on
fundamentally different networking technologies for some years to
come [Bure95]. The actual topology of either the core or access net
work is difficult to generalise. Stars, trees, meshes and rings are all
viable topologies for a core network organisation, while a wide tree
based structure would be used for HFC access networks and a star
configuration for ADSL based access networks.
Due to the difficulty in making assumptions regarding network
topologies, the only assumption made here is that an interface point
exists between the core and access networks. No inferences are
made regarding the actual technology or topology used in either the
core or access network. Since no specific core and access network
architectures are assumed it is impossible to accurately estimate the

Interactive Video Network Design 70
bandwidth cost incurred by a particular viewer load on these net
works. It is clear however, that bandwidth costs will be minimised by
reducing the quantity of traffic in the core network. This can be
achieved through the appropriate use of video buffers in the Front
E nd Server. As discussed in Chapter 2 the point of interconnect will
require considerable functionality and as such it is surmised that it
would be feasible to incorporate the functionality of a small video
server at such a point [Chan94c] [Li96].
High level of core network
traffic
Majority of requests served by cache
Reduced core network traffic
a) No Cache b) Cache at FES
Figure 3.1 Bandwidth savings in core network by using caching at the front-end server
Since network and bandwidth costs are highly dependent on the
architecture of the physical network it is desirable to remove such
factors from any comparison of interactive video architectures. Here
distributed and centralised approaches to storage are compared
based purely on the cost of storage, with the overriding assumption
that (regardless of network topology) bandwidth costs will be mini
mised by the most highly distributed approach to storage as indi
cated by Figure 3.11. It is for this reason that bandwidth costs do
1. Note that in this thesis, the term "distributed storage" refers to locating storage close to the customer populations, at the FES's. Thus, highly distributed storage would see large servers at each FES.

Interactive Video Network Design 71
not need to be studied in detail. Although not immediately apparent,
it will become clear that a distributed approach minimises not only
bandwidth costs but server costs as well.
Apart from network and server costs, the other major cost of provid
ing interactive video services lies in the customer premises equip
ment (CPE). In most cases, the CPE is assumed to consist of a
simple Set Top Box (STB) which is responsible for interfacing to the
network and decompressing digital video for display on a standard
TV, The issues involved in STB design do not significantly effect the
cost of the network itself and so these can also be omitted from the
cost comparison presented here.
From the arguments presented above, this chapter proceeds by
developing a detailed model for server cost and then compares inter
active video architectures using this cost model. This approach has
the advantage of avoiding the need to make assertions regarding net
work architectures, while still drawing useful conclusions regarding
optimal design methods for interactive video systems. In the follow
ing sections models of server cost are developed and validated.
3.3 Server Cost Model
It should firstly be noted that the term video server as used here
refers both to the dedicated video server in the core network, and the
smaller servers used as caches in the FES. Similar physical architec
tures would be used in each case, and as such, the same cost mod
els can be applied.
An interactive video server is a device capable of storing and serving
real-time compressed video data. In order to compare various meth
ods of dimensioning and placing such video servers in a network, an
accurate server cost model is required. Precise determination of
costs for a particular video server does, however, require detailed
knowledge of the server architecture. Making detailed assumptions

Interactive Video Network Design 72
regarding server design will, however, reduce the applicability of our
cost model, which is clearly undesirable. Although the implementa
tion of a video server will vary from one design to the next, all will
require some form of mass storage to meet the intensive multimedia
requirements already discussed. Several recent papers [Chan94c]
[Kova94] have shown that storage costs constitute the major cost of
videos servers. For this reason our model of server cost is based
purely on storage costs with associated costs assumed to scale
closely with storage costs. By making this assumption, it is possible
to develop an accurate and yet widely applicable model for the cost
of a video storage server.
The approach used in this chapter differs significantly from those in
the literature [Bisd95] [Nuss95] [Papa95] [Yosh96]. Most impor
tantly, the cost model developed here is based on a physically realis
able hardware architecture, but is not so specific as to be limited in
its applicability. Previous efforts at modelling interactive video sys
tems have not used cost models based on physical implementations.
As such the validity of these models is open to question and difficult
to prove.
Two recent papers illustrate this point graphically. A recent work,
[Papa95] assumes that storage in large servers is "multiplexed bet
ter" and as such the unit cost of storage is lower in larger servers.
Although this seems reasonable, the authors make no effort to
quantify this difference nor to show the assumed costs are realistic.
Following this assumption, costs per unit of storage are then
assigned arbitrarily to servers at various levels, complying only with
the simplistic rule that storage is cheaper per unit in larger servers.
In [Nuss95], it is assumed that the opposite property is true of stor
age costs. That is, costs become greater per unit as higher demands
are to be supported at a single server. Once again, this assertion is
not based on any physical storage model and so is difficult to justify.
In [Nuss95] a parameter is assigned to control how quickly costs

Interactive Video Network Design 73
increase with capacity, and the lower limit assumes a linear increase
in total cost with capacity (that is, unit cost is constant, independent
of server capacity).
The model derived in this chapter is based firmly on a physically
achievable implementation of a video storage server. Although con
siderably more detail is required when formulating a model based on
a physical implementation, it is clear that such a solution is much
more readily justified than the arbitrary assertions presented in pre
vious literature. Before continuing with the model derivation
Table 3.1 defines the symbols used in the remainder of this chapter.
Table 3.1 Symbols used in cost model
Symbol
N
K
S
C
B
L
Pi
d
Pc PFES
pvs
Pi
*FES
G
Definition
Peak number of streams to be served
Number of video objects (movies) to be stored
Storage required by a single movie (GB) (may be subscripted)
Capacity of a single disk (GB) (may be subscripted)
Bandwidth required by a single stream (Mbps)
Sustainable bandwidth of a single disk (Mbps)
Probability of access of movie i
Number of disks required
Cost of a single disk of capacity C ($)
Cost of a Front-End Server ($)
Cost of a core Video Server ($)
Cost per stream of video ($)
Fraction of requests served by the FES
Set of available disk sizes for use in a server implementation
As discussed in Chapter 2, several authors have noted that the stor
age cost of a video server is directly related to both the cost of provid
ing storage and the cost of providing the bandwidth required by the
streams [Tetz94] [Nuss95]. Accounting for only storage or bandwidth
requirements will yield highly inaccurate cost estimates for a video
server. As such a basic cost function for a video server is:
Cost of VS = f(N,K) (Eqn3.1)

Interactive Video Network Design 74
where N is the number of movies to be stored and K is the number of
simultaneous streams supported.
As mentioned in Chapter 2 the actual configuration of storage in a
video server is still a subject of active research. Storage hierarchies
consisting of RAM, disk and tape in various configurations have
been proposed, but never shown to be economically viable or able to
provide sufficient quality of service. Magnetic disk is the one com
mon device which appears in all proposals for interactive video serv
ers. As such, disk technology forms the focus of consideration in this
thesis. It is assumed (and shown to be viable) that disks and disk
arrays will be used to store the entire movie library and to serve all
customer requests. We now proceed to develop a cost model for a
video server which uses disk technology to store and serve movies.
As already seen, the storage subsystem must satisfy the two require
ments of sufficient capacity to store all movies and bandwidth to
serve all customers. These two requirements can be expressed sepa
rately as follows.
The number of disks d$ required to satisfy the capacity requirement
for all movies is:
ds = KS (Eqn 3.2) C
The number of disks dB, required to satisfy the bandwidth require
ment is:
dB NB ,, S ' —max(l,-)
(Eqn 3.3)
The "max" term in Equation 3.3 is required for the situation where
disk size is smaller than the requirements for a single movie (ie. S >
C). In this case, we will require S/C times the number of disks given
by the bandwidth constraint. The allocation strategy discussed here,
however, actually relies on S < C for all C. In other words, at least
one movie will always physically fit on a disk. This assumption is
reasonable even if physical disks are smaller than that, since they

Interactive Video Network Design 75
will be aggregated into striping groups large enough to provide stor
age for the entire film.
In general, to satisfy the total capacity and bandwidth constraints
we must satisfy the strictest constraint for each individual movie to
be stored. The above constraints must be combined in such a way as
to account for the probability of access of each movie. More popular
(hot) movies will have higher bandwidth demands which will dictate
the number of disks required, while a less popular (cold) movie's
disk requirement will be determined solely by the capacity required.
In order to determine the total disk requirement a summation of the
maximum of the two constraints over all movies is used.
d = K
max • V L
(Eqn 3.4)
Equation 3.4 accounts for both requirements of each movie and
determines whether the limiting factor is storage or bandwidth. It
then sums the requirements for every movie, to determine the total
disk requirement for all K movies.
The above model satisfies the requirements of each movie individu
ally and sums these requirements to gain an overall system require
ment. This approach is suggested by [Doga94b]. The implications of
this approach on server design are that considerable wastage of
resources can occur. We discuss this in Section 3.4 and provide one
method of minimising this wastage. An alternative solution is pre
sented in Chapter 5.
3.3.1 Magnetic Disk Cost Model
The final step required to complete the cost model of a video server is
an accurate model of the cost of individual disks. Equation 3.4 is
used to calculate the number of disks required, with a model of disk
cost, this can be converted to a total cost for the dominant aspect of
a video server: storage. Disk cost can be assumed to be a function of

Interactive Video Network Design 76
both capacity2 and bandwidth3. Unfortunately, disk bandwidth var
ies significantly depending on the workload placed on it and is gen
erally poorly specified by manufacturers. Indeed, typically mean
seek times are the figure of merit used to specify disk drive speed,
and this tends to be misleading. Another difficulty in comparing disk
bandwidths (or transfer rates) is that they are often constrained by
the bandwidth of the interface or bus. SCSI buses for example are
constrained to lOMB/s (20MB/s for SCSI-II). Further, as will be
seen, there is no significant correlation between seek time and cost.
As such this is omitted from the cost model developed here. Instead
we assume that all disks can sustain a certain fixed bandwidth for
the comparison presented here. The method of determining this
value of bandwidth that can be maintained by a single disk is dis
cussed in Chapter 4.
In order to develop a model for disk cost, a large amount of pricing
information was collected from a range of manufacturers and suppli
ers [Disk]. These prices were obtained in mid 1995 and are obviously
subject to very rapid change. However, it is likely that the general
price structure will remain similar, despite specific prices for individ
ual drives falling dramatically over time. All prices used are retail
and in $US. A total of 203 prices from 7 different suppliers were
obtained. These prices covered a total of 70 different disk drives from
14 different manufacturers. The drives range in size from 1GB to
9.1GB. For each disk drive model, the mean was taken of the prices
from each supplier and this mean plotted against disk capacity. A
least squares method was then used to fit a linear approximation to
the data. The results are shown in Figure 3.2.
2. The term "capacity" (or sometimes "size") in this thesis refers to the amount of data that can be stored on a disk or disk array. The fundamental units are measured in
bytes.
3. The "bandwidth" of a disk (or disk array) is defined as the sustainable data rate of
that device, and has units of bits per second.

Interactive Video Network Design 77
T i 1 r
J 1 I I I I L
0 1000 2000 3000 4000 5000 6000 7000 8000 9000 10000
Disk Capacity (MB)
Figure 3.2 Disk cost vs capacity
The line of best fit shown in the figure has an equation of
P = 0.275C+188 (Eqn 3.5)
where C is the disk capacity (in M B ) and P is the cost in $US. From
the data available it is clear from the graph that a linear approxima
tion gives an accurate model of disk cost, particularly considering
the high variance of the prices in the sample. The correlation
between disk cost and capacity has been calculated to be 0.944.
Recalling that perfect correlation results in a figure of 1.0 with
totally uncorrelated data returning 0, this reinforces the very strong
correlation shown in the figure.
In order to determine the effect of bandwidth on disk cost, the prices
obtained were further separated according to the seek time specified
by the manufacturer. Before comparing prices with seek times how
ever, prices for all drives were normalised with respect to their
capacity using the linear with offset model shown in Equation 3.5.
The prices (normalised to the price of an equivalent 1GB drive) for all
ouuu
2500
2000
w 1500 o O *z <n Q 1000
500

Interactive Video Network Design 78
drives in the sample Eire shown plotted against seek time in
Figure 3.3. As can be observed from the least-squares line of best fit,
there is no apparent correlation between disk seek time and cost.
Indeed the large spread of cost figures at each different seek time
indicate that pricing is more closely related to other factors (eg. mar
ket forces) than the questionable figure of merit of seek time.
800
700
600
CO
« 500 O
O b 400
300
200
x
X X
X X
Mean Prices (normalised) Line of Best Fit
x x
x x
X X
X X
10 12 14 16 Seek Time (msec)
18 20 22
Figure 3.3 Disk cost vs seek time
The statistical correlation between seek time and disk cost has also
been calculated and is -0.0126. This is reflected by the shallow neg
ative gradient of the line shown in Figure 3.3 and implies that there
is a very small (negligible) negative correlation between seek time
and cost.
Since there is no readily available correlation between cost and
throughput (poorly modelled by seek time) of magnetic disk drives,
we are forced to assume a given throughput for a disk drive and use
the cost model based purely on capacity as shown in Equation 3.5.

Interactive Video Network Design 79
The assumptions made concerning throughput will be stated and
justified where it is first used in Section 3.4.2.
Having developed a cost model for magnetic disks, the next section
combines this with the drive requirement of a server shown in
Equation 3.4 to determine realistic costs for two server design meth
ods.
3.4 Homogeneous vs Heterogeneous Disk Arrays
This section develops a complete model of the cost of storage of a
video server. Initially a homogeneous disk architecture is assumed.
By homogeneous it is meant that all disks in the system have the
same capacity and bandwidth. Under reasonable assumptions it is
revealed that such an approach can be very wasteful of both band
width and capacity resources within the server. For this reason we
have earlier proposed (see [Barn95a] [Barn96c]) an heterogeneous
approach to storage whereby disk capacity (and as such cost) is var
ied according to the popularity of the movie being stored. Before
investigating storage costs however, an accurate model of video pop
ularity is required.
3.4.1 Video Popularity Model
One of the major influences on the requirements for a given movie is
the probability of access. As discussed in Section 2.2.2 video popu
larity has been modelled in a number of different ways by various
authors. The most commonly considered application is Video-On-
Demand, since demand patterns are likely to be similar to existing
video rental markets for which data (albeit limited) is available. In
[Cher94] it is asserted that the data from a single week of rentals of
the Top 50 videos can be well matched by a Zipf distribution (except
ing the top 4 movies which are considerably more popular than sug
gested by Zipf s Law). Zipf s law can be stated as:

Interactive Video Network Design 80
1
pt = ? where C = * i (Eqn 3.6)
^ 1 i= l
where pj is the probability of access of the i'th movie, and the movies
are arranged in decreasing order of popularity. Notice that C is a
constant based on the number of movies under consideration. As
such the terms of pj form a harmonic series the sum of which is
divergent, which leads to the dependency of C on the number of
movies. The importance of this arises because it implies that a good
fit for a particular movie population (eg. 50 titles) will not translate to
a good fit for larger populations. Several authors (eg. [Nuss95])
employ a Zipf model based on the observations of [Cher94] but with
a much larger number of movies (ie. increased K). This change in K
affects the normalising constant C of the Zipf distribution which in
turn alters the individual probabilities of access for all movies. Of
course a change in the value of C is necessary in order to ensure
that access probabilities all sum to 1, but it is now not clear that the
Zipf model is accurate for the larger numbers of movies.
In a series of papers from IBM Research ([Dan94a], [Dan94b],
[Dan94c], [Dan94d], [Dan94e], [Dan95a]) the authors model object
popularity with a parameterised Zipf distribution represented by:
l
p. = -£- where C = * _ j _ (Eqn 3.7)
v L (l-e) ;= i l
where 6 is given a value of 0.271. The authors demonstrate (based
on limited statistical data) that this provides a good fit for populari
ties of the top 100 movies.
As already mentioned accurate statistical data portraying movie
rental popularity is difficult to obtain. This is reflected by the fact
that Chervenak relies on a single week of data to draw the conclu
sion regarding the disk model. Two publications with some credible
data are [Bure94] and [Fist94]. Figure 3.4 shows the two Zipf distil-

Interactive Video Network Design 81
buttons discussed above along with the empirical data points from
these papers.
w w CD O O < o >* ."K !5 cc .Q o i—
CL CD > CO Z3
E 3 O
1
0.9
0.8
0.7
0.6
0.5
0.4
0.3
0.2
0.1
0<
yl I I I I I I I _ 1 i_- « •
/ • - • " " ' " "
7 ••"'"' -""" "
y „ -°/ / '̂ -̂
/ • * *
/ /' ^ / / / / /
- / / / 1 «' /
• /
// X
/ f / | / "1 / P y
1 ' T / / / 1 / 1
o Data Points
Zipf (0.271) 100 movies
- - Zipf (0.271)
--Zipf(O)
-
-
-
r
3 i i i i i i t i i
0 100 200 300 400 500 600 700 800 900 1000
Video Rank
Figure 3.4 Cumulative distribution of video popularity for various models (assuming a total of 1000 movies)
The solid line in Figure 3.4 represents the Zipf distribution with a
parameter of 0.271 for a total of 100 movies as used by D a n et al. In
this case the model matches closely with observed data. W h e n the
Zipf model is used for larger movie populations (1000 in the figure) it
is clear that the access probabilities of the model depart significantly
from the empirical data. Numerous papers actually utilise Zipfs law
for databases up to 10,000 titles resulting in a severe underestimate
of the popularity of the top ranked titles.
To avoid the deficiencies of the Zipf distribution used above, an
empirical approach to video popularity has been used in this thesis.
A simple curve fitting approach is used to yield a good fit to empirical
data for a larger movie population. The function obtained is used in
simulation studies to m a p uniform random variables to a suitable

Interactive Video Network Design 82
random variable representing the popularity of a video in a given
rank.
For the case of a population of 1000 movies in total, the transform
ing equation has the following form:
y = -9.11 + 1.63exp(2.19x+ 1.72) + 0.027exp(12.3x3'28- 1.873) (Eqn 3.8)
Here x is a U(0,1) random variable and the function returns y, the
rank of the video being accessed. This transformation is used in sim
ulation studies presented later in the thesis.
Although complex, this equation provides a very good fit to the data
points as shown in Figure 3.5. It must be noted that for other video
0.1
- _ _u - -—9
J i_
o Data Points Empirical Model
- - Zipf (0)
j i_ 0©— 0 100 200 300 400 500 600 700 800 900 1000
Video Rank
Figure 3.5 Empirical model of video popularity for a total movie population of 1000
populations different empirical models are required to provide a
good fit to the data points. Also, due to the uncertainty of the rela
tionship between current video rented statistics and future interac
tive video demand statistics, this thesis considers results for both

Interactive Video Network Design 83
the empirical distribution and the Zipf models commonly used else
where in the literature. The next section combines the work pre
sented thus far to determine the total cost for a server based on
homogeneous disk arrays.
3.4.2 Homogeneous Storage Costs
Assuming that the requirements of each movie must be satisfied by
a given group of disks leads to the cost model already shown in
Equation 3.4. In an homogeneous system, it is assumed that all
disks have the same capacity and bandwidth. As such the popular
movies will probably require several disks in order to satisfy band
width requirements, while long unpopular movies will require only
one disk for that reason but may require several disks to meet
capacity constraints. Hence there is a problem in selecting the opti
mal disk capacity, for a given bandwidth in order to rninimise the
total storage cost.
Ideally, selecting the appropriate capacity for each disk drive would
result in 100% utilisation of both bandwidth and capacity resources.
This could be achieved by matching the ratio of capacity and band
width of the disks to that of the customer population [Tetz94]. For
the architecture described above, however, the actual optimal disk
size depends on shape of the popularity distribution of the movies.
An example is shown in Figure 3.6. Cost of storage versus disk size
is shown for both the empirical model of Figure 3.5 and an unrealis
tic uniform model where all titles are equiprobably accessed. The
other parameters used in this study are listed in Table 3.2.
The graph in Figure 3.6 reveals that a disk size of 5 GB is optimal
when the popularity of movies is uniform. This size is easily
explained as it balances the ratio of disk bandwidth to capacity
(30Mbps / 5GB) to the ratio of customers (bandwidth) to movies
(capacity) in the population (4000 * 3Mbps / 1000 * 2GB). When the
empirical model is used, however, 2GB is optimal disk capacity, but

Interactive Video Network Design
1.8
1.6
§1.4 •*—i
V) O ip o '•* CD O) 1
2 1
o W0.8 as ,o I- 0.6
0.4 0.2
0 0 1 2 3 4 5 6 7 8 9 10
Disk Capacity (GB)
Figure 3.6 Total storage cost vs selected disk capacity for the parameters shown in Table 3.2
Table 3.2 Parameters used for Figure 3.6
Parameter
N
B
L
S
C
Pi
Description
Number of customers (peak)
Bandwidth requirement per stream
Sustainable bandwidth of a single disk
Storage required by a single movie object
Capacity of a single disk
Popularity of movie i
Value
4000
3 Mbps
30 Mbps
2 GB
Varies
Empirical or Uniform
results in a significantly higher cost than the uniform case. The rea
son for the increased cost w h e n the popularity is skewed becomes
clear from an examination of the bandwidth and capacity utilisa
tions in each case. Figure 3.7 shows both capacity and bandwidth
utilisations for the empirical and uniform popularity cases (see
Table 3.2 for parameters4).
4. The value used for L, disk drive bandwidth, is taken from the lower end of claims by manufacturers including Maxtor and Micropolis. [Max95] [Mic94] and is supported by figures in [Brub96] and [Chan96b]. Chapter 4 develops a model for determining realistic sustainable throughput from physical disk drive parameters.
Empirical Popularity Model Uniform Popularity

Interactive Video Network Design 85
Empirical B W
— Empirical Cap.
Uniform B W
Uniform Cap.
"0 1 2 3 4 5 6 7 8 9 10
Disk Capacity (GB)
Figure 3.7 Bandwidth and capacity utilisations for both empirical and uniformly distributed popularities
For the uniform probability case, both capacity and bandwidth
resources are fully utilised at a capacity of 5 G B and hence this
results in the rninirnurn cost. For the empirical case, however, even
at the ininimum cost point (2GB capacity) neither bandwidth nor
capacity is fully utilised. Indeed there is no point where both
resources are fully utilised, and finding the optimal operating point
is clearly closely related to the assumed distribution of movie popu
larity. The next section elucidates on the causes of this problem and
proposes an architecture capable of alleviating it.
3.4.2.1 Inefficiencies of Homogeneous Approach
Even when using the most efficient disk size for a particular circum
stance, considerable wastage still occurs in the homogeneous sys
tem when a skewed popularity distribution is assumed. Figure 3.8
shows the capacity and bandwidth utilisations of the top 200 movies
for the empirical distribution for the optimum disk size (in terms of
overall cost) of 2GB.
0.8
2 0 6
0.4
0.2
i i i i - ~ i — r
N / ••. \ / '•
V / N X / "̂ /
X / " x
^ / ^ / / "•»
/ ~- .. ^-^~ / -^^-"^
/ ^^~ ~~ —
/ S ^
/ ^y / y^
/ / / /
// //
//

Interactive Video Network Design 86
1 1 1 1 1 1 1 1 1
(1 1 \ / \ ' \ 1 \
! \ / \ / \ / \ / \ / \ / \ / \ / \ / \ / \
/ \ / \
/ \ /
/ /
/ /
/ /
/
i i i i
B W Utilisation — Capacity Utilisation
i i i i
-
-
-
j [ I 1 I I I I I I I
0 20 40 60 80 100 120 140 160 180 200
Most Popular Movie Rank Least Popular
Figure 3.8 Bandwidth and capacity utilisation versus movie rank for a disk capacity of 2GB for the empirical popularity case
It is clear that popular movies are wasting capacity resources (ie.
they are bandwidth limited), while unpopular movies squander
bandwidth resources (they are capacity limited). Indeed, only one
movie gains almost perfect utilisation of both capacity and band
width (the movie ranked 62 in this case). Figure 3.9 represents these
inefficiencies graphically, comparing the use of small disks and large
disks for a given system.
As can be seen from Figure 3.9 popular movies make efficient use of
both capacity and bandwidth resources when stored on suitably
small disks. Alternatively unpopular movies (when assumed to be of
a similar length) are most efficiently stored by combining several of
them together onto a large disk (or a group of large disks). Note that
the diagrammatic approach does not accurately portray the number
of disks or the physical layout in either case, but is merely intended
to illustrate the idea that popularity of a movie effects the disk
capacity that can be most efficiently used to store and serve it.

Interactive Video Network Design 87
Efficient Operating Point
Figure 3.9 Efficient operating points for various disk sizes
The realisation that different movies can be efficiently stored on dif
ferent media is of course not new. This is precisely the idea that
prompts the proposition of storage hierarchies consisting of R A M ,
disk and tape technologies as discussed in detail in Chapter 2. How
ever, due to problems of cost and long latencies, R A M and tape sys
tems have been difficult to justify. These facts combined have lead
us to the idea of a heterogeneous disk system whereby movies are
placed on different capacity disk drives (effectively altering the
capacity-bandwidth ratio) depending on their popularity. Such a
system maintains the intuitive appeal of the more general storage
hierarchy without incurring the penalties of the other storage media.
It should be noted that the heterogeneous approach is not the only
method of overcoming the inefficiencies depicted in Figure 3.9.
Chapter 5 considers another efficient scheme in some detail. The fol
lowing section develops the idea of a heterogeneous disk based stor
age architecture.
Interactive Video Network Design 88
3.4.3 Heterogeneous Storage Costs
In a heterogeneous disk array, a variety of disk sizes is used. It is
important to determine the most appropriate disk size for each
movie according to the popularity and length of the movie in ques
tion.
3.4.3.1 Disk Size Allocation
To achieve high efficiency in a heterogeneous disk array the aim is to
match the ratio of bandwidth to capacity of a storage device to the
bandwidth and capacity requirements of each object [Dan95b]. This
ensures that both the bandwidth and capacity resources of the disk
arrays are well utilised. Denoting the ideal disk capacity for movie i
(with popularity pt and storage requirement S{) by Cb we have:
c s _j = L_ (Eqn 3.9) L NBpt
v H
Since Cj is the dependent variable, rearrange Equation 3.9 to obtain:
S,L C = — — (Eqn 3.10) 1 NBpt
K
By using the overall bandwidth (or storage) requirement of the
movie, it is then possible to calculate the total number of disks of
size Cj required for movie i.
NBpf dt = ̂ p (Eqn 3.11)
Having determined the number of disks required for each movie the
cost can be calculated from Equation 3.5. This highly idealised
model of an heterogeneous disk array returns the same minimum
cost for the parameters shown in Table 3.2 under the empirical dis
tribution of popularity as the homogeneous system did for uniform
popularity (see Figure 3.6). More simply, by selecting precisely the
correct disk size for each object, and allowing fractional numbers of
these disks to be used, the ideal heterogeneous system has over-

Interactive Video Network Design 89
come the inefficiencies caused by varying movie popularities which
resulted in increased storage costs in the homogeneous system.
In order to be realistic, however, further constraints must be placed
on the heterogeneous model used above. Specifically, Equation 3.10
implies that any disk size is available, whereas in reality only a small
number of discrete disk sizes are manufactured. Also, Equation 3.11
implies that a fractional number of disks can be included in the sys
tem. However, disk numbers (of each size) must, in reality, be
restricted to an integral value. By incorporating these two con
straints we obtain a much more realistic model of an heterogeneous
disk based storage architecture. Note, however, that Equation 3.10
and Equation 3.11 do provide a lower bound for storage costs.
The approach to meeting the above two constraints is to specify a set
of allowable disk sizes, G, and then select the size for a particular
movie that most closely matches the size given by Equation 3.10.
Figure 3.10 shows an example where available disk sizes are limited
to 0.5, 2, 5, 8 and 10 gigabytes, ie.
G = {0.5,2,5,8, 10}. (Eqn 3.12)
Once the appropriate disks sizes are selected, the total requirement
of each size is easily obtained through summation (and applying a
ceiling function) and the total system cost immediately follows.
Figure 3.11 shows an example of total system cost for the parame
ters in Table 3.2 for a variety of different disk allocation methods.
The method applied in each case of the figure is described in
Table 3.3.
Table 3.3 Description of the various cases compared in Figure 3.11
Case
1
2
3
4
5
Description
Homogeneous Storage Cost G = {2}
Heterogeneous Storage Cost G = {1, 10}
Heterogeneous Storage Cost G = {0.4, 1, 2, 4, 10}
Heterogeneous Storage Cost G = {0.2, 0.5, 1, 2, 4, 6, 8, 10}
Idealised Heterogeneous Storage Cost G e 9t

Interactive Video Network Design 90
10
CO (5
o CO Q. CO
o .*:
Desired Disk Size Allocated Disk Size
Movie Rank 150
Figure 3.10 Selection of discrete disk sizes for individual movie objects.
10
9.5
9
§ 8.5
to 8 O
O a 7.5 CO
•^ 7
CO CO
JO 6.5
6
5.5
x10
""
r
-
51.80 %
i
-
-
17.00%
i
-
8.95 %
i
7.16%
1
0.00 % -
-
-
3 Case
Figure 3.11 Comparison of homogeneous and heterogeneous schemes with the lower bound of storage cost.

Interactive Video Network Design 91
Figure 3.11 reveals that an appropriately designed realistic hetero
geneous storage system can closely approximate the same ideal cost
given by the idealised heterogeneous system. Note that the disk sizes
used in this example are not selected to be optimal, instead it is
assumed that particular disk sizes are available in a given case, and
the heterogeneous design procedure attempts to use these optimally.
Selecting the most useful disk sizes for a given system is an exercise
in fitting a piecewise linear model to the popularity curve of the
entire video population. Each straight line corresponds to the band
width to capacity ratio of a single disk drive. Notice that even though
the disk capacities selected for use here are not optimal, the five disk
heterogeneous system proposed in case 3 is less than 1 0 % more
expensive than the absolute optimal system obtained using the
highly idealised heterogeneous system of Equation 3.11.
It is possible to further optimise this heterogeneous system by
searching for cases where a movie could be stored on a smaller disk
without causing any increase in the number of smaller disks
required. This optimisation provides only slight improvements and is
discussed in Appendix A.
Before proceeding, it is important to reiterate that the above storage
methodology has not been optimised particularly thoroughly.
Indeed, this is not the purpose of this chapter. Instead the goal was
to develop a realistic (as opposed to optimal) model of video server
storage cost based on a physically realisable architecture. This is
intended to be used in place of previously proposed cost models
which are based purely on suppositions of how storage costs might
scale with server size. The model that has been derived is straight
forward and can be seen to give credible results for a reasonable set
of assumptions. In the following section this model is utilised to per
form a comparison of various network architectures for interactive
video services. The issue of optimising the storage system within a
video server is revisited in Chapter 5, where suitable packing heuris-

Interactive Video Network Design 92
tics are applied to homogeneous disk arrays in order to overcome the
drawbacks of heterogeneous systems.
3.5 Distributed vs Centralised Approaches to Storage
The earlier sections have developed a realistic cost model for mag
netic disk based storage servers. The model that has been developed
accounts for both variable movie popularity and realistic models of
disk drive performance and price characteristics. Using this model
we are now in a position to provide a useful comparison of central
ised and distributed approaches to storage in interactive video sys
tems.
The essential difference between centralised and distributed
approaches is related to where storage is located within the network.
As indicated in Figure 3.1 this effects the bandwidth being transmit
ted across the core network. Clearly the more the storage is distrib
uted toward the customer, the lower the bandwidth costs. The actual
reduction seen will depend entirely on network topology and,
although easily calculated for a particular topology [Nuss95], is not
considered here. The relationship between storage distribution and
cost, however, is not so clear. Indeed it would appear that storage
costs would increase as duplication of objects is increased in the dis
tributed approach. This could possibly negate and override the
bandwidth savings.
The extremely skewed popularity distribution of interactive video
systems ensures that caches at the FES can serve a large proportion
of the customer population by only storing a small number of mov
ies. For example, a cache of just 21 movies is likely to be able to sat
isfy 5 0 % of customer requests [Fist94]. In order to compare
centralised and distributed storage costs we assume a certain total
customer population and then use either a large single central server
to serve all customers, or several small front-end caches combined

Interactive Video Network Design 93
with a low throughput central server which handles only the
requests not served by the front end caches. Table 3.4 shows the
percentage of requests served by a front end server related to the
number of movies stored there. This table follows directly from the
popularity distribution developed in Section 3.4.1.
Table 3.4 Movies stored and requests served by a Front-End Server
% Requests Served by FES (fFES*100)
Number of Movies Required
80
45
85
55
90
82
95
200
99
680
Using this table, distributed and centralised approaches are com
pared using a methodology designed to match realistic public net
works. It is assumed that each FES will serve approximately the
same number of homes and that this number is in the order of
10,000 per FES. This is in keeping with the number of homes cur
rently connected to a local exchange in existing telephone networks.
If we assume a busy-hour average load of 4 0 % (which closely
matches peak load currently experienced in broadcast television sys
tems, see Figure 4.7) this requires each FES to support an average
load of 4,000 streams during the busy hour for true interactive video
to each home. Further it is assumed that a total of 1,000 different
movie titles must be available to all customers. The number of video
servers located in the core of the network will depend on the size of
the cache at the FES, but it is assumed that each VS is capable of
handling a maximum of 4,000 streams also, and that the VS must
store all 1,000 movies. Using this methodology the cost per stream of
providing interactive video services to a large user population can be
calculated using the cost function derived in Section 3.4.3.
Figure 3.12 shows the cost per stream versus the percentage of
streams served by the FES cache under the above assumptions,
using the heterogeneous storage system. The cost per stream is cal
culated from the cost of each FES and the VS from Equation 3.13.
= Pys(l-JFES) + PFES (Eqn 3.13)
1 N

Interactive Video Network Design 94
where the prices of the individual servers (see Table 3.1) are
obtained using Equation 3.5, Equation 3.10 and Equation 3.11,
with the available disk sizes (the set G) suitably constrained as fol
lows.
For the results shown in Figure 3.12, five disk sizes have been used
for both the FES and V S design, and the disk sizes chosen to ensure
a high efficiency. For example, the caches are only serving a small
number of popular movies and as such a range of small disks is
most suitable [G = {0.2,0.5,1,2.5,4}). The V S in the core network,
however is serving movies with wide ranging popularities and as
such a wide range of disks sizes is applicable ( G = {0.4, l, 4,8,10}).
As a result of these disk size selections, all of the server designs in
the results of Figure 3.12 achieved an aggregate efficiency in excess
of 85%. This implies that no more than 1 5 % of bandwidth or capac
ity resources of the disks were wasted by any system.
130
80 82 84 86 88 90 92 94 96
Percentage of Requests Served by the FES 98 100
Figure 3.12 Distributed storage cost versus percentage of requests served by FES

Interactive Video Network Design 95
Figure 3.12 reveals that minimum cost is attained when approxi
mately 82 movies are cached, resulting in each FES serving approxi
mately 9 0 % of requests. It is interesting to note that the "knee" of the
movie popularity distribution shown in Figure 3.5 occurs at about
this point. Caching any more movies than this causes storage costs
to rise more rapidly for a decreasing benefit.
An important comparison is between the distributed and centralised
storage costs. It has been shown above that distributed storage costs
are minimised when about 9 0 % of streams are served at the FES
and that this results in a capital cost per stream of about $49 for the
situation described here. Next consider the case of a single central
ised server capable of serving a much larger number of streams, say
20,000. Such a server constructed in a heterogeneous fashion with 5
disk sizes, also running at greater than 8 5 % efficiency incurs a stor
age cost in excess of $53 per stream (using the same methodology as
above). More simply, for this particular case, the cost per stream in
the centralised case is higher than the distributed case, purely in
terms of storage. This is a result of the fact that disk storage is
inherently better suited to the bandwidth to capacity ratios found in
the distributed approach. As already discussed, it is obvious that
regardless of network topology the centralised architecture will also
cost considerably more than the distributed case in terms of band
width and infrastructure costs. For example, serving 20,000 streams
requires 60Gbps of network bandwidth from a single point to a
diverse area.
It should be noted that the conclusions drawn here result only from
assumptions made regarding server architecture and that these
assumptions may not hold depending upon the actual server design
used in a particular instance. The results shown here, however, do
agree well with those shown in the literature [Nuss95] [Tetz94] in
that caching of popular titles close to customer populations is eco
nomically sensible.

Interactive Video Network Design 96
The value of the method used here is that no assumptions were
required regarding the network architecture, since it was not neces
sary to account for bandwidth costs in the analysis. Considering
bandwidth costs would, however, certainly serve to reinforce the
conclusions presented here. Bandwidth costs have been avoided
here due to their heavy dependence on core network topology and on
the weighting between storage and bandwidth costs which is difficult
to quantify in a general fashion. Depending on the assumptions
made for bandwidth costs (Nussbaumer et al. [Nuss95] assume that
they are similar to storage costs) the argument in favour of distrib
uted storage is considerably enhanced. This is easily accounted for
by the arguments associated with Figure 3.1.
One implicit assumption in the above result is that the FES cache
will always store the most popular set of movies at any time. This is
necessary if the cache is to be able to serve the number of requests
suggested by the popularity distribution. In order, to confirm that
the cache will be able to maintain consistency given changing video
popularities, caching algorithms are investigated in the next section.
It should be noted that this issue has been totally ignored by the lit
erature, with all previous work preferring to assume that a cache will
always be able to store the current Top M movies.
3.6 Caching Algorithms for the Front End Server
Given that a distributed architecture is most cost effective in terms
of both storage and bandwidth, it is important to consider how to
maintain the efficiency of the distributed approach. The figures of
Table 3.4 only apply if the cache is storing the most popular movies
at all times. If the cache is storing unpopular titles, the percentage of
customers served by it will be very small, with a consequent increase
in load on the VS and on overall system cost. As such, it is critical to
the efficiency of the system that the cache currency be maintained at
all times. Although caching algorithms for computer systems are

Interactive Video Network Design 97
well studied (see for example [Kare94]), the same algorithms are not
really applicable here.
Standard computer caching algorithms must be simple enough to be
implemented in hardware and operate extremely quickly to yield
benefits over a reference to main memory. In the case of an interac
tive video cache located at the FES, the algorithms can be considera
bly more complex, since the timescales of operation are much longer.
Also the same locality-of-access ideas that are seen in computer sys
tems do not apply here. Indeed, as a first step in evaluating the effi
ciency of a FES cache a model of video popularity variation with time
is required. Put simply, such a model would reflect how the popular
ity of a given movie title would change over its lifecycle from the date
of release to a date when it is very rarely selected at all.
3.6.1 Video Popularity Variation Model
When a video is initially released it can be observed to move quickly
to its highest ranking and then move slowly down (with occasional
rises) through the chart over time before eventually dropping out of
the chart altogether. An example of this trend is shown for the movie
"River Wild" from the time it was originally released in Australian
cinemas in November, 1994 in Figure 3.13 [MPDA95].
o
'u0 1 2 3 4 5 6 7 8 Week in Chart
Figure 3.13 Life cycle of "River Wild" following Australian cinema release

Interactive Video Network Design 98
The "lifecycle" of this title is representative of several titles investi
gated. There are of course exceptions, such as science fiction movies
which although never reaching a high rank, seem to remain fairly
constant for very long periods of time. Other "cult" movies may move
very quickly to a high ranking before dropping out of the charts just
as quickly. It is difficult to account for all of these variables in a
model for chart movement and even more difficult to justify the com
plexity of such a model since validation is a large problem due to the
low availability of truly relevant data. The modelling approach
described below is a simple algorithmic approach aimed at account
ing for the major artefacts observed in a brief investigation of movie
popularity variation. It will be shown in Section 3.6.1.1 that this
approach gives credible results.
The algorithm starts with videos filling each of the K (say 1000) avail
able slots. At discrete intervals of time, each video will move a cer
tain distance either up or down the chart. The distance that a video
moves is a uniform random variable which is proportional to its cur
rent rank (with a constant of proportionality, a). That is, lower
ranked videos move more quickly (either up or down) than higher
ranked videos. This captures the fact that a video will climb very
quickly until it reaches its peak, and also that a descending video
will descend more quickly as it proceeds lower down the chart. A
video that is moving up the chart will turn around and start moving
down with some probability p. A video that is moving down, will con
tinue to move down. When the rank of a video is greater than 1000,
it has dropped off the bottom of the chart and is replaced by a new
video, which is inserted into an available slot and initially set to
move up the chart. It is important to note that the available slots are
spread evenly throughout the chart and not concentrated at the bot
tom. This is because the algorithm commences moving videos from
the top of the chart and works down, which often means that a high
level slot won't be filled until we go through the process of filling the
empty slots with "new releases". The algorithm used generates a

Interactive Video Network Design 99
chart matrix with each column representing a week and each row a
video rank.
Note that the algorithm described above relies on just two parame
ters, a and p. By altering these two parameters we can alter how
long on average a title stays in the chart, and how quickly it rises
and falls. Figure 3.14 shows the chart movement generated for some
selected videos (represented by integer id's) by the above algorithm
for values of a = 0.2 and p = 0.2. It is observed (visually) that the
chart trajectories of various titles tends to follow the trends observed
for actual titles (see Figure 3.13).
o
100
200
300
400
« 500
600
700
800
900
10°°0 10 20 30 40 50 60 70 80 90 100
Time (weeks)
Figure 3.14 Example output from algorithmic popularity model of video lifecycle
3.6.1.1 Validation of the Algorithm
Although a model of popularity change with time is relatively easy to
develop, the lack of empirical data on this topic makes detailed vali
dation difficult. Although movie data was used in the example in
Figure 3.13, such data is only available in small quantities and gen
erally only represents the Top 10 or 20 titles in a chart. As such, an

Interactive Video Network Design 100
alternative source of empirical data has been used in this thesis.
Each week the Australian Records Industry Association (ARIA)
releases detailed charts of the Top 50 music albums and singles sold
during the past week. Due to the unavailability of similar informa
tion for video rental, it is these statistics that are used to validate the
model of video popularity presented here.
In order to gauge the usefulness of our chart movement algorithm
we compare several statistics of our charts to those of actual charts
from the music industry. The statistics used to compare the two are:
• Highest ranking achieved
• Number of weeks in the Top 50
• Area under the curve - this is proportional to the total number of
viewers (or listeners)
The distributions have been determined for each of these statistics
from over 2 years of weekly ARIA charts and from our algorithmically
generated charts for a range of values of a and p. Low values of a
and p lead to slow moving charts, with individual titles spending
long time in the chart. Higher values of a and p lead to faster moving
charts with titles moving rapidly up the chart, but turning and fall
ing out of the chart equally rapidly. As a comparison, three values of
a and p have been selected for comparison with the ARIA chart sta
tistics. In particular, values of (oc,p) that have been used are (0.1,0.1)
(termed "slow"), (0.2,0.4) (termed "normal") and (1.0,1.0) (termed
"rapid"). The distributions of each statistic discussed above are
shown in Figure 3.15, Figure 3.16 and Figure 3.17 respectively.
From the cumulative distributions it is observed that graphically the
"normal" algorithmic chart provides a relatively close fit to the ARIA
chart in all three statistics considered. Although from a strict statis
tical viewpoint the goodness-of-fif is not exceptional, the graphs do
show that the algorithmic approach exhibits the same trends as the
actual ARIA chart statistics. Most importantly, however, the "slow"

Interactive Video Network Design 101
1
0.9
0.8
0.7 o
§0, CD t_
CD 0,
io.
n r l r
ARIA Charts — Rapid
Average
Slow
15 20 25 30 35 Highest Ranking Achieved
40 45 50
Figure 3.15 Cumulative frequency of highest ranking achieved for ARIA and algo-rithmically generated charts
1
0.9
0.8
0.7
ve fre
quen
cy
p o
31 |o.4 ZJ
O 0.3
0.2
0.1
-
-
- / / /
-
1
-*'
/ /
/ i
i
i
i
I x / / x /
1 / /
/
i
-^-^ , , , r, r* X X, X X ,V V V, V V ,V
/ / / x •''
/ / / x • '
/ X .'
1 / X /
/ /
x ARIA Charts
— Rapid
Average
Slow
1 1 1 1 1 1 1 1
X.-*i
-
_
~
-
-
10 15 20 25 30 Weeks in Chart
35 40 45 50
Figure 3.16 Cumulative frequency of weeks in chart for ARIA and algorithmically generated charts

Interactive Video Network Design 102
1 I O ^ ' 1 "x^EXS^S:
>* o r CD -I tr ci> *— c) > CO 3
F n O
0.9
0.8
0.7
0.6
1)5
0.4
0.3
0.2
0.1
"o 200 400 600 800 1000 1200 1400 1600 1800 2000 Area Under Chart
Figure 3.17 Cumulative frequency of area under chart for ARIA and algorithmically generated charts
and "rapid" charts form an envelope which always completely
encloses the ARIA (and normal) chart. Hence, by considering the
performance of the caching algorithms for all three of the algorithmic
chart models shown here, it is likely that the actual performance of
the cache will lie within the results obtained. Note that the "slow"
and "rapid" charts are aptly named with reference to the distribution
of the number of weeks in the chart and the area under the chart.
Interestingly, the highest rank distribution is not significantly differ
ent for any of the charts. A title (that reaches the Top 50) is almost
equally likely to reach number 1 as it is to reach any other position.
Although titles in the "rapid" chart spend only a short period of time
in the chart, they also move very quickly, implying that they are just
as likely to reach high positions as titles in the other charts.
3.6.2 Caching Algorithms
With a realistic model of video movement in place, it is now possible
to compare appropriate caching algorithms for use in the FES. Sev-
ARIA Charts
- Rapid
— Average
- Slow

Interactive Video Network Design 103
eral algorithms have been designed and implemented. The algo
rithms (first proposed in [Barn95b]) are described below. In each
case, the amount of space in the cache is sufficient to allow it to hold
M movies.
• Ideal - The Top M movies are always held in the cache. This is
achieved by looking forward into the popularity chart and forms
an unachievable best case bound.
• Static - The cache contents begin with the initial Top M movies
and never change. This effectively forms a worst case bound.
• More Requests - When an uncached title with more requests
than one currently cached is requests, it is moved into the cache
at the expense of the one with the least requests. The cache starts
with the Top M movies in place.
• More Frequent - If the time between the last two requests for an
uncached title is less than that for any of the cached titles then
the new title is inserted. Again the cache starts with the Top M
movies in place.
• Moving Average - Similar to More Frequent, but looks at the
interarrival time of a group of requests greater than two and uses
the average interarrival time to determine whether replacement
should occur.
It is important to note that the replacement of a movie in the cache
incurs essentially no overhead (other than the initial transmission of
the video from the VS). This is because in each case a replacement
only occurs at a time that coincides with the transmission of a
request to a customer; and this transmission must by necessity pass
through the FES anyway. Also, the movie being deleted is still held
in the main video server and so no form of backup or transmission
from the FES upstream to the VS is required.

Interactive Video Network Design 104
Notice also, that the simplicity of the above algorithms ensures that
only a slight computational overhead is incurred at the FES. As such
there will be no difficulty with implementing such schemes at each
FES in order to ensure that cache contents are kept up to date with
the current most popular titles. As the next section will show, even
these simple algorithms are capable of achieving this task.
3.6.3 Performance of Caching Algorithms
The above algorithms were all implemented in an event driven simu
lator with 10,000 customers each connected to a FES in turn con
nected to a core network with several video servers (VS's). Movie
requests are generated with a Poisson arrival distribution. The
requested movie is determined by generating a Uniform(0,1) random
variable and using Equation 3.8 to map this to a movie rank from
the empirical distribution. This rank is translated to an unique video
object identifier using the algorithmic approach discussed in
Section 3.6.1.
The different caching algorithms are compared based on the per
centage of requests that are satisfied at the FES without need to
refer to the VS. Note that this is identical to the concept of cache hits
traditionally used as a figure of merit for cache systems.
The performance of the algorithms are compared for a variety of
cache sizes and a number of different parameters for the input
charts. As already seen, when the values of a and p are changed, the
charts become faster or slower moving. We evaluate the algorithms
for both "rapid" and "slow" moving charts as well as the "normal"
case that best matches the ARIA chart. Figure 3.18 shows the
results for the "normal" chart for various policies for cache sizes
ranging from 1 to 200 movies.

Interactive Video Network Design 105
80 100 120
Cache Size 200
Figure 3.18 Cache performance for various policies
Note that in all graphs the 9 5 % confidence intervals5 were within 5%
of the values shown and as such error-bars are omitted from the
diagrams to aid clarity. From the graphs above we see that the Ideal
algorithm follows the video popularity distribution shown in
Figure 3.5. This is to be expected as it provides perfect caching
always storing the Top M movies. The results of Figure 3.18 imply
that for cache sizes above about 40 movies the More Frequent policy
performs best, being within 10% of the ideal case at higher cache
sizes.
At lower cache sizes we see that the Moving Average algorithm per
forms quite well (see Figure 3.18). This is due to the large number of
requests being received for all the movies in these small caches. As
caches become larger, the number of requests being received for the
less popular movies is smaller, and so it takes longer for the moving
5. Throughout this dissertation, confidence intervals of simulation based results are calculated using the method of "batch means" as discussed in [Law91].

Interactive Video Network Design 106
average to adjust (especially with larger window sizes). Effectively the
moving average algorithm takes too long to "realise" that a movie has
become popular and the movie is possibly already descending the
chart again by the time it has been moved into the cache.
The More Requests algorithm performs quite poorly due to the fact
that it essentially caches the most popular movies of all time. For
example, current contents of the cache may include "E.T.", "Cas-
blanca" and "Gone with the Wind" even though these movies are no
longer particularly popular.
As expected the Static algorithm performs very poorly, as it never
adjusts to the changing popularities of videos with time.
Results from the More Frequent Algorithm are encouraging. As dis
cussed above, it performs within about 10% of Ideal at cache sizes of
between 70 and 100 movies and is straightforward to implement.
In the next section we evaluate the performance of the algorithms in
faster and slower moving charts than those used above.
3.6.3.1 Sensitivity Analysis
The charts used above were selected to be the best match to the
available ARIA chart data. It is possible that video charts will move
more or less rapidly than these. In order to determine the sensitivity
of the algorithms to these changes, we have examined "slow" charts
(alpha=0.1, p=0.1) and "rapid" charts (alpha=1.0, p=1.0). The effect
that the change in parameters has on the charts is shown in
Figure 3.15, Figure 3.16 and Figure 3.17.
Following this change in the input chart parameters, it is observed
that all algorithms perform better in a chart that changes more
slowly, which is to be expected. Importantly, the More Frequent algo
rithm still performs quite well in the fast moving chart where the
other algorithms degrade quite badly (refer to Figure 3.19 and
Figure 3.20).

Interactive Video Network Design 107
100
90
80
70
w d=: 60 CD O 50 CO O >? 40
30
20
10
0
1 ' 1 1 1 1——-—1 1 1
/ • • •' . . © • • " " " " " .•••••'
/ * , • • / ' . - • • • " '
p / ..=*•••
/x /
*'
Ideal
— Static
More Frequent
+ More Requests
x - Moving Average (2)
o Moving Average (10)
i i i i
-
-
"0 20 40 60 80 100 120
Cache Size 140 160 180 200
Figure 3.19 Cache performance for slowly moving charts
100
._.
+
X
o
- Ideal
Static
- More Frequent
More Requests
Moving Average (2)
Moving Average (10)
o 20 40 60 80 100 120
Cache Size
140 160 180 200
Figure 3.20 Cache performance for rapidly moving charts

Interactive Video Network Design 108
Although it is possible that further improvements could be made to
the algorithms identified here, emphasis should be given to the fact
that computationally simple algorithms can be shown to perform
very well in a variety of realistic situations. This would indicate that
effective caching can be performed at Front-End Servers, despite the
sometimes rapidly changing video popularities.
3.7 Conclusion
This chapter has considered interactive video network design. Spe
cifically, the issue of distributed versus centralised approaches to
storage have been discussed with reference to realistic server archi
tectures and cost models. Earlier, similar analyses have used elegant
but unrealistic assumptions regarding server cost and numerous
simplifying assumptions concerning the topology of the core net
work. Our approach developed a server cost model based on a realis
able hardware architecture and eliminated network costs from the
analysis. Incorporating network costs would only serve to reinforce
our conclusions regarding the efficiency of distributed approaches to
storage.
A detailed model of server cost was developed early in the chapter.
This required models for disk cost and video popularity which were
derived and validated against empirical data. Analysis of the result
ing model revealed that the highly skewed video popularity distribu
tion leads to resource wastage in an homogeneous storage system
consisting of a single type of disk. This lead to the proposal of an
heterogeneous storage system [Barn96c] which maintains the
advantages of previously proposed hierarchical storage systems but
without the disadvantages of R A M and tape storage.
Optimisation of this realistic heterogeneous approach lead to system
costs which were comparable to the demonstrable lower bound given
by the "ideal" heterogeneous system, initially derived. With a realis-

Interactive Video Network Design 109
tic model of system cost in hand, centralised and distributed
approaches to storage were compared in terms of cost per stream.
For a given set of assumptions, it was demonstrated that a distrib
uted approach actually costs less in terms of storage than the cen
tralised equivalent. Further, for the circumstances considered, it was
shown that a cache located at the FES should be dimensioned such
that it aims to serve approximately 9 0 % of the total number of user
requests for the popularity distribution presented here.
Given that a distributed architecture results in the imnimal cost, the
final section of the chapter has developed and analysed several cach
ing algorithms suitable for use in a FES of a distributed interactive
video system. Chart movement was generated algorithmically and
validated against actual chart data obtained from the music record
ing industry. This movement data was then used to evaluate the
caching algorithms proposed. It was seen that a simple caching
scheme based on request interarrival times for each particular title
is efficient and maintains a high ratio of cache hits, even in relatively
fast moving charts.
Several important conclusions arise from this chapter.
• The FES is a logical place for the placement of video buffers (cach
ing) since considerable functionality is already required there.
• Magnetic disk cost can be modelled as a linear function of capac
ity, with no clear correlation between cost and speed.
• Video popularity is difficult to accurately model due to a lack of
empirical data. Existing data indicates that the commonly used
Zipf distribution may not be suitable for large numbers of objects.
This is confirmed by the large number of different popularity mod
els in used (see Chapter 2).
• Disk based video servers can be particularly inefficient if not
designed carefully, accounting for both storage and bandwidth
requirements of individual objects.

Interactive Video Network Design 110
• For a given server implementation, distributed storage is econom
ically more viable than centralised storage. This reinforces the
results of Nussbaumer and Tetzlaff which were made under con
siderably different assumptions.
• Simple caching algorithms provide adequate performance to cater
to the changing popularities of objects typically encountered in an
interactive video system.
Following from these conclusions the next chapter considers the use
of disk arrays in video servers in more detail. Specifically the reliabil
ity of a disk array is investigated and a performability analysis is
used to determine the most efficient "level" of RAID to use for inter
active video applications.

Interactive Video Server Design 111
4. Interactive Video Server Design
The best is the cheapest.
- Benjamin Franklin
4.1 Introduction
Video servers form the heart of an interactive video network. As well
as providing high storage and throughput capacities, video servers
must be highly reliable to ensure customer satisfaction. With this in
mind, this chapter focuses on the efficient and reliable design of
such video servers. As seen in Chapter 3, many of these servers will
be deployed in a large-scale interactive video network. Hence, low
cost and high reliability are essential in any server design.
Section 4.2 briefly revisits the idea of storage hierarchies proposed to
solve the problems caused by the extremely skewed video popularity
distribution. The drawbacks of such hierarchies are reiterated, and
the benefits of disk arrays clarified. Section 4.3 considers disk
arrays in detail, particularly examining the relevant levels of RAID
used to provide redundancy and improve reliability. From the 7 lev
els of RAID, levels 3 and 5 are found to be most suitable. This con
clusion is in agreement with the literature where both levels are
advocated by different authors (see Section 2.4.7). In an effort to
alleviate the apparent confusion between the two, the trade-offs are
discussed in detail in the rest of the chapter. A cost comparison of
RAID 3 and RAID 5 is performed in Section 4.4, while performability
of each array type is analysed using discrete-time Markov Reward

Interactive Video Server Design 112
Models in Section 4.5. Combining the cost and reliability models of
the previous sections, Section 4.6 shows the results of several case
studies, comparing the suitability of RAID 3 and RAID 5 arrays
under a range of conditions. Section 4.7 draws the conclusion that
RAID 5 is superior for a broad range of operating conditions.
4.2 Storage Hierarchies
Video servers are essentially massive I/O machines, responsible for
maintaining a large number of high-bandwidth streams for long
periods of time. As already mentioned, these servers will require
thousands of gigabytes of storage capacity and thousands of megab
its per second of bandwidth. As discussed in Chapter 2, there are a
number of approaches to meeting these requirements. Perhaps the
most intuitive approach involves the use of a storage hierarchy,
whereby popular movies requiring larger bandwidths (due to the
greater number of viewers) are allocated to correspondingly higher
bandwidth storage such as RAM. Similarly, unpopular movies are
potentially archived on slow but cheap optical disk or tape storage.
Such systems are discussed in [Barn96c] [Barn95a] [Doga94b]
[Lau95b] [Stol95] in various different guises. The limited flexibility
and scalability of such hierarchical systems is problematic and their
general utility in the field of video services is open to debate. The use
of disk arrays for the entire storage requirements can potentially
overcome the need for hierarchical storage, since large disk arrays
are able to satisfy the high bandwidth requirements of popular mov
ies even for large customer populations. Efficiently utilising disk
arrays for unpopular movies is also an important issue. Chapter 3
presented an efficient heterogeneous scheme for allocating movies to
disk arrays using different disk capacities to form a sort of storage
hierarchy. In Chapter 5 we develop an efficient heuristic for the use
of homogeneous disk arrays which stores unpopular movies cost
effectively by utilising resources that would otherwise be unused by

Interactive Video Server Design -| -| 3
the popular titles. Using this approach a video server will consist of a
number of identical disk arrays each storing a subset of the total set
of movies.
4.3 Disk Arrays
The architecture of a video server based on multiple disk arrays is
shown in Figure 4.1.
Figure 4.1 A disk array based video server architecture
Large disk arrays seem able to meet the performance demands of
most interactive video applications. Although considerable work has
been done to show that such arrays are indeed capable of providing
the high performance (measured in terms of throughput) to satisfy
these requirements (see Section 2.4.2), little has been done to show
that the availability1 of the video server will match it's performance.
1. In this thesis the term "availability" is used to represent the proportion of time that a server is fully operational.

Interactive Video Server Design 114
4.3.1 Reliability Problems and RAID
In addition to having a high storage capacity and bandwidth, a video
server must be reliable. It must meet some minimum requirement
for the percentage of time it is available to serve customers requests,
without requiring constant maintenance. Various redundancy
schemes are available to help meet this requirement but they vary in
their efficiency during the various modes of operation and also in
their cost. The various mechanisms are all classified into a group
referred to as Redundant Arrays of Inexpensive (or Independent)
Disks (RAID), as discussed in Chapter 2. The levels of RAID are
revisited below with particular reference to their suitability for inter
active video systems. For further details refer to [Chen94b].
• RAID 0 (Nonredundant) - This level of RAID has no redundancy
at all and has correspondingly poor reliability with MTTFsystem =
MTTFdisk/Number of Disks [Schu89]2.
• RAID 1 (Mirrored) - Here an entire duplicate of the original array
is used so that if any disk in the original array fails, we can switch
to the duplicate array. Unfortunately this architecture doubles
the cost of storage in our video server and as such is not applica
ble to the already costly environment discussed here.
• RAID 2 (Memory-Style ECC) - This level uses Hamming codes to
be able to detect and repair a single bit error. Even without knowl
edge of which disk has failed, the system can repair the data in
real-time. This is largely unnecessary in modern disk arrays since
the array controller can identify which disk has failed. Again the
cost is high with the number of redundant disks equal to the log
arithm of the number of data disks.
• RAID 3 (Bit-Interleaved Parity) - Operates similarly to RAID 2
but relies on knowledge of which disk in the group has failed and
uses a single parity disk to rebuild the data. This approach uses
2. MTTF = Mean Time To Fail

Interactive Video Server Design 115
fine-grained striping (see Section 2.4.2) to service requests. The
cost here is minimal as only a single additional disk is required
regardless of the array size.
• RAID 4 (Block-Interleaved Parity) - Similar to RAID 3 except
data is interleaved across disks in blocks of an arbitrary size
(rather than bitwise as in RAID 3). Again the cost is only that of a
single disk per group.
• RAID 5 (Block-Interleaved Distributed-Parity) - RAID 4 has a
bottleneck at the parity disk since it must be accessed for every
write to any data disk. This effectively decreases throughput
under heavy write workloads. RAID 5 overcomes this problem by
distributing parity and data among all disks in the group. This
effectively removes the idea of a normally dormant parity-only
disk, but retains the ability of the system to recover from a single
failure. RAID 5 is entirely superior to RAID 4, and is often the pre
ferred level for standard file system applications. This approach is
effectively coarse-grained striping (see Section 2.4.2) with distrib
uted parity.
• RAID 6 (P + 9 Redundancy) - This is essentially an extension of
RAID 5 with another redundant disk coded in such a way that the
system can now withstand two disk failures. This could be impor
tant in extremely large arrays or where data integrity is critical.
Clearly there is an increase in cost (of one disk) from the RAID 5
approach, although for large arrays, this cost increase is negligi
ble. There has, however, been little support for the deployment of
RAID 6 arrays in industry. This is presumably due to higher
implementation complexity and due to the satisfactory perform
ance of lower levels of RAID. For this reason, RAID 6 is not consid
ered further in this thesis.
For reasons discussed above RAID 3 and RAID 5 are considered as
the two most suitable candidates for video servers. The only differ
ence between these approaches is that RAID 3 uses fine-grained

Interactive Video Server Design 116
striping, while RAID 5 uses coarse-grained striping. This difference
is discussed in the next section.
4.3.2 Striping in Disk Arrays
The primary advantage of disk arrays is their ability to increase both
capacity and bandwidth with only a linear increase in cost. This
advantage is gained through disk striping. Disk striping involves
placing data across a number of disks rather than just on a single
disk. In a traditional3 file system, for example, a 10MB file might be
spread across 10 disks with 1 M B allocated to each disk. Clearly, if
the only request being serviced is for this file and the architecture
supports it, this file can be retrieved in about l/10th of the time
(with fine-grained striping) that it would take if stored on a single
disk. Disk striping schemes can be categorised into two types: fine
grained and coarse-grained. Section 2.4.2 discussed these two
schemes in some detail.
From a RAID perspective fine-grained striping corresponds to RAID 3
while RAID 5 implements coarse-grained striping. This difference
has important consequences. In RAID 5, the block size on each disk
is the same as the block size requested by the user. In fine-grained
striping (RAID 3) the block size requested by the user is a factor of D
times larger than the block size of each disk (where D is the number
of disks in the group). Figure 2.7 (reproduced in Figure 4.2) serves to
illustrate this key difference between fine and coarse grained strip
ing. As will be shown in the next section, this difference in block size
has a large effect on the efficiency of the disk array.
3. Here, "traditional" refers to computer systems which have rapid data retrieval as their goal. Prior to multimedia applications most computer systems could be de
scribed in this way.

Interactive Video Server Design 117
Fine Grained Striping
Array Controller
Clients
Coarse Grained
Striping
Array Controller
c Clients
Figure 4.2 Comparison of fine and coarse grained striping
4.4 Cost of RAID 3 vs RAID 5
This section investigates the cost of implementing a RAID 3 or
R A I D 5 video server capable of supporting the s a m e peak load. Disk
block size selection has a large effect on the throughput capabilities
of magnetic disk drives. Further to this, the choice of R A I D level (3 or
5) directly effects this block size.
If w e a s s u m e that a certain buffer exists in the Set-Top B o x (STB) at
the customers premises, then a single video block4 (the block
retrieved in each service cycle) cannot exceed this buffer size. It is
actually likely that this buffering will be provided within the video-
server, with only smaller "dejittering" buffers at the STB. A s s h o w n
in [Toba93], this approach ideally allows effective m e m o r y sharing to
alleviate the need for double buffering [Mour96]. With buffers located
4. Note that a "video block" is the amount of data retrieved during each round, while a "disk block" is the amount of data retrieved contiguously from a single disk. Only in the case of RAID 5 are they equivalent.

Interactive Video Server Design 118
at the client, double buffering is required so that while one buffer is
playing out the other is available to be filled. By locating the buffer
ing at the server and efficiently sharing the memory space, it is pos
sible to remove the need for double buffering and hence the buffer
allocated to each stream is just the size of one video block (in the
limit). This scheme does, however, require all the memory to be
located at the server, and hence the cost will be borne by the service
provider. If the memory requirement is "pushed" out to the STB the
server system cost can be appreciably reduced (as seen in
Figure 4.4). It is not our intention here to recommend one scheme
over the other, but instead to point out that both schemes are feasi
ble and must be considered in the analysis presented here.
Assuming that efficient shared buffering is implemented at the
server let us denote the buffer size allocated to each stream as B
bytes and hence a video block is also B bytes5. The number of video
blocks required by a given movie is governed by its length. Let us
assume a particular video requires M blocks. So, clearly B*M is the
total storage capacity required by the movie (in bytes). If a disk array
with D disks is used to store this movie, the actual disk block size
will depend on the type of striping used. For fine-grained striping,
each disk will have M blocks, but the size of each block will be B/D
bytes, since all disks are accessed for all requests. For coarse
grained striping each disk will have M/D blocks of size B bytes.
Clearly, for a given video block size, coarse grained striping results
in larger disk block sizes, which as presented below, leads to
improved disk throughput.
4.4.1 Throughput vs Block Size
When servicing a request, a disk goes through several phases in
order to read the data. The heads must move from their current
location to the start of the data (seek time), the disk must rotate
5. In the case where double-buffering is used, the buffer size would be 2B per stream, but the argument presented still applies.

Interactive Video Server Design 119
until the start of the data is under the head (rotational latency)6, the
data must be read at a rate determined by the time per revolution,
with the head seeking to the next track once each track is read (or
performing a head switch to another track in the same cylinder); this
continues until the entire disk block has been read. As such, the
sustainable throughput of a single disk drive can be determined as
the amount of data read divided by the time it takes to read it plus
the delay incurred by overheads such as seeking and rotational
latency (see Equation 4.1). We don't model such things as bus con
tention between disks since (as stated in Chapter 2) we assume a
non-blocking high-bandwidth interconnect such as ATM. Similar
models of disk throughput have been used in the past by various
authors to account for the mechanical overheads of disk operation
([Chan94b] [Chen93] [Rama95] [Vin94a]). The sustainable through
put of a disk is thus governed by a number of factors as shown
below. Note that definitions of all symbols used in this chapter can
be found in Table 4.1, although they are also described as they
occur.
NrCT Rn = r,r -•„ r-4—7 7—T- <Ec<n 4-1>
where RD - sustainable throughtput (bytes/second)
NT = number of tracks per block
CT = capacity of a single track (bytes)
tsl = track-to-track seek time (seconds)
= (assumed equal to head-switch time)
t = average seek time (seconds)
tt = rotational latency (seconds) = tr/2
tr = time for one revolution (seconds)
The ceiling function in Equation 4.1 rounds up the number of seeks
and latencies to the next highest integer. This implies that the most
efficient read size is an integral number of tracks as this minimises
6. Rotational latency can actually be eliminated by the use of "On Arrival Caching" [Cohe95], otherwise known as Zero Latency Read which is applicable when reading multiple tracks in a single block. This requires hardware support at the disk level and
so will not be assumed here.

Interactive Video Server Design 120
Table 4.1 Definition of symbols used in Chapter 4
Symbol B M D
RD
R NT
C'p
tsl
tsa
tl
tr
tl
t2 KD
Kl
K2
cD
C
KB
RI
K Re
P ri, t mod p
*s
V
X
V-
M-'
P0W
Pl(t)
P2(t)
Z(t)
X(t)
Y(t)
n
Definition
video buffer size (bytes)
number of blocks per video
number of disks in an array
throughput of a single disk (bytes/sec)
throughput of a disk array (bytes/sec)
number of disk tracks per video block
capacity of a single disk track (bytes)
track-to-track seek time (sees)
average seek time of a disk (sees)
average latency (sees)
time for one rotation of a disk (sees)
tr+tsl
tsa+,trtsi
cost of a single disk ($) = K : + K 2 * C D
fixed part of disk cost ($)
variable part of disk cost ($ / GB)
capacity of a single disk in an array
total capacity of RAID array.
cost per byte of buffer ($/byte)
average rate of a single video stream (bytes/sec)
total cost of a disk array and buffering ($)
reward structure for disk array
number of columns in reward structure (typically 24)
reward rate in state i at time t
failure rate of a single disk = 1 / M T T F
(D-l)Xs
DXS
rebuild rate of an array after a single disk failure = 1/MTTR(1)
rebuild rate of an array after a total failure = 1 /MTTF(F)
probability of being in state 0 at time t
probability of being in state lat time t
probability of being in state 2 at time t
state of Markov Chain at time t
instantaneous reward earned at time t, X(t) = rZ(t) t m o d p
total accumulated reward up until time t
number of discrete time units in t, n = t/ A t

Interactive Video Server Design 121
the overhead caused by seeking and latency. Clearly there is an
overhead incurred by the seek and rotational latency of the disk for
every block retrieved. This overhead is minimised by retrieving a
small number of large blocks as is the case with coarse-grained
striping.
Before continuing the discussion, we simplify the notation of
Equation 4.1 as follows:
NTCT RD=\NT-]tl + t2
(Eqn 4.2) where tx = tr+ tsl
and *2 = tsa+tl~tsl
Now the number of tracks read from each disk depends on the video
buffer size B and the number of disks in the array D. For the
remainder of the analysis it is assumed that the number of tracks
read for each block is chosen to be integral and so the ceiling func
tion in Equation 4.1 and Equation 4.2 is no longer required. The
number of tracks read per block is given by:
B DCn
RAID 3: NT = ̂ (Eqn 4.3)
RAID 5: NT = -f- (Eqn 4.4)
As expected, the size of the disk blocks used in a coarse grained
approach are larger by a factor of the number of disks in the array
than the block size used with fine-grained striping.
The expected throughput from a RAID 3 and RAID 5 array can now
be written in terms of the video buffer size B and the number of
disks in the array as well as the disk related parameters. (Notice that
R 3 and R 5 give the array throughput, whereas R D is the throughput
of each disk in the array).
™° 3: *3 = {B/(DCT))tl + t2 (Eqn 4"5)
BD {B/CT)tl + t2
RAID 5: R5 = I T 3 , n " ~ (Eqn4.6)

Interactive Video Server Design 122
It should be noted that in RAID 3, throughput may actually be
slightly less than that shown in Equation 4.5 due to the fact that all
disks must remain synchronized. We don't attempt to model this
slight penalty here, instead assuming that all disks will remain per
fectly synchronized during operation.
We can now rearrange Equation 4.5 and Equation 4.6 to determine
the disk requirement for a particular sustainable throughput
requirement R from a RAID 3 or RAID 5 disk array. We add a sub
script to the D to distinguish between the two different cases under
consideration.
RBr, R A I D 3 : D 3 = CT(B-Rc2)
(Eqn4"7)
Rt, Rt9 RAID 5: D5 = -^ + -^ (Eqn 4.8)
Using Equation 4.7 and Equation 4.8 we can determine the number
of disks required for both RAID 3 and RAID 5 disk arrays to support
an equivalent peak load, for a fixed video buffer size. The choice of
buffer size will effect the number of disks required and as such effect
the overall system cost. In both cases a larger buffer size leads to
decreased disk requirements due to the improved throughput
obtainable. To determine the total cost of either system we must
account for disk and buffering requirements. The cost functions for
RAID 3 and RAID 5 disk arrays are shown in Equation 4.9 and
Equation 4.10.
i/ D D
RAID 3: K3 = D3KD3 + - ^ - (Eqn 4.9)
K B R RAID 5: K 5 = D5KD5 + - ^ - o (Eqn 4.10)
where KD3 and KD5 are the costs per disk for RAID 3 and RAID 5
arrays respectively, K B is the cost per byte of buffering and R: is the
bandwidth of a single stream such that R/Rx gives a measure of the
number of customers (and the number of buffers of size B required).

Interactive Video Server Design 123
Note that KD3 and KD5 differ since the disk capacity and hence cost
per disk in the RAID 3 and RAID 5 systems are different.
In order to ensure a fair comparison of the two systems, it is essen
tial that both throughput and capacities are equal. Equation 4.7 and
Equation 4.8 determine the appropriate number of disks to ensure
that the throughputs are equal, but we must introduce a constraint
to ensure capacities of the two arrays are equal. This is achieved by
selecting the disk capacity for each case according to some total
capacity requirement, C.
RAID 3: CD3=C/D3 (Eqn 4.11)
RAID 5: CD5 = C/D5 (Eqn 4.12)
Now, the cost per disk can be determined from the capacity using a
linear model with an offset as derived in Chapter 3 (Equation 3.5).
RAID 3: KD3 = K1 + CD3K2 (Eqn 4.13)
RAID 5: KD5 = K1 + CD5K2 (Eqn 4.14)
Substituting Equation 4.11 and Equation 4.12 into Equation 4.13
and Equation 4.14, and then along with Equation 4.7 and
Equation 4.8 into Equation 4.9 and Equation 4.10 the cost func
tions are obtained.
K,RBr,ti KRBoR
™°3: K3 - C&-2X + K'C + TT <Eqn"" K 5 . W + ^ + K 2 c t W (E,n4,6)
To determine the buffer size which minimises cost in either system
differentiate equations Equation 4.15 and Equation 4.16 with
respect to B 3 or B 5 and solve dK/dB = 0. Differentiating gives:
dKo K.Rt! KjRBgCyt! KBR RAID 3: 7r?T = r n r m 2
+ - R ~ (Eqn 4.17) dB3 CTB3-CTRt2 (CTB3-CTRt2)
Ki
dK5 K,Rt2 KBR RAID 5: -j=5 = L ^ + - # - (Eqn 4.18)

Interactive Video Server Design 124
Equating these expressions to 0 and solving for B in each case leaves
the expression for optimum buffer size:
IK i RR111 r0 RAID 3: B3 = Rt2 + I R c (Eqn 4.19)
RAID 5: B5 = I 1 l 2 (Eqn 4.20)
In both cases two solutions are actually obtained but by determina
tion of the second derivative, the appropriate (ie. minimal cost) solu
tion can be ascertained leaving the results shown in Equation 4.19
and Equation 4.20. Notice that in the case of RAID 5, the optimal
buffering requirements are independent of R, the required through
put. This is because block size on each disk of a RAID 5 is always
equal to the buffer size, regardless of the number of disks in the
group. In RAID 3, however, the buffer size is required to increase
with R in order to keep the block size on each disk sufficiently large
to gain acceptable array throughput.
Substituting Equation 4.19 and Equation 4.20 back into
Equation 4.15 and Equation 4.16 yields a complete solution for the
rninimum cost of RAID 3 and RAID 5 systems of equivalent through
put and storage capacity. The above equations can also be used to
derive the number of disks required, the necessary capacity of each
disk, and the appropriate buffer size per stream, for a given set of
parameters and requirements.
We conclude this section with a comparison of total costs (disks plus
buffering) of both RAID architectures for a range of desired through
puts. The following table shows the values used for each of the
parameters in the following comparison.
The curves in Figure 4.3 show the difference in cost for RAID 3 and
RAID 5 for a range of viewers (from 1 to 500) and for the parameter
values shown in Table 4.2. The curves shown represent the sum of
disk and buffering costs for the minimum cost system as determined

Interactive Video Server Design 125
Table 4.2 Default parameter values (disk related parameters are from the Maxtor 71260A 1.2 GB disk drive)
Parameter
Or
ti
t2
Ri
c
Kl
K2
KB
Value
51,000
0.0153
0.0167
375,000
100
188
275
50
Units
bytes
seconds
seconds
bytes / second
GB
$
$/GB
$ /MB
from Equation 4.15 and Equation 4.19 for RAID 3 and
Equation 4.16 and Equation 4.20 for the RAID 5 system.
Notice that as the number of streams approaches zero the cost of
both systems asymptotically approaches $27,500. This is because of
the requirement to provide 100GB of storage. The cheapest storage
costs K 2 dollars per gigabyte (the offset of Kx becomes negligible) and
since K 2 is assumed to be $275 (see Equation 3.5), the result fol
lows. We also see from the graph that there is an increasing differ
ence between RAID 3 and RAID 5 in terms of the minimum cost
configuration as the number of viewers supported by the array
increases. Indeed for anything above about 250 streams the RAID 3
array is more than double the price of the RAID 5 with equivalent
throughput. A RAID 3 array capable of servicing 500 streams costs
four times as much as a RAID 5 array with the same capability. This
large difference is predominantly due to the buffering costs, since
RAID 3 systems require much larger buffers in order to maintain
high throughput. Figure 4.4 shows the division of costs between
disk and buffering for each of RAID 3 and RAID 5.
Figure 4.4 is of particular interest when it is considered that the
buffering may be located in the STB or in the server itself. As such,
the cost of buffering may be borne either by the service provider or
by the customer. As can be seen from Figure 4.4 the cost of the two

Interactive Video Server Design 126
1 8
1.6
£t 1.4 -̂̂ o> c 1—
O 1.2 5= 3
m 3 1 Q.
^ CO Q 0.8 ,"-̂" *—» (/> O O 0.6
0.4
n p
x10fc I 1 1 , , , — , 1 ,_
- RAID 5 - - RAID 3
/ /
/ /
/ / /
/ /
/ /
/ / / /
/ /
/ / / / S
/ s
s s
s y
*• ^ -"
^ -" — ~
1 1 1 1 I I i i i
0 50 100 150 200 250 300 350 400 450 500
Streams Supported
Figure 4.3 Cost of RAID 3 and RAID 5 implementations
12
10
x10
% 6 o O
~ ~
RAID 5 Disk Cost
RAID 5 Buffer Cost
- - RAID 3 Disk Cost
RAID 3 Buffer Cost
n i i r~
-r >•
0 50 100 150 200 250 300 350 400 450 500
Streams Supported
Figure 4.4 Cost of RAID 3 and RAID 5 disk and buffering

Interactive Video Server Design 127
systems are much closer together if only disk cost is relevant. Of
course the results shown in Figure 4.3 and Figure 4.4 are affected
by variation of the parameters shown in Table 4.2, but the parame
ters used are typical.
In this section it has been shown that, based on reasonable assump
tions, a RAID 3 disk array is considerably more costly than an equiv
alent RAID 5 array where both have equal capacity and throughput
in a fully operational state. We assume that systems will be designed
to meet (or slightly exceed) customer demand when they are fully
operational. It is true that disk arrays could be designed to meet
total customer demand in a failed mode, but given that failures are
rare (as we show later) this would result in considerable waste of
resources and a much higher system cost, for only a slight increase
in revenue earned. It is, however, important to consider system relia
bility when comparing the two systems, and this is the focus of the
next section.
4.5 Performability of RAID 3 vs RAID 5
In this section we conduct a performability analysis [Beau78]
[Meye80] of both RAID 3 and RAID 5 disk arrays. The advantage of
such an analysis over the more traditional reliability analysis is that
it allows us to model both performance and reliability related events
in combination. Performability analysis is formally introduced in
[Meye80] and separately in [Beau78]. For more recent work in the
field and excellent general treatment of the area refer to [Triv94] and
[Smit88]. The only performability analysis of disk arrays that we
have found is by Islam in [Isla93]. [Isla93], however, does not model
the detailed reward model presented here and assumes identical
repair times for single disk and full system failures. Also the results
are not based on a particular disk array architecture and so do not
accurately model any particular RAID scheme. We do, however, fol-

Interactive Video Server Design 128
low a similar approach to that used in [Isla93] in the following analy
sis.
The operating states of both RAID arrays can be easily enumerated
as 0, 1 and 2, where state 0 corresponds to no disks failed, state 1 to
one disk failed and state 2 to a total system failure (2 or more disks
failed). Although only three, this is a sufficient number of states to
model the possible operational modes of a simple D+l RAID array.
(The D+l notation simply refers to the fact that both RAID struc
tures have D disks for data and 1 redundant disk for parity informa
tion independent of D)7. We next consider the performance of the
system in each state and use this to define a reward structure which
can be used in conjunction with a Markov Chain reliability analysis
to gain a measure of performability.
4.5.1 Performance of Disk Arrays
Much work has been done in analysing the performance of RAID
arrays in various modes of operation [Chen94b] [Munt90]. It is, how
ever, important to consider the application for which the RAID is
being utilised when interpreting the results of such work. Particu
larly, in the case of a video server we are dealing with a strictly read
only environment. Much of the performance degradation of RAID
systems occurs during write or modify operations. Such operations
will not happen in the normal operation of a video server. Only when
a movie is initially loaded onto an array are writes taking place, and
we assume this can be scheduled to occur during a lightly loaded
time for the server. As such it is in a read-only environment that we
consider the performance of RAID 3 and RAID 5 below.
4.5.1.1 RAID 3
Figure 4.5 illustrates the operation of a RAID 3 disk array composed
of 3 data disks and 1 redundant disk before and after a single disk
7. In RAID 5 the parity blocks are actually distributed across all disks in the array,
but the requirement is for one additional disk.

Interactive Video Server Design 129
failure. Before the failure (in state 0) all three data disks are being
accessed in parallel to service three separate requests. During this
mode of operation, the parity disk is idle and so it's bandwidth is
wasted. From Figure 4.5 this appears to be a large inefficiency, but
as disk arrays get larger this inefficiency decreases. At some time,
one of the data disks fails and the array enters a failure mode of
operation (state 1). W e see from Figure 4.5 that operation is almost
exactly the same except that now some calculation is required by the
array controller to correctly rebuild the data based on the parity
information stored on the parity disk. The important aspect of the
RAID 3 architecture is that it does not degrade at all after a single
disk failure (that is, it is still able to support the same load as before
the failure). It is for this reason that RAID 3 has been proposed in
the literature for use in video storage [Chan95][Cohe95].
Figure 4.5 RAID 3 maintains throughput after a single failure
4.5.1.2 RAID 5
Figure 4.6 depicts the operation of a RAID 5 disk array before and
after a failure. Since parity is distributed across all disks, we are
effectively able to utilise all disks to read useful data before failure.
Notice in the diagram that all four disks are serving three requests
each (not simultaneously, but in a particular service round) before a
failure occurs. After a failure, in order to recover the data on the

Interactive Video Server Design 130
failed disk, all the other disks read the corresponding block and a
parity calculation must be performed to determine the lost data.
(These reads are shown by darker blocks in the figure)8. Note that
the load on each disk is doubled following a disk failure. In a lightly
loaded system this m a y be tolerable. However, in a highly utilised
system (which is likely to be desirable given the cost) load will clearly
need to be shed in the event of a disk failure. In light of this fact, it
Figure 4.6 Load on each disk in a RAID 5 array is doubled after a failure
could be argued that RAID 5 arrays should be designed to meet cus
tomer demand even following a single disk failure. Given, however
that most systems spend easily the majority of the time in the fully
operational state, this would result in a considerable wastage of
resources. Also, a double disk failure (which is expected to be very
rare) would still result in either system needing to shed load. As
such, w e maintain the assumption that both RAID 3 and RAID 5
systems are designed for the same throughput and capacity when
fully operational.
From Section 4.4.1 it is known that RAID 5 architectures perform
more efficiently in a fully operational state (obtaining the same
throughput as a RAID 3 with considerably fewer disks) but it is now
8. A n alternative suggested by [Mour96] is to wait until these blocks are read in the following service rounds, but this will increase both buffering and admission delay
by a factor of D.

Interactive Video Server Design 131
clear that RAID 5 degrades significantly (needing to shed up to 5 0 %
of load) following a single disk failure. RAID 3 architectures are not
as efficient during normal operation, but are able to maintain per
formance following a single disk failure. Neither RAID architecture
can survive multiple disk failures without an intervening repair.
Given this trade-off between the two techniques we are able to
assign reward values to each array based on its state and the cur
rent load on the system.
4.5.1.3 Reward Models
From the discussion above a reward structure can be formulated for
use in a Markov Reward Model for each of RAID 3 and RAID 5. Tradi
tionally, performability reward structures have consisted purely of a
vector with a single time-independent value of reward for each state
of the system. It has been shown, however, that such an approach
can lead to inaccuracy, particularly when reliability related events
occur on similar timescales to performance related events [Triv94].
Since repair times and load fluctuations both occur on the timescale
of hours (although failures don't) a more detailed reward structure is
employed here.
The potential for an interactive video server to earn revenue (ie.
reward) varies greatly with time of day. In a typical V O D server, peak
time might occur at 8pm, with (say) 1000 viewers. But at 5am the
number of viewers might only be 50. Clearly it is more important
that the disk array be fully operational during peak times. In order
to account for this variation we introduce a discrete-time time-
dependent reward structure. This implies that the reward structure
is now a matrix of values dependent both on the state of the system
and the time-of-day. By using data from television ratings we
develop a profile of viewer load versus time of day (Figure 4.7).
Although this profile may not identically match the future profile of
interactive video services, the trends are likely to be similar. Impor
tantly, the analysis presented here is independent of this viewer pro-

Interactive Video Server Design 132
file and as such a more appropriate profile can be readily inserted if
such were available. Note that the data shown is only available as
discrete values (generally in hourly intervals) hence the motivation
for using a discrete-time reward structure. W e see from Figure 4.7
45
40
35
30
25
20
c o t/5
'> Q)
B O) C
!c o as c o
is Q. O D. O CD
en 03 O L—
0_
1.0
0.85
0.53
0.32
0.27
0.17
0.05 0-06
"0.03 0.02 0.02 0.02
0.21 0.20
°-160.14°.15
0.23 0.24
0.97
0.82
0.57
0.24
0.11
10 15
Time of Day (24 hour time)
20 25
Figure 4.7 Viewers vs Time of Day (source A. C. Neilsen - Australian TV ratings)
that the peak load is considerably higher than the mean and as such
the time that a disk array fails and the time to repair will have a con
siderable effect on reward earned. The numbers shown on top of
each bar represent the load on the server at that time of day, nor
malised such that the peak load represents one unit.
Consider the case where a disk array has been designed to be 100%
utilised under peak load when it is fully operational (ie. in State 0). If
RAID 5 is used and a disk fails during peak hour we must drop to
5 0 % of the offered load, with RAID 3 such a reduction is not neces
sary. If two disks fail, however, both systems will drop the entire load
until a repair can be affected. The reward structures used for RAID 3
(Re3) and RAID 5 (Re5) are shown in Equation 4.21 and

Interactive Video Server Design 133
Equation 4.22 and correspond to the viewer versus time of day pro
file shown in Figure 4.7. Notice that the number of rows in the
reward structure corresponds to the 3 possible states of the system,
while each of the 24 columns correspond to a one hour time slot
during the day. Neither of the reward structures shown account for
increased load during a repair operation or the potential of lost reve
nue due to customer dissatisfaction during a failure period. It is
straightforward to alter the reward structure to incorporate such
aspects, but the precise value of the change is more difficult to
determine.
RAID 3:
Re3 = (Eqn 4.21)
0.05 0.03 0.02 0.02 0.02 0.06 0.17 0.21 0.16 0.14 0.15 0.20
0.05 0.03 0.02 0.02 0.02 0.06 0.17 0.21 0.16 0.14 0.15 0.20 0 0 0 0 0 0 0 0 0 0 0 0
0.23 0.24 0.27 0.32 0.53 0.85 1.0 0.97 0.82 0.57 0.24 0.11 0.23 0.24 0.27 0.32 0.53 0.85 1.0 0.97 0.82 0.57 0.24 0.11 0 0 0 0 0 0 0 0 0 0 0 0
The shaded section of the reward structure in each case shows
where they differ. In the case of RAID 3, even with a failed disk the
full load is still supported, whereas with RAID 5 the maximum load
supported with a single failed disk is 0.5.
RAID 5:
ReK =
0.05 0.03 0.02 0.02 0.02 0.06 0.17 0.21 0.16 0.14 0.15 0.20 0.05 0.03 0.02 0.02 0.02 0.06 0.17 0.21 0.16 0.14 0.15 0.20 0 0 0 0 0 0 0 0 0 0 0 0
(Eqn 4.22)
0.23 0.24 0.27 0.32 0.53 0.85 1.0 0.97 0.82 0.57 0.24 0.11
0.23 0.24 0.27 0.3210.5 0.5 0.5 0.5 0,5
0 0 0 0 0 0 0 0 0
0.5 0.24 0.11
0 0 0
With a detailed reward structure in place the next section considers
the development and solution of a Markov Chain analysis for the
reliability of each array. Note that both RAID 3 and RAID 5 have the
same reliability model (they are both D+l arrays), it is the reward
models (ie. performance in different states) that differ, as shown in
Equation 4.21 and Equation 4.22.

Interactive Video Server Design 134
4.5.2 Reliability of D+1 Disk Arrays
In this section we present a Continuous Time Markov Chain analysis
of disk arrays with one redundant disk. This analysis is an extension
of that found in [Ng89] in that it accounts for the repair time in the
case of a total system failure. In other words the state of two disks
failed (state 2 in Figure 4.8) is not an absorbing state. Consider the
Markov Chain representation shown in Figure 4.8.
Figure 4.8 Markov Chain for array reliability
For a disk array with D disks, w e note that:
Xs - Failure Rate of a Single Disk = 1/MTTF
X' = (D-l)Xs
X = DXS (Eqn 4.23)
H = Rebuild Rate after Single Failure = 1/MTTR(1)
\x.' = Repair Rate after Total Failure = 1/MTTR(F)
Note that \i and \i' represent the rebuild rate of a single disk and
the repair rate of the entire array respectively. It is likely that the
rebuild after a single disk failure will be automated (using hot-
spares) and will not require h u m a n intervention. The repair of a toted
system failure, however, is a m u c h larger task requiring the reload
ing of the entire array, and will probably require h u m a n interven
tion. As such it is assumed that jo. > |LX' .
Now define the state transition matrix between each of the states as
shown below:

Interactive Video Server Design 135
Present State
Next State
l-XAt XAt 0 \LM 1-y.At-X'At X'At \i'At 0 l-n'At
(Eqn 4.24)
F r o m the transition matrix s h o w n in Equation 4.24, individual state
transition probabilities are obtained a n d rearranged to give:
P0(t + At)-
At
P^t + At)-
At
P2(t + At)-
-p0w
-Pi(t)
-P2W At
= -XP0(t) + nP1(t) + ji'P2(t)
= A.P0(t)-(n + X')Pi(t) (Eqn 4.25)
Taking the limit as At -> 0:
PoW + XP^-iiP^-ii'P^t) = 0
P2(t) + \i'P2{t)-X'P1(t) = o
(Eqn 4.26)
Deteirnining Laplace transforms of the above differential equations:
sP0(s)-P0(0) + XP0(s)-^P1(s)-n'P2(s) = 0
sP1(s)-P1(0) + (n + V)P1(s)-XP0(s) = 0
sP2(s)-P2(0) + ̂ 'P2(s)-VP1(s) = 0
(Eqn 4.27)
At time 0 the array is fully functional a n d as such
P0(0) = l, and Pj(0) = P2(0) = 0. This gives the following set of linear
equations in the s domain:
s + X -\i -\i'
-X s + \i + X' 0
o -X' s + n;
\PQ(S)
Pl(s)
[P2(S)_
=
1 0 0
(Eqn 4.28)
Solving using Cramer's Rule w e obtain:
where
P0(S) = (S +S(ll' + ll + X') + \JL'(\JL + X'))/d
P^s) = (s + y.')X/d
P2(s) = XX'/ d
d = s(s + s(\i' + \i + X' + X) + \L\I' + XX' + X'yi' + X\i')
(Eqn 4.29)

Interactive Video Server Design 136
Next expand each of P0(s), Pi(s), P2(s), into partial fractions to allow
us to take the inverse Laplace Transform. First, rewrite d as follows:
2
d = s(s + s(\i'+ \i + X'+ X) + \i\i'+ XX'+ X'\i'+ X\L')
1 2 (Eqn 4.30)
where r ,r = ~W + V + V + V±Jte' + V + X + tf -*(W' + W + W + W)
Now, for P0(s):
_ S2 + S{\1' + \L + X') + \1'{\L + X') °K ' s(s-ri)(s-r2)
a0 b0 c0
s s-^i s-r2
2 2 2 (Eqn 4.31) a0(s -s(r1 + r2) + rlr2) + b0(s -sr2) + c0(s -srj
sis-r^is-r^
_ (a0 + b0 + cQ)s + (- apCf! + r2) - b0r2- Cpr^s + a0r1r2
sis-r^is-rr,)
which implies:
a0 + b0 + c0 = 1
- a0r1 - a0r2 - bQr2 - CQT-^ = |a.' + \i + X' (Eqn 4.32)
a0rlr2 = V'iV + K)
and solving for a0, b0, c0 gives:
_ \i'{\i + X') a0 =
r,r, 1'2
r1H- + r-^X' + rj + r̂ p.' + |J.(J.' + X'\x.'
r2(i + r2A/ + r2 + r2p.' + \x.\i' + X'\i' C°= r2(ri-r2)
a0 b0 c0 and PJs) = — + — — + — —
u s s-rj s-r2
Expanding similarly for P^s) and P2(s) we obtain:
(Eqn 4.33)

Interactive Video Server Design 137
_ [i'X rlr2
X(r1 + \i')
a\ = rlr2
1 rl(rl-r2)
Uv' + r2)
r2(ri-r2)
a, b, and P-,(s) = — + — — + •
(Eqn 4.34)
c, =
s s-r, s-r0
and
XX' d„ = r,r. 1'2 , XX 2 rl(rl-r2)
XX' (Eqn 4.35)
r2(ri-r2)
and P2(s) = -f + r4- +
s s-Tj s-r2
Notice from Equation 4.29 that:
P[)(s) + P,(s) + P2(s) = -0 X 2 s (Eqn 4.36)
whichimplies P0(r) + P1(t) + P2(t) = 1 Vt>0
implying that the sum of the probabilities of state is always unity,
which is a necessary condition.
Finally take the inverse Laplace transforms in a straightforward
manner to obtain:
P0(t) = a0 + b0el +cQe
2
Px{t) = a1 + bierit
+ Cler2t (Eqn4.37)
P2(t) = a2 + b2e +c2e
and we have the complete solution. We can further show that r: and
r2 are always real and negative (see below) and as such in steady
state (ie. as t -> °°) the probabilities of state become:

Interactive Video Server Design 138
P = a = V-'^*1') = ir-Qi + A/) 0 ° rxr2 mi' + XX' + X'\i' + X\i'
D „ P'h M-'k 1 = l = rV2 = W + XX' + Xy + Xii' <E«n 4-38)
p = a = ^' = ^ L 2 2 rjr2 nn' + XX' + X'\i' + X\i.'
N o w consider ^ and r2 from Equation 4.30, which is reproduced
here:
_ - (p.' + H + A.' + A.) ± 7(p' + [i + X' + X)2- 4(nn' + M ' + W + W) rv r2 2
Consider the term under the radical:
(Eqn 4.39)
(H' + [i + X' + X)2 - 4(fi|i' + XX' + X'y.' + Xji') (Eqn 4.40) 2 2
= p' + |0.|0.' + n'A.' + \i'X + \i\i' + (X + \iX' + \iX + X'\i' + X'2 + XX' + X\JL' + X[i + XX' + X2- 4\i\i' - AXX' - AX'\i' - 4X\i' = n'2 + y2 + X'2 + X2- 2wa/ - 2\i'X' - 2XX' - 2X\i' + 2\iX' + 2\iX = (u - \i')2 + (X- X')2 + 2(X + X' )(n - n')
Assuming that \i > \x.', which simply implies that a multiple disk fail
ure will take at least as long to repair as a single disk failure, then
we can see that the term under the radical is always positive and as
such Ti and r2 are always real.
Now, to show that both rj and r2 are always negative we need:
(ii' + li + X' + X)> *J(\i' + \i + X' + X)2 - 4(u.u.' + XX' + X'\x.' + Xu.') (Eqn 4.41)
Squaring both sides we get:
(li' + \i + X' + X)2 >{\i' + \l + X' + X)2 - 4(jijl' + XX' + X'\i' + X\i') (Eqn 4.42)
which gives:
0>-4(\i\i' + XX' + X'\l' + X[l') (Eqn 4.43)
which is always true since p > o, \i' > o, X > o, X' > o.
Hence, we see that both rx and r2 are always real and negative, and
as such the exponential terms in our solutions (Equation 4.37) are
decaying with time. This fact leads to the steady-state solutions
shown in Equation 4.38.

Interactive Video Server Design 139
4.5.2.1 Validation of Reliability Model
In order to validate and extend the Markov chain reliability model
derived above, an event driven simulation has been used in order to
relax some of the constraints made in the derivation of the model.
Specifically, failure and repair times may not be exponentially dis
tributed as was assumed by the Markov model of Figure 4.8.
Before modifying these assumptions, consider the event-driven sim
ulation where failure and repair times are exponentially distributed.
In this case the results for probability of state of the array should
match exactly with the results derived in Equation 4.37. Figure 4.9
shows the equilibrium probabilities of state (for states 0, 1 and 2)
versus the number of disks in the array. The MTTF of a single disk is
assumed to be 10,000 days (240,000 hours) and the MTTR a single
failure (denoted MTTR(l)) is 1 day (24 hours) and MTTR a total fail
ure (denoted MTTR(F)) is 10 days (240 hours). Note that these MTTR
assumptions are deliberately conservative; in reality shorter repair
times would be expected. The results of the simulation and analysis
are seen to be in total agreement over the full range of values shown
here. Although not included here, extensive investigations of other
sets of parameters reveal that this agreement is always maintained
while the assumptions of exponentially distributed failure and repair
times are applied.
Of further interest is the robustness of the analysis to variation in
the exponential assumptions made concerning failure and repair
times. Specifically, it is unlikely that repair times will be exponen
tially distributed. It seems more likely that repair times would be
deterministic or uniformly distributed over some time interval. Fur
ther, although detailed information regarding failure of disk drives is
unavailable, other forms of mechanical failure are commonly mod
elled by a Weibull distribution [Shoo68]. The exponential reliability
function assumed by the Markov model above, is based on the
assumption that failures are equally likely to occur at all times. In

Interactive Video Server Design 140
Probability of State 0
0.99
0.98
55 0.97 o
raO.96
0.95
0.94
(a)
(b)
0.02 •
g 0.015 55
•g 0.01
0.005
• Simulation Analysis
50 100 150 200 250 300 350 400 450 500 Number of Disks in Array
0.045
0.04
0.035
0.03 ID
c3
w 0.025
S 0 02
o
°" 0.015
0.01
0.005
Probability of State 1
-
>*L
JZ
y
•zr
- J*
Simulation — Analysis
• >
^
•
-
-
"
-
-
100 150 200 250 300 350 400 450 500 Number of Disks in Array
Probability of State 2
- Simulation — Analysis
-
-
i i i
AX
T /
s4
A
/
//
-
I I I
(c) 50 100 150 200 250 300 350 400 450 500
Number of Disks in Array
Figure 4.9 Probabilities of state obtained via simulation and analysis for states 0,1 and 2 respectively.

Interactive Video Server Design 141
other words the hazard rate is constant. Actually, mechanical fail
ures generally have a hazard rate which can be modelled by a "bath
tub" curve as shown in Figure 4.10.
A Early Failures i
Hazard Rate
z(t)
Random Failures
Wearout i Failures
-•H*
Time, t
Figure 4.10 General form of mechanical failure curves (from [Shoo68])
According to this bathtub curve, failures are more likely soon after
power on (early failures or infant mortality), and toward the end of a
product's life (wearout failures). Between these two periods, failures
are relatively unlikely and are termed random failures. The reliability
function of a single device is obtained from this hazard function
according to Equation 4.44
R(t) = exp -jz&XZ (Eqn 4.44)
where z(t) is the hazard rate as a function of time, an example of
which is shown in Figure 4.10. Equation 4.44 leads to the exponen
tial reliability function for the case of the constant hazard function.
In the case of the bathtub curve a mathematical model is considera
bly harder to derive. A piecewise linear model can be used, but a
more c o m m o n solution is to employ the Weibull distribution. The
Weibull distribution is analytically tractable and can be used to
model either early failures or wearout failure with the variation of a
single parameter. The hazard curve of the Weibull model is given by:

Interactive Video Server Design 142
z(t) = Ktm for m > - l (Eqn 4.45)
Which, from Equation 4.44 leads to the reliability function:
R(t) ~ exp -Kt m+\
m+ 1 (Eqn 4.46)
Now, assuming that the M T T F of the drive is known, K can be fixed
and m chosen to model the effects of either early failures or wearout
failures. The M T T F of any device is readily calculated from the relia
bility function according to:
M TTF = JR(t)dt (Eqn 4.47)
which, for the Weibull model gives:
MTTF = r[l/(m+l)] ,l/(m+l)
(Eqn 4.48) (m+ l)[K/(m+ 1)]
which, upon specification of MTTF, and m (the shape parameter) can
be rearranged to give K which can then be used in Equation 4.46 to
reveal the complete reliability model. It should be noted that when
m = 0 the Weibull model reduces to the exponential reliability model,
and as m->°° the model approaches a deterministic failure model
where all devices fail at exactly the same time. Values of m between
-1 and 0 model infant mortality, while values greater than 0 model
wearout failures.
S 3
"8 2.5 £
I 2
1 /
- - m " -0.5 m = 0 m = 2
•
-
•
^•""
0.8
0.7 B £-0 6
$ S0.5
«0.4
« IT 0.3
D.2
0.1
',
\ - \ \
\ \ \ \
\ \
\ * \ \
v"̂ --
— m = -0.5
m = 0
m = 2
.
-
-
1.5 Time
Figure 4.11 Hazard and reliability curves of the Weibull model.

Interactive Video Server Design 143
The curves in Figure 4.11 show hazard functions and corresponding
reliability models for various values of m. The dotted vertical line
represents the MTTF of all curves which has been normalised to
unity. The curves confirm the fact that a negative value of m leads to
high infant mortality while a higher positive value increases the like
lihood of wearout failure.
The more flexible failure and repair models shown in Figure 4.11 are
easily incorporated into the simulation model which has already
been validated against the analysis of Section 4.5.2. Figure 4.12
illustrates the effect of variations in these distributions on the over
all reliability of the system.
Figure 4.12 shows the probabilities of state for a range of Weibull
shape parameters (m) and three different repair time distributions.
All repair time distributions have a mean of 1 day for a single failure
and 10 days for a total failure. The uniform case ranges from 0 to 2
for a single repair and 0 to 20 days for a full repair. The exponential
case merely reverts to the base assumption of exponentially distrib
uted service times with the appropriate mean, while the determinis
tic case fixes the service time at the mean for every repair. The
Weibull shape parameter for the failure distribution was varied from
-0.5, corresponding to a high rate of early failures, to 10 which
results in an almost deterministic time to fail located at the mean.
For the curves shown, 100 disks per array were assumed, with an
individual MTTF of 10,000 days.
From Figure 4.12 it is observed that a high early failure rate leads to
a slight decrease in availability. This is despite the fact that the
MTTF is the same as the other cases. This can be explained by the
large number of disks in the array. With such a large number, some
early failures are very likely and the corresponding delay incurred
while waiting for repair leads to a lower overall availability. As m is
increased, an improvement in reliability is witnessed, which remains
until the value of m causes the Weibull distribution to approach a

Interactive Video Server Design 144
0.99
0.9895
0.989
<o 0.9885 to
S3 |, 0.988
S 0.9875
0.987
0.9865
(a)
0.012
0.011 -
,0.0105
0.0095
(b)
Sl.2
Probability of State 0
# —
— Uniform
- Exponential
- • - Deterministic
2 4 6 8 Weibull Shape Parameter (m)
Probability of State 1
4 6 8 Weibull Shape Parameter (m)
Probability of State 2
10
0.6
(c) 4 6 8
Weibull Shape Parameter (m)
-
-
1S L _
'
"S^^s———
'
1 1 — 1 '
Uniform
— Exponential
Deterministic
' '
— — — „i
-
-
1 H
\\
\ : ---*'"'"'
1 '
Uniform
— Exponential DetermlnisVic
'.^'^^
-
.<
Figure 4.12 Probabilities of state for a range of Weibull distributions of failure time and three repair time distributions

Interactive Video Server Design 145
deterministic distribution at the mean. At this point, all disks are
likely to fail at exactly the same time. For this reason an increase in
the probability of double disk failures is observed while the probabil
ity of single disk failures remains monotonically decreasing. The
effect of more double disk failures is to decrease overall system avail
ability (as evidenced by P0) due to the longer repair time incurred in
this case.
Regarding repair times, the graphs of Figure 4.12 reveal that the dis
tribution of the repair times has no significant effect on the probabil
ities of state of the system. This is explained by the infrequency of
these repair events. Provided the mean repair times are equal, actual
distributions are unimportant. In general, the effect of varying either
the failure or repair distributions has only a marginal effect on the
probabilities of state determined by simulation. W h e n it is consid
ered that early failures are unlikely in modern disk drives due to
appropriate quality control measures and burn in tests, this state
ment is further reinforced.
Figure 4.13 shows the probabilities of state versus the MTTF of an
individual disk for several repair time scenarios. The lines shown are
the analytical results, while the error bars represent the correspond
ing simulation with uniformly distributed repair times (from zero to
double the mean) and a Weibull shape parameter of 2 for the failure
distribution. (Note that the horizontal scale is magnified in
Figure 4.13 (c).) The first observation is that once again the simula
tion and analytical results are in excellent agreement.
Figure 4.13 reveals that single disk repair time (MTTR(l) measured
in days, which is the first figure in the legend in each case) has a
greater effect on overall system reliability, than full system repair
time (MTTR(F), in days, the second figure in the legend). That is,
while ever the single repair time is low, the probability of the system
operating in state 0 is considerably higher. This is most readily
observed in the difference between the solid line and the dashed and

Interactive Video Server Design 146
1
0.98
0.96
0.94
§0.92
55 "5 lo «n -g0.88
0.86
0.84
0.82
-
Probability of State 0
1 / _̂ __
/ : / " " " . . . - • • • • • • • " " "
r •' t '
s 1 •
.' ^ i / i '
i / i ' ! / I"' i /
i / : ,' =P -:
i ; / I I , .-. i i i — — i — i —
1 10
- - 10 10
1 100
10 100 -
(a) 1.5 2 2.5 3 3.5
MTTF of a single disk (days)
4.5 5
xio"
0.2
0.18
0.16
0.14
§0.12
Probability of
b b
P
0>
CO
—
0.04
0.02
Probability of State 1
i
\ \ \ \ \ i: \ \ \ \
- : "•. \
, • i _ i 1 1 1
1 10
- - 10 10
1 100
10100
_
—1 1
-
-
-
-
-
"
(b) 0.5
0.5
0.45
0.4
0.35
CM
I 0-3 W
J.0.25 '3 CO
| 0.2 a. 0.15
0.1
0.05
(C)
1.5 2 2.5 3 3.5 MTTF of a single disk (days)
Probability of State 2
4.5 5 x10"
1 10
- - 10 10
1 100
10100
I • l '
I \
' \ l
1 1.5 2 MTTF of a single disk (days)
2.5 x10*
Figure 4.13 Probabilities of state for a range of disk MTTF's and MTTR's (the first figure in the legend represents MTTR(1) the second is MTTR(F) both measured in days).

Interactive Video Server Design 147
chain lines of Figure 4.13 (a). Increasing the total repair time by a
factor of 10 (the chain line) has only a small effect, while an equiva
lent increase in the single repair time has a considerable effect on
system reliability, as evidenced by the dashed line. Of course
increasing both results in the least reliable system as shown by the
dotted line. This result is not unexpected since single failure are far
more c o m m o n than multiple failures, hence the importance of the
single-disk rebuild time, in deterrnining overall system reliability.
The other results are largely as expected apart perhaps from the dot
ted line of Figure 4.13 (b). At low disk reliabilities the long repair
times result in the system spending the majority of the time in state
2. As M T T F is increased however, this probability reduces rapidly,
while the probability of state 1 increases. Further increases in disk
reliability, however cause the probability of state 0 to rise, resulting
in falling probabilities of both states 1 and 2. This set of events
causes the humped appearance observed in the figure. Note that a
similar h u m p would occur for all the graphs if disk reliability was
lowered far enough.
From this validation of the Markov Model discussed above, several
conclusions can be drawn. First, the analytic results are in total
agreement with simulation results under identical (Markovian)
assumptions. Further, as assumptions regarding failure distribu
tions and repair distributions are relaxed in the simulation, overall
probabilities of state are not greatly affected (see Figure 4.12). The
only significant effect is the reduction of reliability when infant mor
talities are high, which is unlikely in modern magnetic drives. This
result implies that the results of the analysis used above are quite
robust even for non-exponential distributions of failure and repair
times. Having validated the usefulness of the analytic results of
Equation 4.38 the next section incorporates these results into a per
formability analysis in order to gain an overall figure of merit for
RAID 3 and RAID 5 disk arrays.

Interactive Video Server Design 148
4.5.3 Performability
The performance and reliability models can now be integrated to
gain insight into the expected revenue earned over a fixed period of
time. The standard measure of performability is the amount of
reward earned over a given mission time, and it is the expectation of
this quantity that is derived here. W e denote the reward rate of a
system at time t and in state i by ri>t m o d p where p is the period of
our reward structure (in Equation 4.21 and Equation 4.22, 24
hours). If Z(t) is the state of the system at time t where Z{t) e {0, l, 2}
then we define X(t) as the reward rate of the system at time t. That is,
X(t) = rZ(t) tmodp. N o w let Y(t) be the accumulated reward at time t.
Clearly,
Y(t) = JX(T)dt (Eqn 4.49)
In order to gain the expectation of Y(t) we use the following:
E[Y(t)] = E jX(x)di i-o
= JE[X(x)]dx
Now, E[X(t)] can be found from:
Therefore,
E[X(t)]= X r U mod pPiW i = 0
(Eqn 4.50)
(Eqn 4.51)
E[Y(t)] = ]\jiru^modpPt(x)\dx 0 ^ = 0 J
(Eqn 4.52)
In order to remove the r term from the integral we divide the integral
into time units At over which r is constant (due to the discrete
nature of the reward process) and set n = t/(At), to be the number of
such intervals from 0 to t. W e then add a summation to total the
reward earned over each At. Thus,

Interactive Video Server Design 149
E[Y(t)] = X w = 0
2
2-t i, tw mod p i = 0
tw + M
\ . tw
Pt(T)dT (Eqn 4.53)
Evaluating the integral from Equation 4.53 using Equation 4.37:
n r 2
E[Y(t)]= X X r U u mod p
bv a£At + -i(exp(r1(tlu + At))-exp(r1tu,))
'l (Eqn 4.54)
+ -i,(exp(r2(tu, + At))-exp(r2tu,))]
which provides the exact expectation of reward over a mission time t
for a system starting from a fully operational state (state 0). If mis
sion time is very long, the equilibrium probabilities of state
(Equation 4.38) can be used in place of the transient probabilities of
Equation 4.37. This results in the following steady-state expectation
ofY(t):
n r 2
E[Y(t)]= £ X ^ m o d paiAt
w=0H=0
2 i- n
= £ X rUu,modpaiAt
i = Ol-iu = 0
2 a
= X a i X ri,twmodpAt
i = 0 w = 0
= xa^ X ^^^^
i = 0 to = 0 2
= X a ^ i = 0
(Eqn 4.55)
Note that the distribution of Y(t) can also be obtained, but this is
considerably more effort [Smit88] and expectations are sufficient for
the exposition present here.
Equation 4.54 (or Equation 4.55) allows determination of the
expected reward earned by either RAID 3 or RAID 5 over a certain
mission time given that the system starts in a fully operational state.
This "reward" can be directly related to the revenue earned by a
video server in the same time by multiplying by a constant of propor-

Interactive Video Server Design 150
tionality which represents the charge made for each hour of video.
As an example, consider RAID 3 and RAID 5 disk arrays, both con
sisting of an equal number of disks (which implies that they do NOT
have equal throughput). The performability of each array is shown in
Figure 4.14. This graph shows the expected result, that performabil-
1
to
•a 0.99 -CO
2 Q 0.985 -
'c0 > 0.98 -CO
o c .2 0.975 -O Q. o CL 0.97 -
0 9651 1 1 1 1 1 ' ' ' ' ' 0 50 100 150 200 250 300 350 400 450 500
Number of disks in array
Figure 4.14 Example of reward earned for RAID 3 and RAID 5
ity decreases as we increase the number of disks in the array. The
parameters used are MTTF of a single disk of 240,000 hours (10,000
days), mean time to repair a single failure (MTTR(l)) is 1 day and the
MTTR a total failure (MTTR(F)) is 10 days. Also as expected, RAID 3
is seen to be consistently earning higher reward than RAID 5. This is
obvious, since the reward structure for RAID 3 has all values greater
than or equal to those in a RAID 5 array, and all other parameters
are identical. When it is considered that for equivalent throughput, a
RAID 3 array requires more disks, it will be seen that this result may
change dependent on other parameters. This case is considered in
the next section.
^ 1 1 [ 1 1 1
*"•* ^ * " ^ ^ — •*«. - ~ ^
V. ^"X. *^ ^ ^ - s .
S. ^ ^ "V ^ \
V ^ \ N. ^*\
X \ .
\ \ V.
\ X s s. s
X
s N.
RAID 3 --- RAID 5
i i i
_
\ v —
\ \* \ \ v
\ \̂ \ \̂ \ N. \ N
\ \ \ \
\ \ s \

Interactive Video Server Design 151
4.6 Case Studies
Figure 4.14 compares the performance of RAID 3 and RAID 5 for
equivalent size arrays. This is not a particularly useful comparison
since such arrays don't have the same throughput capability. In the
following case studies we consider a more realistic case by fixing the
throughput and capacity and determining the number of disks
required in each case from Equation 4.7 and Equation 4.8.
4.6.1 Effect of Disk Reliability
Modern disks have a considerable range of quoted reliability figures
of merit. As already mentioned, the typical figure of merit is quoted
as a mean time to failure (MTTF). [Gang94] states that typical MTTF
values for modern disk drives range from 200,000 to 1,000,000
hours. Given the heavy load that disks in a video server will be
under, however, the authors feel that this range may be overly opti
mistic. As such we reduce this and consider 240,000 hours as the
upper limit of reliability of a single disk. We consider a case where
the peak throughput requirement of a single array is 500 streams.
From the method used in Section 4.4 we can thus determine that
the RAID 5 array requires 72 disks while a RAID 3 array will require
207 disks to meet this demand. Notice that this difference is not
directly proportional to the cost difference of the two systems, since
the buffering requirements and disk capacities also differ.
The graph shown in Figure 4.15 compares the reward earned for
RAID 3 and RAID 5 disk arrays for a variety of MTTF values of single
disks and two full system repair times. In each case the MTTR(l) is 1
day (24 hours). The results are presented in terms of the proportion
of the maximum reward that was earned by either system. In the
case of 2 day total system repair time (the lines marked with crosses)
it is observed that for low disk reliabilities (the left side of the graph)
the RAID 5 system earns more reward since it requires fewer disks,
and as such is less likely to suffer disk failures. As reliability of indi-

Interactive Video Server Design 152
0.4 0.6 0.8 1 1.2 1.4
MTTF of individual disk (days) x10
Figure 4.15 Reward earned vs MTTF for throughput of 500 streams
vidual disks improves, however, RAID 3 becomes the superior per
former, due to the small proportion of time spent in the totally failed
state and the higher reward structure of RAID 3 in state 1 (partially
failed). When total repair time is increased to 10 days, it is observed
that for the range of disk reliabilities shown here (which range from
pessimistic to above average) RAID 3 never earns more reward than
a RAID 5. In either case, when the extra cost of RAID 3 is taken into
account, it appears that RAID 5 provides the most cost effective stor
age system for interactive video servers. In the next section, mainte
nance costs are accounted for before presenting conclusive
comparisons of the two RAID levels.
4.6.2 Maintenance Costs
Another important factor to consider in the cost comparison of the
two systems is maintenance costs. As a very minimum the cost of a
replacement disk is incurred every time a disk fails. The number of

Interactive Video Server Design 153
disks that fail (and hence the number that must be replaced) over a
given period can easily be determined from the following equation.
Number of Failed Disks = tD (Eqn 4.56) MTTF
And the cost of such failures is ascertained by multiplying
Equation 4.56 by KD. This is of course an underestimate of the total
lifecycle costs of either system but it is a useful basis for compari
son.
75001 1 1 1 1 1 1 1 1
7000-
6500
^ 6000
03 O
° 5500 CD
o c c 5000 CD C
.2 4500 4000
3500
3000
RAID 3 RAID 5
50 100 150 200 250 300 350 400 450 500
Number of streams supported
Figure 4.16 Maintenance for a 3 year period for RAID 3 and RAID 5
Figure 4.16 shows the maintenance costs for RAID 3 and RAID 5 for
a varying number of streams. We see that RAID 3 has considerably
higher maintenance costs than RAID 5 since it requires a larger
number of disks to support a given throughput. Note that the varia
tion of costs with a varying number of streams is not as steep as
might be expected. This is due to the additional requirement of pro
viding a minimum of 100GB of storage capacity.

Interactive Video Server Design 154
4.6.3 Cost vs Revenue
As a final comparison of RAID 3 and RAID 5 we compare the total
cost and the revenue earned by the systems over a fixed period.
Assume that a system remains in service for 3 years, which is a rea
sonable lifecycle period for computer related equipment. A MTTF per
disk of 240,000 hours is assumed and a MTTR(l) of 24 hours and
MTTR(F) of 240 hours. We then calculate the revenue earned as the
product of the total available revenue (from the viewer profile used
earlier, Figure 4.7), the years of operation (3), the cost per viewer
hour ($5) and the proportion of the reward earned by the particular
system. The cost of the system is calculated as discussed in
Section 4.4.
The graph in Figure 4.17 compares the difference in revenue earned
over a 3 year period with the total operating cost of RAID 3 and RAID
5 systems. The chain line represents the revenue earned by a RAID 5
en J0 o Q
20
15
10
x10
-5
Difference in revenue earned
Difference in total costs
Nett advantage of RAID 5
50 100 150 200 250 300 350
Number of streams supported 400 450 500
Figure 4.17 Revenue earned and total cost difference vs streams supported

Interactive Video Server Design 155
array subtracted from that earned by a RAID 3 array over a 3 year
period. For low throughputs the RAID 3 earns more than the RAID 5
array. This is because both arrays are quite small and hence very
reliable and the reward structure of the RAID 3 is superior to that of
the RAID 5. However, as the throughput requirement increases, the
number of disks in the RAID 3 increases much faster than the RAID
5 and as such the RAID 3 becomes less reliable than the RAID 5.
Hence for large arrays, the RAID 3 array actually earns less revenue
than the RAID 5. The broken line shows the total operating cost of a
RAID 5 subtracted from that of a RAID 3 array. This incorporates the
initial cost and maintenance costs discussed earlier. As expected,
the RAID 3 costs are always higher than RAID 5 and as such the
curve is always positive valued. This is because the smaller disks
used by the RAID 3 system are actually more expensive per unit of
capacity. The overall result is summarized by the solid line which
shows the actual increase in profits to be gained by using a RAID 5
disk array over using a RAID 3 disk array. It is, of course, the sub
traction of the chain line from the broken line. This nett advantage is
observed to be constantly positive implying that for all capacities
considered here, the RAID 5 system is more cost effective than the
RAID 3. Indeed, once we reach a throughput of just 500 streams, the
RAID 5 architecture provides a $180,000 dollar advantage. When we
realise that a peak throughput of 500 streams equates to a viewer
population of approximately 1,200 people (assuming 4 0 % peak
activity as suggested by Figure 4.7), we see that this is a large cost
advantage in favour of RAID 5. Over a 3 year period we can expect to
increase profit by approximately $150 per viewer merely by choosing
a RAID 5 architecture. Considering that video services will likely be
utilised by millions of people this equates to total savings of millions
of dollars for service providers.
As mentioned in Section 4.4 it is possible that buffering will not nec
essarily be incorporated in the server, but instead the cost may be
borne by the user with the buffering contained in the STB. As such

Interactive Video Server Design 156
in Figure 4.18 w e show the results from the same analysis as above,
excluding buffering costs. It is clear that even excluding buffering
costs, the RAID 5 system is preferable in terms of financial profits
earned over a three year period.
x10
C O fci
to O o % 4 CD *•—
»*-n en .£ 2
I co 0 o Q
-2 -4
- - Difference in revenue earned - Difference in total costs
— Nett advantage of RAID 5
50 100 150 200 250 300 350
Number of streams supported 400 450 500
Figure 4.18 Revenue earned and total cost difference (ignoring buffering) vs streams supported
4.7 Conclusion
Video servers will rely on disk array technology to at least provide
the core of the capacity and bandwidth requirements of interactive
applications. Each server is likely to consist of multiple disk arrays,
each storing a number of titles and serving a proportion of the viewer
customer population. Previous literature has focused attention on
using disk arrays to gain the performance required for interactive
video applications. The consideration of appropriate architectures to
provide high reliability as well as performance has received little
attention. Indeed, recently RAID levels have been selected almost

Interactive Video Server Design 157
arbitrarily and poorly justified [Chan95] [Cohe95] [Ng92] [Orji96]
[Toba93].
This chapter has examined the available options for high reliability
disk arrays, focusing on RAID 3 and RAID 5 as the two most suitable
candidates and those receiving most attention in existing literature.
The combination of performance and reliability constraints lead to
the use of performability modelling which is a technique well estab
lished in other fields. An analytic model of performability was
derived and validated against simulation results for the architec
tures of interest. The robustness of the analytical model was also
confirmed by relaxing many of the assumptions made in the analysis
and showing that simulation results still only varied marginally from
those of the analysis. Further, this model (in combination with a cost
model of RAID 3 and RAID 5 arrays) was used to show the superior
performance of RAID 5 arrays under a wide range of operating condi
tions. This conclusion is supported by [Ng89] and [Seo95] which
state that the high concurrency of a RAID 5 organisation should
indeed lend itself to the environment where many moderate band
width streams are required to be supported. RAID 3 on the other
hand may be more beneficial in other environments not related to
interactive video servers.
Chapter 3 has considered network issues relating specifically to
server and cache placement for maximum cost effectiveness. This
chapter has compared options for storage provision within any given
server and determined quantitatively that a RAID 5 organisation is
considerably more cost effective than a RAID 3 organisation given
the same constraints. In the next chapter we consider object alloca
tion to disk arrays within a video server. In other words given a set of
objects with associated storage and bandwidth requirements, how
can they be allocated to disk arrays within the server to guarantee a
high-level of utilisation of all arrays within the server.

Object Allocation for Disk Array Based Video Servers 158
5. Object Allocation for Disk Array Based Video Servers
Seek simplicity but distrust it.
- A. N. Whitehead
5.1 Introduction
This chapter presents an efficient scheme for utilising homogeneous
disk arrays for video server provision. Chapter 2 identified hierarchi
cal approaches proposed in the literature as the most intuitive solu
tion to the problem of highly variable movie popularities. In Chapter
3 this idea was refined to utilise varying disk capacities in order to
provide a storage hierarchy by way of heterogeneous disk arrays.
Unfortunately, this method (although unique and certainly prefera
ble to many other types of storage hierarchy) still suffers from ineffi
ciencies due to the partitioning of storage into fixed groups. In this
chapter w e identify the homogeneous approach as a preferable solu
tion to the storage problem. The chapter goes on to present schemes
to ensure efficient utilisation of the homogeneous disk arrays for a
wide range of input parameters.
In Section 5.2 the differences between heterogeneous and homoge
neous storage are illustrated, highlighting the potential benefits of
the homogeneous approach. A mathematical description of the
resulting object allocation problem follows in Section 5.3. One
important figure of merit of a video server is blocking probability and

Object Allocation for Disk Array Based Video Servers 159
any solution to the object allocation problem must provide some sort
of guaranteed level of blocking probability, this is discussed in
Section 5.4. An examination of the allocation problem reveals an
analogy with the two dimensional vector packing (2DVP) problem of
operational research and this fact along with its consequences, is
presented in Section 5.5. Section 5.6 presents upper bounds and
tight lower bounds for the allocation problem before considering the
performance of various heuristic solutions and proposing a new
heuristic (SSBF) in Section 5.7. Numerous case studies are con
ducted in Section 5.8 which serve to demonstrate the quality of the
heuristic proposed here, especially when compared with existing
heuristics from the literature.
5.2 Homogeneous vs Heterogeneous Disk Arrays
Chapter 3 presented an extension on previous literature in an effort
to solve the problem of storing movies with varying popularities. The
method involved using heterogeneous disk arrays to provide a form
of hierarchical storage. In essence, small capacity disks resulted in
high bandwidth to capacity ratio storage suitable for storing popular
movies, whilst larger disks gave the opposite result and were used
for the less popular movies. Provided appropriate disk sizes were
selected and movies were grouped according to popularity, the algo
rithms presented gave an efficient solution to the storage problem.
The heterogeneous disk array approach, however, is not without its
drawbacks. Primarily, this is the same drawback as experienced by
all hierarchical storage systems. That is, the inflexibility caused by
the fixed partitioning of storage space into several levels. For exam
ple, 50 GB of storage might be allocated to the few popular movies,
200 GB to less popular movies and 800 GB to the large group of
least popular movies. This decision must be made at design time and
is not easily modified as movie popularities change. It is easily con
ceivable that the actual movie popularity distribution will change

Object Allocation for Disk Array Based Video Servers 160
with time and from one application to another, and such a rigid stor
age structure will tend to cope poorly with this. In this chapter we
propose a homogeneous storage system to overcome this deficiency.
Essentially a homogeneous storage server consists of a set of disk
arrays all with identical throughput and capacity capabilities. In
other words, all arrays are constructed from the same number of the
same disk drives. In order to utilise these arrays efficiently, it will be
necessary to place popular movies together with unpopular movies
on the one array to ensure that neither bandwidth nor capacity
resources are wasted. This replaces the hierarchical storage policy,
whereby all popular movies are stored together on a single array,
less popular movies on the next array and so forth. The principle
advantage of this homogeneous approach is that, provided the place
ment algorithm is efficient, the same disk arrays will be just as suit
able regardless of the movie popularity distribution. Provided the
ratio of total capacity and bandwidth requirements of all the movies
to be stored is a good match to the bandwidth and capacity available
at the server, the actual popularity distribution of the movies is irrel
evant. The validity of this statement will be demonstrated by the
case studies presented in Section 5.8. A similar idea is presented in
[Litt95], where it is shown that for maximum efficiency movies
should be allocated to disk arrays in order to ensure that the disk
arrays are all equally likely to be accessed. Unfortunately, [Litt95]
does not provide a method for ensuring that this is the case. In the
following sections heuristics are presented which achieve precisely
that aim.
Figure 5.1 illustrates the essential difference between heterogeneous
and homogeneous storage solutions, for the simple case of three disk
arrays and six movies to be stored. The movies are assumed to be of
unit length (occupying one unit of disk capacity) and popularities fol
lowing a simple linearly decreasing distribution. Although extremely
simplistic this diagram does serve to illustrate the key difference
between heterogeneous and homogeneous approaches. In this case

Object Allocation for Disk Array Based Video Servers 161
both systems gain the same efficiency (100% utilisation of both
resources) and have the same cost, but the heterogeneous system
groups movies together according to popularity and stores them on
an appropriately sized storage device, while the homogeneous
approach groups movies together in such a way as to make optimum
use of a single type of storage device.
Heterogeneous Homogeneous
Figure 5.1 Illustration of heterogeneous and homogeneous disk striping.
There has been little work explicitly considering the issue of allocat
ing objects to disk arrays in interactive video systems. It will be seen
that this problem does, however, have similarities with bin-packing
problems and heuristics for this problem will be discussed later
(Section 5.7.1). In a recent paper [Mour96] proposes an heuristic
that is a simple variant of the FFD algorithm (see Section 5.7.1),
where it is assumed that all objects have identical capacity require
ments. The proposal does not, however, state when a new array
should be started while allocating objects, and no results are given
in the paper to demonstrate the quality of the heuristic.
As already mentioned [Litt95] considers the problem of object alloca
tion and shows the benefits of allocating objects to arrays to ensure
an equal probability of access to all arrays, in terms of a reduced

Object Allocation for Disk Array Based Video Servers 162
blocking probability. A method for achieving this goal, however, is
not provided.
[Dan95b] is the only other work to address the problem of object
allocation to disk arrays. In that paper the authors introduce the
Bandwidth to Space Ratio (BSR) heuristic which allocates objects to
storage devices such that the bandwidth to space ratio of the object
is a close match to that available on the device. The work discussed
below was performed concurrently and independently of that
reported in [Dan95b] and differs significantly. Specifically, Dan et al.
assume constant object capacity requirements, do not account for
blocking and take an on-line approach which makes it more difficult
to find optimal solutions. Further in [Dan95b], object duplication is
advocated to aid in the packing, without considering the cost of this
replication. Unfortunately, specific details of the heuristic used are
absent from [Dan95b] making a quantitative comparison of their
scheme with ours impossible.
The next section presents a mathematical description of the homoge
neous object allocation problem.
5.3 Mathematical Description
The problem of optimally allocating objects (movies) to homogeneous
disk arrays can be described mathematically as follows.
minimise Z = £ Dk (Eqn 5.1) keK
subject to:
£ bM k < (BDk)' VJc € K (Eqn 5.2)
%cMjk<CDk VfceK (Eqn 5.3)
£ Nk = I (Eqn 5.4) keK

Object Allocation for Disk Array Based Video Servers 163
Dk<S Vfc e K (Eqn 5.5)
Table 5.1 Definition of symbols for optimisation
I
K
Nk
Dk
MJk
b,
Ci
B
C
S
set of movies I = {1,2,...,1}
set of striping groups K = {1,2 K}
movies on striping group k
disks in striping group k
index of jth movie on kth striping group
bandwidth requirement of movie i
capacity requirement of movie i
bandwidth of a single disk
capacity of a single disk
maximum allowable striping group size
These equations define the objective function and constraints of the
optimisation problem described above. Equation 5.1 is the objective
function and states the aim to minimise the total number of disks
required, and as such minimise the cost. In Equation 5.2 and
Equation 5.3 bandwidth and capacity limitations of each striping
group are accounted for, ensuring that they cannot be exceeded by
the objects stored on them. Note that the prime (') on the B D k is
intended to signify that the raw bandwidth of the array has been
converted to an effective bandwidth in accordance with the required
blocking probability as discussed in Section 5.4. Equation 5.4 guar
antees that the entire movie population under consideration is
stored somewhere on the server, while Equation 5.5 enforces an
upper limit on the number of disks that can be in any single striping
group. It should be noted that the subscript on the D implies that
different arrays may have different numbers of disks. This variation
of the homogeneous scheme is not considered further in this thesis,
but some results obtained from such a system can be found in a pre
viously published paper of the author [Barn96e]. The value of the
upper limit on array size, S, can be derived from the availability
requirement of the server (see Chapter 4 and Chapter 7 for an exam-

Object Allocation for Disk Array Based Video Servers 164
pie) or from an implementation constraint imposed by the disk array
controllers or system architecture.
It can be shown that this optimisation is NP-hard (since it is analo
gous to the bin-packing problem (see Section 5.5)) [Gare76] [Litt95]
which implies that it cannot be solved for global optimality in poly
nomial time. In other words, the complexity of the optimisation
increases more than polynomially with the number of objects to be
allocated. The most useful approach to such NP-hard problems is
generally to apply heuristic solutions which may be either general or
problem specific [Telf94]. This thesis focuses on problem specific
heuristics which utilise detailed information about the problem to
rapidly obtain near-optimal solutions.
5.4 Blocking Probability
Figure 4.7 in Chapter 4 shows the average user profile versus time of
day for television viewing in Sydney, Australia. From this and the
popularity distribution of movies it is possible to ascertain the busy
hour average load that will be placed on each individual movie. In
order to ensure a certain level of service availability, blocking proba
bility of the server during this busy hour should be restricted below
a given level.
Blocking probability will be determined by modelling a single disk
array as a multiserver queue. Since a video server is connected to a
large viewer population it is assumed that the interarrival time of
new requests is Poisson distributed.
The service time distribution is more difficult to model. Of course the
service time equals the time that a viewer remains in service. This is
primarily related to the length of the movie being watched. However,
as discussed in [Li96] the mapping from movie length to service time
is perturbed by interactivity functions such as pausing, rewinding
and fast-forwarding. Given also, (as shown in Section 5.5.1) that

Object Allocation for Disk Array Based Video Servers 165
movie length can be approximated by a Gamma distribution, it is
clear that the queueing model must assume a general distribution
for service time.
For the purposes of blocking probability calculations, it is assumed
that there is no waiting room within the server. This assumption is
made to give a worst-case bound on blocking probability. Depending
upon the willingness of customers to wait for admission, some wait
ing room (ie. queueing) is actually likely to be provided. By assuming
no waiting room, the blocking probability derived here is an upper
bound on any real system's blocking probability. For our purposes a
customer is considered blocked if they cannot immediately be allo
cated a server upon arrival. Following this definition, it is clear that
in order to determine blocking probability, a disk array can be mod
elled as an M/G/m/m queue1. Modelling an entire array as a single
M/G/m/m queue does implicitly assume that a customer can be
admitted to any free server in the queue. In reality this is not the
case as a user must wait until a slot becomes free on the individual
disk that contains the start of the desired movie. Effectively this
model assumes that the load is relatively well balanced across the
array and that a user will be willing to wait until a slot becomes
available on the appropriate disk. Such an assumption is reasona
ble, and this issue is discussed further in Chapter 6.
An approximation from [Whit84] states that if Ya is the equilibrium
number of busy servers in a G/GI/m/m queue, then:
P(X_ = k) P(Y = k) = — — ^ (Eqn 5.6) K a ' P(Xa<m)
v H '
where ̂ is the equilibrium number of busy servers in a G/GI/°°
queue. Note that the a in the subscript is the queue utilisation in
each case.
1. Note that the second "m" in M/G/m/m is replaced by 0 in some notations representing 0 waiting room [Whit84]. Here the second "m" is used to indicate that there are m total spaces available in the system, including the m servers implied by the
first "m".

Object Allocation for Disk Array Based Video Servers 166
Given that our arrival process is assumed to be Poisson, the Xa
queue can be modelled by an M/G/°° queue which has a known
probability of state given by:
P(Xa =k) = pk = {ak/k\)e~a (Eqn 5.7)
From this expression the blocking probability of our M/G/m/m
queue can be calculated from:
P(X_ = m)
, m . ,. -a (a /m!)e m £(a7i!)e"a (Eqn 5.8) i = 0
(a /ml)
i = 0
which is merely the Erlang-B formula for an M / M / m / m queue
[Klei75]. This result implies that the Erlang-B formula can be
applied to an M/G/m/m system with good accuracy. Note that the
Erlang-B formula was assumed to be a suitable model for blocking
probability in a server in [Litt95], although this was never actually
shown to be the case.
To confirm the quality of the fit for the situation considered here, an
event driven simulation was used to determine blocking probability
assuming G a m m a distributed service times (see Section 5.5.1) and
Poisson arrivals (Figure 5.2).
Figure 5.2 reveals that the Erlang-B (M/M/m/m) approximation for
blocking probability is an excellent fit for a wide range of utilisations
and server sizes. Although not presented in detail here, several other
service time distributions have been studied, and in each case the
Erlang-B formula is seen to given an excellent approximation to the
blocking probability.

Object Allocation for Disk Array Based Video Servers 167
0.07
0.06
0.05
1*
| 0.04
'o >,
10.03 o
0.02
0.01
0 0 50 100 150 200 250 300
Number of servers
Figure 5.2 Comparison of models for blocking probability
5.4.1 Effect on Disk Array Throughput
Rearranging the Erlang-B formula (numerically) it is of course possi
ble to determine the number of streams that a given array (with a
certain bandwidth) should be allocated in order to guarantee (statis
tically) a certain blocking probability. This effectively maps the band
width of a particular disk array determined by the methods of
chapter 4 into a (usually lower) value which can be used in the
object allocation methodology presented next.
Figure 5.3 shows the ratio of bandwidth in the video server to aver
age viewer load for a range of video server sizes and blocking proba
bilities. As an example of the mapping from average load to video
server requirements, consider the case where a load of 200 streams
is to be supported with a 1% blocking probability. From the figure it
can be inferred that the server will be required to support 1.1 times
this load, or more accurately a total of 221 streams. Conversely, a
server capable of supporting 221 streams should only be loaded with

Object Allocation for Disk Array Based Video Servers 168
objects with a total "busy hour" requirement of 200 streams in order
to guarantee a 1 % blocking probability. Hereinafter the figure of 200
streams for this array is referred to as the "effective bandwidth" of an
array with a "raw" bandwidth of 221 for a blocking probability of 1%.
n.e
31-7
o ?1.6 .c
(busy
CJ1
CD
co 1.4 CO
a 2 1.3
s re
quir
ed
ho
| 1.1 CD 0)
"5 1 o fo c 0 . 9
-
-
-\ \
t \ \ \
\ \
N
I
\ s
r
i i
\ ^ — ^
1 1
1 1 1 1
^
1 1 1 1
1 1
BP = 0.1%
- - BP = 1%
BP = 10%
-
-
-
"
"
~
r i
-
50 100 150 200 250 300 350 400 450 500 Average (busy hour) load (streams)
Figure 5.3 Statistical multiplexing for various allowable blocking probabilities in a disk array based video server
Predictably, larger arrays have a statistical multiplexing advantage
over smaller arrays in that a smaller increase is required in the
number of servers to guarantee a given blocking probability. In other
words, larger arrays have a higher ratio of effective bandwidth to raw
bandwidth. Unfortunately this result is in direct opposition to the
performability analysis of the preceding chapter, which concluded
that large arrays are less reliable than small arrays. Although both
of these conclusions are intuitively obvious, an effective design must
aim to use the quantitative results of each of these aspects to strike
an effective trade-off between the two constraints of efficient multi
plexing and high reliability. This trade-off is discussed further in the
case study of Chapter 7. The next section reveals h o w this problem
is directly related to the two-dimensional vector packing problem

Object Allocation for Disk Array Based Video Servers 169
that is a variant of the well-studied bin-packing problem of opera
tions research.
5.5 Two Dimensional Vector Packing Analogy
The optimisation problem defined by Equation 5.1 to Equation 5.5 is
NP-hard [Litt951, and given that a server will be required to store
potentially thousands of movies with rapidly time-varying require
ments, this poses a large problem. The use of heuristic techniques is
aimed at providing near-optimal solutions in a reasonable amount of
computation time.
Considering that we are attempting to pack a group of movies with
bandwidth and capacity requirements onto disk arrays with a cer
tain effective bandwidth and capacity capability, we see that there is
a close analogy between this problem and traditional bin-packing
problems. A graphical representation (Figure 5.4) serves to solidify
the relationship.
Note that in Figure 5.4 the raw bandwidth of the disk array is suita
bly scaled to give an effective bandwidth according to the desired
blocking probability as discussed in Section 5.4. From Figure 5.4,
we see that this movie allocation problem is directly analogous to a
2-dimensional vector packing (2DVP) problem [Coff84]. The differ
ence between vector packing and rectangle packing is that, in vector
packing, the rectangles can only be packed diagonally and not into
the off-diagonal free space. Using rectangle packing in the above sit
uation would clearly result in capacity and bandwidth being "dou
ble-booked" to a number of movies. Vector packing appears to be a
considerably easier problem to solve than the similar rectangle pack
ing problem. Unfortunately, in comparison to the rectangle packing
problem, little work has been produced on the solution of the vector
packing problem. A discussion of the literature relevant to the 2DVP
problem is presented in Section 5.7.1.

Object Allocation for Disk Array Based Video Servers 170
•o
C ra
m >
Z a> •*—
Unused Capacity -
Diskl Disk 2 Capacity
h T Unused
Bandwidth
Disk 3
Figure 5.4 Allocating movies to a striping group with three disks
It is important to note that the graphical representation of the prob
lem shown in Figure 5.4 is in no way representative of the physical
allocation of movie objects to disk arrays. As discussed earlier (see
Section 4.4) movies are allocated to disks in the array in blocks,
where each block represents a very small segment of the movie. By
using this placement method the array is able to provide approxi
mately D times the bandwidth and capacity of a single disk. It is this
increase in available resources supplied by disk arrays that is uti
lised by the packing approach. It should further be noted, however,
that the factor of D increase in bandwidth is only available provided
that the load on the array is evenly balanced across all disks in the
array. Under certain conditions this m a y not be the case and the
problem of mamtaining load balance becomes important. This issue
is considered for the coarse-grained RAID 5 disk array in Chapter 6.
Given that the optimisation problem is so readily identifiable as a
variant of the vector packing problem, it would seem reasonable to

Object Allocation for Disk Array Based Video Servers 171
apply similar problem specific heuristics to solve it. Although general
heuristic approaches, such as simulated annealing, genetic algo
rithms, tabu search and others could also be applied (as they can to
almost any optimisation problem), in a case where problem specific
information is available, tailored heuristics generally lead to faster
and/or better solutions to a given problem [Telf94]. Before consider
ing existing heuristics for the 2DVP problem let us first revisit and
identify the important input parameters.
5.5.1 Input Parameters
The major input parameters for the packing problem are movie
length and popularity and disk array capacity and bandwidth. Of
these, only movie length has not so far been considered in detail in
this thesis. Although the object size distribution will vary depending
on the application, entertainment style video-on-demand is again
considered as a typical example. Making this assumption enables
statistics to be gathered on existing movies with a high degree of
confidence that these statistics will also apply to future video-on-
demand systems. Statistics for other future interactive video services
are much more difficult to estimate.
Movie length data was collected from a movie database containing
over 23,000 movies. Titles with lengths greater than 180 minutes or
less than 50 minutes were discounted since a number of entries in
the database were actually television series' or short silent films.
This left over 22,000 movies with lengths within the desired range.
From this raw data, a histogram was generated and the method of
maximum likelihood estimators [Law91] was used to fit several com
mon distributions to the raw data. Of these, the G a m m a distribution
(shown in Equation 5.9), with parameters a= 18.48 and (3=5.06, was
seen to give the best fit to the existing data.

Object Allocation for Disk Array Based Video Servers 172
fix) = P-a a-1 -x/B
x e H r(a) 0
if x > 0
otherwise
(Eqn 5.9)
It should be noted that standard goodness-of-fit tests (for example,
Chi-square) are difficult to apply to large datasets such as this one,
as they will almost always reject the hypothesis based on a relatively
small number of mismatches [Gibb85]. As such, for the purposes of
this investigation, a graphical comparison is used. Figure 5.5 shows
a histogram of the data and the fitted G a m m a distribution, as well
as cumulative frequency in each case. It can be seen from the figure
1
/ T
1 1
' •, J^-
-
Collected Data
- - Gamma(18.46,5.06)
, hrinnrrr^ •»-=n=-tr
0.9
0.8
0.7
i0Q Q
a, 0.5
|0.4
0.3
0.2
0.1
, • > < <^ _ _ = i
/ V
//
/"' /'
r J
I /
,'/ 1- •'/
Collected Data
- - Gamma(18.48,5.06)
"
/ ~3^t , 1 1 1 1
100 120 140
Movie length (minutes)
100 120 140
Movie length (minutes)
Figure 5.5 Probability density and distribution functions for movie length data and the Gamma(18.48,5.06) distributions.
that the G a m m a distribution is a good fit to the empirical data with
the possible exception of the peak between 90 and 100 minutes.
Clearly, a large proportion of movies have a duration somewhere in
the vicinity of 90 and 100 minutes, accounting for this peak. Such a
rapid change is impossible to model with a standard distribution. It
must also be noted that in addition to the G a m m a model derived
here, several other models for object length will be used in the com
parison of the packing heuristics in Section 5.8, in order to extend
the range of validity of the results obtained.
The other three important input parameters have already been pre
sented earlier in the thesis. Movie popularity will be modelled by the
heavily-skewed long-tailed models seen in the literature as dis-

Object Allocation for Disk Array Based Video Servers 173
cussed in Section 3.4.1. Disk array bandwidth depends on the
number of disks, and the block sizes used in each case. From the
results of Chapter 4, it is assumed that for coarse-grained arrays
considered here, an individual disk can sustain a throughput of
about 20 Mbps. The selection of disk capacity is made so as to
ensure that the ratio of disk capacity to bandwidth matches that of
the total movie population in a similar manner to the heterogeneous
arrays of Chapter 3. The difference here is that all the arrays use the
same disks and as such maintain the same ratio of capacity to band
width.
5.6 Upper and Lower Bounds
Before presenting and evaluating the performance of various heuris
tics for the movie allocation problem, bounds are required to provide
a quantitative measure of their performance. A simple upper bound
on performance is obtained by considering the maximum of the
bandwidth and capacity requirements for each movie and allocating
the appropriate number of disks for this movie. A physical realisa
tion of this would result in each movie being stored on a separate
disk array, with no movies sharing resources. Depending on the
input distributions this can be hugely wasteful, although a similar
approach works well in the heterogeneous disk array approach since
disk size is varied to match the required capacity to bandwidth ratio
of each object (or group of objects). This upper bound can be repre
sented by:
ZUB ~ ZJ iel
bt ct max(—,-)
(Eqn 5.10)
The most obvious lower bound is obtained through similar reason
ing. If all movies were to be stored on a single disk array, then the
number of disks in that group would only need to be large enough to
meet the largest of the sums of the requirements in each dimension.

Object Allocation for Disk Array Based Video Servers 174
ZLB\ ™*(X|>X7J> (Eqn 5.11) ie J iel
Although this lower bound is generally tight, another bound is sug
gested in [Spie94] which under certain conditions can produce a
tighter lower bound (ie. a higher array count). In the case where
some of the objects are very "large" in one or both dimensions while
many are small, then only a few of these large objects will fit on each
array. The popularity of video objects fits this scenario due to it's
heavy skew. In such cases Equation 5.11 can seriously underesti
mate the true lower bound.
The algorithm presented in [Spie94] attempts to find a set of objects,
no two of which can be placed in the same bin. Clearly once this set
has been found, the number of elements in the set represents a sec
ond lower bound. The technique of finding such a set can be thought
of in graph-theoretic terms where each object is a vertex and edges
exist between all pairs of objects that exceed the array capacity in
either dimension. The problem is then one of finding the clique in
the graph with the largest number of vertices. Note that in general,
this problem is itself NP-hard, but due to the nature of this graph (a
2-threshold graph) a solution can indeed be found in polynomial
time by using an algorithm from [Hamm85]. With this algorithm in
place, a second lower bound, Z L B 2 is obtained, and the overall lower
bound for a given problem is clearly the greater of ZL B 1 and ZLB2.
ZhB = max(ZLB1,ZLB2) (Eqn 5.12)
As shown in Section 5.8, the combination of the two lower bounds
given above, does indeed provide a tight lower bound for the compar
ison of the heuristic procedures presented next.
5.7 Heuristics
With the object allocation problem and lower bounding procedures
now well defined, this section examines previous work in the litera-

Object Allocation for Disk Array Based Video Servers 175
ture on heuristics for solution of the vector packing problem, and
also introduces a new heuristic which aim to provide more efficient
solutions by utilising additional knowledge of the actual problem at
hand.
5.7.1 Review of Existing Bin Packing Heuristics
As already mentioned, the two-dimensional vector packing problem
is essentially just a two-dimensional version of the basic bin-packing
problem. The other two-dimensional variant is rectangle packing
which has attracted considerably more attention in recent literature
(see [Dows92]). This is possibly accounted for by the obvious mass of
applications for the rectangle packing problem and other related
"knapsack" problems. The applications for the multi-dimensional
vector packing problem are somewhat less tangible, but include
multi-processor scheduling problems [Gare76] and memory alloca
tion problems [Maru77] as well as the object allocation problem dis
cussed here [Barn96e]. [Coff84] provides an excellent overview of
bin-packing research with consideration given to all the common
variants of the problem. An indication of the lack of work in vector
packing is that of this 58 page survey paper, only 2 pages are allo
cated to research in the area of vector packing.
Of the results summarised in [Coff84] perhaps the most interesting
are those from [Gare76] which discuss the worst case performance
of suitably modified First-Fit and First-Fit-Decreasing algorithms.
First-Fit (FF) and First-Fit-Decreasing (FFD) are known to be two of
the best algorithms for the one-dimensional packing problem, con
sistently performing close to the optimum. FF simply moves through
the object list placing each object into the first bin in which it will fit,
with new bins started as necessary. FFD preprocesses the object list,
placing the objects in decreasing order of size, before apply the FF
heuristic. This modification is shown to give consistent improvement
over the original FF algorithm. In the 2DVP case, FFD can sort
objects on a number of criteria, such as by the sum of dimensions,

Object Allocation for Disk Array Based Video Servers 176
the sum of the squares of the dimensions or the product of the
dimensions [Maru77]. The proposal in [Gare76] sorts the object list
in decreasing order of the larger of the two (normalised) components
of each object, before applying FF. We refer to this algorithm as
FFGAR, as this is just one variant of FFD. Another variant consid
ered here is FFSUM [Kou77] which sorts the objects based on the
sum of their dimensions.
[Gare76] analyses the worst case performance of the First-Fit algo
rithms and showed that FF always performs within d+7/10 of the
optimum solution and that FFGAR is always between d and d+1/3 of
the optimum solution, where d is the number of dimensions in a
multi-dimensional vector packing problem. For the 2DVP problem
d=2. In other words, [Gare76] has effectively shown that the worst-
case performance of the First-Fit algorithms is around a factor of 2
worse than the optimal packing. It must, however, be noted that
simulation work by [Maru77] indicates that average case perform
ance of these algorithms does not generally approach this very poor
worst case.
Generally, bin-packing research has focused on finding worst-case
performance of particular algorithms and developing new algorithms
to improve these bounds. While some simulation study has been
used to determine average case performance it is important to note
the limitations of this work. Specifically, the distributions assumed
for object sizes are almost invariably uniform [Spie94] [Mart90]. This
is in direct contrast to the very contrived distributions used when
demonstrating worst-case bounds. One exception to this is found in
[Maru77] where the authors combine sets of uniform random varia
bles so as to form bell-shaped and skewed distributions for object
dimensions. These distributions are used because they are believed
to be of practical importance rather than because they accurately
model a particular case of interest. The effect of variations in these
distributions is not well-studied in [Maru77], however. These distri
butions may seem reasonable when an algorithm is proposed for

Object Allocation for Disk Array Based Video Servers 177
general application to a class of problem with no specific application
in mind. When a particular application is to be studied, however, (as
is the case here) it is important to consider the appropriate input
distributions for object sizes. The distributions appropriate for inter
active video services were discussed in Section 5.5.1.
In a large set of simulations considering n-dimensional vector pack
ing, [Maru77] presents a generic packing algorithm that can be
made equivalent to the common algorithms of next-fit, first-fit, best-
fit and so forth. It is interesting to note that the algorithms used are
all derived directly from the one-dimensional packing case, even
though the worst case analysis of these algorithms indicates that
performance can become considerably worse as the dimensionality
of the problem increases [Gare76].
[Spie94] explicitly considers the 2DVP problem and applies a general
branch-and-bound algorithm in an attempt to improve on prior solu
tions. For comparison, two adaptations of the first-fit-decreasing
algorithm are also considered. Results are obtained by simulation of
packings for various numbers of objects with sizes drawn from uni
form distributions with several ranges. Of 48 cases considered, the
branch-and-bound heuristic produced improved solutions over the
FF schemes in only 6 instances, and in 5 of these the improvement
was only by 1 bin. When it is considered that the branch-and-bound
method can take in excess of 10 hours to generate these improved
solutions (versus less than 0.5 seconds in every case for the FF heu
ristics) the results are not encouraging.
The results of [Spie94] are representative of many of the generally
applicable optimisation techniques, which include branch-and-
bound, as well as simulated annealing, genetic algorithms and tabu
search. The running time of such algorithms is generally not
bounded, and is often found to be many orders of magnitude longer
than the appropriate problem specific heuristic [Telf94]. Perhaps if

Object Allocation for Disk Array Based Video Servers 178
the improvement over other techniques is significant such running
times could be justified, but this is not the case in [Spie94].
The next section presents a new problem specific heuristic tailored
to the input distributions discussed above. The motivation for this
heuristic arises from the poor performance of the existing heuristics
for these object types. Table 5.2 illustrates the efficiency of FFGAR
and FFSUM as well as the two lower bounds for a variety of cases.
Table 5.2 Performance of FFGAR and FFSUM packing heuristics
x-distn
Dist. Params
Uniform [0,1]
Uniform [0.2-0.8]
Uniform [0.1-0.4]
Gamma mn=0.01
Gamma mn=0.02
Gamma mn=0.03
y-distn
Dist. Params
Uniform [0,1]
Uniform [0.2-0.8]
Uniform [0.1-0.4]
Zipf mn=0.01
Zipf mn=0.02
Zipf mn=0.03
FFGAR
% lba bins
excess 530.6 533.4 0.5
541.9 544.8 0.5
252.4 271.5 7.6
10.7 15.8 48
20.7 29.9 44
30.6 42.7 40
F F S U M
% lba bins
excess 534.5 540.2 1.1
539.4 544.9 1.0
252.6 271.5 7.5
11.3 16.9 50
20.6 30.9 50
30.7 44.8 46
a. Note that the lower bounds shown are the greater of lbl and lb2 as
indicated by Equation 5.12. In rows 1 and 2 the tight lower bound was
given by lb2 while in the remainder of the rows lbl gave the tighter con
straint.
In each case 10 independent runs were performed, with each run
required to pack a total of 1,000 objects. The ranges of uniform ran
dom variables have been taken from [Spie94], while the means for
the G a m m a and Zipf distributions were selected to represent a rea
sonable number of disk arrays in a video server. These parameters
will be discussed in more detail in Section 5.8.
In the case of uniformly distributed object sizes of various ranges
(first three rows of Table 5.2), the FFGAR heuristic is seen to per
form very well with a mean excess from the lower bound of less than
1% for all the ranges of uniform random variable considered here.
This result is in good agreement with the results obtained by
[Spie94], where fewer objects are packed, but the FFGAR algorithm
always closely approximates the lower bound. Given that most simu
lation studies to date confine themselves to uniform random varia-

Object Allocation for Disk Array Based Video Servers 179
bles, it is understandable that the FFGAR has been believed to be an
adequate heuristic.
When object size distributions are changed to more accurately model
expected video object sizes in interactive video servers, however, the
FFGAR and FFSUM heuristics perform very poorly. As seen in the
last three rows of the table, the difference between the lower bounds
and the heuristic solutions obtained by the existing algorithms is
quite significant. Although this could be attributed to loose lower
bounds, improvements to the packing algorithm also warrant con
sideration. The next section presents a new algorithm (SSBF) and
reveals that the lower bounds are actually quite tight and that SSBF
approaches these lower bounds.
5.7.2 The Same-Shape-Biggest-First Heuristic
Table 5.2 reveals that the First-Fit based algorithms perform poorly
with the input distributions that are appropriate for interactive video
servers. Investigation of a simple example provides some enlighten
ment as to why this is the case.
First we adapt the notation used in Table 5.1 to the case where the
bin dimensions (ie. disk capacity and bandwidth) are both normal
ised to 1. This clearly requires the movie dimensions to be suitably
normalised. Let each object x4 have dimensions given by the ordered c. b.
pair: xt = (xn,xi2) = (7̂ ,707̂ ) where {BDy is the effective bandwidth of
a disk array of D disks suitably scaled to account for a required
blocking probability, as discussed in Section 5.4. Also note that D is
assumed to be constant for each array. Following this normalisation
each object has requirements between 0 and 1 in both capacity and
bandwidth dimensions (xi;i and xi2 respectively).
As a simple illustration of the poor performance of the FF algo
rithms, the following case is considered. Seventeen items are to be
packed with a mean in each dimension of 0.16. The x-dimensions
are all constant at 0.16 (implying that all movies are the same

Object Allocation for Disk Array Based Video Servers 180
length), while the y-dimensions are distributed according to the Zipf
distribution with C=0.79 (resulting in the required mean size of
0.16). The lower bounding techniques produce a minimal require
ment of three bins. Figure 5.6 illustrates the packing obtained by the
FFGAR algorithm.
Figure 5.6 Example packing obtained by FFGAR algorithm
It is seen that the FFGAR algorithm requires 4 bins, an increase of
3 3 % over the lower bound. While this in itself is not sufficient evi
dence that the packing can be improved, investigation of the actual
packing obtained suggests that an improvement should be possible.
From Figure 5.6 it is observed that bin 1 has a large wastage in the
x-dimension (capacity), bin 2 is quite well packed, while bins 3 and 4
both waste the y-dimension (bandwidth) to a large degree. In order to
gain an overall improvement in packing efficiency, it would seem

Object Allocation for Disk Array Based Video Servers 181
necessary to ensure that both capacity and bandwidth dimensions
are utilised equally by each bin. It is this realisation that is employed
in the Same-Shape-Biggest-First heuristic proposed here.
To ensure that both capacity and bandwidth are well utilised by
each bin, it is necessary to pack items such that each item proceeds
towards the diagonally opposite corner of the bin. It is not sufficient
to ensure that a given item is a good fit in one dimension (as all the
FF variants tend to do). An item must be a good fit in both dimen
sions to ensure that the bin can obtain good overall utilisation. In
other words, the next item for a particular bin should be selected
such that it has the "same shape" as the space remaining within the
bin. The actual size of an item is not considered (with one exception),
since all items must be packed eventually, there is no advantage to
packing the biggest ones first. The exception to this is the first item
placed in any bin, as shown later. Note that this algorithm requires
each bin to be packed fully before commencing the next bin. This is
achieved by searching the item list for the most suitable item to pack
into the remaining space of the current bin, until no further items
will fit, or until the item list is empty. The most suitable object is
found as that which has a ratio of bandwidth to capacity require
ment which most closely matches the ratio of bandwidth and capac
ity available on the disk array. In other words, if a disk array already
contains a set of objects, with indices contained in the set J, the next
object (index i) is chosen in order to minirnise the expression in
Equation 5.13 while obeying the constraint that the object must fit
within the bin (Equation 5.14 and Equation 5.15). (Recall that x41
and xi2 represent the normalised capacity and bandwidth require
ments of object i, respectively).
minimise diff, = Xil jeJ
Xi2 1 - ^ xj2 V j€J )
(Eqn 5.13)
xn +y£xJ1<l (Eqn 5.14)

Object Allocation for Disk Array Based Video Servers 182
Xi2+ X xj2~1 (Eqn 5.15)
Such a selection is made by traversing the list of remaining objects
for each object to be packed. This heuristic is termed Same-Shape
(SS). The requirement to traverse the item list for each selection
results in a higher time-complexity for SS than the FF algorithms.
This trade-off is discussed later.
Due to the heavily-skewed movie popularity distribution, popular
objects have a large bandwidth requirement and do not match the
"shape" (ratio of bandwidth to capacity) of the storage devices very
well. This fact results in these objects being chosen last by the SS
algorithm and hence often requiring a bin to themselves, creating
wastage. A simple modification of this Same-Shape heuristic can
alleviate this problem. By selecting the first one or more objects for a
new bin to be the largest remaining object (in either of the two
dimensions) it is guaranteed that all the large (and difficult to pack)
objects won't be left until last and all be requiring separate bins. It
should be noted that a similar motivation originally prompted the
improvement to the FF algorithm of presorting objects in decreasing
order of size (FFD), which has been shown to be a universal improve
ment. The adoption of this idea creates the Same-Shape-Biggest-
First (SSBF) heuristic which, in the next section is shown to give
considerably improved performance.
It will be seen (Figure 5.12) that selecting just the single largest
object first for each bin generally results in the most efficient pack
ing and the flowchart for this variant of the SSBF algorithm is shown
in Figure 5.7.
It should be noted that object replication is required by the SSBF
heuristic only if the disk array limitation (imposed by Equation 5.5)
is too small to allow a popular movie to be stored on a single array
due to its large bandwidth requirement. In this case the movie can

Object Allocation for Disk Array Based Video Servers
Figure 5.7 High-level flowchart of SSBF packing heuristic
be duplicated and treated as two separate objects with half the
bandwidth requirement each. W e consider this problem further in
Chapter 7.
Revisiting the above example, Figure 5.8 shows the packing obtained
by the SSBF heuristic for the same 17 objects. It can be clearly
observed that all bins obtain better utilisation in both capacity and
bandwidth dimensions and that the number of bins required is now
equal to the lower bound of three, derived earlier. Although simplis-

Object Allocation for Disk Array Based Video Servers 184
tic, this example implies that the SSBF heuristic m a y perform better
than existing heuristics for object distributions which are likely to be
found in interactive video services. The next section considers a wide
range of case studies which confirm the good performance of the
S S B F heuristic.
Figure 5.8 Improved packing performance of SSBF for example of Figure 5.6
5.8 Case Studies
This section uses a series of case studies to show that the perform
ance of the S S B F heuristic is significantly better than those previ
ously proposed, for the problem of allocating movies onto disk
arrays. As has already been discussed, worst case analyses of pack
ing heuristics tend to give a very poor indication of expected per-

Object Allocation for Disk Array Based Video Servers 185
formance in a typical situation. Also, previous average case
(simulation) studies have not focused on the types of input distribu
tions which are appropriate for the movie allocation problem. From
Table 5.2 it is clear that algorithms which perform well with uni
formly distributed object sizes, m ay not perform as well with other
object size distributions. Although exhaustive comparisons are
impossible, this section aims to use appropriate input distributions
to determine the quality of the SSBF heuristic versus both other
heuristics and the lower bounds derived in Section 5.6.
Table 5.3 presents the results of the SSBF heuristic for the cases
considered in Table 5.2. By comparison with the results for F F G A R
(and F F S U M (Table 5.2)), it is clear that SSBF performs almost
equally in the case of uniformly distributed object sizes, and consid
erably better for the bottom three rows of the table where distribu
tions appropriate to the movie allocation problem are considered.
Table 5.3 Performance of SSBF packing heuristic for the same inputs as Table 5.2
x-distn
Dist. Params
Uniform 10,1]
Uniform [0.2-0.8]
Uniform [0.1-0.4]
Gamma mn=0.01
Gamma mn=0.02
Gamma mn=0.03
y-distn
Dist. Params
Uniform [0,1]
Uniform [0.2-0.8]
Uniform [0.1-0.4]
Zipf mn=0.01
Zipf mn=0.02
Zipf mn=0.03
FFGAR a
lbb bins excess
530.6 533.4 0.5
541.9 544.8 0.5
252.4 271.5 7.6%
10.7 15.8 48
20.7 29.9 44
30.6 42.7 40
SSBF
lbb bins Vo
excess
536.2 555.8 3.7
539.1 548.3 1.7
252.2 268.9 6.6
10.7 11.2 4.7
20.3 23.2 14.3
30.5 34.9 14.4
a. The values for FFGAR are the same as those in Table 5.2 and are reproduced here to allow easy comparison. b. Note that the lower bounds shown are the greater of lbl and lb2 as indicated by Equation 5.12. In rows 1 and 2 the tight lower bound was given by lb2 while in the remainder of the rows lb 1 gave the tighter constraint.
Although promising, the results obtained by the SSBF algorithm
warrant more detailed consideration. The motivation for the SSBF
heuristic arose from the inability of previous heuristics to deal with
steeply decaying long tailed distributions of object size as is expected
in the movie allocation problem due to heavily skewed popularities.

Object Allocation for Disk Array Based Video Servers 186
The results presented above indicate that the SSBF heuristic does
indeed cope well with this type of distribution, while maintaining
adequate performance with the uniform distributions.
In order to confirm this conclusion the skewed distribution of
[Maru77] has been employed. This distribution, denoted by
G(2,m,a,b), is generated from m i.i.d. U(0,1) random variables
according to Equation 5.16.
( m ^ x = a YllJi +b where y1, ..., ym are U(0,1) (Eqn 5.16)
li = l J
This distribution has a range from b to a+b and the degree of skew is
dictated by m. A bell-shaped distribution with similar properties is
obtained by summing a set of U(0,1) random variables. This distri
bution, denoted by G(l,m,a,b) is generated from Equation 5.17.
ff m
a VVi = i J
/m + b where yv ..., ym are U(0,1) (Eqn 5.17)
These distributions have the significant property of easily defined
and bounded ranges (from b to a+b in both cases). This is in contrast
with many of the more common distributions including the Zipf and
G a m m a distributions used to date. When using the Zipf and Gamma
distributions it has been necessary to truncate the distribution,
which depending upon the other parameters can effect results.
Figure 5.9 shows the cumulative probability functions of G(l,m,l,0)
and G(2,m, 1,0) distributions for various values of m.
Before discussing further results obtained using these distributions,
a second metric for evaluation of the quality of a packing is intro
duced. Results in Table 5.2 and Table 5.3 have shown the percent
age excess required by a packing over the lower bound obtained. If
lower bounds are tight, this is an effective measure of the wastage of
the packing compared to the optimum packing [Coff84], If however,
the lower bounds are not tight, the results can be misleading. The
percentage excess is also exaggerated when the number of bins is

Object Allocation for Disk Array Based Video Servers 187
0.1 0.2 0.3 0.4 0.5 0.6 0.7 0.8 0.9 1
Figure 5.9 Cumulative probabilities for (a) G(1 ,m,1,0) and (b) G(2,m,1,0) distributions
small. As already seen in our example, an excess of 33% was
obtained for the FFD heuristic even though the packing required
only one bin in excess of the lower bound. A second measure (used
in [Maru77]) is that of bin utilisation obtained by a packing.
[Maru77] defines this as follows.
max,
u,
( n
I Vi= 1
A xil J (Eqn 5.18) A Containers Required
Note that this definition of utilisation only accounts for the dimen
sion that has the highest utilisation, other dimensions m a y be poorly
utilised if the totals are dissimilar. Since it is assured that the means
of the object sizes are the same in all dimensions in all the cases
considered here, this is not a significant issue. The utilisation meas
ure is independent of lower bounds, and instead gives a measure of
the fullness of the bins. As noted in [Maru77], however, a low value
of U A does not necessarily imply a poor packing algorithm. Indeed
for certain object size distributions, [Maru77] states that even the
optimal packing may approach a utilisation as low as 0.5. In such
cases the percentage excess over the lower bound m a y be a more
suitable measure of packing quality.

Object Allocation for Disk Array Based Video Servers 188
Figure 5.10 compares the performance of several heuristic packing
procedures for a varying degree of skew in the popularity (y-dimen-
sions) distribution. Increased skew is effectively modelled by
increasing m in the G(2,m,a,b) distribution. The capacity require
ment (x-dimension) of each object is selected from a G(l,6,a,0) distri
bution with a selected to ensure that the mean matches the mean
requirement in the y-dimension. This ensures that the total require
ment in each dimension is approximately equal and as such high
utilisation is possible in both dimensions.
•g 45
O X3 40-
CD
I" O 30
! « 0) '5 20 IT CD "- 15 W CO
8 » X <D .o 5
0
(a)
•
•
"
=
-- FF
— FFGAR
FFSUM
— SSBF
X
F / f i i
' -
= '
A ' ..r
,-y'
y y
95-
C •§, 85 CO W
\ A"'
•s.:-..
V%5.,k
i i • i
£ — - -i:
-- FF
•-•-FFGAR
FFSUM
— SSBF
-
3 4
m (b) 3 4
m
Figure 5.10 Excess required and utilisation achieved by various packing heuristics versus m for the G(2,m,1,0) distribution
Figure 5.10 (a) shows the percentage of bins required in excess of
the requirement found by the greatest lower bound. This figure is
calculated as a percentage relative to the lower bound and the points
shown are the result of 100 independent simulation runs, packing
1000 objects each time. Figure 5.10 (b) shows the utilisation
obtained by each packing as calculated by Equation 5.18 as a per
centage. In all graphs the intervals shown are for 9 5 % confidence.
The primary result from Figure 5.10 is that the SSBF heuristic pro
posed here provides the most efficient packing over a large range of
values of m. The exception to this is when m = 1 (ie. the y-dimension
distribution is uniform), in which case the decreasing FF algorithms

Object Allocation for Disk Array Based Video Servers 189
(FFGAR and FFSUM) both perform extremely well. This agrees with
results shown numerous times in the literature [Maru77].
The result for the standard FF heuristic is interesting. It is observed
that as the skew of the y-distribution increases, this unsorted ver
sion of FF outperforms both of the sorted varieties. This implies that
sorting the input list in the manner suggest by FFGAR and FFSUM
is actually detrimental to performance of the FF heuristic for skewed
distributions. It should be noted that FFGAR and FFSUM are the
two most successful sorting heuristics for multidimensional vector
packing from the literature ([Maru77] [Gare76] [Spie94]). The reason
for this worsening performance as skew increases is implied by
Figure 5.6 which illustrates the packing obtained by FFGAR for a
small set of Zipf distributed objects. In that case popular objects are
initially packed together, wasting capacity, and later unpopular
objects are packed together, wasting bandwidth (see Figure 5.6). By
leaving the objects unsorted, the randomisation assists the FF heu
ristic in gaining an efficient packing by mixing popular and unpopu
lar objects.
Given the variable size of video servers (from FES's storing only 10's
of movies to archival servers storing 1000's) it is important to con
sider the effect that the number of objects has on the packing effi
ciency obtainable. Figure 5.11 shows the performance of several
heuristics versus the number of objects stored. The object size distri
butions used are G(l,6,0.125,0) for capacity and G(2,4,1,0) for band
width.
From Figure 5.11 (a) it is observed that the excess of the SSBF heu
ristic over the lower bound is consistently low and decreasing as the
number of objects increases. The FF heuristic displays a similar
trend, although at a consistently higher excess than that of SSBF.
Interestingly, the two sorted FF heuristics perform worse (in terms of
both excess bins required and utilisation) as the number of objects
increases. This can be explained in similar terms to the explanation

Object Allocation for Disk Array Based Video Servers 190
•o
3 O X) h_
CD
o
o •a CD
o-CO CO CD
o 8
"10 50 100 200 500 1000 2000 5000 10000 1"
(a) Number of Objects (b)
50 100 200 500 1000 2000 5000 10000
Number of Objects
Figure 5.11 Excess required and utilisation achieved by various packing heuristics versus the number of objects packed
for Figure 5.6. As the number of objects increases, there will be a
greater number of large objects and a m u c h greater number of
smaller objects due to the long tail of the heavily skewed popularity
distribution. W h e n these objects are sorted into some sort of
decreasing order, the First-Fit heuristic will tend to pack just a few
large objects together into a single bin, fully utilising the bandwidth
dimension but underutilising capacity. Once the larger objects are
depleted, the smaller objects will be packed, now fully utilising
capacity but wasting bandwidth. This problem is not observed with
the simpler unsorted FF heuristic since the random order of objects
ensures that small and large objects are more likely to be packed
together, giving a relatively good packing.
The results shown to date have used the SSBF algorithm with only
the first object of each bin being selected as the largest remaining
object (Biggest First). Figure 5.12 shows the percentage excess for
cases where other numbers of objects are selected using the Biggest
First method. The figures shown are for an object capacity distribu
tion of G(l,6,0.25,0) and a bandwidth requirement distribution of
G(2,3,l,0), with 1,000 objects to be packed in each case. The error
bars are negligible (comparable with Figure 5.10) and are omitted for

Object Allocation for Disk Array Based Video Servers 191
clarity. It is clear that in this case the SSBF variant which selects a
single object using the Biggest First criteria results in the most effi
cient packing. This observation remains true for the other input dis
tributions investigated here. Note that as the number of objects
selected as Biggest First increases, the efficiency approaches those
of the F F G A R and F F S U M algorithms (see Figure 5.10 at the value of
m=3). This is to be expected since the SSBF algorithm reverts to a
form of F F D algorithm as the number of Biggest First objects
increases.
25-
"O c 3 o JD i_
a) 5 o t_
Cl) > o •o
0) 1—
3
cr CD w CO CD C) X CD 5̂ 0^
20
1h
10
5
n l I I l _ l I — I — I — I — I — I — ' — • — ' — ' — • — J — ' — ' ' -1 0 1 2 3 4 5 6
Number of objects selected as Biggest First Figure 5.12 Comparison of packing efficiency versus number of objects selected
as the biggest remaining objects
As already mentioned, the one penalty paid by the SSBF heuristic is
its higher time complexity. In Figure 5.13 the execution time of each
heuristic is shown against the number of objects packed. The values
shown are C P U seconds of execution time on a Sparcstation IPX with
each of the heuristics written in C.
The curves of Figure 5.13 reveal that the SSBF is indeed considera
bly more expensive than the other algorithms in terms of execution

Object Allocation for Disk Array Based Video Servers 192
(a) 50 100 200
Number of Objects 500 200
(b) 500 1000 2000 5000 10000
Number of Objects
Figure 5.13 Execution time of various packing heuristics versus the number of objects packed.
time. However, the graphs shown can be misleading and the maxi
m u m execution time for the SSBF algorithm for 10,000 objects was
actually only 360 seconds. In other words, the SSBF algorithm takes
6 minutes to run on the largest set of objects likely to be stored in a
single video server. Given that the allocation of objects to disk arrays
takes place on a timescale of days (or even weeks), this 6 minute
overhead is insignificant. Recall also that using generally applicable
heuristics (such as simulated annealing) can result in running times
of many hours for cases with only tens of object being packed
[Spie94].
It should be noted that the time complexity of the SSBF heuristic is
easily determined to be 0(n2). This is due to the fact that for each of
the n objects the entire set of objects is traversed in order to find the
best fit for the current available space in the array (see the flowchart
in Figure 5.7). The measurements shown in Figure 5.13 reveal that
the execution time of the SSBF algorithm is equal to 3.85 * n2 micro
seconds where n is the number of objects requiring packing. Fur
ther, the other heuristics do generally perform on the order of
O(nlogn) as anticipated, with both FFGAR and FFSUM having identi
cal execution times. This is expected since both involve sorting the

Object Allocation for Disk Array Based Video Servers 193
data set before applying the FF algorithm. FF itself is of course the
fastest of all, since no sorting is required on the input dataset.
5.9 Conclusion
Utilising homogeneous disk arrays for video service overcomes the
implementation problems of using hierarchical storage systems, of
which heterogeneous disk arrays are one type. Previously it has not
been clear that such homogeneous arrays will be capable of effi
ciently storing objects with widely varying capacity requirements
and rapidly changing bandwidth requirements. A n efficient packing
scheme was required if such a goal was to be obtainable.
This chapter has presented an efficient heuristic for allocating
objects to homogeneous disk arrays. A n examination of the alloca
tion problem revealed its similarity to the two-dimensional vector
packing problem of operations research. This optimisation problem,
known to be NP-hard, has previously been solved by the use of bin-
packing heuristics such as First-Fit and First-Fit Decreasing.
Although known to provide high quality solutions for uniformly dis
tributed object sizes, these heuristics were shown to perform poorly
for the types of object size distributions anticipated in interactive
video servers. This fact combined with the poor performance and
long execution times of generally applicable heuristics [Spie94], lead
to the proposed of a new problem specific heuristic termed Same-
Shape Biggest First.
Same Shape Biggest First (SSBF) utilises problem specific informa
tion to provide near optimal solutions for a range of appropriate
object size distributions. Further, the SSBF heuristic is shown to
provide solutions which are consistently close to the tight lower
bounds also developed in this chapter.
This chapter has also shown that the Erlang-B formula can be used
to accurately model the blocking probability of a disk array based

Object Allocation for Disk Array Based Video Servers 194
video server. This fact has then been applied to allow the raw band
width of a disk array to be scaled to give an "effective bandwidth" in
terms of the number of streams that can be supported while still
meeting a certain blocking probability constraint.
Although the architecture of the video server proposed in this chap
ter has changed somewhat from that assumed in the cost model of
Chapter 3, it will be shown in Chapter 7 that the cost model in
Chapter 3 and the argument in favour of distributing storage across
the network still hold. Indeed the disk based nature of the server
ensures that the cost model developed earlier is still fundamentally
valid.
Following the object placement discussed above, a video server is
able to commence serving requests as they arrive for the individual
objects stored within each disk array. In order to ensure that QoS
constraints are met, the server will need to implement a call-admis
sion control (CAC) procedure before admitting new requests. Such a
process is required to ensure that sufficient resources are available
within the server to support the new request. In the next chapter a
unique CAC scheme is proposed which is aimed at minimising
admission delay and delay variation for new requests.

Call Admission Control for Disk Array Based Servers 195
6. Call Admission Control for Disk Array Based Servers
Our patience will achieve more than our force.
- Edmund Burke
6.1 Introduction
This chapter presents a novel call-admission control scheme aimed
at alleviating short term load imbalances across a disk array in an
interactive video server. Such load imbalances increase admission
delays and will be shown to occur frequently when using the simple
admission schemes previously proposed. The scheme proposed here
uses the serm-deterrninistic nature of disk array operation to make
predictions regarding the future load on each disk in the array. By
admitting clients onto a lightly loaded part of the array, the overall
load can be better balanced and hence utilisation will be improved.
Further, this scheme can be used to differentiate between admission
and interactivity requests. It will be seen that an interactivity
request can be treated as a call release and a re-admission to a dif
ferent part of the array. Given the "interactive" nature of these
requests it seems reasonable to suggest that they should be handled
with lower delay than initial admission requests. With this in mind
the two-priority scheme proposed here is able to delay admission
requests to maintain a balanced load while also improving the
response time to interactivity requests.

Call Admission Control for Disk Array Based Servers 196
As was shown in Chapter 4, coarse-grained disk arrays in the nature
of RAID 5 provide the most cost effective means of delivering large
video objects to customers. One drawback of coarse-grained striping,
however, is that the load on the individual disks is not inherently
well balanced across the array. As mentioned in [Vin94b] the instan
taneous load on each disk can vary dramatically from one service
round to the next. This variation results in poor array utilisation,
since lightly loaded disks are underutilised. [Vin94b] attempts to
address the issue by allowing underutilised disks to continue read
ing extra data in a particular round and buffering this data until it is
needed. The increase in array utilisation thus comes at a cost of a
significant increase in buffering.
The metrics used to compare the simple and predictive CAC schemes
presented in this chapter require careful consideration. One of the
goals of the predictive scheme is to improve load balance across the
entire array. As such, comparisons of the variance of the array load
and minimum and maximum values of load between the two
schemes would seem reasonable. Load balancing alone, however, is
of no use if it does not provide some tangible benefit to the user. As
will be shown, the benefit expected is in terms of the delay experi
enced by the user between issuing a call admission request, and the
commencement of video playback. It is important to note that it is
not only the mean value of this delay that it is important, but also
the variability. Previous work in the field of computer-human inter
action has shown that users will tolerate relatively long delays if this
is what they expect, and if it is what they consistently receive
[Shne84]. Obviously, reducing mean delay is desirable, but it is clear
that a reduction in variance (or the upper percentiles) of delay may
be more beneficial. For these reasons mean delay, variance and the
upper percentiles of delay are used as the primary basis to evaluate
the CAC scheme proposed here.
The remainder of the chapter is set out as follows. Section 6.2
reviews the salient points of the operation of coarse-grained disk

Call Admission Control for Disk Array Based Servers 197
arrays for interactive video. Section 6.3 discusses the simple CAC
scheme from existing literature. It is shown that this scheme can
lead to load imbalance, which in turn effects viewer delay. This
result motivates the requirement for the more efficient CAC scheme
(termed predictive CAC) which is presented in Section 6.4. As part of
this section, interactivity is discussed and it is shown how interac
tivity requests can be dealt with more efficiently than call admission
requests. Section 6.5 presents a set of case studies comparing the
simple and predictive CAC schemes for situations with varying
degrees of user interaction. Following these case studies general
conclusions are drawn regarding the properties of the predictive
CAC scheme in Section 6.6.
6.2 Operation of Coarse-Grained Disk Arrays
Following the results of Chapter 4, this chapter limits itself to the
consideration of coarse-grained disk arrays. As already discussed, in
a coarse grained array, blocks of each video object are stored on
individual disks in a round-robin layout1. During playback, as cli
ents request sequential blocks of video in every cycle, the load on
each disk moves in round-robin fashion from one disk to the next.
This idea is illustrated in Figure 6.1 for a four disk array (ignoring
parity) with two objects (A and B) each consisting of just 8 blocks.
Note that during initial allocation the first block of object A (block
AO) was allocated to disk 1, while the first block of object B (BO) was
placed on disk 3. There is no particular reason for this, except to
indicate that all objects need not share the same starting disk.
Assume that at some time (the start of cycle i) 8 customers were
present in the system and cycle i required the retrieval of blocks AO,
A4, A6, Bl, B3, B4, B5 and B6 as indicated. Due to the sequential
nature of video playback (assuming no interactions or terminations),
1. Note that the distributed parity blocks of RAID-5 architectures change this layout slightly, but by using Left-Symmetric data placement the round-robin nature is pre
served. [Chen94b]

Call Admission Control for Disk Array Based Servers 198
Blocks Cycle ' A0, A4' A6, B1' B3' B4' B5> B6
Requested Cyde i+1 A1 > A5> A7> B2j B4j B5> B6 B7
Diskl Disk 2 Disk 3 Disk 4
Load Cycle i
Cycle i+1
AO
B2
A4
B6 CO
CM
«•«.
A1
B3
A5
B7
1 -̂ ^ 3
"*»
A2
BO
A6
B4
2 -̂ ^ 1
"-
A3
B1
A7
B5
2 ^ ^ 2 \
Figure 6.1 Operation of a coarse-grained disk array.
the blocks required during cycle i+1 will be Al, A5, A7, B2, B4, B5,
B 6 and B 7 as shown. The effect that this has on the load on each
disk is clear. The load is seen to move from one disk to the next in a
cyclic fashion since in general a client being served by disk dj in
round i, will be served by disk di+1 = (dj+1) m o d N during round i+1.
As this load rotates around the disks, it is clear that in the long-term
all disks will do an equal amount of work. As such it can be stated
that the load on the array is balanced in the long-term. In the short-
term however, it is possible that the load on individual disks will
vary considerably across the array. The consequence of such varia
tion will be an increase in call admission delay for particular
requests if the desired start disk is fully loaded, even if other disks
are only lightly loaded.
Figure 6.2 shows an (admittedly contrived) example, again assuming
a 4 disk array, where each disk can serve a m a x i m u m of 10 streams.
In part (a) of the figure, the load is very unevenly spread, leading to a
very high delay for the new request. In part (b) the same load is now

Call Admission Control for Disk Array Based Servers 199
evenly spread across all disks and the new request can be admitted
at the end of the current cycle.
10
9
10
(a) Delay
9
(b)t )ela
New Request
10 6 Poor Balance
= 4 cycles I New Request
9
y = 1cj ic\e
9 Good
Balance
Figure 6.2 Delay incurred by (a) a poorly balanced system, versus (b) a well balanced system
The next section discusses the simple CAC scheme and demon
strates the poor load balance achieved by this scheme.
6.3 Simple CAC Scheme
In a coarse-grained array each disk has a predetermined upper limit
on the number of streams that can be served concurrently. In other
words, if the number of streams currently being served by that disk
is less than this upper limit, then a new stream can be admitted. As
discussed in Chapter 2, the effort to date has been focused on meth
ods for determining this upper limit (see for example [Chan94b] and
[Vin94a]). Previously proposed "simple" CAC schemes (which
although not often discussed explicitly are implied in the literature
including those references cited above), typically admit a new stream
to the required disk in the array whenever possible. If the current
disk is fully loaded, the request may be queued until the load on the
required disk has decreased to the point that a new stream can be
admitted, or until the waiting client reneges and leaves the system.

Call Admission Control for Disk Array Based Servers 200
Such a simple scheme relies on the independence of individual
requests to ensure that during steady-state operation, the load on
the server is relatively well balanced. Unfortunately, despite the
independence of each request, it is possible that the load may
become quite significantly unbalanced. In other words certain disks
may be fully loaded while others remain lightly loaded. This in turn
effects user admission delay as indicated in Figure 6.2.
Before developing a new CAC scheme, it must first be determined
how poorly balanced a system is likely to be when employing the
simple CAC policy. To investigate the severity of the likely load
imbalance, an approximate queuing model is used. Each disk in the
array can be modelled as a multiserver queue with independent
Poisson arrivals. Further it is assumed that requests arriving at fully
occupied queues are blocked and leave the system (ie. there is no
queueing). Also, since it has already been shown in Chapter 5 that
results for M / M / m / m queues tend to hold well for M/G/m/m
queues it is assumed that call holding times are Poisson. Now given
a system utilisation of p = XI \i the probabilities of state of an individ
ual disk are easily calculated from [Klei75]:
Pk=^{i^} (^n 6.1)
where pk is the probability of k servers being occupied in an
M / M / m / m queue (ie. the probability that a given disk is serving k
streams at any moment). This distribution of pk alone gives an indi
cation of the likely load imbalance of the system. Figure 6.3 shows
the distribution of pk for a disk capable of serving 10 streams and
utilisations ranging from 0.7 to 0.9.
The curves in Figure 6.3 represent the probability of a particular
number of streams being served by a given disk in the array. The
high variance of the distribution indicates that despite high average
loads on the server there is a strong likelihood that a particular disk
will only be lightly loaded while other disks in the array may be very

Call Admission Control for Disk Array Based Servers 201
0.2
0.18
0.16
0.14
rt 0.1 .a o i_
°- 0.08 0.06
0.04
0.02
0 0 1 2 3 4 5 6 7 8 9 10
Number of Streams on a Given Disk
Figure 6.3 Distribution of number of active streams under a load of 0.7-0.9 for a single disk capable of serving 10 streams and no queueing.
heavily loaded, especially considering that a single array will consist
of tens of disks.
To give further insight into the inherent load imbalance on a coarse
grained disk array, consider the expectation of the minimum or max
imum load on any disk in the array. In an array of N disks it is
straightforward to calculate the probability that at least one disk will
carry a particular load.
pk = Prob[at least one disk has load k] = 1 - [ 1 - pk] k=0 m (Eqn 6.2)
From this it is possible to calculate the probability that k is the
smallest number of streams being served by any disk in the array.
Given independence between disks, the probability that a given load
is the lowest in the array is calculated as follows:
. Jc-l
pk = Prob[k is the lowest load in the array] = pk ]"J (1 - pt) (Eqn 6.3)
i = 0
n r ~i i 1 1 r i i
- rho=0.7
- - rho=0.8
— rho=0.9
J L_

Call Admission Control for Disk Array Based Servers 202
Since for k to be the minimum load, loads of k-1, k-2,..., 0 must not
occur. The probability that a given load (k) is the highest in the array
can be determined similarly:
m
pk = Prob[k is the highest load in the array] = pk TJ (1 - p •) (Eqn 6.4)
i= k+1
Now, letting L denote the random variable of the minimum load in
the array at any time, the expectation of L is easily calculated in the
standard manner.
m L E[L] = £ lPi
1=0 m i-
- I iplTla-p})
1=0 (Eqn 6.5) mi- J- 1
t = 0L i = 0
and the expectation for the maximum load in the array at any time,
denoted by H, can be found as follows:
E[H] = X lp? 1 ° (Eqn 6.6) m
(=0 ip\ n ^-ph\
i = k+l -I
As shown in Figure 6.4, the difference between the expected mini
m u m and maximum loads on the array is quite considerable, even in
small arrays. Note that the graph also shows simulated results
which are in total agreement with the analytic results from
Equation 6.5 and Equation 6.6 above. The simulation model used is
discussed next. This measure of load imbalance implies that there is
significant room for improvement over the simple admission policy
discussed so far.
In order to further investigate this load imbalance problem, an
event-driven simulation has been developed. This simulation models
the cyclic movement of load around the array, and admits and
releases new customers according to the simple CAC scheme
described above. The trace shown in Figure 6.5 (a) illustrates the

Call Admission Control for Disk Array Based Servers 203
:-*-»•* * ££--*-* &'
— 10 disk analysis
50 disk analysis
— 7 100 disk analysis
•x Simulation
Mean Load
Figure 6.4 Expected minimum and maximum loads on various size arrays for a range of utilisations
delay experienced by each new request and the statistics of the load
on the system at the time each request is accepted. For this figure,
for example, the server is assumed to consist of 100 disks with each
disk able to serve 10 streams in each cycle. The arrival rate of new
requests is set to give an average utilisation of 0.9, with the interar
rival time between requests being Poisson distributed.
Figure 6.5 (a) indicates the highly variable delay seen by new
requests. The first 500 (or so) requests all receive a delay of less than
1 second (one cycle time) since the server is empty at the start of the
simulation and this transient period sees disks becoming loaded. As
soon as some of the disks are fully loaded, some requests will be
delayed when they require a disk that is currently fully loaded. As
load continues to increase (see Figure 6.5 (b)) until approximately
the 900th request arrives, the delay seen by new requests continues
to increase. The remainder of Figure 6.5 (a) reveals the high variabil-

Call Admission Control for Disk Array Based Servers 204
(a)
CO
E to
o w * e T3
8 5 -I 4 W 3
Q
-I O O O 1 5 0 0 2 0 0 0 2 S O O 3 0 0 0 3 5 0 0 4 0 0 0 4 5 0 0 S O O O
Request Number
max
mean
mm
std dev - 0 5 0 0 1 O O O 1 S O O 2 0 0 0 2 5 0 0 3 0 0 0 3 S O O 4 0 0 0 4 S O O S O O O
(b) Request Number
Figure 6.5 Delay and load for the Simple CAC scheme
ity of call admission delay with some requests being delayed for over
30 seconds before admission.
The plots in Figure 6.5 (b) reveal the cause of this delay variability.
Ignoring the transient start-up period, there are always some disks
fully loaded. With a utilisation of 0.9 this is to be expected. But the
load on the least loaded disk at any time (represented by the solid
line) is actually quite low (the mean value is just 3.22 streams on the
least loaded disk2). This reinforces the result that load balance in
the system is poor even when requests are queued. While many
disks are fully loaded, a number are operating at loads of just 3 or 4
streams. The dotted line represents the standard deviation of the
load.
2. Note that this differs from the result in Figure 6.4, since queueing is now incorporated into the simulation model.

Call Admission Control for Disk Array Based Servers 205
A perfectly balanced system would (of course) have a deviation of
zero and the maximum, minimum and mean values would all be
identical at all times. Due to the integer nature of the number of
streams on a disk this is clearly impossible, but a significant
improvement should be possible over that seen in Figure 6.5 (b). The
predictive CAC scheme introduced next, is aimed at achieving some
improvement in the load-balance and hence delay characteristics of
the coarse-grained disk array based video server.
6.4 Predictive CAC Scheme
It was demonstrated in Figure 6.1 that the load on a disk array
passes from one disk to the next in a cyclic fashion at well defined
intervals of time. As such, the load on a given disk can be predicted
for long periods into the future with a high degree of accuracy. This
accuracy is not complete, as calls terminate and new calls com
mence, changing the load on the disks. Due to the rapid cycling of
load from one disk to the next, however, the predictions tend to
remain very accurate. This accuracy comes about because load
cycles on intervals around 1 second while changes in total array load
(call arrivals or departures) occur on timescales of minutes. This
point will be discussed further later, with respect to interactivity
considerations.
It is the deterministic aspect of disk array operation that is used to
advantage by the predictive CAC scheme. Given that our aim is to
improve load balance within the array, the following framework is
used. It is possible to view placing a stream on a lightly loaded disk
as a benefit. That is, it is beneficial to the overall array performance
and to future admission delays, to admit the current request to a
lightly loaded disk. This benefit can be obtained at a cost of possibly
delaying the admission of the current request. The predictive CAC
scheme quantifies these costs and benefits and trades them off
against each other to determine when a given call should be admit-

Call Admission Control for Disk Array Based Servers 206
ted. Figure 6.6, illustrates the idea of delaying a n e w request in
order to improve load balance.
i New Request
10
- s — — i — \ Timetn \ y
—| Delayed Request \ \
10
i Delayed F
4+1
Time t-j
Figure 6.6 Delaying a new request by one cycle to improve load balance
At time t0 a n e w request arrives requiring to start on disk 3 which
currently carries a load of 9 streams. The simple C A C scheme would
immediately admit this stream, resulting in a full load on disk 3.
Investigating the load on the other disks in the array, it is observed
that the load on disk 2 is just 4 streams and in the next cycle (at
time tj) this load will be transferred to disk 3. The predictive C A C
scheme would determine that there is a large benefit associated with
delaying the stream for just one cycle (small cost) to place it on a
disk that is m u c h less loaded. In other words the slight increase in
delay for this request should be balanced by avoiding long delays for
future requests. Note, however, that it is important to account for
h o w long the current request has already been waiting w h e n decid
ing whether to further delay it. The algorithm used by the predictive
scheme is illustrated by the pseudocode of Figure 6.7.
In the algorithm, Mean_Load is the average load on all disks and
Threshold is a parameter which determines w h e n the algorithm
becomes active. While Mean_Load is below Threshold the system
relies o n the simple scheme to maintain sufficiently good load bal
ance. W h e n the load climbs above the Threshold w e use predictive

Call Admission Control for Disk Array Based Servers
if (Mean_Load > Threshold)
i = Request_Disk();
j = (i + 1) mod N;
while (j * i)
benefit = 8^ * (Streams(i) - Streams(j));
cost= ((Delay(j)-Delay(i)) / Mean_Delay());
if (benefit > cost)
Delay_Request(j);
exit loop;
end /* if */
j = (j + 1) mod N;
end /* while 7
end /* if 7
Figure 6.7 Predictive C A C algorithm
CAC to improve the load balance. For the experiments performed
here, the Threshold is set to 7 0 % of the maximum load (unless oth
erwise stated). Without a threshold the scheme can be shown to
incur unnecessary delay to new requests in a lightly loaded system.
8T is a parameter discussed later. Request_Disk() returns the disk
number used by the new request. Streams(i) returns the number of
streams being served by disk i, and Delay(i) returns the delay until
we reach disk i. Mean_Delay() uses a sliding window to determine
the current mean delay experienced by requests into the system.
Delay_Request(j) causes the current request to be delayed until the
load currently on disk j has moved to the target disk.
As can be seen from the algorithm, the benefit of delaying a stream
increases with the difference in load between the initial target disk
and the prospective target disk. For example, if the target disk is
very heavily loaded and a disk elsewhere in the array is lightly
loaded, the benefit in delaying the stream until the light load is on
our target disk, is high. The cost of delaying a stream is related to
what increase in delay is incurred by doing so. As such, if the lightly
loaded disk referred to above is a large "distance" away, this trans-

Call Admission Control for Disk Array Based Servers 208
lates to a long delay and as such a high cost3. 5X is used as a weight
ing factor between the benefit and cost (with 0^=0, the predictive
scheme reduces to the simple CAC scheme, while when Si-**., the
predictive scheme would always provide perfect load balance at the
cost of very long delays for admission). The Delay_Request(j) function
will delay admission of the current request until the load currently
on disk j is on the target disk.
The graphs shown in Figure 6.8 below reveal the advantage yielded
by the predictive scheme. The trace used to generate these results is
identical to that used for Figure 6.5 for the simple CAC scheme. In
this case a value of 8!=1.6 has been used. This value has been deter
mined by experimentation. A rigorous scheme for deterrmning opti
m u m values of 8i requires further investigation.
Comparing Figure 6.8 with Figure 6.5 it is observed visually that the
variation in delay is significantly reduced by the predictive scheme.
Also, the load balance has been considerably improved with the least
loaded disk now carrying an average of 6.01 streams. This improve
ment in load balance is also reflected by the decrease in the stand
ard deviation of load, and it can be concluded that it is the improved
load balance that leads to the lower variance in admission delay.
In Table 6.1 the metrics discussed in Section 6.1 are presented for
the simple and predictive CAC schemes. The error values give 9 5 %
confidence intervals in each case.
Table 6.1 Various measures of delay of new requests for simple and predictive CAC schemes
Simple CAC
Predictive CAC
Mean
3.3±0.2
2.95±0.2
Variance
27.5+9.5
13.5±2.5
95th Percentile
12.3±1.0
9.2±0.7
99th Percentile
22.6±2.2
17.3±1.6
3. Note that the cost is currently linearly related to distance. Although other relationships have been examined (eg. cost increasing as the square of the distance) they do not seem to have significant effect. This aspect of the predictive admission scheme does, however, warrant further consideration.

Call Admission Control for Disk Array Based Servers 209
SOO -i OOO 1 SOO 2000 2SOO 3000 3SOO 4 0 0 0 4500 SOOO
(a) Request Number
» E CD
co o _l A;
co
I
j /
« / i" / fnnr
• > 1 • * - r • / H *
' J 1 / i '
' . — . . . . • • .
1 '.--*'"""" "
•/ Y
'
. . , „ „ - s s
- • * ^ ^ ^ , - , « * • / • - » / '
T 1 1U1I 1XJUUUI L i i I I UU1 1 1
..—, , ,. •-'•-^S''"' '' ~'~'-•-'--* •'"•-'••"' '--v~̂ _̂.....,.._-'-
max
„ _ , ~ ^ , . . - . - . , , ^ - ' " " - « • - ,
rfieah inn nnnr - 1—n—ni—run i —
Jf fmin [ |lJO
std dev ' - • * - • • — • - . • - . ^ . * . . . _ . . . . . , . . . ^ ^ . ^ • - • ' " • - - " - ' " ^
O SOO -1 OOO 1 SOO 2000 2500 3000 3SOO 4000 4500 SOOO
(b) Request Number
Figure 6.8 Delay and load for the Predictive CAC scheme
It is noted from Table 6.1 that the predictive scheme provides an
advantage over the simple scheme in all metrics. The mean delay is
only slightly reduced, but as already mentioned it is the upper per
centiles of delay that tend to give a better indication of user satisfac
tion. From the 95th percentile figures it can be seen that the
predictive scheme provides 2 5 % lower delay than the simple scheme.
Considering that this advantage is achieved at zero cost in terms of
additional resources, it would appear that the predictive scheme is
indeed worthwhile. Further comparisons are presented in
Section 6.5.
6.4.1 Interactivity Considerations
The initial comparisons presented above have been carried out
under the assumption that no interactivity takes place. This has the
effect that the deterministic nature of disk array operation is only

Call Admission Control for Disk Array Based Servers 210
disturbed by the arrival of new requests and the departure of com
pleted requests. When a user interacts with the server the load on a
number of disks may be effected. This will reduce the accuracy of
future load predictions, which, in turn will effect the efficacy of the
predictive admission scheme.
As discussed in Chapter 2, viewer interactivity can take a number of
forms. Pausing, rewinding, fast and slow play are all types of inter
action that may be supported in a video server. Each type of interac
tion may have a different effect on the server and on the individual
disks in an array. Pausing, for example, temporarily reduces the
load on the current target disk by one stream, increasing it later
when the user resumes viewing. Fast play, on the other hand, can be
implemented in a number of ways (see Section 2.4.5) with the effect
on the disk array depending on the implementation. Given the
uncertainty concerning which interactive functions will be required,
and how they will be implemented, a simplifying (but realistic)
assumption has been made in this section. It is assumed that all
interactions have the same effect on the disk array. The effect is that
of reducing the load on the current disk by one stream and increas
ing the load on some other (randomly chosen) disk by one stream. In
other words the stream's current access point is moved to some new
randomly chosen disk in the array. At some later time the stream is
again moved in a similar manner, emulating the end of the period of
interaction. This idea follows the model used in [Mour96] and effec
tively models servers which either encode separate streams for fasf-
play, reverse-play and the like [Saka96], or which support these
functions via buffers in the STB [Alme96].
Using the above model, an interactivity request can be treated as a
call release and a new call admission (with reduced residual service
time) to a different part of the array. From the users perspective,
however, it is likely that the user will expect more rapid response to
an interactivity request than to a new call admission request. The
nature of the predictive CAC scheme allows the system designer to

Call Admission Control for Disk Array Based Servers 211
arbitrarily differentiate between admission and interactivity
requests. While admission requests are admitted according the
standard predictive scheme, interactivity requests can be handled
with decreased delay by reducing the load balancing requirements,
and admitting them with a lower values of 8.
Figure 6.9 is a block diagram of the operation of a video server
employing predictive C A C for new requests and interactivity
requests. Once a request reaches the server it can be identified as an
admission or interactivity type request. From this point the admis
sion requests are passed to the predictive C A C scheme (with param
eter &i), which uses state information from the disk array to
determine when to admit the stream to the required disk. The inter
active requests generate a release message to the disk array and
then use another invocation of the predictive C A C (with a different
parameter value, 82) scheme to recommence with the new stream as
soon as possible. Note that 8X and 82 represent different values of the
same parameter used in different invocations of the predictive C A C
scheme (see Figure 6.7) for admission and interactivity requests
respectively.
Having already illustrated the potential benefits of the predictive
C A C scheme in a video server without interactivity, it is now clear
that the predictive C A C scheme has a potential further advantage in
systems which do support interactivity. That is, the predictive
scheme can be used with a high value of 8 x to maintain load balance
while simultaneously admitting interactivity requests as soon as
possible by setting a lower value of 82. This has the desirable result
that interactivity requests m a y be handled with shorter delays than
the more delay tolerant admission requests [Alme96j. Note, however,
that the support of interactivity can be expected to result in a reduc
tion of the admission delay benefits seen earlier for the predictive
scheme. This trade-off is illustrated in Section 6.5.

Call Admission Control for Disk Array Based Servers 212
Requests
Admission Interaction
Low-priority CAC §1
Array State
High-priority C A C 52
} I Admit I lAdmit Release
Array Controller
Figure 6.9 The operation of the predictive C A C scheme for admission and interactivity requests within a disk array based server
6.4.2 Blocking Probability
Before considering the delay performance of the predictive admis
sion scheme in more detail, we first demonstrate that the blocking
probability of the predictive CAC scheme is still accurately modelled
by the Erlang B formula as discussed in Chapter 5. It has already
been shown that an M/G/m/m queue can be accurately modelled by
an M / M / m / m queue for moderate values of m (Section 5.4). For this
model to be accurate in the case of an array with many disks, how
ever, a customer must be willing to wait for one full service round
before service commences. This constraint allows the array to be
modelled as one queue with the number of servers, m, equal to the
product of the number of disks and the number of streams admitted
to each disk. Given that customers are likely to be willing to wait
some finite amount of time, the constraint of one cycle time seems

Call Admission Control for Disk Array Based Servers 213
reasonable. If longer waiting times were acceptable, lower blocking
probabilities would result; while shorter waiting times would, of
course, have the opposite effect. Determining blocking probability in
these cases involves modelling each disk as an individual queue and
accounting for the overflow traffic from one disk to the next. This
issue is not considered here, since the waiting time assumption used
in the Erlang-B model results in a considerably simpler model for
accurately deterrrrining blocking probability.
Figure 6.10 shows the blocking probability for several array sizes. In
each case the solid line represents the Erlang-B blocking probability
while the other lines represent the simulation results for a non-
interactive system for various values of 81. It is clearly observed that
the simulation and analytic results agree identically, and that block
ing probability is independent of ST. This is to be expected, since the
predictive scheme can only effect the delay of the streams that are
admitted, it is unable to influence the number of streams that the
server can admit. No scheme can increase the number of streams
admitted without increasing resources in some way.
Figure 6.10 Blocking probability versus utilisation for several array sizes. Each disk serves 10 streams.

Call Admission Control for Disk Array Based Servers 214
Although not explicitly shown, the level of interactivity has no effect
on blocking probability. Since each interactivity request results in a
decremented load on one disk and an incremented load on another,
overall array load is unchanged and so blocking probability is not
affected. It is clear that for the delay tolerance assumptions made
here, the Erlang-B formula provides a very accurate and simple
model for blocking probability of a disk array based video server.
This model is independent of the CAC scheme used and the degree of
interactivity (provided interactivity is modelled as a call release and
readmission).
6.5 Case Studies
The case studies presented here are divided into two categories. The
first set of results examine the comparative performance of the sim
ple and predictive CAC schemes under the assumption of no interac
tivity using the metrics defined in Section 6.1. The second set of
results are derived for situations where interactivity is permitted. In
these cases interactivity is modelled as discussed in Section 6.4.1.
Unless otherwise stated the results shown here are for a single array
consisting of 100 disks, with each disk capable of maintaining 10
streams. Each cycle lasts for one second, so load is passed from one
disk to the next deterministically at the end of each second. The
threshold for activation of the predictive scheme is set to 7 0 % of
peak load. The array is generally loaded to a utilisation of 0.9, and
all error-bars represent 9 5 % confidence intervals calculated using
the method of batch means [Law91].
6.5.1 No Interactivity
Following the survey by Shneiderman ([Shne84]) it is clear that con
sistency of delay is an important factor in viewer satisfaction. Con
sistency of delay can be represented by the distribution of call
admission delay. As such, the first item of interest when comparing

Call Admission Control for Disk Array Based Servers 215
the predictive and simple CAC schemes is the cumulative frequency
of delay which is presented in Figure 6.11 for a value of 81=1.6.
0.95
^ 0.9 c w ID CT CD i_
u_ <B0.85
> E 5 0.8
0.75
0.7
zzzz±- •
Predictive CAC Simple CAC
10 15 Delay (s)
20 25 30
Figure 6.11 Cumulative frequency of delay for predictive and simple CAC schemes
If the system were able to provide a perfectly constant admission
delay, the cumulative frequency would appear as a unit step located
at the mean delay. Due to the fixed duration of service rounds a
totally fixed delay is, however, impossible. The best that is possible is
a delay that is constant to within the time of 1 service round (1 sec
ond in this case). It is observed from Figure 6.11 that the predictive
scheme more closely approximates the ideal unit step than does the
simple scheme. It should be noted that the improvement provided by
the predictive scheme is also manifested in the upper percentiles of
delay as shown in Table 6.1.
Another important consideration when dealing with the predictive
scheme is how its performance is affected by the load on the system.
For the next comparison, the same array was subjected to a load
varying from 6 0 % to 9 5 % utilisation for each of the CAC schemes.

Call Admission Control for Disk Array Based Servers 216
The 95th percentiles of delay for each scheme are shown in
Figure 6.12.
20
18
16
14
12
JT10 Q
8
6
4
2
60 65 70 75 80 85 90 95 100 Utilisation (%)
Figure 6.12 95th percentile of delay versus array utilisation for each scheme
It is observed from the figure that at high loads, the delay of the pre
dictive scheme is significantly less than the simple admission
scheme. Note, however, that at lower loads (70-80%) the predictive
scheme actually incurs a higher delay than the simple scheme. This
deviation in the dashed line is caused by the threshold of the predic
tive algorithm (see Figure 6.7) which is set to 7 0 % of peak load. As
the load on the system fluctuates around 7 0 % the predictive scheme
alternates between active and inactive states, causing increased
delays to some requests, but does not effectively improve the system
load balance. Below the threshold, both schemes operate identically,
providing very small delays to all requests. It is clear from
Figure 6.12 that the predictive scheme provides the most substan
tial benefits at high loads when delay can become a significant prob
lem. It is for these situations that the proposed scheme has been
optimised. At lower loads such a predictive scheme would not be
i r — i — i
Simple Admission Delay — Predictive Admission Delay
i
\
1 i
J /
k tf
i i
-
i i i i i i i

Call Admission Control for Disk Array Based Servers 217
required. It is also for this reason that the threshold for the predic
tive algorithm has been set to 7 0 % of the peak load for all the cases
considered here.
From these results it is clear that a significant benefit can be pro
vided by the predictive call admission control scheme in situations
where interactivity is not allowed and predictions are made with a
high degree of accuracy. As already discussed, interactivity will per
turb the accuracy of load prediction, but will also allow different
admission constraints to be supported for admission and interactiv
ity requests. The performance of the predictive admission scheme in
interactive video servers is considered next.
6.5.2 Interactivity Delay
In this section we make the assumption that interactivity requests
should be given a higher priority than admission requests. That is,
they should be admitted as soon as possible, whereas admission
requests may be queued for longer periods. The model of Figure 6.9
is used in the cases presented here.
One important input parameter is the frequency of user interaction.
It is clear that the amount of interaction is closely related to the con
tent of the video (educational material, for example, has been found
to be highly interactive [Bran96]). For the cases considered here we
initially assume an entertainment style video-on-demand applica
tion. From an informal survey of movie-style video viewers we have
chosen an initial figure of 2 5 % interactivity. This figure implies that
a quarter of all viewers will (on average) interact (FF/REW, pause
etc.) once during a movie. Sensitivity of the scheme to this assump
tion will be discussed later.
As has already been discussed, the values of 8: input into the pre
dictive CAC algorithm significantly affects the performance of the
scheme. In the case where interactive requests are being separately
admitted via a second instance of the predictive CAC (with a different

Call Admission Control for Disk Array Based Servers 218
value of 52), the effect becomes somewhat different. Figure 6.13
shows the delay of admission and interactivity requests versus b1
(and for a range of values of 82) for the same server parameters as
above. Note that m e a n values are shown, but 95th percentiles dis
play almost identical trends.
30
25
20
Mean Admission Delay
10
— —
X
o
*
Delta2=0
Delta2=1
Delta2=2
Delta2=3
Delta2=4
Delta2=5
_J L_
0.5 1.5 2.5 Deltal
3 3.5 4.5
30
>
25c
20
», §M5 CD
o >
10
5
>. 1 - .
=. =s
1
• • • m •...
- m-~
'
-5...
•••s-..
-=-m-=-i
Mean
"••x-.
• - • = :
'
Interactivity Delay
''' • • M- •.. "•••M-....
•-I..
'••••x.
'S-..
1 •
1
"5
i i
Delta2=0
Delta2=1
Delta2=2
x 0felta2=3;
o Delta2=4"
* Delta2=5
i i i
-
. • a
'•<>
"
0.5 1.5 2 2.5 3 Deltal
3.5 4.5
Figure 6.13 Mean admission and interactivity delays for various values of utilisation and a range of values of 81 and 82
The general observation from the figure is that as §i increases,
admission delay increases, while interactivity delay decreases. This

Call Admission Control for Disk Array Based Servers 219
can be explained as follows. Small values of 8X reduce the perceived
benefit of delaying a call admission request. As such, when 8i=0, the
predictive scheme reverts to the simple CAC scheme for admission
requests. As bl increases, the likelihood of delaying a call admission
request to improve load balance increases. At the right hand edge of
the graphs, load balance is essentially perfect at all times, at the cost
of significantly higher admission delays. This perfect load balance
does, however, have the desirable consequence that interactivity
requests can now be handled with minimum delay.
From the graphs it is also clear that 82 has the opposite effect to 8x-
In other words, for low values of 82, interactivity delay is minimised
while high values minimise admission delay. Note, however, that
increasing 82 generally increases interactivity delay more than it
decreases admission delay. This is due primarily to the fact that
there are fewer interactivity requests than admission requests. For
this reason, we consider cases where 82=0 for the remainder of the
case studies presented here. This is chosen because it minimises
interactivity delay at a cost of only slightly higher admission delay. It
should be noted that for a given set of system requirements the
choice of 82 must be investigated as 82=0 may not be optimal.
Fixing 82=0, it is clear that a system designer is able to vary the 8X
parameter in order to trade admission delay against interactivity
delay. Low values of 8X rninimise admission delays at a cost of higher
interactivity delays, while high values of 8: have the opposite effect.
Selecting the appropriate value of 8X will depend on customer
requirements, the content of the video being served, the degree of
interactivity and the load on the system. Consideration of some of
these factors is presented in a case study in Chapter 7. In the follow
ing studies, a value of 81 =2.5 is selected as a reasonable trade-off of
admission delay versus interactivity delay. This gives a decrease in
interactivity delay for only a modest increase in admission delay as
shown in Figure 6.13.

Call Admission Control for Disk Array Based Servers 220
Next we consider how these delays vary with system load. The curves
of Figure 6.14 show the 95th percentile of admission and interactiv
ity delay for the predictive scheme as well as the same delays for the
simple admission scheme. Note that the delays for admissions and
interactions are identical under the simple scheme since both are
admitted as soon as possible.
50 p
45-
40-
35-
30-
JT25-Q
20-
15-
10-
5-
o> 60
Figure 6.14 95th percentile admission and interactivity delays for simple and predictive admission schemes (81=2.5, 82=0)
The results shown in Figure 6.14 are very encouraging. It is
observed that the predictive scheme maintains lower interactivity
delays than the simple scheme at the expense of an increase in
admission delay for moderate loads. At very high loads both admis
sion and interactivity delays of the predictive scheme are below
those of the simple scheme. Note, once again, that the sudden
increase in the admission delay of the predictive scheme at 70% load
is due to the threshold being set to 70% which results in the sudden
rise as requests begin to be delayed if the load balance is poor. As
load continues to increase, this delay levels out as the algorithm
v i l l i
Simple Admission/Interactivity Delay Predictive Admission Delay
— Predictive Interactivity Delay
X ^
1 1 1 1 1
[ 1
.31' " IE*** /
^ / -Z
i
if ill '/ ' y r
r "A- ' ' / '
1
f f 1
I '" '/' 7 '
// J 1
I 65 70 75 80 85 Utilisation (%)
90 95 100

Call Admission Control for Disk Array Based Servers 221
maintains a good load balance, before continuing to rise as load
approaches 100%.
All of the results to date have assumed an array of 100 disks with
each disk serving 10 streams. In order to complete the case studies
presented here, the sensitivity of the results to each of these param
eters will now be discussed. For large interactive video servers, disk
arrays consisting of 100 disks with each disk serving 10 real-time
streams seem reasonable within the near future. It is clear however,
that such assumptions will not always hold, dependent on a range of
other factors. The results shown in the following graphs vary the
number of disks in the array and the number of streams being
served by each disk.
6.5.3 Effect of Streams per Disk
This section considers a fixed array size of 50 disks and varies the
number of streams that a single disk can service. Such a variation
could be due to a different coding rate (audio files, for example will
have a lower bit rate than video), or differences in the characteristics
of the disk drives being used. In the cases studied here the number
of streams served per device is varied from 2 to 50 streams. Interac
tivity rate is again assumed to be 2 5 % and results for mean and
95th percentiles of admission and interactivity delays are shown for
a utilisation level of 9 0 % (Figure 6.15). Results for other utilisations
are shown in Appendix B and are similar to those shown here.
From the admission delay graphs of Figure 6.15 it is observed that
at low values of 8i, smaller delays are possible as the number of
streams per disk increases. This is also true for interactivity delays4.
This result is expected, since a multiplexing advantage is gained as
array capacity increases. Notice also that the effect of 8x is similar in
each case although admission delay increases more rapidly with 8X
as the number of streams per disk increases. This is due to the dif
ferencing nature of the benefit calculation in the predictive CAC
4. Note that the vertical scale on the interactivity delay graphs differs from that on
the call admission delay graphs.

Call Admission Control for Disk Array Based Servers 222
Mean Admission Delay Mean Interactivity Delay '
2 streams
5 streams
10 streams
o 20 streams
x 50 streams
: 5 * -2 =
.••'V" .-'':r~
1 />'
1^
'
(1)
Q
-I-I-i-I-
'*-*-i-I-I-,
2 streams
- - 5 stfoams
— 10 streams
o 20 streams
x 50 streams
I-i-T-I---r--K. I--.J....
• I - -I--.*-
S ••:.'.'.•.«.•.•.•••••*.'
3.5
Deltal
95pc Admission Delay Deltal
95pc Interactivity Delay
_
\-*
;-.—I-
t at
• **
--I--
—f-;:-::*;"
-I--
-I--*'
. ' ^
;**""
. . - • ;
X--'"...--::!
-ir"'^
2 streams
— 5 streams
10 streams
o 20 streams
x 50 streams
,
;-!-*..
-I—-3E- ^ ~ ^ ^ -
I-I-I-.:
2 streams
— 5 streams
10 streams
o 20 streams
x 50 streams
^
-I-.-f.-J.. £~I"
K-t--i--fl
Deltal Deltal
Figure 6.15 Admission and interactivity delays for a variety of streams served per disk
algorithm; and as such 8X must be selected based on the number of
streams served by each disk. As 8} increases, call admission delay
increases, while interactivity delay decreases. In this case the
decrease in interactivity delay is modest, but as will be shown later,
this is improved in situations with more disks in the array and lower
rates of interactivity.
6.5.4 Effect of Disks per Array
The number of disks per array will depend on availability require
ments, throughput requirements and system architecture. As has
already been shown, large arrays are less reliable but have a consid
erable multiplexing advantage over smaller arrays. In this section
the effect of array size on the C A C scheme is considered. Mean
admission and interactivity delays as well as the 95th percentiles of
these delays are shown in Figure 6.16.

Call Admission Control for Disk Array Based Servers 223
Mean Admission Delay
CD
•
•
lOdsks
- - 20 disks
— -50 disks
o 100 disks
x 200 disks
•
i . r""
A'\ -_-=..-^*
:-i^l^ • . 0.5 1 1.5 2 2.5 3 3.5
Deltal
95pc Admission Delay
ra 6o.
— 10 disks
- - 20 disks
- -50dsks
o 100 disks
x 200 disks
^ ^ = 5 ^ 2 2 5 ^ 1 = ^
2.5
Deltal
<u Q
Mean Interactivity Delay
1, —I-.
^1,
- 10 diske
20 disks
O 100 disks
x 200 disks
b+**i i—-^N-nE—j—=E-
•i--.-
Deltal
95pc Interactivity Delay
3.5 4 4.5 5
0 0.5 1 1.5 2 2.5 3 3.5 4 4.5 5
Figure 6.16 Admission and interactivity delays for a variety of disks per array
The initial observation is that call admission delay increases as
array size increases. This is counter-intuitive to the idea that large
arrays improve the statistical multiplexing of calls and as such can
give a lower delay for the same utilisation. In fact, it is the blocking
policy employed by the server that leads to this result. As shown in
Figure 6.10 blocking probability of a disk array based server is accu
rately modelled by the Erlang-B formula. This model relies on the
customers tolerating delays up to one full service cycle without being
blocked (or reneging). As such the assumed delay tolerance is
directly proportional to the number of disks in the array. In arrays
with fewer disks, this assumed tolerance is correspondingly less and
so blocking probability is increased. This increased blocking proba
bility is what actually leads to the lower admission delays seen for
smaller arrays in the figure. It should be noted that the delay toler
ance of an actual user will, of course, not change depending on the
number of disks in the array. For a given array size however, the
assumption that one full cycle of delay will be tolerated is reasonable
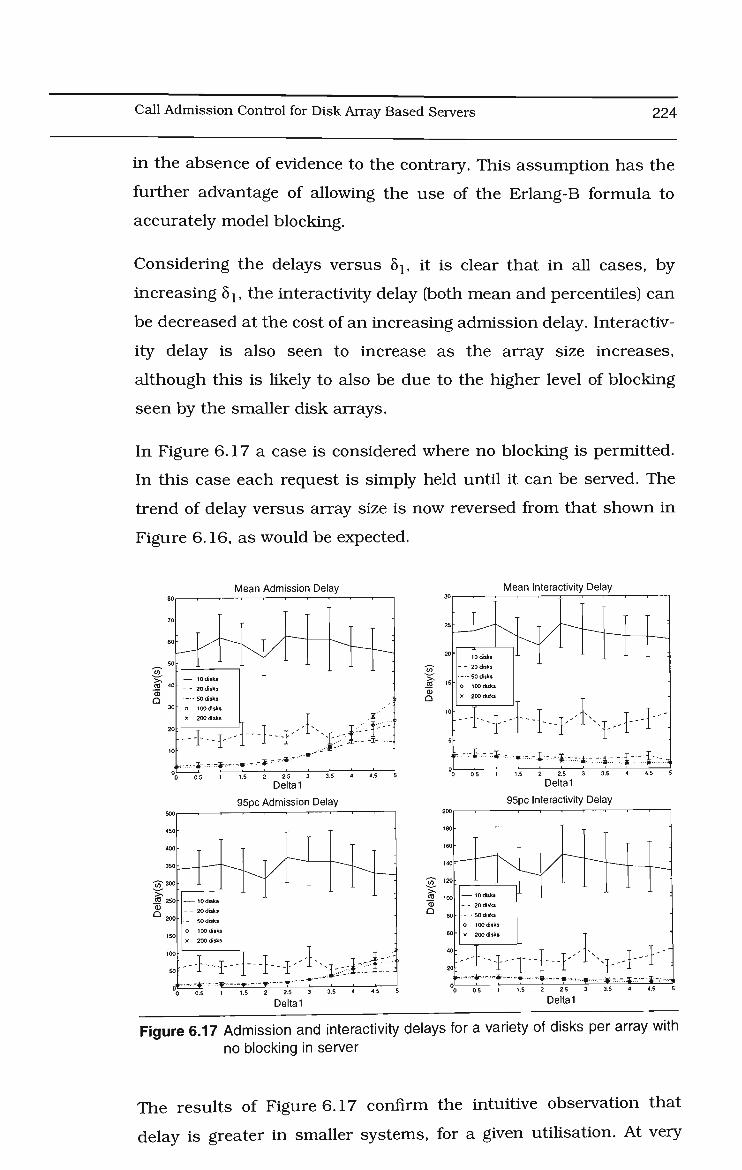
Call Admission Control for Disk Array Based Servers 224
in the absence of evidence to the contrary. This assumption has the
further advantage of allowing the use of the Erlang-B formula to
accurately model blocking.
Considering the delays versus 81, it is clear that in all cases, by
increasing 81, the interactivity delay (both mean and percentiles) can
be decreased at the cost of an increasing admission delay. Interactiv
ity delay is also seen to increase as the array size increases,
although this is likely to also be due to the higher level of blocking
seen by the smaller disk arrays.
In Figure 6.17 a case is considered where no blocking is permitted.
In this case each request is simply held until it can be served. The
trend of delay versus array size is now reversed from that shown in
Figure 6.16, as would be expected.
Mean Admission Delay Mean Interactivity Delay
95pc Admission Delay 95pc Interactivity Delay
Figure 6.17 Admission and interactivity delays for a variety of disks per array with no blocking in server
The results of Figure 6.17 confirm the intuitive observation that
delay is greater in smaller systems, for a given utilisation. At very

Call Admission Control for Disk Array Based Servers 225
high utilisation in small systems, the queuing delay for admitting a
new request becomes very large. This queueing also leads to a delay
difference between admission and interactivity delays even for the
simple CAC scheme (8X=0). Since interactivity requests are treated
with higher priority than admission requests, all the interactivity
requests will be served to disks where possible before admission
requests are served. When there are no further interactivity requests
pending for a given disk, any admission requests requiring that disk
will be admitted to fill any available space. In the larger systems con
sidered thus far, the amount of queueing of requests has been small
and so for the simple CAC scheme the delay for interactivity and
admission has been identical.
It should further be noted that for the small systems in Figure 6.17
that the large amount of queuing occurring leads to a reduction in
the benefit of the predictive CAC scheme. In other words the value of
81 has very little effect on either admission or interactivity delays in
these cases. Since the array is commonly fully loaded, and interac
tion requests are always served as soon as possible, the benefit of
mamtaining a balanced load is negligible. As the number of disks
increases, however, the effect of queuing is reduced and the influ
ence of 81 is restored.
6.5.5 Effect of Level of Interactivity
All the results to date have assumed an interactivity rate of 25%.
Recalling that each interaction results in two requests to the server
(one to commence and one to conclude interaction) this implies that
1/3 of requests reaching the video server are either for commence
ment or conclusion of interactive actions5. Although it is difficult to
ascertain the accuracy of this assumption, it is clear that it will vary
dependent on the specific application. As such it is important to con
sider the effect that interactivity rates have on the effectiveness of
the schemes proposed here. - Interactivity Rate _ 0.25x2 _ 1
Interactivity Rate + Admission Rate 0.25 x 2 + 1 3

Call Admission Control for Disk Array Based Servers 226
Figure 6.18 shows the admission and interactivity delays versus 8:
for a range of interactivities. Note that interactivity rates greater
than 1 0 0 % imply that each user interacts several times during a
movie.
Mean Admission Delay
— Interactivity 0 %
- Interactivity 5 %
— Interactivity 2 5 %
Interactivity 1 0 0 %
Interactivity 5 0 0 %
2.5
-5T 2
¥ CD
Q 1.6
1
t- "ii - ^,
Mean
"- T vs ;;;.v.. -
Interactivity Delay
— • Interactivity 5 %
Interactivity 2 5 %
x Interactivity 5 0 0 %
-1' nH Deltal
95pc Admission Delay Deltal
95pc Interactivity Delay
05
0)
Q
Interactivity 0 %
Interactivity 5 %
Interactivity 2 5 %
Interactivity 1 0 0 %
x Interactivity 5 0 0 %
••I :"k
Q
Interactivity 5 %
- Interactivity 2 5 %
Interactivity 1 0 0 %
Interactivity 5 0 0 %
•i- i i i
HI i h
Deltal Deltal
Figure 6.18 Admission and interactivity delays versus b~i for various levels of interactivity.
For the graphs shown, the system utilisation is 90% although the
results are representative of those obtained for other utilisations.
From the figure, several observations can be made. First, the call-
admission delay generally increases with 8i as the C A C procedure
attempts to improve the system load-balance. The exception to this
is for an interactivity rate of 0, w h e n the m i n i m u m call admission
delay (in terms of m e a n and 95th percentile) actually occurs for a 8j
value of about 1.5. This result corresponds with that obtained in
Table 6.1. As interactivity rate increases, however, the call admis
sion delay increases with bx. For very high rates of the interactivity
the increase in call-admission delay is very severe. This is easily
explained w h e n it is considered that for an interactivity rate of

Call Admission Control for Disk Array Based Servers 227
500%, 10 interactivity requests are being received for every one
admission request (since interactivity requires messages for both
commencement and completion). As such, the predictive C A C
scheme incurs very long delays while attempting to improve the load
balance of the system; an effort which is severely hindered by the
large number of interactivity requests.
The graphs of interactivity delay reveal that as interactivity rate
increases, the benefits obtained from the predictive C A C scheme
decrease. The decrease in interactivity delay is greatest for the case
with the lowest rate of interactivity (ie. the dashed line, where inter
activity is just 5%). W h e n interactivity increases to a rate of 500%,
the improvement gained by the predictive C A C scheme is marginal
especially considering the required increase in call-admission delay
to obtain this benefit.
It is clear that the predictive C A C scheme gives most significant
advantages in systems which support low-levels of interactivity.
Entertainment video-on-demand systems would generally fit into
this category, while educational systems would not. Depending upon
the required system delay characteristics, however, it would be pos
sible to modify the predictive C A C scheme to provide a satisfactory
trade-off between admission and interactivity delay for a given appli
cation. The comparison presented here considers the simplest case,
where interactivity requests must always be admitted with the high
est-priority. It is likely that depending upon the type of interaction
required, some requests (eg. pause/resume) may tolerate a longer
delay than others (eg. FF/REW). Such a multiple priority scheme
could be easily implemented merely by assigning a suitable value of
8 to each request depending upon its priority. Highest priority
requests would receive a 8^0, while less time-critical requests
would receive increasing values of 0l. This extension to the predic
tive C A C scheme is not considered further in this thesis.

Call Admission Control for Disk Array Based Servers 228
6.6 Conclusion
This chapter has introduced a novel call admission policy specifically
for use in disk array based video servers. Using the serm-determinis-
tic nature of coarse-grained disk arrays, it is possible to predict the
future load on a given disk in an array. A new call request can then
be delayed if it is deemed that there is sufficient benefit (in terms of
improving load balance) to do so. It has been shown that such a
scheme results in a reduced mean and upper percentiles of admis
sion delay for non-interactive systems.
When interactivity is permitted, the predictions made earlier regard
ing future load will be affected. It has been shown that for reasona
ble levels of interaction the predictive scheme still performs well, and
provides an efficient mechanism for differentiating between admis
sion and interactivity requests and treating them appropriately. By
variation of a single parameter (8) it is possible to trade admission
delay against interactivity delay depending upon user requirements.
One important assumption that requires further consideration is
that of frequency and nature of interactivity. It is currently uncertain
exactly h ow viewers will interact with video objects and how fre
quently this interaction will take place. The results presented here
assume "movie" style video objects and a corresponding low interac
tivity rate. It is clear that other applications (eg. educational, home-
shopping) can expect higher demands for interactivity, and that this
increase will have a detrimental effect on the performance of the pre
dictive C A C scheme.
Throughout this chapter a number of aspects areas have been iden
tified as requiring further study. Specifically:
• Rigorous (analytic) methods for selecting 8lt 82 and the activation
threshold for the predictive C A C scheme, given particular delay
constraints.
• Detailed study of the predictive C A C scheme under different inter
activity implementations.

Call Admission Control for Disk Array Based Servers 229
• Determining lower bounds on the optimal performance of any
CAC scheme.
The scheme presented here is, however, unique in that it provides a
simple way of improving load balance in a disk array. This improve
ment has been shown to lead to reduced admission and interactivity
delays, particularly at high loads. This scheme has the significant
advantage that no additional server resources are required. Other
attempts at solving a similar problem have required additional buff
ering which would incur considerable cost [Vin94b].

Case Study: Interactive Video Network Design 230
7. Case Study: Interactive Video Network Design
It's not enough to be busy. The question is: What are we busy about?
- Henry David Thoreau
7.1 Introduction
This chapter utilises the results from the earlier chapters to provide
an example design for a realistic interactive video network scenario.
In the literature to date, the author has not seen a complete interac
tive video network design study. Previous work has dealt with a sub
set of the overall problem, but rarely with reference to other aspects,
as discussed in Chapter 2. Although little new material is presented
in this chapter the overall design methodology is a significant contri
bution in itself. A detailed case study is used to illustrate the design
methodology in detail.
The design methodology presented here is only one of a number of
possible approaches. The method used here is, however, a logical
one based on the likely set of parameters that a designer will have to
deal with. It is common for an engineering design process to be iter
ative, with the results of a first pass being fed back in to the process
to provide further refinements [Cros94]. Our method is no exception
to this rule and as always, human experience and skills will
undoubtedly prove invaluable in the design of such systems. The
tools presented in earlier chapters and utilised here, however, pro-

Case Study: Interactive Video Network Design 231
vide the system designer with a powerful starting point for such
design undertakings.
7.2 Design Methodology
As already mentioned most design procedures are iterative. That is,
an initial design will be completed based on a set of assumptions,
and the results of this will feed back into the design process result
ing in some changes to the assumptions and in turn an improved
design. Although such iteration is necessary, its use is mmimised by
applying a logical design procedure throughout. In this section we
present a flowchart for design of interactive video systems that uti
lises much of the work presented in this thesis in creating a logical
and ordered design procedure.
The flow chart of the design process proposed here is shown in
Figure 7.1. Note that this flowchart follows the same top-down
approach to the problem that has provided the structure for this dis
sertation. The problem is initially considered at the network level,
before considering individual servers, disk arrays and finally single
video objects. This top-down approach is a standard engineering
technique which can be applied to all manner of design problems.
The inputs to each stage of the process are shown on the left of the
figure while outputs from each stage are shown on the right.
Although not shown explicitly a large number of outputs flow from
one stage to the next to be utilised in more detailed aspects of the
design. It is only the final outputs that are shown on the right hand
side. As with many design procedures it is possible that in some
cases the inputs shown here would actually be the desired outputs
of the design process or vice versa. This fact is easily incorporated
into the design procedure shown.
Rather than discussing each of the blocks of Figure 7.1 in an
abstract sense the remainder of this chapter provides more detail by

Case Study: Interactive Video Network Design 232
Inputs
•Geography •Feasible network topologies
•Object statistics ^ \ .
•Availability constraints •Architectural constraints
•Disk reliability data ^ - ^ •Repair times
•Disk Characteristics (seek times etc.) " \ ^
•Blocking constraints •Admission delay constraints •Interactivity delay constraints
•Individual object specifications
•C
Server Placement
Outputs
• . 'Server locations " .r̂ not Pctimato
3erformabilit} Analysis
v Throughput Analysis
\
Blocking or C A C Analysis
v Disk Size Selection
v SSBF Object Packing
T omplete desi •System cost
(•Repair times)
•Buffer size
•Disk capacity
gn
Note that the functions in the shaded blocks must be performed separately for each server.
Figure 7.1 Top-down design procedure for interactive video networks

Case Study: Interactive Video Network Design 233
way of a fully worked design example. The next section commences
the design by describing the basic scenario and outlining the pri
mary design constraints.
7.3 Scenario Description and Constraints
In this case study we assume that a designer is charged with creat
ing an interactive video system to serve a large customer population.
The system will be required to support entertainment style movie-
on-demand applications with the ability to upgrade to other applica
tions in the future. A number of constraints have been placed on the
design problem and are outlined in Table 7.1. The parameters
assumed for the design are shown in Table 7.2 These constraints
and parameters will be discussed in more detail as they arise in the
design process.
Table 7.1 Constraints for the design example.
Constraint
Customers
Local Exchanges
Video Objects
Availability
Blocking probability
Mean Admission Delay
95pc Admission Delay
Mean Interactivity Delay
95pc Interactivity Delay
MTTR(l)
MTTR(F)
Description
Total number of customers
The current number of local exchanges in place
The total number of movies to be stored
The long-term availability of a given server
The probability of a given call being rejected to due lack of resources at the
server
The mean delay for call admission
The 95th percentile of admission delay
The mean delay for interactivity requests
The 95th percentile of interactivity delay
MTTR of a single disk failure (= l/\i)
MTTR of a complete array failure (= 1 /\i')
Value
60,000
6
1,000
99.5%
0.1%
2.5 sec
5 sec
1 sec
3 sec
48 hours
168 hours

Case Study: Interactive Video Network Design 234
Table 7.2 Parameters used for the design example.
Parameter
MTTF
Object Popularity
Disk Cost
CT
ti
t2
KB
RI
P
Description
MTTF of a single disk drive (= l/Xs)
The distribution of requests to individual movie titles
Model relating disk cost to capacity
Capacity of a disk track
See Equation 4.2
See Equation 4.2
Cost of buffering
Stream rate
Proportion of reward earned by a RAID 5 in a partially failed state
Value
200,000 hours
Empirical (Equation 3.8)
P = K2C + KX
P = 0.275C+188
(Equation 3.5)
51,000 bytes
0.0152 seconds
0.0167 seconds
$50 / M B
375,000 bytes/sec
0.765 (from Figure 4.7)
7.4 Network Design and Cost Estimate
In this example it is assumed that the total customer population is
connected to the core network via six local exchanges in the existing
POTS network - 10,000 connections per exchange. It clearly makes
economic sense to utilise the physical locations of these local
exchanges as front-end servers for the interactive video network.
Assuming a peak activity rate of 4 0 % (see Figure 4.7) this equates to
a busy hour load of 4,000 streams per FES. Now, given the object
popularity model developed in Chapter 3, it is known that a knee
exists at about 60 movies which will account for approximately 8 5 %
of all requests, and that caching this level of requests rninimises
overall system costs (see Chapter 3). This implies that a FES will
serve 3,400 streams (peak) by storing just 60 objects. The total over
flow traffic (those requests not able to be served from the cache) from
all FES's will thus be about 3,600 streams during busy hour. It is
reasonable to expect that these streams could be adequately served
by a single video server located in the core network storing all 1,000
objects.

Case Study: Interactive Video Network Design 235
Note that the above network level analysis is deliberately approxi
mate. It is intended to give an overall picture of the network design
based on a small amount of input data. The details of the design are
refined during the next stages and the results of this section can be
iteratively altered as required. From this basic network design, how
ever, it is possible to determine a cost estimate for the system based
on the methods presented in Chapter 3. We reiterate that this cost
estimate is for storage only and does not include bandwidth or main
tenance costs. The results of this cost estimate are shown in
Table 7.3.
7.5 Performability Analysis
Given a high-level view of server placement and dimensioning it is
now possible to design the storage subsystem of each of the individ
ual servers. Each server will consist of several disk arrays with each
array made up of a number of disk drives. In this section it is
assumed that a certain minimum system availability will be speci
fied, and this will be used to constrain the maximum number of
disks in the array. It should be further noted that architectural con
siderations dependent on current disk array and interconnection
technologies may place a tighter constraint on array size than that
determined by the availability requirement.
Availability is denned here as the percentage of time during which
the server is able to serve a full complement of requests. This can be
directly equated to the performability measure of reward earned as a
percentage of available reward over a given mission time. The
assumption of an availability requirement of 99.5% implies that over
a long time period, the server should be "up" for a proportion of time
that is sufficient to enable it to serve that percentage of the requests.
Of course, as seen in chapter 4, a RAID 5 based server actually oper
ates in one of 3 states, meaning it cannot be considered as merely
"up" or "down" at any time. The performability model developed in

Case Study: Interactive Video Network Design 236
Chapter 4, however, allows us to account for this in the availability
analysis. Appendix C derives Equation 7.1 as an upper limit for the
number of disks per array.
D< -b + Jb -4ac 2a
a = AX2s
where b = 2AXs\i' - AX2S - Xs[i' - pXs\i' (E9n 7A)
c = Xs\y' + A n n ' - \i\y' - AXs\x.'
For the values assumed here, this equation results in an upper limit
of 73 disks for each array.
7.6 Throughput Analysis
This phase of the design process determines the throughput that a
disk array of the size already determined can maintain. The inputs
to this phase include the detailed disk parameters (seek time, rota
tional speed, capacity of each track etc.), the disk cost model and the
stream rate of the video objects stored (see Table 7.2). Buffer size per
stream can be an input or can be calculated so as to rninimise total
system cost by using Equation 4.20 (reproduced here).
KiR,t9
" • - J - T E T <Eqn7-2) The corresponding throughput obtained from a RAID 5 disk array is
obtained from (Equation 4.6):
Rti = M (E 7.3) K5 {B5/CT)t1 + t2
which results in a sustainable throughput of 512 streams for each
73 disk array, and a buffer size of 204 kbytes per stream (rounded to
the nearest whole disk track).

Case Study: Interactive Video Network Design 237
7.7 Blocking and CAC Analysis
Given the "raw" throughput that can be sustained by an array, this
phase of the design procedure sets a limit on the number of streams
to be assigned to the array such that a given blocking probability or
admission or interactivity delay constraint can be ensured. The limit
placed on the number of streams to be served by the array as a
result of these constraints is termed the "effective bandwidth" of the
array. The effective bandwidth is determined by initially setting it to
be equal to the raw bandwidth and then considering each constraint
in turn and successively marking down the previous value of effec
tive bandwidth until all constraints are met. Once again an iterative
process may be desirable if certain constraints are easily met while
others are not.
First, consider blocking probability. Chapter 6 showed that blocking
probability of a large disk array can be accurately modelled by
Erlang's B formula, under the assumption that customers will be
willing to wait for one full service round of the array. If customers are
willing to wait longer (and the server permits this), then this forms a
worst case bound on blocking probability, which is desirable from a
designers point of view. Utilising the Erlang B formula (Equation 5.8)
it is determined that the upper limit of utilisation for a server capa
ble of serving 512 streams is 9 0 % or a maximum busy-hour load of
460 streams to ensure a maximum blocking probability of 0.1%.
Deterrriining the limits of admission and interactivity delay require
more careful consideration, due to the complex nature of the rela
tionship between these two delays and the 5 values of the predictive
CAC scheme. From the results of Chapter 6 we are able to define
contour plots that give feasible regions of operation given particular
delay constraints. Appendix C uses this method to determine that
the maximum utilisation which meets the delay constraints of
Table 7.1 is 88%, and that 5!=1.8 and 52=0 achieves the required
delays at this utilisation. As such the raw bandwidth of 512 streams

Case Study: Interactive Video Network Design 238
must be further marked down to an effective bandwidth of just 450
streams. This result can now be used as an input into the final stage
of the design process which selects disk capacity and actually allo
cates objects to disk arrays.
7.8 Disk Size Selection and Object Packing
All of the previous results apply to both the FES and VS design. In
this section it is necessary to consider the disk size selection and
object packings separately for the FES and VS.
7.8.1 Front-End Server
Given that each FES must cater to a peak load of 3,400 streams and
a single array can support a load of 450 streams, it is clear that:
3400 450
= 8 (Eqn 7.4)
disk arrays will be required. Storage required for 60 movies (at 100
minutes each, including trailers etc.) will be:
60 movies x 375, 000 bytes/sec x 100 min x 60 secs/min = 135 G B (Eqn 7.5)
and since this storage will be provided by a total of 584 disks (8
arrays of 73 disks each), the required storage per disk is given by:
135 GB = 231 MB/disk (Eqn 7.6) 584 disks
Although by modern standards such a disk capacity requirement is
small, such drives are still available and can be shown to fit the cost
model presented in Chapter 3. Indeed the Maxtor 7273A is a 270MB
drive with almost identical performance characteristics to those
assumed for this study1. If this drive is selected it will actually pro
vide slightly more capacity than the 231MB required which will (ide
ally) allow the FES to store several additional movies over the 60 that
1 It is important to ensure that the selected drive does match the assumed performance characteristics, if not the appropriate steps of the design procedure should be repeated with the appropriate values for the disk drive selected.

Case Study: Interactive Video Network Design 239
were initially specified. The extra "slots" will ensure that the caching
algorithms are efficient enough to ensure that the FES does serve
8 5 % of requests as was originally assumed. The results of the object
packing are shown in Appendix C, where it is demonstrated that
SSBF consistently meets the lower bound of 8 arrays while other
heuristics require 10 or more arrays.
7.8.2 Core Video Server
Given that the core video server will be required to serve 3,600
streams and store 1,000 objects the disk requirement and packing
problem will be considerably different to that of the FES. Using a
similar method to that in Section 7.8.1 the minimum number of
arrays required can be determined to be 8 and the required disk
capacity is determined to be 3.85GB. This drive capacity is clearly
much larger than that required in the FES. This is due to the much
smaller bandwidth to space ratio required in the core video server. A
much larger number of objects is now being stored, while not serving
a significantly greater number of streams. Once again, however, the
required disk capacity is well within the range of available devices
and a Seagate 15150W would be suitable choice with a capacity of
4.1GB and similar performance characteristics to those assumed
above. The results of the object packing are shown in Appendix C
(Section C.4.2) where the minimum number of bins required is
shown to be 9, once again obtained by the SSBF heuristic.
Following the packing of the FES and VS with video objects the sys
tem design is complete and the total storage cost can now be accu
rately determined. Assuming that each FES has the same design the
cost of each one can be determined from:
FES Cost = 8 arrays x 73 disks/array x (200 + 0.273 x 280) ^
= $160,950.40
Similarly, the core VS storage cost is easily determined from:

Case Study: Interactive Video Network Design 240
VS Cost = 9 arrays x 73 disks/array x (200 + 4.1 x 280)
= $885, 636 (Eqn 7.8)
and the total storage cost of the entire system is obtained by adding
the costs of 6 FES's and a single VS:
Total Cost = 885, 636 + (6 x 160, 950.40)
= $1,851,338.40 (Eqn 7.9)
This total system cost is seen to be about 10% more expensive than
that obtained by the cost estimate in Section 7.4. This increase can
be primarily attributed to the requirement for 9 arrays for the VS
rather than the 8 originally indicated by the lower bound. Despite
this aberration, the two costs are in generally good agreement, as are
the cost estimates for the FES and VS components individually.
Table 7.3 Primary results of the design example.
Result
Maximum Array Size
Required Buffer Size (per stream)
Raw Array Bandwidth
Effective Array Bandwidth
Predictive CAC 5j
Predictive CAC 82
FES Disk Capacity
Suitable FES Disk Model
FES Cost Estimate
Actual FES Cost
VS Disk Capacity
Suitable VS Disk Model
VS Cost Estimate
Actual VS Cost
System Cost Estimate
Actual System Cost
Discrepancy between Cost Estimate and Actual System Cost
Value
73 disks
204 kbytes
512 streams
450 streams
1.8
0
230 M B
Maxtor 7273A
$159,830
$160,950
3.85 GB
Seagate 15150W
$718,610
$885,636
$1,677,590
$1,851,338
10.3%

Case Study: Interactive Video Network Design 241
This completes the design process. Table 7.3 shows a summary of
the results obtained. A system designer is, of course, free to examine
the effect of various constraints and loosen or tighten them to deter
mine the sensitivity of the system design. The systematic method
outlined here is particularly amenable to such iteration and the
design presented here could probably be further optimised by relax
ation of just a few of the constraints listed in Table 7.1
7.9 Conclusion
Although not particularly exhaustive, this case study has completed
an entire system design using the tools developed in this thesis.
Importantly, it has been demonstrated that the cost function devel
oped in Chapter 3 provides reasonably accurate cost estimates with
out the need for a detailed design. Provided that this cost estimate is
acceptable, the detailed design can proceed in a logical and system
atic fashion to determine an overall system specification. By follow
ing this methodology, a system designer can be confident that the
resulting design will satisfy a given set of quality-of-service con
straints and will operate efficiently and at minimal cost.
The example presented here has been intentionally simplified in a
number of ways. The aim has not been to account for every factor
that may influence a system implementation. Instead the goal has
been to demonstrate the application of tools developed throughout
this dissertation. The result of this demonstration has been a top-
down design methodology that utilises the work of the previous
chapters in a logical and modular fashion. Each stage of the process
produces outputs that either form inputs to the next stage or define
part of the final system design.
The methodology presented here is the only attempt to present a
unified design approach to interactive video systems that this author
has encountered. Previous work has solved parts of the problem or

Case Study: Interactive Video Network Design 242
taken a high-level view to develop cost estimates but without resolv
ing sufficient detail to be classified as a complete system design
[Doga95] |Tetz94]. The approach presented here (and summarised in
Figure 7.1) makes a significant contribution by providing designers
with a powerful system from which to base any large-scale design.

Conclusion
8. Conclusion
This morning I took out a comma and this afternoon I put it in again.
- Oscar Wilde
8.1 Overview
Interactive video services are likely to form the basis for a range of
exciting new telecommunications applications. For this reason,
recent years have seen a continuing increase in research efforts ded
icated to the provision of these services in an efficient manner. While
some of the many problems now have good solutions, several are
still poorly defined or inadequately dealt with by existing methods.
This dissertation has identified several key areas of interest and pro
vided analysis and design methods suitable for solving some of the
problems. Specifically, the following areas have been examined in
detail:
• Network design and storage placement.
• Performance and reliability of disk array storage subsystems.
• The allocation of objects to individual disk arrays.
• Call admission control schemes to minimise load imbalance in the
disk array.
• Design methods for large scale interactive video systems.

Conclusion 244
Throughout the dissertation, video-on-demand (VOD) has been used
as a representative application of interactive video services. Where
detailed input parameters have been required, they have been taken
from the V O D application wherever possible. Recent market
research indicates that V O D will at least initially be the dominant
application using interactive video services. This fact combined with
the availability of useful data from video rental stores and the movie
industry, makes V O D the most suitable candidate for the case stud
ies presented here.
The following sections highlight the major results obtained in each
part of the thesis.
8.2 Network Design
Previous cost analyses of interactive video networks have made sim
plifying assumptions with little justification with regards to the
nature of storage and network topologies. The analysis presented in
Chapter 3, however, derives a cost model based closely on a realisa
ble video server architecture. The assumption that storage costs are
dominant in servers allows the cost model to be based purely on
storage costs. The cost model derived is applied to distributed and
centralised storage systems using a VOD-type workload and it is
revealed that a distributed system (with storage located close to user
populations) results in reduced overall system costs. Importantly,
this result comes about without accounting for bandwidth savings
arising from a distributed approach. Previous work has shown that
such savings are also significant, resulting in further reduced oper
ating costs when storage is distributed to Front-End Servers. It
should be noted that although the methodology used here is unique,
the results obtained are in good agreement with existing studies.
The benefit of distributed storage is reliant upon the FES's storing
only the most popular titles. Caching algorithms are required to

Conclusion 245
ensure that this remains true as popularities change over time.
Chapter 3 develops several caching algorithms and demonstrates
that even though simplistic, they are sufficient to maintain good
cache currency, and ensure the cost effectiveness of the storage
located at the FES.
8.3 Server Design
Much research has focused on building high-performance video
servers using disk array technology. The reliability of these same
servers has, however, received little attention. It is generally
assumed that RAID mechanisms can be applied to these disk arrays
to ensure almost fault-free operation. Chapter 4 investigates this
issue in some detail and identifies the key trade-offs between the two
most commonly supported levels of RAID: 3 and 5. While RAID 5
arrays are less expensive for a given throughput, they degrade signif
icantly following a single disk failure. RAID 3 maintains the same
performance following a failure, but costs significantly more initially.
A performability model is employed to account for these factors and
several case studies are used to demonstrate the benefit of RAID 5
over RAID 3 in read-only video server applications.
8.4 Object Allocation
The problem of placing video objects (movies) onto disk arrays within
a server seems trivial. It is easy to show, however, that this problem
is in fact NP-hard. Further the problem can be identified as analo
gous to the two-dimensional vector packing (2DVP) problem. Previ
ous heuristics proposed for near-optimally solving this problem are
derived from the bin-packing First-Fit (FF) and First-Fit Decreasing
(FFD) heuristics. Unfortunately these heuristics can perform poorly
when the object dimensions are not uniformly distributed.

Conclusion 246
In the case of interactive video systems the object dimensions repre
sent bandwidth and capacity requirements and are not uniformly
distributed. The bandwidth dimension is heavily-skewed, while the
capacity dimension exhibits a Gamma-like distribution. To pack
such objects efficiently, a new heuristic - termed Same-Shape-Big
gest-First (SSBF) - is proposed. This heuristic is applied to a number
of case studies and shown to give significant improvements in terms
of packing efficiency at the negligible cost of increased execution
time.
8.5 Admission Control
Typical CAC schemes admit a new request provided only that it will
not exceed the upper limit of the resources available at the video
server. This can lead to significant load imbalance across a large
coarse-grained disk array. In turn, this imbalance results in high
delay variability for new requests as the system becomes heavily
loaded. Chapter 6 develops a predictive C A C scheme which utilises
load information from all disks in the array to determine when to
admit a new request. By selectively delaying certain requests, overall
delay can be reduced and delay variability reduced quite substan
tially. Importantly, no additional resources are required to provide
this benefit.
W h e n interactivity is permitted, the predictive scheme is further able
to differentiate between admission and interaction requests in order
to satisfy different delay requirements for each. For moderate levels
of interactivity, the predictive scheme maintains a good load balance
while also admitting interaction requests with lower delay than the
admission requests. The scheme proposed in Chapter 6 does require
further study with respect to different types and greater levels of
interaction. The results presented are, however, very promising, con
sidering they come at zero cost, since no additional resources are
required.

Conclusion 247
8.6 Design Methodology
Designing a large-scale interactive video system is clearly a signifi
cant undertaking. Without some logical methodology, a system
designer will be unlikely to produce an efficient and cost-effective
design. Chapter 7 presents an appropriate methodology making spe
cific use of the work presented in earlier chapters. While the method
presented does not represent a significant departure from traditional
design methods, it is the first complete design process that this
author has encountered. The method is iterative and allows a
designer to experiment with various options and to easily change
inputs and outputs of the process to assist in ensuring that the
resulting design will perform as required at rninirnurn cost.
8.7 Further Work
The majority of the results presented in this dissertation use video-
on-demand as a representative application for interactive video serv
ices. The important input parameters have been derived from limited
market research data and statistics from video rental stores. It is
somewhat unclear how closely the future V O D application will actu
ally m a p to these statistics. As such, an important area of future
work is related to characterising the workload that will be placed on
interactive video services. Such work will involve market research,
h u m a n factors research, trial systems and large-scale rollouts. With
accurate workload models for a range of interactive video applica
tions it will become possible to further refine the design and analysis
methods presented here.
With reference to the performability analysis of Chapter 4; the con
struction of large disk arrays using new high-bandwidth intercon
nection technologies still requires further study. Several groups are
investigating the use of A T M at the device level and it is this type of
technology that will allow the construction of very large, easily scala-

Conclusion 248
ble, disk arrays. To date, however, only small prototype systems
have been developed using this approach.
The predictive CAC scheme of Chapter 6 shows potential for provid
ing improved delay performance of disk array based video servers.
Several areas do, however, require further study. Specifically, analyt
ical models should be developed to facilitate the selection of appro
priate values of bl and 82 for a given set of user requirements.
Further, the predictive algorithm itself, may be able to be further
improved and lower bounds developed to prove the quality of such
an algorithm.
Most importantly, though, research is ongoing on each of the tech
nologies that make interactive video services possible. Storage, com
pression and networking technologies continue to improve. The
major future work is therefore related to the deployment and opera
tion of these systems. Although there is much still to be learned, this
cannot happen until a greater understanding of the systems is devel
oped. This understanding will only come about once the systems are
deployed to the public on a large-scale.

References 249
References
[Aldr96] R. P. Aldridge, M. Ghanbari, and D. E. Pearson. Exploiting the structure of MPEG-2 for statistically multiplexing video. In PCS '96 - International Picture Coding Symposium, volume 1, pages 111-116, Melbourne, Australia, March 1996.
[Alme96] Kevin C. Almeroth and Mostafa H. Ammar. The use of multicast delivery to provide a scalable and interactive video-on-demand service. IEEE Journal on Selected Areas in Communications, 14(6): 1110-1122, August 1996.
[Ano95] Excerpt: The return on investment from VOD. Communications International, 22(4), April 1995.
[Barn95a] Scott A. Barnett, Gary J. Anido, and H. W. P. Beadle. A storage cost analysis of video-on-demand architectures. In Australian Telecommunications Networks and Applications Conference, pages 219-224, 1995.
[Barn95b] Scott A. Barnett, Gary J. Anido, and H. W. Peter Beadle. Caching policies in a distributed video-on-demand system. In Australian Telecommunications Networks and Applications Conference 95, 1995.
[Barn96a] Scott A. Barnett and Gary J. Anido. A call admission control scheme for maintaining load balance in a disk array based video server. In Australian Telecommunications Networks and Applications Conference, 1996.
[Barn96b] Scott A. Barnett and Gary J. Anido. A comparison of RAID architectures for video services. In Australian Telecommunications Networks and Applications Conference,
December 1996.
[Barn96c] Scott A. Barnett and Gary J. Anido. A cost comparison of distributed and centralised approaches to video on demand. IEEE Journal on Selected Areas in Communica-

References 250
tions, 14(6), August 1996.
[Barn96d] Scott A. Barnett and Gary J. Anido. Design of large-scale interactive multimedia systems. In Networks'96, Sydney, Australia, 1996.
[Barn96e] Scott A. Barnett and Gary J. Anido. An efficient non-hierarchical storage system for video servers. In Multimedia Japan 96 - International Symposium on Multimedia Systems, March 1996.
[Barn97] Scott A. Barnett, Gary J. Anido, and H. W. Peter Beadle. Predictive call admission control for a disk array based video server. In IS&T/SPIE Multimedia Computing and Networking, San Jose, February 1997.
[Barn98] Scott A. Barnett and Gary J. Anido. Performability of disk-array based video servers. Multimedia Systems (to appear), 6(2), 1998.
[Beau78] M. Danielle Beaudry. Performance-related reliability measures for computing systems. IEEE Transactions on Computers, C-27(6):540-547, June 1978.
[Bers94] S. Berson, R. Muntz, S. Ghandeharizadeh, and X. Ju. Staggered striping in multimedia information systems. In Proceedings ofACMSIGMOD, pages 79-90, 1994.
[Bers95] Steven Berson and Richard R. Muntz. Just-in-time scheduling for video-on-demand storage servers. Technical Report 950017, UCLA Computer Science Department, April 1995.
[Birk95] Yitzhak Birk. Track-pairing: a novel data layout for vod servers with multi-zone-recording disks. In Proceedings of the International Conference on Multimedia Computing Systems, 1995.
[Bisd95] Chatschik C. Bisdikian and Baiju V. Patel. Issues on movie allocation in distributed video-on-demand systems. In IEEE International Conference on Communications, volume 1, pages 250-255, 1995.
[Bisd96] Chatschik C. Bisdikian and Baiju V. Patel. Cost-based program allocation for distributed multimedia-on-demand systems. IEEE Multimedia, 3(3):62-72, 1996.
[Blah95] Donald E. Blahut, Texas E. Nichols, William M. Schnell, Guy A. Story, and Edward S. Szurkowski. Interactive television. Proceedings of the IEEE, 83(7): 1071-1085, July 1995.
[Boud92] Jean-Yves Le Boudec. The asynchronous transfer mode: A tutorial. Computer Networks and ISDN Systems, 24:279-309, 1992.
[Bran96] Philip Branch, Simon Newstead, and Ritesh Kaushik.

References 251
Design of a wide area, video-on-demand user interface. In Australian Telecommunications Networks and Applications Conference, pages 55-58, 1996.
David W. Brubeck and Lawrence A. Rowe. Hierarchical storage management in a distributed V O D system. IEEE Multimedia, 3(3):37-47, 1996.
Milind M. Buddhikot and Guru Parulkar. Distributed data layout, scheduling and playout control in a large scale multimedia storage server. Technical report wucs-94-33, Department of Computer Science, Washington University, St Louis, M O 63130-4899, January 1995.
Bureau of Transport and Communications Economics. Costing new residential communications networks. Work in progress paper number 5, BTCE Communications Futures Project, 1994.
Bureau of Transport and Communications Economics. Communications Futures: Final Report. Australian Government Publishing Service, 1995.
M. Celidonio and D. DiZenobio. Open wireless microwave architecture for video services. In Networks'96 - 7th International Network Planning Symposium Sydney, Australia, November 1996.
[Chan94a] Ed Chang and Avideh Zakhor. Admissions control and data placement for VBR video servers. In First IEEE International Conference on Image Processing, Austin, November 1994.
[Chan94b] Ed Chang and Avideh Zakhor. Variable bit rate MPEG video storage on parallel disk arrays. In First International Workshop on Community Networking Integrated Multimedia Services to the Home, July 1994.
[Chan94c] Y. H. Chang, D. Coggins, D. Pitt, D. Skellem, M. Thapar, and C. Venkatraman. An open-systems approach to video on demand. IEEE Communications Magazine, 32(5):68-80, May 1994.
[Chan95] Alan J. Chaney, Ian D. Wilson, and Andrew Hopper. The design and implementation of a RAID-3 multimedia file server. In Network and Operating Systems Support for Digital Audio and Video, 1995.
[Chan96a] Ed Chang and Avideh Zakhor. Cost analyses for VBR video servers. In Multimedia Computing and Networking Conference, San Jose, California, USA, 1996.
[Chan96b] Ed Chang and Avideh Zakhor. Cost analyses for VBR video servers. IEEE Multimedia, 3(4):56-71, 1996.
[Chan96c] Edward Te Chang. Storage and Retrieval of Compressed Video. PhD thesis, University of California at Berkeley,
[Brub96]
[Budd95]
[Bure94]
[Bure95]
[Celi96]

References 252
1996.
[Chen93] H. J. Chen and T. D. C. Little. Physical storage organizations for time-dependent multimedia data. In Foundations of Data Organization and Algorithms Conference, 1993. ~
[Chen94a] M. S. Chen, D. D. Kandlur, and P. S. Yu. Support for fully interactive playout in a disk-array-based video server. In ACM Multimedia 94, 1994.
[Chen94b] Peter M. Chen, Edward K. Lee, Garth A. Gibson, Randy H. Katz, and David A. Patterson. RAID: High-performance, reliable secondary storage. ACM Computing Surveys, 26(2): 145-185, June 1994.
[Chen94c] W. Y. Chen and D .L. Waring. Applicability of ADSL to support video dial tone in the copper loop. IEEE Communications, 32(5): 102-109, May 1994.
[Chen95] H. J. Chen, A. Krishnamurthy, T. D. C. Little, and D. Venkatesh. A scalable video-on-demand service for the provision for VCR-like functions. In Proceedings of the International Conference on Multimedia Computing and Systems, pages 65-72, Washington DC, USA, May 1995.
[Cher94] Ann Louise Chervenak. Tertiary Storage: An Evaluation of New Applications. PhD thesis, Univesity of California, Berkeley, December 1994.
[Cher95a] Ann L. Chervenak, David A. Patterson, and Randy H. Katz. Choosing the best storage system for video service. In Proceedings ACM Multimedia pages 109-119, November 1995.
[Cher95b] Ann L. Chervenak, David A. Patterson, and Randy H. Katz. Storage systems for movies-on-demand video servers. In Fourteenth IEEE Symposium on Mass Storage Systems, November 1995.
[Coff84] E. G. Coffman, M. R. Garey, and D. S. Johnson. Approximation algorithms for bin-packing - an updated survey. In G. Ausiello, N. Lucertini, and P. Serafini, editors, Algorithm Design for Computer System Design, pages 49-106. Springer Vienna, 1984.
[Cohe95] Ariel Cohen, Walter A. Burkhard, and P. Venkat Rangan. Pipelined disk arrays for digital movie retrieval. In Proceedings of the International Conference on Multimedia Computing and Systems, 1995.
[Cros94] Nigel Cross. Engineering Design Methods: Strategies for Product Design. John Wiley & Sons Ltd, Chichester, Eng
land, 1994. "
[Crut94] Laurence Crutcher and John Grinham. The networked

References 253
[Dan94a]
[Dan94b]
[Dan94c]
[Dan94d]
[Dan94e]
[Dan95a]
[Dan95b]
[Delo94]
[Digi95]
[Disk]
[Dixi95]
[Doga94a]
video jukebox. IEEE Transactions on Circuits and Systems for Video Technology, 4(2): 105-120, April 1994.
A. Dan, M. Kienzle, and D. Sitaram. Dynamic segment replication policy for load-balancing in video-on-demand servers. Technical Report RC 19589, IBM Research Division, T. J. Watson Research Centre, Yorktown Heights, NY 10598, 1994.
A. Dan, P. Shahabuddin, D. Sitaram, and D. Towsley. Channel allocation under batching and vcr control in movie-on-demand servers. Technical Report RC 19588, IBM Research Division, T. J. Watson Research Centre, Yorktown Heights, NY 10598, 1994.
A. Dan and D . Sitaram. Buffer management policy for an on-demand video server. Technical Report RC 19347, IBM Research Division, T. J. Watson Research Centre, Yorktown Heights NY 10598, 1994.
A. Dan, D. Sitaram, and P. Shahabuddin. Scheduling policies for an on-demand video server with batching. In ACM Multimedia 94, 1994.
A. Dan, D. Sitaram, and P. Shahabuddin. Scheduling policies for an on-demand video server with batching. Technical Report RC 19381, IBM Research Division, T. J. Watson Research Centre, Yorktown Heights, NY 10598, 1994.
Asit Dan, Martin Kienzle, and Dinkar Sitaram. A dynamic policy of segment replication for load-balancing in video-on-demand servers. Multimedia Systems, 3(3):93-103, July 1995.
Asit Dan and Dinkar Sitaram. An online video placement policy based on bandwidth to space ratio (BSR). In Proceedings ofSIGMOD'95, San Jose, California, May 1995.
D. Deloddere, W. Verbiest, and H. Verhille. Interactive video on demand. IEEE Communications Magazine, 32(5):82-88, May 1994.
Digital Audio-Visual Council. DAVIC 1.0 specification, 1995.
gopher://pccatalog.peed. com: 70/11/listings/9313/har /1000.
Sudhir Dixit and Paul Skelly. MPEG-2 over ATM for video dial tone networks: Issues and strategies. IEEE Network, pages 30-40, September 1995.
Yurdaer N. Doganata and Asser N. Tantawi. A cost/performance study of video servers with hierarchical storage. In Proceedings of the International Conference on

References 254
Multimedia Computing and Systems, pages 393-402, 1994.
[Doga94b] Yurdaer N. Doganata and Asser N. Tantawi. Making a cost-effective video server. IEEE Multimedia, l(4):22-30, 1994.
[Doga95] Yurdaer N. Doganata and Asser N. Tantawi. A video server cost/performance estimator tool. Multimedia Tools and Applications, 1(2), June 1995.
[Dows92] K. A. Dowsland and W. B. Dowsland. Packing problems. European Journal of Operational Research, 56:2-14, 1992.
[DS94] J. K. Dey-Sircar, J. D. Salehi, J. F. Kurose, and D. Towsley. Providing VCR capabilities in large-scale video servers. In ACM Multimedia 94, 1994.
[Fede94] Craig Federighi and Lawrence A. Rowe. A distributed hierarchical storage manager for a video-on-demand system. Technical report, University of California - Berkeley, 1994.
[Fisf94] S. Fist. Dial M for movie: Video on demand. Australian Communications, pages 65-72, August 1994.
[Frie96] Mark B. Friedman. RAID keeps going and going and... IEEE Spectrum, pages 73-79, April 1996.
[Furh95] Borko Furht, Deven Kalra, Frederick L. Kitson, Arturo A. Rodriguez, and William E. Wall. Design issues for interactive television systems. IEEE Computer, 28(5):25-39,
May 1995.
[Gang94] G. R. Ganger, B. L. Worthington, R. Y. Hou, and Y. N. Patt. Disk arrays: High-performance, high-reliability storage subsystems. IEEE Computer, 27(3):30-36, March
1994.
[Gare76] M. R. Garey, R. L. Graham, and D. S. Johnson. Resource constrained scheduling as generalized bin packing. Journal of Combinatorial Theory Series A, 21:257-298, 1976.
[Gelm91] A. D. Gelman, H. Kobrinski, L. S. Smoof, and S. B. Wein-stein. A store-and-forward architecture for video-on-demand service. In IEEE International Conference on
Communications, 1991.
[Gemm92] J. Gemmell and S. Christodoulakis. Principles of delay-sensitive multimedia data storage and retrieval. ACM Transactions on Information Systems, 10(l):51-90, Janu
ary 1992.
[Gemm93] D. James Gemmell. Multimedia network file servers: Multi-channel delay sensitive data retrieval. In Proceedings of ACM Multimedia 93, pages 243-250, 1993.

References 255
[Gemm94] D. James Gemmell, Jiawei Han, Richard J. Beaton, and Stavros Christodoulakis. Delay-sensitive multimedia on disks. IEEE Multimedia, l(4):56-66, 1994.
[Gemm95] D. James Gemmell, Harrick M. Vin, Dilip D. Kandlur, P. Venkat Rangan, and Lawrence A. Rowe. Multimedia storage servers: A tutorial. IEEE Computer, 28(5):40-49, May 1995.
[Genn95] Benoif A. Gennart and Roger D. Hersch. Comparing multimedia storage architectures. In Proceedings of the International Conference on Multimedia Computing and Systems, 1995.
[Ghaf94] Hatem Ghafir and Henry Chadwick. Multimedia servers - design and performance. In IEEE Globecom, 1994.
[Ghan95a] Shahram Ghandeharizadeh, Ali Dashti, and Cyrus Sha-habi. Pipelining mechanism to minimize the latency time in hierarchical multimedia storage managers. Computer Communications, 18(3): 170-184, March 1995.
[Ghan95b] Shahram Ghandeharizadeh, Seon Ho Kim, and Cyrus Shahabi. On configuring a single disk continuous media server. In Proceedings of the Joint International Conference on Measurement and Modeling of Computer Systems (SIGMETRICS '95/Performance '95), pages 37-46, May
1995.
[Gibb85] Jean Dickinson Gibbons. Nonparametric Methods for Quantitative Analysis. American Sciences Press Inc., Columbus Ohio, 2nd edition, 1985.
[Golu95] Leana Golubchik, John C. S. Lui, and Richard Muntz. Reducing I/O demand in video-on-demand storage servers. In Proceedings of the Joint International Conference on Measurement and Modeling of Computer Systems (SIG-METRICS'951 Performance '95), pages 25-36, May 1995.
[Habi96] Daryoush Habibi, Stefan Gabrielsson, and Vida Ghod-dousi. Modelling MPEG video traffic in an ATM environment. In Seventh International Workshop on Packet Video,
pages 135-140, March 1996.
[Hamm85] P. L. Hammer and N. V. R. Mahadev. Bithreshold graphs. SIAM Journal on algebra and discrete methods,
6:497-506, 1985.
[Hayt91] M. Hayter and D. McCauley. The desk area network. ACM Operating Systems Review, 25(4): 14-21, October
1991.
[Hayt93] Mark D. Hayter. A Workstation Architecture to Support Multimedia. PhD thesis, St Johns College University of Cambridge, September 1993.
[Isla93] S. M. R. Islam. Perfomability analysis of disk arrays. In

References 256
Proceedings of the 36th Midwest Symposium on Circuits and Systems, 1993.
[Jada95] Divyesh Jadav, Chutimet Srinilta, Alok Choudhary, and P. Bruce Berra. Design and evaluation of data access strategies in a high performance multimedia-on-demand server. In Proceedings of the International Conference on Multimedia Computing and Systems, 1995.
[Kama94] M. Kamath, D. Towsley, and K. Ramamritham. Buffer management for continuous media sharing in multimedia database systems. Technical Report 94-11, University of Massachusetts, February 1994.
[Kana94] H. Kanakia, P. P. Mishra, and A Reibman. An adaptive congestion control scheme for real-time packet video transport. Technical report, AT & T, 1994.
[Kare94] Ramakrishna Karedla, J. Spencer Love, and Bradley G. Wherry. Caching strategies to improve system performance. IEEE Computer, pages 38-46, March 1994.
[Keet94] Kimberly Keeton, Ann Drapeau, David Patterson, and Randy H. Katz. Storage alternatives for video service. In Thirteenth IEEE Symposium on Mass Storage Systems,
June 1994.
[Keet95] Kimberley Keeton and Randy H. Katz. Evaluating video layout strategies for a high performance storage server. Multimedia Systems, 3(3):43-52, 1995.
[Klei75] Leonard Kleinrock. Queueing Systems - Volume 1: Theory. John Wiley and Sons, 1975.
[Kou77] L. T. Kou and G. Markowsky. Multidimensional bin packing algorithms. IBM Journal ofReseach and Develop
ment, 1977.
[Kova94] Al Kovalick, David Coggins, and John Burgin. The fundamental concepts of media servers. In Australian Telcom-munications Networks and Applications Conference '94,
pages 101-106, 1994.
[Krun95] Marwan Krunz and Herman Hughes. A traffic model for MPEG-coded VBR streams. In Proceedings of the Joint International Conference on Measurement and Modeling of Computer Systems (SIGMETRICS '95/Performance '95),
pages 47-55, May 1995.
[Lau95a] S. W. Lau and John C. S. Lui. A novel video-on-demand storage architecture for supporting constant frame rate with variable bit rate retrieval. In Network and Operating System Support for Digital Audio and Video, 1995.
[Lau95b] S. W. Lau, John C. S. Lui, and P. C. Wong. A cost-effective near-line storage server for multimedia system. In Proceedings of the Eleventh International Conference on

References 257
[Lau96]
[Law91]
[LeGa91]
[Li96]
[Lin96a]
[Lin96b]
[Litt95]
[Loug92]
[Loug94]
[Mart90]
[Maru77]
[Max95]
[Meye80]
Data Engineering, March 1995.
Sih-Wah Lau and John C. S. Lui. Scheduling and replacement policies for a hierarchical multimedia storage server. In Proceedings of the Multimedia Japan, March 1996.
Averill M. Law and W. David Kelton. Simulation Modeling and Analysis. Mc Graw Hill, 1991.
D. LeGall. MPEG: A video compression standard for multimedia applications. Communications of the ACM, 34(4):305-313, April 1991.
Victor O. K. Li, Wanjiun Liao, Xiaoxin Qiu, and Eric W. M. Wong. Performance model of interactive video-on-demand systems. IEEE Journal on Selected Areas in Communications, 14(6): 1099-1109, August 1996.
Chang-Li Lin and Sheng-Uei Guan. The design and architecture of a video library system. IEEE Communications Magazine, pages 86-91, January 1996.
Mengjou Lin, David Singer, and Alagu Periyannan. Supporting constant-bit-rate-encoded MPEG-2 transport over local ATM networks. Multimedia Systems,
4(2):87-98, April 1996.
T. D. C. Little and D. Venkatesh. Popularity-based assignment of movies to storage devices in a video-on-demand system. Multimedia Systems, 2(6):280-287,
January 1995.
P. Lougher and D. Shepherd. The design and implementation of a continuous media storage server. In Network and Operating System Support for Digital Audio and Video
'92, pages 69-80, 1992.
P. Lougher, D. Pegler, and S. Shepherd. Scalable storage servers for digital audio and video. In IEE International Conference on Storage and Recording Systems, April
1994.
Silvano Martello and Paolo Toth. Knapsack Problems: Algorithms and Computer Implementations. John Wiley and
Sons, 1990.
K. Maruyama, S. K. Chang, and D. T. Tang. A general packing algorithm for multidimensional resource requirements. International Journal of Computer and Infor
mation Sciences, 6(2):131-149, 1977.
7000 series hard drive specifications. Technical report,
Maxtor Australia, 1995.
John F. Meyer. On evaluating the performability of de-gradable computing systems. IEEE Transactions on Com-

References 258
puters, C-29(8):720-731, August 1980.
[Mic94] Super capacity Micropolis - Spring 1994 catalog. Technical report, Micropolis Corporation, 1994.
[Mino95] Daniel Minoli. Video Dialtone Technology: Digital Video Over ADSL, HFC, FTTC and ATM. McGraw-Hill Inc., 1995.
[Mour96] Antoine N. Mourad. Issues in the design of a storage server for video-on-demand. Multimedia Systems, 4(2):70-86, April 1996.
[MPDA95] MPDAA95. This week at the Australian box office. Chart data from the Motion Pictures Distributors Association of Australia, 1995.
[Munt90] Richard R. Muntz and John C. S. Lui. Performance analysis of disk arrays under failure. In Proceedings of the 16th International Conference on Very Large Databases, pages 978-988, 1990.
[Nagp96] Radhika Nagpal and Hemant Kanakia. Browsing operations on MPEG video. In Seventh International Workshop on Packet Video, pages 169-173, March 1996.
[Neuf96] Gerald Neufeld, Dwight Makaroff, and Norman Hutchinson. Design of a variable bit rate continuous media file server for an ATM network. In Multimedia Computing and Networking Conference, San Jose, California, USA, 1996.
[Ng92] Spencer W. Ng and Richard L. Mattson. Maintaining good performance in disk arrays during failure via uniform parity group distribution. In Proceedings of the First International Symposium on High-Performance Distributed Computing, 1992.
[Ng89] Spencer Ng. Some design issues of disk arrays. In COM-PCON Spring, pages 137-42, March 89.
[Nuss95J Jean-Paul Nussbaumer, Baiju V. Patel, Frank Schaffa, and James P. G. Sterbenz. Networking requirements for interactive video on demand. IEEE Journal on Selected Areas m Communications, 13(5):779-787, 1995.
[Orji96] Cyril U. Orji, Napthali Rishe, and Kingley C. Nwosu. Multimedia object storage and retrieval. In Proceedings of the Multimedia Japan, March 1996.
[Oyan94a] Y. J. Oyang, M. H. Lee, and C. H. Wen. A video storage system for on-demand playback. Technical report, National Taiwan University, May 1994.
[Oyan94b] Y. J. Oyang, M. H. Lee, S. H. Wen, and C. Y. Cheng. Design of multimedia storage systems for on-demand playback. Technical Report NTUCSIE94-03, National Taiwan University, Taipei, Taiwan, September 1994.
[Ozde96] Banu Ozden, Rajeev Rastogi, and Avi Silberschatz. On
References 259
the design of a low-cost video-on-demand storage system. Multimedia Systems, 4(l):40-54, February 1996.
[Paek95] Seungyup Paek, Paul Bocheck, and Shih-Fu Chang. Scalable MPEG2 video servers with heterogeneous QoS on parallel disk arrays. In Network and Operating Systems Support for Digital Audio and Video, 1995.
[Panc94] P. Pancha and M. El Zarki. MPEG coding for variable bit rate video transmission. IEEE Communications Magazine, 32(5):54-66, May 1994.
[Pang96] HweeHwa Pang, M.S. Krishnan, and A. Desai Narasimh-alu. A disk-based multimedia server. In Proceedings of the Multimedia Japan, March 1996.
[Papa95] Christos Papadimitriou, Srinivas Ramanathan, P. Venkat Rangan, and Srihari SampathKumar. Multimedia information caching for personalized video-on-demand. Computer Communications, 18(3):204-216, March 1995.
[Patt88] D. A. Patterson, G. Gibson, and R. H. Katz. A case for redundant arrays of inexpensive disks (RAID). In Proceedings of ACM SIGMOD Conference, pages 109-116, Chicago, Illinois, June 1988.
[Perr96] Tekla S. Perry. The trials and travails of interactive TV. IEEE Spectrum pages 22-28, April 1996.
[Rama91] R. Ramarao and V. Ramamoorthy. Architectural design of on-demand video delivery systems: The spatio-temporal storage allocation problem. In IEEE International Conference on Communications, 1991.
[Rama95] K. K. Ramakrishnan, Lev Vaitzblit, Cary Gray, Uresh Va-halia, Dennis Ting, Percy Tzelnic, Steve Glaser, and Wayne Duso. Operating system support for a video-on-demand file service. Multimedia Systems, 3(3):53-65, 1995.
[Rang93] P. V. Rangan and H. M. Vin. Efficient storage techniques for digital continuous media. IEEE Transactions on Knowledge and Data Engineering, 5(4): 564-573, August
1993.
[Redd94] A. L. Narasimha Reddy and James C. Wylie. I/O issues in a multimedia system. IEEE Computer, 27(3):69-74, March 1994.
[Rich95] I. E. G. Richardson and M. J. Riley. Video quality of service in broadband networks. In IEE International Broadcasting Convention, September 1995. More details from IPO.
[Ruem93] Chris Ruemmler and John Wilkes. Modelling disks. Technical Report HPL-93-68, Hewlett-Packard, Decern-

References 260
ber 1993. Revision 1.
[Ruem94] Chris Ruemmler and John Wilkes. An introduction to disk drive modeling. IEEE Computer, pages 17-28, March 1994.
[Ryu96] Yeon Seung Ryu and Kern Koh. A dynamic buffer management technique for a video-on-demand server. In Proceedings of the Multimedia Japan, March 1996.
[Saka96] Hideki Sakamoto, Akira Uemori, Hiroshi Sugiyama, and Kazutoshi Nishimura. Video server architecture supporting real-time input and immediate playback. In Proceedings fo the Multimedia Japan, March 1996.
[Schu89] M. Schulze, G. Gibson, R. Katz, and D. A. Patterson. How reliable is a RAID? In Digest of Papers. COMPCON Spring '89, pages 118-123, 1989.
[Seo95] Maesil Seo and Cheeha Kim. Allocation strategies of multimedia data on disk arrays. Computer Communications, 18(3): 185-191, March 1995.
[Shen95] Prahant J. Shenoy and Harrick M. Vin. Efficient support for scan operations in video servers. In Proceedings of ACM Multimedia November 1995.
[Shne84] Ben Shneiderman. Response time and display rate in human performance with computers. ACM Computing Surveys, 16(3):265-285, September 1984.
[Shoo68] Martin L. Shooman. Probabilistic Reliability: An Engineering Approach. McGraw-Hill Book Co., 1968.
[Smit88] R. M. Smith, Kishor S. Trivedi, and A. V. Ramesh. Performability analysis: Measures, an algorithm, and a case study. IEEE Transactions on Computers, 37(4):406-417, April 1988.
[Sona95] B. Sonah, M. R. Ito, and G. Neufeld. The design and performance of a multimedia server for high-speed networks. In Proceeding of the International Conference on Multimedia Computing and Systems, pages 15-22, Washington DC, May 1995.
[Spie94] Frits C. R. Spieksma. A branch-and-bound algorithm for the two-dimensional vector packing problem. Computers and Operations Research, 21(1): 19-25, 1994.
[Stei95] Ralf Steinmetz. Multimedia file systems survey: Approaches for continuous media disk scheduling. Computer Communications, 18(3): 133-144, 1995.
[Stol95] Scott D. Stoller and John D. DeTreville. Storage replication and layout in video-on-demand servers. In Proceedings of the 5th International Workshop on Network and Operating Systems Support for Digital Audio and Video

References 261
(NOSSDAV95), 1995.
[Telf94] Grant Telfar. Generally applicable heuristics for global optimisation: An investigation of algorithm performance for the euclidean traveling salesman problem. Master's thesis, Victoria University of Wellington, October 1994.
[Tetz94] William Tetzlaff, Martin Kienzle, and Dinkar Sitaram. A methodology for evaluating storage systems in distributed and hierarchical video servers. In Digest of Papers. Spring COMPCON, 1994.
[Tetz96] William Tetzlaff and Robert Flynn. Block allocation in video servers for availability and throughput. In Multimedia Computing and Networking Conference, San Jose, California, USA, January 1996.
[Toba93] Fouad A. Tobagi, Joseph Pang, Randall Baird, and Mark Gang. Streaming RAID - a disk array management system for video files. In Proceedings of ACM Multimedia, 1993.
[Triv94] K. S. Trivedi, M. Malhotra, and R. M. Fricks. Markov reward approach to performability and reliability analysis. In MASCOTS 94. Proceedings of the Second International Workshop on Modeling, Analysis, and Simulation of Computer and Telecommunication Systems, pages 7-11, 1994.
[Vin93] H. M. Vin and P. V. Rangan. Designing a multiuser hdtv storage server. IEEE Journal on Selected Areas in Communications, 11(1): 153-164, January 1993.
[Vin94a] H. M. Vin, P. Goyal, Alok Goyal, and Anshuman Goyal. A statistical admission control algorithm for multimedia servers. In ACM Multimedia 94, 1994.
[Vin94b] H. M. Vin, P. Shenoy, and S. Rao. Analyzing the performance of asynchronous disk arrays for multimedia retrieval. May 1994.
[Vin95] H. M. Vin, S. S. Rao, and P. Goyal. Optimizing the placement of multimedia objects on disk arrays. In Proceedings of the International Conference on Multimedia Computing and Systems, pages 158-165, Washington DC, USA, May 1995.
[Whit84] Ward Whitt. Heavy-traffic approximations for service systems with blocking. AT&T Bell Laboratories Technical Journal, 63(5):689-708, May 1984.
[Wolf95] Joel L. Wolf, Philip S. Yu, and Hadas Shachnai. DASD dancing: A disk load balancing optimization scheme for video-on-demand computer systems. In Proceedings of the Joint International Conference on Measurement and Modeling of Computer Systems (SIGMETRICS '95/Per-

References 262
formance '95), pages 157-166, May 1995.
[Wong94] John W. T. Wong, Liren Zhang, and Khee K. Pang. A disk scheduling strategy for the video on demand server. In Australian Telcommunications Networks and Applications Conference, pages 107-112, December 1994.
[Wong95] John W. T. Wong and Khee K. Pang. Random access support for large scale vod. In Australian Telecommunications Networks and Applications Conference (ATNAC), 1995.
[Yosh96] Makiko Yoshida, Makoto Nishio, and Sho ichiro Nakai. Video program allocation control in distribute video on demand servers. In Networks'96 - 7th International Network Planning Symposium, Sydney, Australia, November 1996.
[Yu89] C. Yu, W. Sun, D. Bitton, Q. Yang, R. Bruno, and J. Tullis. Efficient placement of audio data on optical disks for real-time applications. Communications of the ACM, 32(7):862-871, July 1989.
[Yu92] P. S. Yu, M. S. Chen, and D. D. Kandlur. Design and analysis of a grouped sweeping scheme for multimedia storage management. In Network and Operating Systems Support for Digital Audio and Video '92, pages 44-55, 1992.

Optimisation of Disk Size Allocation 263
Appendix A. Optimisation of Disk Size Allocation
This appendix discusses a simple optimisation scheme for improving
the allocation of objects to disks in an heterogeneous disk array. The
proposed scheme can be shown to provide a marginal improvement
over the methods already discussed in Chapter 3.
Once an initial allocation of movies to disks has been performed,
this is able to be optimised to some degree by combining several
fractional disk usages together onto a single disk. An example of this
type of optimisation is shown in Figure A. 1.
The algorithm used to perform this optimisation is as follows. Let Dj
represent the rank of the lowest ranked movie to be stored on disks
of size Gj.
Dj = (max(i):Ct = Gj) (Eqn A.1)
The total disk requirement for each capacity is then determined from
a simple modification to Equation 3.4:
D
dj= J, |niax[ ' ,' ',,! )j (EqnA,2) ,i.,KP» Once this initial requirement has been determined, the optimisation
algorithm begins with the largest disk and attempts to relocate

Optimisation of Disk Size Allocation 264
Disk Size = 4
BEFORE
Total Disks = 2x4 GB+ 1 x5GB
2--
1—
Disk Size =5
N o o Movie i+2 0\VI 0.6
Disk Size = 4
AFTER
Total Disks = -\
2 x4 GB
-1.9 2--
1 —
Disk Size =5
Figure A.1 Optimisation of movie allocation example
movies onto smaller disks without increasing the cost of the smaller
disk. Movies are shifted from the larger disk to the next smallest disk
size until no more movies can be shifted without increasing the
smaller disk requirement. If a reduction in the larger disk require
ment is achieved by performing these relocations then the reloca
tions are accepted and made permanent. Alternatively, if no
improvement to the larger disk count is brought about then the
changes are undone and the algorithm moves to consider the next
smallest disks size. The algorithm is shown in Figure A. 2.
Although we don't discuss this algorithm in detail here, it is shown
in [Barnett96a] to provide a slight improvement over the standard
heterogeneous case. The optimality of this approach is not a focus of
this thesis, instead it is a simple heuristic approach which can be
used to improve any disk layout selected by the heterogeneous
scheme presented in Chapter 3.

Optimisation of Disk Size Allocation 265
for i = biggest disk to smallest disk save initial disk state for j = highest ranked movie on i to lowest ranked movie on i
d_new(i) = d(i) - disk_req(j) d_new(i-1) = d(i-1) - disk_req(j)
if ((Fd_new(i)] < Td(i)]) A N D {rd_new(i-1)l < rd(i-1)l)) O R ((rd_new(i)l < fd(i)l) A N D (fd_new(i-1)l < Td(i-1) + 1])) then
/* beneficial to move 7 d(i) = d_new(i) d(i-1) = d_new(i-1)
else /* unable to move this movie without incurring penalty */
if (rd_new(i)~|>rd(i)l)then /* No benefit was gained */ restore initial state
end /* exit the inner loop */ break
end end
end
Figure A.2 Algorithm for heterogeneous disk array movie allocation optimisation

Further Results for the Predictive CAC Scheme 266
Appendix B. Further Results for the Predictive CAC Scheme
This appendix presents more detailed results for several cases stud
ies of the predictive CAC scheme discussed in Chapter 6. Although
the 3-dimensional nature of the plots makes precise quantitative
comparisons difficult, the intention here is merely to examine
trends. Confidence intervals are omitted for clarity, and no discus
sion is presented here, since all results comply with the trends dis
cussed in Chapter 6.
Figure B. 1 shows the mean admission and interactivity delays ver
sus the number of streams being served per disk for an array con
sisting of 50 disks. Figure B.2 shows the corresponding 95th
percentile delay results.
The mean and 95th percentiles of delay are shown in Figure B.3 and
Figure B.4 respectively, for cases where the number of disks in the
array is varied, and each disk serves 10 streams.
Figure B.5 reveals the mean delay results in a system where no
blocking is implemented. All requests (interactivity and admission)
are queued until they can be served, hence the reversal in the trend
from Figure B.3.

Further Results for the Predictive CAC Scheme 267
Admission Delay (SO disks, 2 streams per disk) Interactivity Delay (50 disks. 2 streams per disk)
Figure B.1 Mean admission and interactivity delay vs number of streams

Further Results for the Predictive CAC Scheme 268
Admission Delay (50 disks, 2 streams per disk) Interactivity Delay (50 disks. 2 streams per disk)
' Deltal
Admission Delay (50 disks, 5 streams per disk)
Load (%) o u u Deltal
Interactivity Delay (50 disks, 5 streams per disk)
Figure B.2 95th percentile admission and interactivity delays vs number of streams

Further Results for the Predictive CAC Scheme 269
Admission Delay {10 disks, 10 streams per disk) Interactivity Delay (10 disks, 10 streams per disk)
Load (%) Deltal
Admission Delay (100 disks, 10 streams per disk)
Load (%) oeltai
Interactivity Delay (100 disks, 10 streams per disk)
Load(%) ™ ° Deltal
Admission Delay (200 disks, 10 streams per disk) Interactivity Delay (200 disks, 10 streams per disk)
Figure B.3 Mean admission and interactivity delay vs number of disks per array

Further Results for the Predictive CAC Scheme 270
Admission Delay (10 disks, 10 streams per disk) Interactivity Delay (10 disks, 10 streams per disk)
Admission Delay (20 disks, 10 streams per disk)
Uad(%) »u ° ^ I B ,
Interactivity Delay (20 disks, 10 streams per disk)
L M d (%) Deltal
Admission Delay (SO disks, 10 streams per disk)
Load (%) ° u u 03,1,!
Interactivity Delay (50 disks, 10 streams per disk)
Figure B.4 95th percentile admission and interactivity delays vs number of disks

Further Results for the Predictive CAC Scheme 271
Admission Delay (10 disks, 10 streams per disk) Interactivity Delay (10 disks, 10 streams per disk)
Load(%) D U « Deltal
Admission Delay (50 disks, 10 streams per disk)
Lead(%) ~ « De|ta1
Interactivity Delay (50 disks, 10 streams per disk)
Load(%> D U " DeHa,
Admission Delay (100 disks, 10 streams per disk)
Load(%) ™ ° DBl|al
Interactivity Delay (100 disks, 10 streams per disk)
Figure B.5 Mean admission and interactivity delay vs number of disks per array for a system with no blocking

Details of System Design Procedure 272
Appendix C. Details of System Design Procedure
C.1 Introduction
This appendix presents the details of aspects of the design proce
dure presented in Chapter 7. Section C.2 presents the performability
analysis required to determine the limit on the number of disks per
array in order to guarantee that the availability constraint is met.
Section C.3 shows the method of using contour plots of delay to
determine the effective bandwidth of the disk array and the appro
priate 5 values to ensure that admission and interactivity delay con
straints are met. Section C.4 shows the results of the packing
procedure applied to the FES and VS. The results confirm the qual
ity of the SSBF heuristic compared to the various FF heuristics.
C.2 Disk Array Size Performability Limit
In order to determine the number of disks that will give the required
availability, we begin with the expectation of reward earned over a
mission time, t, which is shown in Equation 4.55, and reproduced
here:

Details of System Design Procedure 273
2
E[Y{t)] = J^a^t (EqnC.1) i = 0
where at represents the steady-state probability of the array being in
state i, rt represents the reward earned per unit time while in state i
and t represents elapsed time (mission time). N o w , normalising the
r( 's by dividing by F0, (the expected reward in state 0) and taking the
value of the expectation of reward earned per unit time, w e obtain a
measure of long-term availability, A:
A. if l"° J? (Eqn C2)
rl = a 0 + z=aj
r0
since T2 = o for a R A I D 5 disk array. N o w define p = = as the penalty
for a R A I D 5 array being partially failed, p can a s s u m e a value from
0.5 to 1 dependent on the load variation with time of day. If, for
example, load is constant at the peak load then p=0.5, since a RAID-
5 can only serve 5 0 % of peak capacity w h e n partially failed. However
if the array is almost always lightly loaded (less than 5 0 % ) then p
will approach unity, since there will be no penalty for being in a par
tially failed state. For the viewers vs time of day statistics s h o w n in
Figure 4.7, p=0.765 and that is what is assumed here.
Substituting values of a0 and a^ into Equation C.2 we obtain:
A = *\+*\+W'\ , (Eqn C.3)
H|X + XX + X'\i' + X\i'
and substituting the definitions of X and X' this becomes:
A = MHD-DKl+IV'DK (Eqn c.4) \i\i' + D(D-l)X2s + (D-l)Xs\i' + DXsyL'
B y rearranging Equation C.4, w e can obtain a solution for D to give a
constraint o n the n u m b e r of disks in a n array based on the required
availability, disk reliability and repair times. Omitting the steps, the
solution for D is:

Details of System Design Procedure 274
D< > + */b 4ac 2a
where
a^AXzs
b = 2AXsyL' - AX2s-Xs\i' - PXSVL'
c = Xsii.' + A\i\i' - \i\i' - AXs\i'
(Eqn C5)
C.3 Effective Bandwidth due to CAC
This section considers the problem of determining a maximum
"effective bandwidth" for the disk array design in Chapter 7. The raw
bandwidth of the array is 512 streams (served from 73 disks), but
this m a y be required to be reduced to ensure that particular delay
constraints are met. By taking horizontal slices through the graphs
shown in Appendix B, contour plots can be developed which effec
tively show regions of feasible operation, given a particular delay
constraint.
Consider the contour plots shown in Figure C.l. These plots show
Feasible operating regions based on admission delay constraints Feasible operating regions based on interactivity delay constraints
• * - - - - * . --
X
0
Mean Delay
- 95pc Delay
Loose
Tight
Infeasible
Feasible
— I — | 5 S
0 0 5 1 I S 2 2.5 3 3.5 4 4.5 5 " o 0.5 1 1.5 2 2.5 3 3.5 4 4.5 5 Dsltal Del">1
Figure C.1 Contour plots showing regions of feasible operation for admission and interactivity delay constraints.
the feasible operating regions of a disk array consisting of 70 disks
(serving 10 streams per disk) for two different sets of delay con
straints. For simplicity, the predictive C A C scheme used here it is
assumed to have 82=0, although other values of 82 can be easily
investigated. The constraints used in the loose and tight cases are
shown in Table C.l. Note that the loose constraints correspond to
the requirements in the design example in Chapter 7.

Details of System Design Procedure 275
Table C.1 Constraints used for "loose" and "tight" contours in Figure C.1.
Constraint
Admission Delay (s)
Interactivity Delay (s)
Loose
Mean
2.5
1
95 pc
5
3
Tight
Mean
1
0.5
95 pc
2
1
From Figure C. 1 it can be determined, for example, that to support a
mean admission delay of 1 second the array can operate at a maxi
m u m utilisation of about 8 7 % and that 8X should be set to 0. This
setting will not, however, meet the 95pc constraint on admission
delay or the "tight" interactivity constraints. In order to find the cor
rect operating point it is necessary to overlay the required con
straints onto a single graph, and find the point in the feasible region
that allows the highest utilisation and select the corresponding value
of5x.
Figure C.2 shows the most restrictive contours for both admission
and interactivity delay constraints for the "loose" case considered
above. The curves shown are for the 95th percentile constraints
since Figure C. 1 showed these to be stricter than the corresponding
mean delay constraints. From the figure it can be seen that the high
est feasible utilisation is about 88.3% and a value of 8X= 1.8 will
result in all the imposed delay constraints being met. Note that if the
previous simple C A C schemes were used, the m a x i m u m possible
server utilisation would be less than 86%, in this case. The figure of
8 8 % is used in Chapter 7 to complete the design procedure.

Details of System Design Procedure 276
92
91
90
^89
CD O
Infeasible
85
Feasible for Admission Delay Only Feasible
for Interactivity Delay Only
Feasible — Admission Delay 95pc = 5s - Interactivity Delay 95pc = 3s
0 0.5 1.5 2 2.5 3 3.5 4 4.5 5 Deltal
Figure C.2 Feasible regions for loose call admission and interactivity delay constraints
C.4 Object Packing
This section shows the results of the object packing used in the
design example of Chapter 7 for the FES and VS.
C.4.1 FES Object Packing
Since the object packing heuristics are not perfect or predictable it is
uncertain how many objects will actually fit on the 8 arrays specified
as the lower bound for each FES in Section 7.8.1. The packing
results of the FF, FFGAR and SSBF heuristics for this case are
shown in Table C.2. Note that since the same number of bins were
used by FF and FFGAR the total resources wasted are equal, despite
the fact that the actual object placements are considerably different.
It is clear that SSBF provides the most efficient packing, meeting the
lower bound of 8 bins (disk arrays) while the other two heuristics
require an additional 2 arrays which significantly increases system
cost.

Details of System Design Procedure 277
Table C.2 Packing performance of various heuristics for FES
Lower Bound
Bins Required
% wasted capacity
% wasted bandwidth
Heuristic
FF
8
10
27.7
23.2
FFGAR
8
10
27.7
23.2
SSBF
8
8
4.0
9.7
Table C.3 shows the actual packing obtained by application of the
SSBF heuristic for the set of objects assumed here. All of the arrays
Table C.3 Object allocation from the SSBF heuristic for FES
Array
1
2
3
4
5
6
7
8
Objects Stored
1,40,30,33,51,42,35,43
2,41,22,38,36,48,20,47
3,19,50,34,44,32,45,25
4,26,39,37,52,31,46,29,53
5,28,16,49,24,55,11
6,17,57,15,54,10,58
7,14,27,59,23,60,9
8,56,21,18,13,12
Excess
Capacity
0.060
0.0025
0.047
0.023
0.10
0.14
0.14
0.31
Bandwidth
0.041
0.000023
0.027
0.060
0.017
0.28
0.04
0.05
are very well packed in both bandwidth and capacity dimensions,
with the exception of array 8 which has 3 1 % free capacity. This free
capacity can be put to good use, however, storing additional movies
(2 to 3 movies will fit) without any bandwidth allocated to them. The
movies stored will be selected by the caching algorithm such that
they are likely to become more popular in future. This way, when
they do increase in popularity, a copy already resides locally and can
be used to serve requests immediately, provided the overall load on
the array will not exceed the limit of 450. This small amount of extra
storage will help to ensure the efficient operation of the caching algo
rithms.

Details of System Design Procedure 278
C.4.2 VS Object Packing
Section 7.8.2 determined that a minimum of 8 disk arrays would be
required in the VS. To determine the actual number required, a set
of representative objects must be allocated to the arrays using the
appropriate packing heuristics. The popularity model to use in this
case is of particular interest. Since the majority of the popular titles
are held in the cache at the various FES's the requests which actu
ally reach the VS are likely to be for the less popular titles. As such
the empirical model used thus far (in Chapter 7) must be appropri
ately modified to represent this change. This modification is affected
by reducing the popularity of the top 60 objects to zero1 and renor-
malising the popularities of the remaining objects such that they
total 1. The modified popularity distribution is still heavily skewed,
although not nearly as steeply as the overall empirical distribution
which includes the most popular 60 objects. Indeed, the popularity
is now closely approximated by the Zipf distribution. The modified
empirical popularity model is used for the packing considered here
with 1000 objects to be packed. This accounts for the 60 objects in
each of the FES caches by allocating them a very small bandwidth
requirement.
The results of this packing process are shown in Table C.4 for the
three heuristics considered in this thesis. SSBF is again seen to out
perform the other two heuristics which both exceed the lower bound
by 3 arrays (or 33%). Notice that the lower bound shown in the table
is 9 arrays, whereas the lower bound found in Chapter 7 was only 8
arrays. The reason for this discrepancy is that the bandwidth
requirement of the VS meant that exactly 8 arrays were required and
the randomness introduced by selecting object bandwidths from an
empirical distribution has increased this fractionally above 8, which
of course must be rounded to the next highest integer, 9. This also
1. Note that these files will still need to be stored on the video server since the various FES's may be caching different objects at any time, but their bandwidth requirement
should be very small.

Details of System Design Procedure 279
accounts for the fact that SSBF has considerable wasted resources
even though it achieves a packing which matches the lower bound.
These wasted resources come about because only fractionally more
that 8 arrays were required. This unused bandwidth and capacity
can be used to store new videos as they are released or to store addi
tional copies of the most popular titles to increase redundancy.
Table C.4 Packing performance of various heuristics for VS
Lower Bound
Bins Required
% wasted capacity
% wasted bandwidth
Heuristic
FF
9
12
36.9
33.4
FFGAR
9
12
36.9
33.4
SSBF
9
9
15.8
11.1
It is impractical to show the allocation of all 1,000 objects in this
case. The majority of the free space, however, is on the final array
with 8 5 % of the bandwidth and 99% of the capacity on this array
available for use by other objects (new releases etc.). Clearly, this is
preferable to having the unused resources spread in small sections
across all arrays where it would remain wasted.