1970s-1980s apartment neighborhoods - montgomery …€¦ · houston housing market 0 10 20 30 40...
TRANSCRIPT
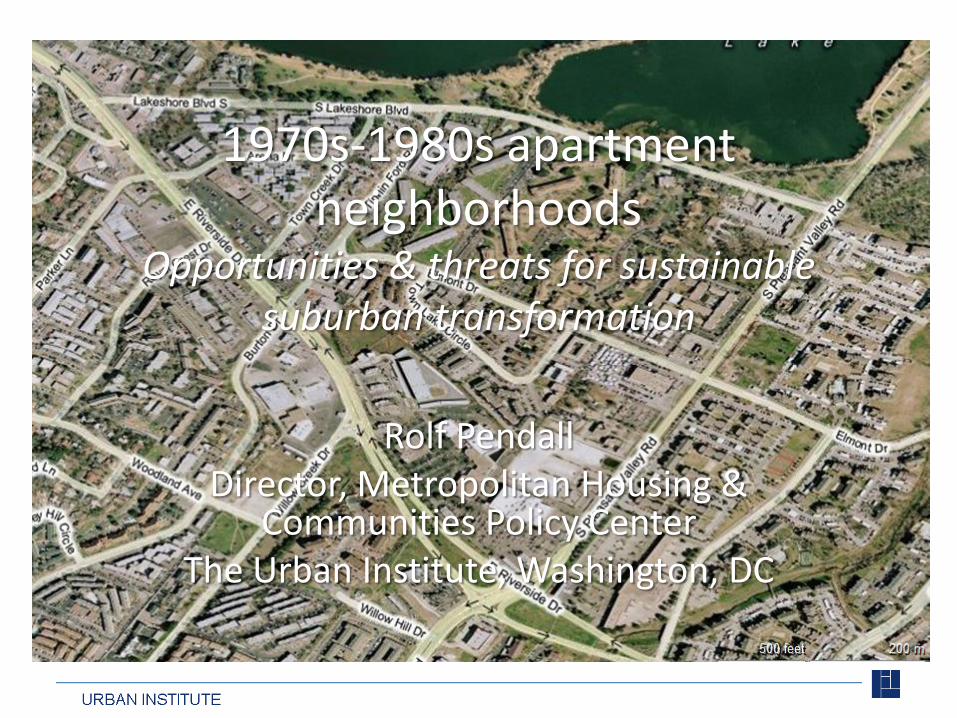
1970s-1980s apartment neighborhoods
Opportunities & threats for sustainable suburban transformation
Rolf PendallDirector, Metropolitan Housing &
Communities Policy CenterThe Urban Institute, Washington, DC
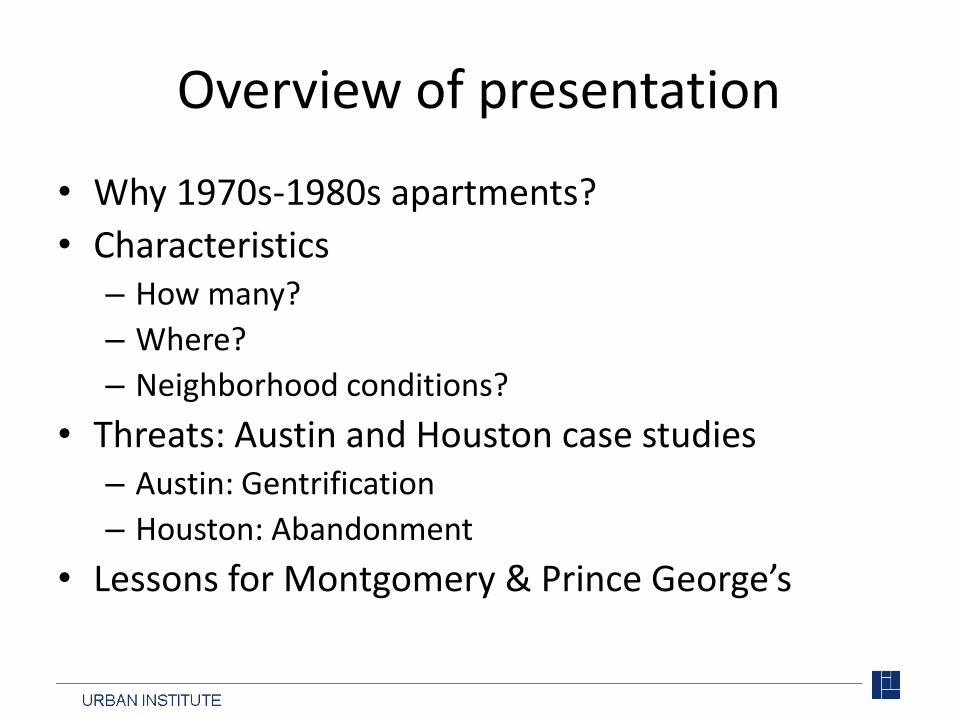
Overview of presentation
• Why 1970s-1980s apartments?
• Characteristics– How many?
– Where?
– Neighborhood conditions?
• Threats: Austin and Houston case studies– Austin: Gentrification
– Houston: Abandonment
• Lessons for Montgomery & Prince George’s

Why 1970s-1980s apartments?
• There are a lot of them.• Vulnerable people live there.• 2011 minus 1981 equals 30.
– All tax advantages have accrued to initial builders– Subsidies expiring to private owners– Major infrastructure needs reinvestment– Neighborhoods becoming more central
• Consequences:– In worst locations, neglect and concentration of
vulnerable populations– Susceptibility to private-sector urban renewal

0
100
200
300
400
500
600
700
800
900
1960 1970 1980 1990 2000 2010 2020
Tho
usa
nd
s o
f u
nit
s
Multifamily construction, 1968-2010
Source: U.S. Census Bureau, New Privately Owned Housing Units Completed, http://www.census.gov/const/compann.pdf , accessed 4-11-11.
Two big spikes

§̈§̈¦80
§̈§̈¦90
§̈§̈¦70
§̈§̈¦40
§̈§̈¦10
§̈§̈¦15
§̈§̈¦94
§̈§̈¦75
§̈§̈¦5
§̈§̈¦35
§̈§̈¦20
§̈§̈¦25
§̈§̈¦95
1970s-80s apartmentsas percent of 2000 housing stock
4 - 6
6 - 10
10 - 15
16 - 22
Sunbelt metros have the most
Source: U.S. Census Bureau, 2000 Census of Population and Housing, SF3

Signs of stress
0
5
10
15
20
25
Poverty rate Vacancy rate
Pct foreign born
Poverty rate Vacancy rate
Pct foreign born
2000 Change, 2000-2005/09
<20
>= 20
% of Y2K housing units that are
multi-family built in the 1970s-1980s
Source: U.S. Census Bureau, 2000 Census of Population and Housing, SF3; 2005-09 American Community Survey, tract-level data
Vulnerable people concentrate in neighborhoods with high concentrations of these apartments
Trends, 1: Redevelopment and gentrification (Austin example)
§̈¦35
§̈¦35
UV1
UV71
UV360
UV343
UV111
UV275
UV111
£¤290
£¤183
Barton Creek GreenbeltBarton Creek Greenbelt
BBaa
rr tt oonn CCrreeeekk
WWaa ll ll ee
rr CCrr ee
eekk
BBll uu
nnnn CC
rreeee
kk
WWiillll iiaamm
ssoonn CC rr ee eekk
SShhooaa
ll CCrr ee ee kk
CC aa rr ss oo nn CC rr ee eekk
TTaann
nneehhiillll BB
rraanncchh
CC oo uu nn tt rr yy CCll uu
bb CC rr ee ee kk
EEaasstt BB
oo uu llddiinn CCrr eeeekk
WW
ee ss tt BBoo uu ll dd
ii nn CC
rr eeeekk
LL ii tt tt ll ee BB ee ee CCrreeeekk
1970s-80s apartmentsas percent of 2000 housing stock
20 - 30
30 - 50
50 - 100 0 1 2 30.5 Miles

Plans: Mixed use TOD
Source: Elizabeth J. Mueller and Sarah Dooling, Sustainability and Vulnerability: Integrating equity into plans for central city redevelopment, forthcoming in Journal of Urbanism 2011.

£¤59
£¤90
£¤290
£¤69
£¤290
£¤90
£¤90
£¤290
£¤59
£¤59
£¤90
£¤59
£¤290
£¤90 £¤90
§̈¦10
§̈¦45
§̈¦610
§̈¦45
Big Thicket National PreserveBig Thicket National Preserve
1970s-80s apartmentsas percent of 2000 housing stock
4 - 6
6 - 10
10 - 15
16 - 22
20 - 30
30 - 50
50 - 100
Trends 2: Disinvestment + subsidized stabilization (Houston example)
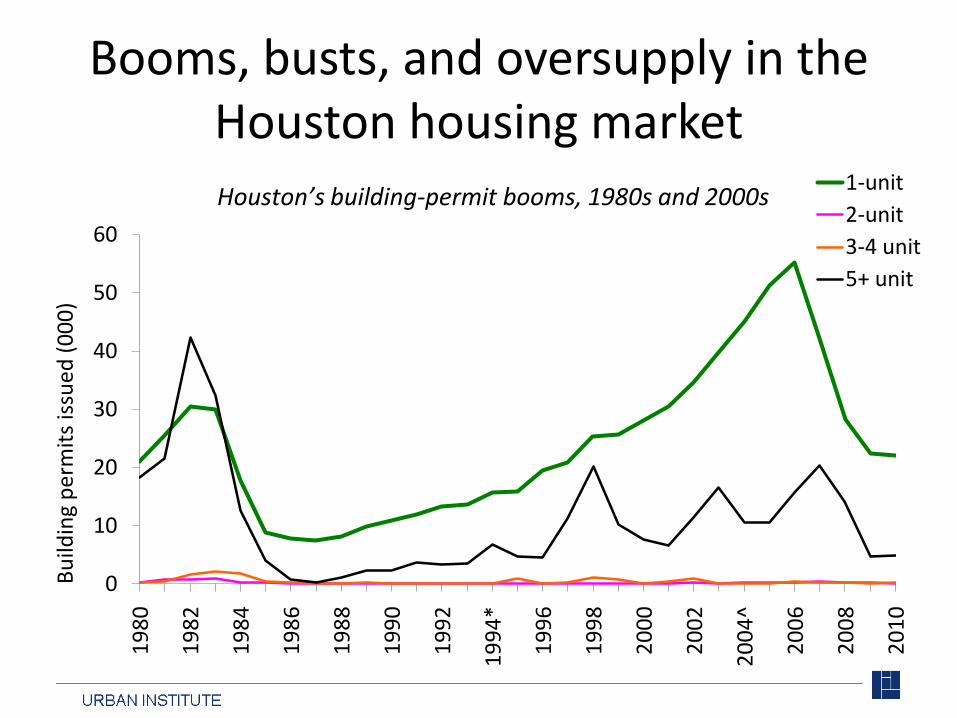
Booms, busts, and oversupply in the Houston housing market
0
10
20
30
40
50
60
19
80
19
82
19
84
19
86
19
88
19
90
19
92
19
94
*
19
96
19
98
20
00
20
02
20
04
^
20
06
20
08
20
10
Bu
ildin
g p
erm
its
issu
ed (
00
0)
1-unit
2-unit
3-4 unit
5+ unit
Houston’s building-permit booms, 1980s and 2000s
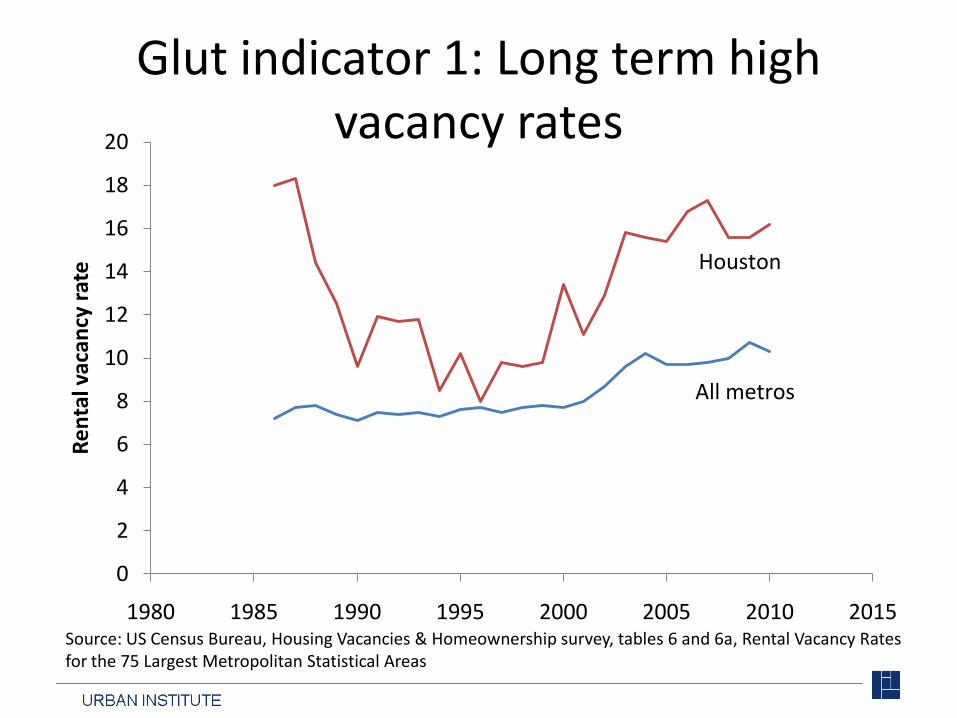
Glut indicator 1: Long term high vacancy rates
0
2
4
6
8
10
12
14
16
18
20
1980 1985 1990 1995 2000 2005 2010 2015
Re
nta
l vac
ancy
rat
e Houston
All metros
Source: US Census Bureau, Housing Vacancies & Homeownership survey, tables 6 and 6a, Rental Vacancy Rates for the 75 Largest Metropolitan Statistical Areas

Glut indicator 2: Long-term low rents (current dollars)
$0
$200
$400
$600
$800
$1,000
$1,200
$1,400
$1,600
$1,800
$2,000
1980 1985 1990 1995 2000 2005 2010 2015
HU
D F
air
Mar
ket
Re
nt,
2B
R a
par
tme
nt San Francisco
Oakland
Boston
Miami
Houston
Dallas
Detroit
Source: HUD Fair Market Rents, 2 bedroom; percentiles vary

Solutions for Houston?
• Code violations, abandonment– Especially acute, with vacancy, at locations just
beyond the I-610 loop
• Addressing with federal subsidies– 2006: “Apartments to Standard” program. HOME,
CDBG funds spent to rehab units in two or three targeted disinvestment areas
– 2008-11: HUD NSP and NSP3 funds targeted in part to same/similar areas
– Even the admin costs borne by federal taxpayers

What about the DC area?
• About 3 million housing units in 2000
– 300,000 of these are 1970s-1980s apartments
• Most are in Virginia and Maryland suburbs
– 82,000 in Prince George’s and Montgomery Counties alone
– Around 13% of the Y2K stock in the two counties is apartments built in the 1970s and 1980s

DC suburbs: More neighborhood choices for low-income, immigrants
0%
5%
10%
15%
20%
25%
30%
35%
40%
Housing Population Poverty Foreign-born
Pe
rce
nt
of
met
ro-a
rea
tota
l (2
00
5-0
9)
in
trac
ts w
ith
>2
0%
19
70
s-8
0s
apar
tme
nts
Austin Houston DC's MD suburbs DC's VA suburbs DC
DC suburbs’ housing, people about as concentrated in these
neighborhoods as Austin’s
DC suburbs’ low-income people, immigrants much
less so than Austin’s
Source: U.S. Census Bureau, 2000 Census of Population and Housing, SF3; 2005-09 American Community Survey, tract-level data

Washington
Arlington
Bethesda
Columbia
Bowie
Aspen Hill
Gaithersburg
Germantown
Silver Spring
Wheaton-Glenmont
Potomac
McLean
Olney
Rockville Colesville
North Laurel
Redland
Beltsville
Glenn Dale
Greenbelt
Fairland
North Bethesda
Chillum
Vienna
White Oak
Wolf Trap
Calverton
North Potomac
Tysons Corner
Kettering
Laurel
College Park
Adelphi
South Laurel
Montgomery Village
Savage-Guilford
Lanham-Seabrook
Elkridge
Greater Landover
Hyattsville
Takoma Park
Idylwood
East Riverdale
New Carrollton
Oakton
Langley Park
Travilah
Woodmore
Great Falls
Burtonsville
Jessup
Cloverly
Lake Arbor
Mitchellville
Darnestown
Ashton-Sandy Spring
West Laurel
Fort Meade
Goddard
Kemp Mill
Chevy Chase
Maryland City
Brookmont
Cheverly
Hillandale
Pimmit Hills
South Kensington
Glenarden
Riverdale Park
Rossmoor
Woodlawn
Forest Glen
Dunn Loring
North Kensington
Bladensburg Springdale
Largo
Mount Rainier
Seat Pleasant
Berwyn Heights
Brentwood
Carmody Hills-Pepper Mill Village
Friendship Village
Chesapeake and Ohio Canal NHPChesapeake and Ohio Canal NHP
Patuxent River State ParkPatuxent River State Park
1970s-80s apartmentsas percent of 2000 housing stock
20 - 30
30 - 50
50 - 100

Opportunities and challenges in Montgomery and Prince George’s
• Both: How to address exposure to CO, O3, VOCs?
• Montgomery– Acquisition for long-term affordability, especially in
“green zone”
– Protection from condo conversion (not an issue now)
– Eventual plans for renewal, densification (some areas)
• Prince George’s– Acquisition for deeper affordability and housing
quality in selected locations
– Code enforcement, rehab support everywhere

Conclusions
• This part of the housing portfolio has aged and may be in transition– Aging fastest in loose housing markets
• An especially important source of affordable housing and neighborhoods in the suburbs– Often pretty lousy conditions
• Prepare to respond with new housing/land use planning models– Beyond inclusionary zoning