19. detection of gas hydrate with downhole logs and assessment
TRANSCRIPT

Paull, C.K., Matsumoto, R., Wallace, P.J., and Dillon, W.P. (Eds.), 2000Proceedings of the Ocean Drilling Program, Scientific Results, Vol. 164
19. DETECTION OF GAS HYDRATE WITH DOWNHOLE LOGS AND ASSESSMENT OF GAS HYDRATE CONCENTRATIONS (SATURATIONS) AND GAS VOLUMES
ON THE BLAKE RIDGE WITH ELECTRICAL RESISTIVITY LOG DATA1
Timothy S. Collett2 and John Ladd3
ABSTRACT
Leg 164 of the Ocean Drilling Program was designed to investigate the occurrence of gas hydrate in the sedimentary sectionbeneath the Blake Ridge on the southeastern continental margin of North America. Sites 994, 995, and 997 were drilled on theBlake Ridge to refine our understanding of the in situ characteristics of natural gas hydrate. Because gas hydrate is unstable atsurface pressure and temperature conditions, a major emphasis was placed on the downhole logging program to determine thein situ physical properties of the gas hydrate–bearing sediments. Downhole logging tool strings deployed on Leg 164 includedthe Schlumberger quad-combination tool (NGT, LSS/SDT, DIT, CNT-G, HLDT), the Formation MicroScanner (FMS), and theGeochemical Combination Tool (GST).
Electrical resistivity (DIT) and acoustic transit-time (LSS/SDT) downhole logs from Sites 994, 995, and 997 indicate thepresence of gas hydrate in the depth interval between 185 and 450 mbsf on the Blake Ridge. Electrical resistivity log calcula-tions suggest that the gas hydrate–bearing sedimentary section on the Blake Ridge may contain between 2 and 11 percent bulkvolume (vol%) gas hydrate. We have determined that the log-inferred gas hydrates and underlying free-gas accumulations onthe Blake Ridge may contain as much as 57 trillion m3 of gas.
INTRODUCTION
Gas hydrates are crystalline substances composed of water andgas, in which a solid water lattice accommodates gas molecules in acage-like structure, or clathrate. Gas hydrates are widespread in per-mafrost regions and beneath the sea in sediment of outer continentalmargins. While methane, propane, and other gases can be included inthe clathrate structure, methane hydrate appears to be the most com-mon in nature (Kvenvolden, 1988). The amount of methane seques-tered in gas hydrate is probably enormous, but estimates of theamounts are speculative and range over three orders of magnitudefrom about 3,114 to 7,634,000 trillion m3 (reviewed by Kvenvolden,1993). The amount of gas in the hydrate accumulations of the worldgreatly exceeds the volume of known conventional gas reserves. Gashydrates also represent a significant drilling and production hazard.Russian, Canadian, and American researchers have described numer-ous problems associated with gas hydrate, including blowouts andcasing failures (reviewed by Yakushev and Collett, 1992). Recentstudies indicate that atmospheric methane, a greenhouse gas, isincreasing at a rate such that the current concentration will probablydouble in the next 50 years (Kvenvolden, 1988). Because methane is21 times more radiatively active than carbon dioxide, it is predictedthat methane will surpass carbon dioxide as the predominant atmo-spheric greenhouse gas in the second half of the next century. Thesource of this atmospheric methane is uncertain; however, numerousresearchers have suggested that destabilized natural-gas hydrate maybe contributing to the build-up of atmospheric methane (reviewed byKvenvolden, 1988).
One of the fundamental problems that links the gas hydrateresource, hazard, and climate issues is the need for accurate assess-
1Paull, C.K., Matsumoto, R., Wallace, P.J., and Dillon, W.P. (Eds.), 2000. Proc.ODP, Sci. Results, 164: College Station, TX (Ocean Drilling Program).
2U.S. Geological Survey, Denver Federal Center, Box 25046, MS-939, Denver, CO80225, U.S.A. [email protected]
3Lamont-Doherty Earth Observatory, RT 9W, Palisades, NY 10964, U.S.A.
ments of the gas volumes within gas hydrate accumulations. Most ofthe published gas hydrate resource estimates have of necessity beenmade by broad extrapolation of only general knowledge of local geo-logic conditions. Gas volumes that may be attributed to gas hydrate aredependent on a number of reservoir parameters, including the areal ex-tent of the gas-hydrate occurrence, reservoir thickness, reservoir po-rosity, and the degree of gas-hydrate saturation (Collett, 1993). Twoof the most difficult reservoir parameters to determine are porosity andthe degree of gas-hydrate saturation. Well logs often serve as a sourceof porosity and hydrocarbon saturation data; however, downhole-logcalculations within gas hydrate–bearing intervals are subject to error.The primary reason for this difficulty is the lack of previous quantita-tive laboratory and field calibration studies.
Leg 164 of the Ocean Drilling Program (ODP) was designed toinvestigate the occurrence of gas hydrate on the Blake Ridge (Paull,Matsumoto, Wallace, et al., 1996). The presence of gas hydrate in thisarea has long been suspected because of seismic reflection data show-ing a strong bottom-simulating reflector (BSR), which often repre-sents the interface between gas hydrate–bearing sediments and under-lying gas-charged sediments. Sites 994, 995, and 997 were drilled onthe Blake Ridge to refine our understanding of the in situ characteris-tics of natural gas hydrate. During Leg 164, a major emphasis wasplaced on the downhole logging program to obtain critical informationabout the in situ nature of gas hydrate on the Blake Ridge.
The primary objectives of this report are to document the variousdownhole log responses to the occurrence of gas hydrate on the BlakeRidge and to use the downhole electrical resistivity log data fromSites 994, 995, and 997 to assess the concentration (saturation) andvolume of gas hydrate and associated free gas on the Blake Ridge.This report begins with a technical overview of previous gas hydratedownhole log studies and a review of the known responses of down-hole logs to the presence of gas hydrate. The main body of the reportdeals with the development and utilization of quantitative downholelog evaluation techniques used to calculate the degree of gas-hydratesaturation within the known and logged gas hydrate occurrences onthe Blake Ridge. This report concludes with an estimate of the poten-tial volume of gas associated with the downhole log–inferred gashydrate occurrences on the Blake Ridge.
179

T.S. COLLETT, J. LADD
PREVIOUS GAS HYDRATE DOWNHOLE LOG STUDIES
Gas hydrate has been inferred to occur at about 50 locationsthroughout the world (reviewed by Kvenvolden, 1988). Previous toLeg 164, however, gas hydrate had been sampled and surveyed withdownhole logging devices at only three locations: (1) North Slope ofAlaska (Collett, 1993), (2) Middle-America Trench off the Pacificcoast of Guatemala (Shipboard Scientific Party, 1985), and (3) Cas-cadia continental margin off the Pacific coast of Canada (ShipboardScientific Party, 1994). The downhole log data from the North Slopeof Alaska and Middle-America trench have been the focus of severalpublished studies (Collett et al., 1984; Mathews, 1986; Collett,1993); however, the available downhole log data from the Cascadiacontinental margin have not been examined in detail. In the next sec-tion of this report, we have reviewed the results of the completed gashydrate downhole log studies in northern Alaska and offshore Guate-mala.
North Slope of Alaska Gas Hydrate Occurrence
The only confirmed gas hydrate occurrence on the North Slope ofAlaska was obtained in 1972, when a core containing this substancewas recovered from a depth of about 657 m in the Northwest EileenState-2 well (Collett, 1993). The confirmed gas hydrate occurrence inthe Northwest Eileen State-2 well is characterized by relatively highelectrical resistivities and acoustic velocities. In Collett et al., (1984)it was assumed that a Pickett crossplot could be used to determine thedegree of gas-hydrate saturation in a gas hydrate– and water-bearingrock unit. The accuracy of this procedure to determine gas-hydratesaturation is not known. In Collett (1993), a series of Pickett cross-plots were used to calculate gas-hydrate saturations in four gas-hydrate occurrences overlying the Prudhoe Bay and Kuparuk Riveroil fields on the North Slope of Alaska. Mathews (1986) also used thePickett crossplot technique to estimate gas-hydrate saturations in theNorthwest Eileen State-2 well.
The confirmed gas-hydrate occurrence in the Northwest EileenState-2 well presents itself as an ideal starting point for the develop-ment of gas-hydrate downhole-log evaluation techniques. The re-sponses of the commonly available downhole logs within the con-firmed gas-hydrate interval of the Northwest Eileen State-2 well aresummarized below (modified from Collett, 1983).
1. Electrical Resistivity (Dual Induction) Log: there is a relative-ly high electrical-resistivity deflection on this log in a gas-hydrate zone, compared to that in a water-saturated horizon.
2. Spontaneous Potential (SP): there is a relatively lower (lessnegative) spontaneous-potential deflection in a gas hydrate–bearing zone when compared to that associated with a free-gaszone.
3. Caliper Log: the caliper log in a hydrate usually indicates anoversized borehole resulting from spalling associated withgas-hydrate decomposition.
4. Acoustic Transit-Time Log: within a gas hydrate there is adecrease in acoustic transit time in comparison to a unit satu-rated with either water or free gas.
5. Neutron Porosity: in a gas hydrate there is a slight increase inthe neutron porosity; this response contrasts with the apparentreduction in neutron porosity in a free-gas zone.
6. Density Log: within a gas hydrate there is a slight decrease indensity compared to a unit saturated with water.
In most gas hydrate studies, only two downhole logging devicesare consistently used to identify potential gas hydrate: they are theelectrical resistivity and acoustic transit-time logs.
180
DSDP Site 570 Gas Hydrate Occurrence
In 1982, while conducting research coring operations on Leg 84of the Deep Sea Drilling Project (DSDP), a 1.05-m-long core of mas-sive gas hydrate was recovered at Site 570 in the Middle-AmericaTrench off the Pacific coast of Guatemala. The cored gas hydratesample was determined to be from the interval between 247.4 and251.4 m sub-bottom depth. Downhole log surveys indicated that theactual thickness of the massive gas hydrate occurrence was about 3to 4 m (Mathews, 1986). The massive gas hydrate was characterizedby high electrical resistivities (~155 Ωm), high acoustic transit-timevelocities (~3.6 km/s), high neutron porosities (~67%), and lowapparent densities (~1.05 g/cm3).
Mathews (1986) estimated the amount of methane gas within thegas hydrate occurrences at Site 570 by using a log normalizationtechnique. At Site 570, the resistivity log “plateaus” in the massivegas hydrate zone, indicating a 100% gas-hydrate saturated interval.Mathews (1986) normalized the resistivity data and assumed that avalue of 1.0 indicates a 100% pure gas hydrate. Therefore, any devi-ation from 1.0 indicates that gas hydrate has been replaced by rockmatrix material and/or formation water.
REGIONAL GEOLOGY
The Atlantic continental margin of the United States is a classic“passive” margin and is generally used as an example of a geologicfeature developed during continental rifting (Bally, 1981). Duringrifting of North America from North Africa and subsequent subsid-ence, a thick wedge of Mesozoic and Cenozoic sediments built outonto the subsiding continental margin. Major deltaic systems pro-graded across the continental shelf, which occasionally were inter-rupted by more open-marine conditions. Carbonate reefs and micriticlimestone buildups marked the shelf-slope break. The major sedi-mentary basins along the Atlantic Margin are generally elongatedparallel to the present-day coast and most contain more than 10,000m of sediment. The major basins include the Scotian, Georges Bank,Baltimore Canyon Trough, Carolina Trough, and Blake Plateau.North of the Carolinas, the continental margin above 2000-m bathy-metric depth is less than 150 km wide, whereas to the south, into theFlorida-Bahama region, the continental margin broadens to about500 km. Beneath this broad continental shelf region are located theCarolina Trough and Blake Plateau Basin, which is bounded to thenortheast by the Blake Ridge (Fig. 1). For a more complete descrip-tion of the geology of the Blake Ridge see the review by Dillon andPopenoe (1988).
Seismic profiles along the Atlantic Margin are often marked bylarge-amplitude bottom simulating reflectors (BSRs) (Dillon et al.,1993; Lee et al., 1993), which in this region are believed to be causedby a large acoustic impedance contrast at the base of the gas-hydratestability zone that juxtaposes sediments containing gas hydrate withsediments containing free gas. BSRs have been extensively mappedat two locations off the east coast of the United States—along thecrest of the Blake Ridge and beneath the upper continental rise ofNew Jersey and Delaware (Tucholke et al., 1977; Dillon et al., 1993).The Blake Ridge is a positive topographic sedimentary feature on thecontinental slope and rise of the United States (Fig. 1). The crest ofthe ridge extends approximately perpendicular to the general trend ofthe continental rise for more than 500 km to the southwest from waterdepths of 2000 to 4800 m. The Blake Ridge is thought to be a largesediment drift that was built upon transitional continental to oceaniccrust by the complex accretion of marine sediments deposited by lon-gitudinal drift currents (Tucholke et al., 1977). The Blake Ridge con-sists of Tertiary to Quaternary sediments of hemipelagic muds andsilty clay (Paull, Matsumoto, Wallace, et al., 1996). The thickness of

DETECTION OF GAS HYDRATE WITH DOWNHOLE LOGS
the methane-hydrate stability zone in this region ranges from zeroalong the northwestern edge of the continental shelf to a maximumthickness of about 700 m along the eastern edge of the Blake Ridge(Collett, 1995). The first direct evidence that gas hydrate might bepresent along the Atlantic Margin was found during deep-sea drillingon the Blake Ridge in 1970 (Shipboard Scientific Party, 1972). Cores
82°W 80° 78° 76° 74° 72°26°
28°
30°
32°
34°N
Miami
Charleston
Savannah
BlakePlateau
Contin
enta
l
Shelf
BlakeRidge
996
10050
0
1000
2000
4000
5000
994, 995, 997
991, 992, 993
Figure 1. Physiographic map of the southeastern continental margin of NorthAmerica. Location of Leg 164 drill sites are indicated. Also shown is the area(horizontally shaded area) where gas hydrate occurrence has been mapped onthe basis of bottom-simulating reflectors (BSRs). Bathymetric contours arein meters.
recovered from DSDP Sites 102, 103, and 104 contained large quan-tities of methane, which suggested the presence of gas hydrate. Inaddition, measured acoustic velocities (>2 km/s) within the suspectedgas hydrate–bearing section exceeded normal marine sedimentvelocities, indicating the presence of gas hydrate. The occurrence ofgas hydrate on the Blake Ridge was confirmed during Leg 76 of theDSDP when a sample of gas hydrate was recovered from a sub-bottom depth of 238 m at Site 533 (Shipboard Scientific Party, 1983).
Leg 164 of the ODP (Paull, Matsumoto, Wallace, et al., 1996) wasthe first drilling leg dedicated to the research of natural gas hydrate(Fig. 1). Sites 994, 995, and 997 compose a transect of holes that pen-etrate below the base of gas hydrate stability within the same strati-graphic interval over a relatively short distance (9.6 km). Thistransect of holes on the Blake Ridge extends from an area where aBSR is not detectable to an area where an extremely well-developedand distinct BSR exists (Fig. 2). A BSR is not observed at Site 994, amodest BSR occurs at 995, and a strong BSR is seen at Site 997.However, the geology and topography along this transect are rela-tively simple (Paull, Matsumoto, Wallace, et al., 1996), which pro-vides an opportunity to assess the basic properties of gas hydrate–bearing sediments and to understand lateral variations caused by lo-cal lithologic, chemical, and hydrologic factors. Because drilling atall three sites on the Blake Ridge penetrated below the base of gas hy-drate stability, they provide critical information on the amounts ofgas and gas hydrate in the sediments as well as the nature of the BSRitself.
DOWNHOLE LOGGING PROGRAM
Logging tool strings deployed on Leg 164 (Table 1) included theSchlumberger quad- and split-combination (NGT, LSS-SDT, DITE,CNT-G, HLDT), Formation MicroScanner (FMS), and the Geochem-
BSR
TW
O-W
AY T
RA
VE
LTIM
E (
s)
SSW NNE
0 1 2 3 4 5 KM
Site 997Site 995Site 994
3.8
4.0
4.2
4.4
4.6
Figure 2. Seismic profile along which Sites 994, 995, and 997 are located. Note that Site 994 is not associated with a distinct BSR, although a very strong BSRoccurs at Sites 995 and 997.
181
T.S. COLLETT, J. LADD
ical Combination Tool (GLT). The split-combination tool string con-sisted of separate runs of the seismic stratigraphic and lithoporositycombinations (Paull, Matsumoto, Wallace, et al., 1996).
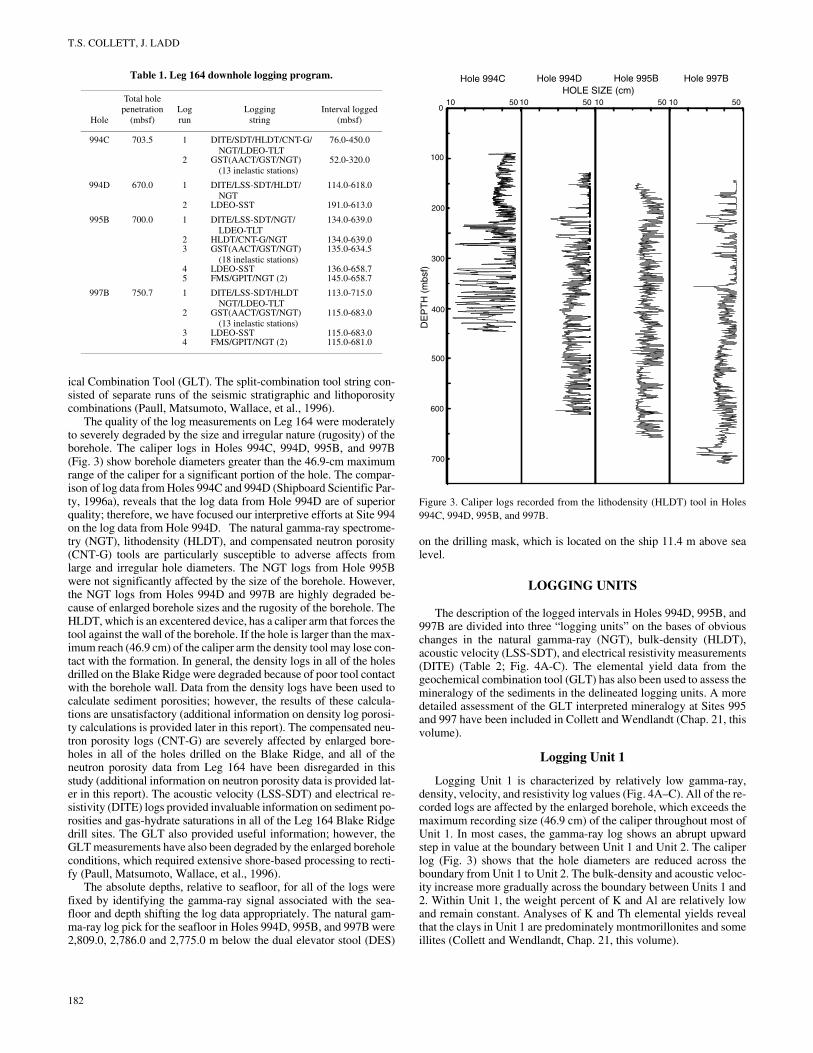
The quality of the log measurements on Leg 164 were moderatelyto severely degraded by the size and irregular nature (rugosity) of theborehole. The caliper logs in Holes 994C, 994D, 995B, and 997B(Fig. 3) show borehole diameters greater than the 46.9-cm maximumrange of the caliper for a significant portion of the hole. The compar-ison of log data from Holes 994C and 994D (Shipboard Scientific Par-ty, 1996a), reveals that the log data from Hole 994D are of superiorquality; therefore, we have focused our interpretive efforts at Site 994on the log data from Hole 994D. The natural gamma-ray spectrome-try (NGT), lithodensity (HLDT), and compensated neutron porosity(CNT-G) tools are particularly susceptible to adverse affects fromlarge and irregular hole diameters. The NGT logs from Hole 995Bwere not significantly affected by the size of the borehole. However,the NGT logs from Holes 994D and 997B are highly degraded be-cause of enlarged borehole sizes and the rugosity of the borehole. TheHLDT, which is an excentered device, has a caliper arm that forces thetool against the wall of the borehole. If the hole is larger than the max-imum reach (46.9 cm) of the caliper arm the density tool may lose con-tact with the formation. In general, the density logs in all of the holesdrilled on the Blake Ridge were degraded because of poor tool contactwith the borehole wall. Data from the density logs have been used tocalculate sediment porosities; however, the results of these calcula-tions are unsatisfactory (additional information on density log porosi-ty calculations is provided later in this report). The compensated neu-tron porosity logs (CNT-G) are severely affected by enlarged bore-holes in all of the holes drilled on the Blake Ridge, and all of theneutron porosity data from Leg 164 have been disregarded in thisstudy (additional information on neutron porosity data is provided lat-er in this report). The acoustic velocity (LSS-SDT) and electrical re-sistivity (DITE) logs provided invaluable information on sediment po-rosities and gas-hydrate saturations in all of the Leg 164 Blake Ridgedrill sites. The GLT also provided useful information; however, theGLT measurements have also been degraded by the enlarged boreholeconditions, which required extensive shore-based processing to recti-fy (Paull, Matsumoto, Wallace, et al., 1996).
The absolute depths, relative to seafloor, for all of the logs werefixed by identifying the gamma-ray signal associated with the sea-floor and depth shifting the log data appropriately. The natural gam-ma-ray log pick for the seafloor in Holes 994D, 995B, and 997B were2,809.0, 2,786.0 and 2,775.0 m below the dual elevator stool (DES)
Table 1. Leg 164 downhole logging program.
Hole
Total hole penetration
(mbsf)Log run
Loggingstring
Interval logged(mbsf)
994C 703.5 1 DITE/SDT/HLDT/CNT-G/NGT/LDEO-TLT
76.0-450.0
2 GST(AACT/GST/NGT) (13 inelastic stations)
52.0-320.0
994D 670.0 1 DITE/LSS-SDT/HLDT/NGT
114.0-618.0
2 LDEO-SST 191.0-613.0
995B 700.0 1 DITE/LSS-SDT/NGT/LDEO-TLT
134.0-639.0
2 HLDT/CNT-G/NGT 134.0-639.03 GST(AACT/GST/NGT)
(18 inelastic stations)135.0-634.5
4 LDEO-SST 136.0-658.75 FMS/GPIT/NGT (2) 145.0-658.7
997B 750.7 1 DITE/LSS-SDT/HLDT NGT/LDEO-TLT
113.0-715.0
2 GST(AACT/GST/NGT) (13 inelastic stations)
115.0-683.0
3 LDEO-SST 115.0-683.04 FMS/GPIT/NGT (2) 115.0-681.0
182
on the drilling mask, which is located on the ship 11.4 m above sealevel.
LOGGING UNITS
The description of the logged intervals in Holes 994D, 995B, and997B are divided into three “logging units” on the bases of obviouschanges in the natural gamma-ray (NGT), bulk-density (HLDT),acoustic velocity (LSS-SDT), and electrical resistivity measurements(DITE) (Table 2; Fig. 4A-C). The elemental yield data from thegeochemical combination tool (GLT) has also been used to assess themineralogy of the sediments in the delineated logging units. A moredetailed assessment of the GLT interpreted mineralogy at Sites 995and 997 have been included in Collett and Wendlandt (Chap. 21, thisvolume).
Logging Unit 1
Logging Unit 1 is characterized by relatively low gamma-ray,density, velocity, and resistivity log values (Fig. 4A–C). All of the re-corded logs are affected by the enlarged borehole, which exceeds themaximum recording size (46.9 cm) of the caliper throughout most ofUnit 1. In most cases, the gamma-ray log shows an abrupt upwardstep in value at the boundary between Unit 1 and Unit 2. The caliperlog (Fig. 3) shows that the hole diameters are reduced across theboundary from Unit 1 to Unit 2. The bulk-density and acoustic veloc-ity increase more gradually across the boundary between Units 1 and2. Within Unit 1, the weight percent of K and Al are relatively lowand remain constant. Analyses of K and Th elemental yields revealthat the clays in Unit 1 are predominately montmorillonites and someillites (Collett and Wendlandt, Chap. 21, this volume).
0
200
400
600
HOLE SIZE (cm)
DE
PT
H (
mbs
f)
Hole 994C Hole 994D Hole 995B Hole 997B
100
300
500
700
10 50 10 50 10 50 10 50
Figure 3. Caliper logs recorded from the lithodensity (HLDT) tool in Holes994C, 994D, 995B, and 997B.

DETECTION OF GAS HYDRATE WITH DOWNHOLE LOGS
Logging Unit 2
Logging Unit 2 is characterized by increasing velocities (1.65km/s at the top to over 2.0 km/s at the bottom) with depth. The natu-ral gamma-ray and bulk-density logs are nearly constant throughoutUnit 2. Both the acoustic velocity and resistivity logs are character-ized by a distinct baseline shift to relatively higher values throughoutUnit 2. The resistivity logs reveal several conspicuous high electricalresistivity intervals near the top of Unit 2 in all three boreholes. Atthe base of Unit 2, across the boundary into Unit 3, the acousticvelocity and resistivity logs step down to lower values. In Hole 997B(Fig. 4C), the acoustic log (DTLF) has been used to precisely select
Table 2. Depth to the top and bottom of the downhole log identified log-ging units in Holes 994D, 995B, and 997B (See Fig. 4A–C).
HoleLogging
unit
Depth to top of logging unit
(mbsf)
Depth to bottom of logging unit
(mbsf)
994D 1 Base of pipe (114.0) 212.02 212.0 428.83 428.8 End of log (618.0)
995B 1 Base of pipe (134.0) 193.02 193.0 450.03 450.0 End of log (658.7)
997B 1 Base of pipe (113.0) 186.42 186.4 450.93 450.9 End of log (715.0)
a depth for the boundary between Units 2 and 3. This acoustic veloc-ity (DTLF) boundary does not exactly match the drop in resistivityobserved near the base of Unit 2. This discrepancy of about 8 m islikely a result of the presence of a significant amount of free gasbelow the deepest gas hydrate occurrence. Analyses of K and Th el-emental yields suggest that the clays in logging Unit 2 are mostlymontmorillonites (Collett and Wendlandt, Chap. 21, this volume).
Logging Unit 3
Logging Unit 3 is characterized by consistently lower velocitiesand resistivities with respect to Unit 2. Anomalous low-velocityintervals are seen in Unit 3; velocities within these anomalous inter-vals decrease to below 1.5 km/s, which suggests the presence of freegas. The higher resistivities, near the boundary between Units 2 and3 in Hole 997B, may be a result of the presence of free gas, whichsupports the acoustic log observations. In logging Unit 3, the naturalgamma-ray, density, and electrical resistivity logs show slightincreases with depth, which is characteristic of a normally compact-ing sedimentary section.
GAS HYDRATE OCCURRENCES
The presence of gas hydrate at Sites 994 and 997 was documentedby direct sampling; however no gas hydrate was conclusively identi-fied at Site 995 (Shipboard Scientific Party, 1996b). Although a BSR
0
200
400
600
Hole 994D
DE
PT
H (
mbs
f)
GAMMA RAY BULK DENSITY VELOCITY RESISTIVITY
100
300
500
700
30 80 1.1 1.9 1.5 1.9 0.7 1.6API g/cm3 km/s Ωm
Unit 1
Unit 2
Unit 3
R l
ine
o
A Hole 995B
GAMMA RAY BULK DENSITY VELOCITY RESISTIVITY30 80 1.1 1.9 1.5 1.9 0.7 1.6API g/cm3 km/s Ωm
Unit 1
Unit 2
Unit 3
R l
ine
o
B
Figure 4. A. Downhole log data from Hole 994D. Data shown include the natural gamma-ray log from the NGT, bulk-density data from the HLDT, acousticvelocity data from the LSS-SDT, and deep-reading electrical resistivity data from the DITE. Also shown are the depths of logging Units 1, 2, and 3 (Table 2) andthe projected Ro baseline. B. Downhole log data from Hole 995B. Data shown include the natural gamma-ray log from the NGT, bulk-density data from theHLDT, acoustic velocity data from the LSS-SDT, and deep-reading electrical resistivity data from the DITE. Also shown are the depths of logging Units 1, 2,and 3 (Table 2) and the projected Ro baseline. (Continued on next page.)
183

T.S. COLLETT, J. LADD
does not occur in the seismic reflection profiles that cross Site 994,several pieces of gas hydrate were recovered from 259.90 mbsf inHole 994C and disseminated gas hydrate was observed at almost thesame depth in Hole 994D. One large, solid piece (about 15 cm long)of gas hydrate was also recovered from about 331 mbsf at Site 997(Hole 997A). Despite these limited occurrences of gas hydrate, it wasinferred, based on geochemical core analyses and downhole loggingdata, that disseminated gas hydrate occur in logging Unit 2 (whichextends from a depth of about 190 to 450 mbsf) of all the holes drilledon the Blake Ridge (Table 2). The presence of gas hydrate in loggingUnit 2 at Sites 994, 995, and 997 was inferred on the basis of the fol-lowing observations (Shipboard Scientific Party, 1996a, 1996b,1996c). (1) Cores from all three sites were observed to evolve largeamounts of gas, which is indicative of gas hydrate–bearing cores. Itis also speculated that gas evolution from decomposing gas hydratemay have been a factor that contributed to the low core recovery atall the Blake Ridge drill sites. (2) Pressure-coring (PCS) data indicatethat the sediments on the Blake Ridge between about 200 and 450mbsf contain methane concentrations that exceed expected methanepore-water saturations. The only known source for this methane is thedecomposition of gas hydrate; thus, it was concluded that gas hydratemust occur within this interval of over-saturated gas. (3) Both thegeneral trend of the interstitial-water chloride concentrations and theinter-sample variation in chloride concentrations (chloride anoma-lies) between 190 and 450 mbsf suggest the presence of gas hydratethroughout logging Unit 2. Gas-hydrate decomposition during corerecovery releases water and methane into the interstitial pores, result-
0
200
400
600
Hole 997BD
EP
TH
(m
bsf
)
GAMMA RAY BULK DENSITY VELOCITY RESISTIVITY
100
300
500
700
30 80 1.1 1.9 0.9 2.2 0.7 1.9API g/cm3 km/s Ωm
Unit 1
Unit 2
Unit 3
R lin
eo
C
Figure 4 (continued). C. Downhole log data from Hole 997B. Data showninclude the natural gamma-ray log from the NGT, bulk-density data from theHLDT, acoustic velocity data from the LSS-SDT, and deep-reading electricalresistivity data from the DITE. Also shown are the depths of logging Units 1,2, and 3 (Table 2) and the projected Ro baseline.
184
ing in a freshening of the pore waters. (4) Temperatures of cores re-covered on the Blake Ridge transect were quite variable within log-ging Unit 2. Low-temperature anomalies are interpreted as indicatingareas where gas hydrate decomposition has occurred during core re-covery. (5) Data from downhole logs also were interpreted as indicat-ing the presence of gas hydrate in logging Unit 2. The downhole logevidence for gas hydrate is discussed in more detail later in this re-port.
The depths to the top and the base of the zone of gas-hydrate occur-rence at Sites 994, 995, and 997 were determined using interstitial-water chloride anomalies (Shipboard Scientific Party, 1996a, 1996b,1996c) and downhole log data (Table 2). Interstitial-water chlorideanomalies established whether gas hydrate occurred within a givencore sample. The observed chloride anomalies also allow the amountof gas hydrate to be established by calculating the amount of interstitial-water freshening that can be attributed to gas hydrate disassociation.The estimated volume percentage of gas hydrate in the recovered coreshad a skewed distribution, ranging from a maximum of about 7.0 and8.4 vol% at Sites 994 and 995 to a maximum of about 13.6 vol% at Site997 (Fig. 5). However, these are minimum estimates because the base-line (undisturbed interstitial-water chlorinities) used to calculate thesevalues may be lower than the actual in situ interstitial-water salinities.For a more complete discussion on the chlorinity-calculated gas hy-drate contents, see Paull, Matsumoto, Wallace, et al. (1996).
As previously discussed, natural gas hydrate occurrences are gen-erally characterized by an increase in log-measured acoustic veloci-ties and electrical resistivities. The comparison of logging Units 1, 2,and 3 in all three holes on the Blake Ridge (Holes 994D, 995B, and997B), reveal that logging Unit 2 is characterized by a distinct step-wise increase in both electrical resistivity (increase of about 0.1–0.3Ωm) and acoustic velocity (increase of about 0.1-0.2 km/s) (Fig. 4A–C). In addition, the deep reading resistivity device (RILD) revealsseveral anomalous high resistivity zones within the upper 100 m ofUnit 2 at all three sites on the Blake Ridge (anomalous resistivitiesranging from 1.4 to 1.5 Ωm). At Site 994, gas hydrate was recovered(depth 259.90 mbsf) from the same interval that exhibits anomaloushigh resistivities in the upper part of Unit 2. Further comparisons in-dicate that the anomalous high resistivity zones do not correlate toany apparent acoustic velocity anomalies at Sites 994 or 995. How-ever, at Site 997 the anomalous high resistivity zones in the upperpart of Unit 2 are characterized by an acoustic velocity increase ofabout 0.3 km/s. The zone from which gas hydrate was recovered atSite 997 (depth of about 331 mbsf in Hole 997A) is also characterizedby anomalous high resistivities and acoustic velocities. At Site 994,
0
200
400
600
GAS-HYDRATE SATURATION (%)SITE 994 SITE 995 SITE 997
DE
PT
H (
mbs
f)
0 4 8 12 4 8 12 0 8 16 24
Gashydrate
0
Figure 5. Plot of gas-hydrate saturations (percent of pore space occupied bygas hydrate) calculated from interstitial water chlorinities, assuming that thechloride anomalies at each site (Sites 994, 995, and 997) are solely producedby gas-hydrate decomposition during core recovery (modified from Paull,Matsumoto, Wallace, et al., 1996).

DETECTION OF GAS HYDRATE WITH DOWNHOLE LOGS
below the anomalous high resistivity zones at 216 and 264 mbsf, theresistivity log values are almost constant throughout logging Unit 2,whereas the acoustic velocities increase with depth over the sameinterval. However, both electrical resistivities and acoustic velocitiesin Unit 2 increase with depth at Sites 995 and 997. Examination ofthe natural gamma-ray and bulk-density logs from all three sites (Fig.4A–C) reveals no apparent lithologic causes for the observed velocityand resistivity increases in Unit 2. The above observations are con-sistent with a material of increased resistivity and acoustic velocitybut similar density, partially replacing some of the pore water in Unit2. The depth of the boundary between logging Units 2 and 3 on theBlake Ridge is in rough accord with the predicted base of the methanehydrate stability zone and it is near the lowest depth of the observedinterstitial-water chlorinity anomaly (Fig. 5). It has been concludedthat logging Unit 2 at Sites 994, 995, and 997 contains some amountof gas hydrate.
POROSITY CALCULATIONS
Sediment porosities can be determined from analyses of recov-ered cores and from numerous borehole log measurements (reviewedby Serra, 1984). At Sites 994, 995, and 997 we have attempted to usedata from the lithodensity (HLDT), neutron porosity (CNT-G), andelectrical resistivity (DITE) logs to calculate sediment porosities.Core-derived physical property data, including porosities (ShipboardScientific Party, 1996a, 1996b, 1996c), have been used to both cali-brate and evaluate the log-derived sediment porosities.
Core Porosities
On Leg 164, water content, wet bulk density, dry bulk density,and grain density were routinely determined from recovered sedi-ment cores. Other related physical property data, including sedimentporosities, were calculated from these “index properties” (Paull, Mat-sumoto, Wallace, et al., 1996). The core-derived porosities actuallyrepresent the measured total water content of the sediments, whichinclude interlayer, bound, and free water. Most downhole logs alsomeasure the total water content of the sediments; thus the core- andlog-derived sediment porosities should be the same. Sediment coreporosities determined from Sites 994, 995, and 997 are shown in Fig-ure 6. In general, the core-derived sediment porosities decrease fromabout 80% near the top of each hole to about 50% at the bottom.
Density Log Porosities
The HLDT log measurements of bulk density in Holes 994D,995B, and 997B (Fig. 4A-C) are highly variable and range from amaximum of about 1.9 g/cm3 to a minimum value of about 1.2 g/cm3.Other physical property data from the Blake Ridge, including core-derived sediment wet bulk densities and porosities (Fig. 6) (Ship-board Scientific Party, 1996a, 1996b, 1996c), are not consistent withthe density log measurements. The core-derived bulk densities arerelatively constant with depth and are characterized by a relativelylimited range of values. It is likely that the density logs from all threesites have been severely degraded by both the rugosity and theenlarged size of the boreholes. Before using the log-derived bulk-density data to calculate sediment porosities, we have attempted tosystematically remove the erroneous data from the recorded densitylogs at Sites 994, 995, and 997. The detailed analysis of the recordedlogs indicates that the density log yields erroneous low values whenthe borehole exceeded a diameter of about 36 cm. In addition, itappears that when the borehole size is reduced, below a diameter ofabout 28 cm, the density log yields erroneous high values. There-fore, we have systematically deleted all of the density log data fromthe portion of Holes 994D, 995B, and 997B where the caliper logfrom the density tool indicates that the hole diameter is more than 36
cm or less than 28 cm. The edited density log curve still containednumerous unreasonably low density “spikes” that usually consist ofonly one or two data points. Therefore, any log measured bulk den-sity values of less than 1.6 g/cm3 were also deleted from the recordedlog traces. The edited bulk-density (ρb) log measurements were thenused to calculate sediment porosities (∅) in Holes 994D, 995B, and997B using the standard density-porosity relation: ∅ = (ρm–ρb)/(ρm–ρf) (Serra, 1984). Water densities (ρf) were assumed to be con-stant and equal to 1.05 g/cm3 for each hole; however, variable core-derived grain/matrix densities (ρm) were assumed for each calcula-tion. The core-derived grain densities (ρm) in Holes 994C, 995A, and997A range from an average value at the seafloor of about 2.72 g/cm3 to about 2.69 g/cm3 at the bottom of each hole (Shipboard Sci-entific Party, 1996a, 1996b, 1996c). The density log porosity calcu-lations from all three sites yielded values ranging from about 50% tonear 70% (Fig. 6). The density log-derived porosities are more vari-able and generally higher than the core-derived porosities alsoshown in Figure 6. It appears that the density log porosities overes-timate both the range and absolute porosities for the sediments onthe Blake Ridge. It is likely the high clay content and unlithified na-ture of the sediments on the Blake Ridge have contributed to the in-ability of the density tool to make good contact with the boreholewall, which leads to erroneous density log measurements that cannotbe further corrected. Data from the density logs in Holes 994D,995B, and 997B can be used to assess general porosity trends but notfor quantitative calculations.
0
200
400
600
DENSITY LOG AND CORE POROSITY (%)SITE 994 SITE 995 SITE 997
DE
PT
H (
mbs
f)
40 80 40 80 40 80
100
300
500
700
Figure 6. Sediment porosities (shown as continuous line plots) derived fromdownhole density log (HLDT) data at Sites 994, 995, and 997. For compari-son purposes, diamonds show the core-derived porosities (as discrete pointmeasurements).
185

T.S. COLLETT, J. LADD
Neutron Porosity Log
Because of poor hole conditions, the CNT-G was run in only twoholes (Holes 994C and 995B) on the Blake Ridge. The CNT-G mea-sures the amount of hydrogen within the pore space of a sedimentarysequence, which is mostly controlled by the amount of water that ispresent. The CNT-G has two pairs of detectors that indirectly mea-sure both epithermal (intermediate energy level) and thermal (lowenergy) neutrons, which provide two porosity measurements. Therecorded neutron porosity log data from Holes 994C and 995B revealan average thermal porosity of about 50%, and the epithermal poros-ity averages about 100%. The thermal and epithermal porosity logsare calibrated to read 50% and 100%, respectively, in water (no sed-iment). Therefore, the neutron porosity log in Holes 994C and 995Bonly detected the hydrogen in the borehole waters and the porositydata from the neutron log is of no value. In “standard” industry appli-cations the CNT-G is run with a bowspring that keeps the tool nearthe wall of the hole, thus reducing the effects of an enlarged borehole.Because of the size limitation of running the logs through the drill-pipe, it is impossible to use a bowspring on the CNT-G in ODP holes.
Resistivity Log Calculated Porosities
One approach to obtaining sediment porosities from downholelogs is to use the electrical resistivity logs (Fig. 4A–C) and Archie’srelationship between the resistivity of the formation (Rt) and porosity(∅): Rt /Rw = a ∅–m, where a and m are constants to be determinedand Rw is the resistivity of the pore-waters (Archie, 1942).
The resistivity of pore-waters (Rw) is mainly a function of the tem-perature and the dissolved salt content (salinity) of the pore waters.Pore-water salinity data from Sites 994, 995, and 997 are availablefrom the analyses of interstitial water samples collected from recov-ered cores at each site (Shipboard Scientific Party, 1996a, 1996b,1996c). The interstitial water salinity trends at all three core sitesmimic the interstitial water chloride trends discussed earlier in thisreport (Fig. 5). In general, the core-derived interstitial water salinitiesdecrease with depth from a maximum value of about 35 ppt near thesediment-water interface to about 31 ppt within the upper part of log-ging Unit 2. Similar to the chloride profiles in logging Unit 2, theinterstitial water salinities are also more variable within this inferredgas hydrate–bearing sedimentary section. Formation and seabed tem-peratures have been directly measured at all three core sites on theBlake Ridge, as described in Shipboard Scientific Party (1996a,1996b, 1996c). Listed in Table 3 are the measured seabed tempera-tures and geothermal gradients for Sites 994, 995, and 997 (modifiedfrom Shipboard Scientific Party, 1996a, 1996b, 1996c). Arps’ formula(Serra, 1984) was used to calculate the pore-water resistivity (Rw) ateach site from the available core-derived interstitial water salinitiesand measured formation temperatures (Table 3; Fig. 7). In general, thecalculated pore-water resistivities (Rw) reach a maximum of about0.34 Ωm within 100 m of the seafloor and decrease with depth to avalue below 0.20 Ωm at the bottom of each borehole. The small in-crease in water resistivities in logging Unit 2, depicted in Figure 7, area result of the presence of freshwater in the analyzed cores, which wasexpelled from gas hydrate that had disassociated in the cores. To avoidintroducing errors into the subsequent resistivity porosity calcula-tions, the gas hydrate–affected pore-water resistivities from loggingUnit 2 have been excluded and the pore-water resistivities from log-ging Units 1 and 3 have been used to statistically project undisturbedpore-water resistivities (Rw) for logging Unit 2 (Fig. 7).
To determine the Archie constants a and m, we used the methoddescribed by Serra (1984) and the log-measured resistivities and core-derived porosities (Paull, Matsumoto, Wallace, et al., 1996) fromeach site drilled on the Blake Ridge. The log-measured resistivity datafrom logging Unit 2 in each hole have been omitted from this calcula-tion of the Archie constants to avoid introducing an error caused byusing resistivity log-measurements that have been affected by the oc-
186
currence of in situ gas hydrate. In addition, log-measured resistivitiesfrom expected free-gas zones in Unit 3 of each hole have also beenomitted from the determination of the Archie constants. Linear trends inresistivity log and core porosity data from logging Units 1 and 3 (ex-clusive of logging Unit 2) in each hole have been used to calculaterepresentative (100% water saturated) formation resistivities (Ro) andporosities (∅). From these representative values the slope, m, and theintercept, ln a, of the function ln (Ro /Rw) = –m ln ∅ + ln a were calcu-lated for each of the logged boreholes. The calculated a and m Archie con-
0
200
400
600
SITE 994 SITE 995 SITE 997
DE
PT
H (
mbs
f)
0.15 0.4
100
300
500
700
PORE-WATER RESISTIVITY (R , Ωm)w0.15 0.4 0.15 0.4
Figure 7. Pore-water resistivities (Rw) derived from interstitial water (coresamples) salinities and downhole measured formation temperatures (Table 3)at Sites 994, 995, and 997. The dashed continuous line plots are the assumedundisturbed pore-water resistivities (Rw).
Table 3. Leg 164 formation temperature data and Archie constants (aand m) needed to calculate pore-water resistivities (Rw; See Fig. 7) andwater saturations (Sw; See Fig. 9A–C).
Notes: Temperature data from Paull, Matsumoto, Wallace, et al. (1996). ? = uncertainvalue.
Site
Seafloor temperature
(°C)Geothermal gradient
(°C/100 m)
Archie constants
a m
994 3.0 3.64 0.53 ? 3.68 ?995 3.0 3.35 1.03 2.53997 3.0 3.68 1.07 2.59
Assumed constants: 1.05 2.56

DETECTION OF GAS HYDRATE WITH DOWNHOLE LOGS
stants for Holes 994D, 995B, and 997B have been listed in Table 3.The Archie constants (a and m) calculated for Holes 995B and 997Bare similar and fall within the “normal” range of expected values (Ser-ra, 1984). However, the values of the a and m constants for Hole 994Dfall outside of the “normal” range of values. The cause of these anom-alous Archie constants in Hole 994D is likely because of poor holeconditions in logging Unit 1, which has contributed to degraded resis-tivity log measurements. Because all three boreholes penetrated sim-ilar lithologic sections and because they are located in relatively closeproximity to each other, we decided to use an average value (calculat-ed from Holes 995B and 997B) for the a and m Archie constantsthroughout this study of the Blake Ridge (Table 3: a = 1.05, m = 2.56).
Given the Archie constants (a and m) and pore-water resistivities(Rw), we can now calculate sediment porosities (∅) from the resistiv-ity log using Archie’s relation. The results of these calculations arethe porosity logs shown in Figure 8. The calculated resistivity poros-ities should be considered “apparent” porosity values because the Ar-chie relation assumes that all of the void space within the sedimentsare filled with water (no gas hydrate), which is not true. In all threeholes, the resistivity-derived porosities decrease with depth (Fig. 8)though this is not the normal exponential consolidation trend thatwould be expected if the pore space were decreasing with depth pri-marily from the weight of increasing overburden (Lee and others,1993); instead we see an almost linear porosity decrease. Relative toUnits 1 and 3, Unit 2 exhibits a baseline shift to higher resistivitiesand lower calculated resistivity porosities. The assumption that all ofthe pore space within the sediments of Unit 2 is filled with only wateris not valid. Some of the pore space in Unit 2 is occupied by gashydrate that exhibits higher electrical resistivities and would contrib-ute to an “apparent” reduction in resistivity-derived porosities.
Porosity Calculations—Summary
The comparison of core- and log-derived porosities in Figures 6and 8, reveals that the resistivity log-derived porosities are generallysimilar to the core porosities. The density log-derived porosities, how-ever, are generally higher than the core porosities. It is likely that thedensity log measurements have been degraded by poor borehole con-ditions. The resistivity log-derived porosities in Figure 8 are the bestdownhole-derived porosity logs for all three holes on the Blake Ridge.However, because of gas hydrate–induced resistivity effects in log-ging Unit 2, the resistivity-derived porosity data from Leg 164 shouldbe used with caution and the core-derived sediment porosities are thebest available porosity data from the Blake Ridge.
GAS HYDRATE SATURATIONS
Electrical resistivity and acoustic transit-time downhole logs fromSites 994, 995, and 997 indicate the presence of gas hydrate in thedepth interval between 185 and 450 mbsf on the Blake Ridge (log-ging Unit 2). Electrical resistivity downhole log data can be used toquantify the amount of gas hydrate in a sedimentary section as dis-cussed in Leg 164 ODP Proceedings, Initial Reports volume (Paull,Matsumoto, Wallace, et al., 1996) and in Collett (1998). In the fol-lowing section, we have used data from the electrical resistivity(DITE) logs in Holes 994D, 995B, and 997B to quantify the amountof gas hydrate in logging Unit 2 (approximate depth interval of 185–450 mbsf) on the Blake Ridge.
For the purpose of discussion we have assumed that the anoma-lous high resistivities and velocities measured in logging Unit 2 onthe Blake Ridge are a result of the presence of in situ natural gas hydrate.However, an alternative hypothesis suggests that interstitial water salin-ity changes could account for the electrical resistivity log responses ob-served at Sites 994, 995, and 997. Geochemical analyses of cores fromlogging Unit 2 at all three sites on the Blake Ridge have revealed thepresence of pore water with relatively low chloride concentrations
(Shipboard Scientific Party, 1996a, 1996b, 1996c). This may indicatethat logging Unit 2 contains waters with relatively low salt concentra-tions that will contribute to an increase in the measured electrical resis-tivities. However, because the acoustic log is not affected by changes inpore-water salinities, it appears to refute the hypothesis that salinitychanges are contributing to the anomalous acoustic velocity and re-sistivity properties of logging Unit 2. To further evaluate the effect ofpore-water salinity on the measured log values at Sites 994, 995, and997, we have attempted to quantify the observed changes in electricalresistivity in logging Unit 2 in respect to potential pore-water salinitychanges. We have determined that to account for the high resistivities(as high as 1.50 Ωm) observed in the upper part of logging Unit 2(Fig. 4A–C), would require the pore waters to be diluted, relative to aseawater baseline of 32 ppt, by almost 72% (to ~9 ppt NaCl). A re-quired pore-water salinity change of 72% is much greater than themaximum observed chlorinity changes measured in the recoveredcores, which was determined to be about 15% (Shipboard ScientificParty, 1996a, 1996b, 1996c). Therefore, it is unlikely that interstitialsalinity differences could account for the observed resistivity logtrends. To further evaluate the effect of variations in pore-water salin-ities on the log-measured formation resistivities, it is possible to com-pare the formation water resistivities (Rw) (Fig. 7) calculated from therecovered core water samples at Sites 994, 995, and 997 with the logmeasured formation resistivities (Rt). The log measured formation re-sistivities (Rt) in logging Unit 2 on the Blake Ridge is characterizedby a maximum resistivity range of 1.5 Ωm (Fig. 4A-C). However, the
0
200
400
600
RESISTIVITY LOG AND CORE POROSITY (%)SITE 994 SITE 995 SITE 997
DE
PT
H (
mbs
f)
40 80 40 80 40 80
100
300
500
700
Figure 8. Sediment porosities (shown as continuous line plots) derived fromdownhole electrical resistivity log (DITE) data at Sites 994, 995, and 997.For comparison purposes, diamonds show the core-derived porosities (as dis-crete point measurements).
187

T.S. COLLETT, J. LADD
observed pore-water salinity variations in cores recovered from log-ging Unit 2 correspond to a formation water resistivity (Rw) range ofonly 0.05 Ωm, which is less than 4% of the total formation resistivity(Rt) range measured in logging Unit 2. Therefore, the observed for-mation resistivities (Rt) variations in logging Unit 2 cannot be attrib-uted only to changes in pore-water salinities, and the resistivity login logging Unit 2 is likely responding to the presence of in situ gashydrate.
Two forms of the Archie relation (Archie, 1942), discussed in theLeg 164 ODP Proceedings, Initial Reports volume (Paull, Matsumo-to, Wallace, et al., 1996) and in Collett (1998), have been used to cal-culate water saturations (Sw) [gas-hydrate saturation (Sh) is equal to(1.0–Sw)] from the available electrical resistivity log data (DITE) atSites 994, 995, and 997. In the first computation, the “standard” Ar-chie equation [Sw = (a Rw /∅m Rt)
1/n] has been used with two differentsets of sediment porosity data to calculate two comparable water sat-urations. Both sets of porosity data used in the standard Archie equa-tion were from the core-derived physical property data (Paull, Mat-sumoto, Wallace, et al., 1996). In the first calculation, the absolutevalue (not statistically manipulated) of the core-derived porositieswere used and the sediment porosities between the core measure-ments were linearly interpolated. However, in the second standardArchie calculation of water saturation (Sw), the required sediment po-rosities were obtained from a regression trendline (power function)projected through the core porosity data in each hole. The formation
188
water resistivities (Rw) (Fig. 7), calculated from the recovered corewater samples in logging Units 1 and 3, were used in both standardArchie calculations along with the a and m Archie constants dis-cussed in the sediment porosity section of this report (a = 1.05, m =2.56). The value of the empirical constant n was assumed to be1.9386 as determined by Pearson et al. (1983). In Figure 9A-C, theresults of the two standard Archie calculations are shown as watersaturation (Sw) log traces for Holes 994D, 995B, and 997B [gas-hydrate saturation (Sh) is equal to (1.0–Sw)].
In all three holes (Holes 994D, 995B, and 997B), the standard Ar-chie relation yielded water saturations (Sw) ranging from about 100%to a minimum of about 80% (Fig. 9A–C). In comparison, the standardArchie calculation, which used the nonstatistically manipulated coreporosities, resulted in the calculation of more highly variable watersaturations; whereas, the standard Archie calculation, which employedthe average core porosities, yielded more consistent water saturationswithin each hole. The zones in each hole characterized by water satu-rations exceeding 100%, which is impossible, are likely caused bypoor hole conditions that have degraded the resistivity log measure-ments. In an enlarged borehole, such as in logging Unit 1 of all threeholes, the resistivity log will underestimate the true formation resistiv-ity, which will correspond to an apparent increase in water saturations.The low water saturations in logging Unit 3 of all three holes, which ismost pronounced in Hole 997B, is likely because of the presence offree gas as discussed earlier in this report.
0
200
400
600
HOLE 994D
DE
PT
H (
mbs
f)
80
100
300
500
700
90 8090 8090
WATER SATURATION (S , %)wSTANDARD ARCHIE(measured porosities)
STANDARD ARCHIE(average porosities)
QUICK LOOK ARCHIE
Unit 1
Unit 2
Unit 3
100100 100
A
HOLE 995B
8090 8090 8090
WATER SATURATION (S , %)wSTANDARD ARCHIE(measured porosities)
STANDARD ARCHIE(average porosities)
QUICK LOOK ARCHIE
Unit 1
Unit 2
Unit 3
100 100 100
B
Figure 9. A. Standard and quick-look Archie derived water saturations (Sw) [gas-hydrate saturation (Sh) is equal to (1.0–Sw)] calculated from the downhole elec-trical resistivity log (DITE) at Hole 994D. The two standard Archie calculations assume different sediment porosities: (1) directly measured and (2) averagecore porosity trends. B. Standard and quick-look Archie derived water saturations (Sw) [gas-hydrate saturation (Sh) is equal to (1.0–Sw)] calculated from thedownhole electrical resistivity log (DITE) at Hole 995B. The two standard Archie calculations assume different sediment porosities: (1) directly measured and(2) average core porosity trends. (Continued on next page.)

DETECTION OF GAS HYDRATE WITH DOWNHOLE LOGS
The next resistivity log approach used to assess gas-hydrate satu-rations is based on the modified “quick-look” Archie log analysistechnique (discussed in Collett, 1998) that compares the resistivity ofwater-saturated and hydrocarbon-bearing sediments. Electrical resis-tivity (Rt) log measurements from Holes 994D, 995B, and 997B (Fig.4A–C) were used to calculate water saturations (Sw) [gas-hydrate sat-uration (Sh) is equal to (1.0 – Sw)] using the following modified Arch-ie relationship: Sw = (Ro /Rt)
1/n, where Ro is the resistivity of the sedi-mentary section if it contained only water (Sw = 1.0), Rt is the resistiv-ity of the gas hydrate–bearing intervals (log values), and n is anempirically derived constant. This modified Archie relationship isbased on the following logic: if the pore space of a sediment is 100%saturated with water, the deep-reading resistivity device will measurethe resistivity of the 100% water-saturated sedimentary section (Ro).This measured Ro value is considered to be a relative baseline fromwhich hydrocarbon saturations can be determined within nearbyhydrocarbon-bearing intervals. To determine Ro for logging Unit 2 inall three holes, we have used the measured deep resistivity log datafrom the non gas–bearing portions of logging Units 1 and 3 (Sw = 1.0),to project a Ro trend-line for Unit 2 (Fig. 4A–C). Laboratory experi-ments on different sediment types have yielded a pooled estimate forn of 1.9386 (reviewed by Pearson et al., 1983). Now knowing Rt, Ro,and n, it is possible to use the modified quick-look Archie relation-ship to estimate water saturations. Displayed in Figure 9A–C, along
0
200
400
600
HOLE 997B
DE
PT
H (
mbs
f)
80
100
300
500
700
90 8090 8090
WATER SATURATION (S , %)wSTANDARD ARCHIE(measured porosities)
STANDARD ARCHIE(average porosities)
QUICK LOOK ARCHIE
Unit 1
Unit 2
Unit 3
100 100 100
C
Figure 9 (continued). C. Standard and quick-look Archie-derived water satu-rations (Sw) [gas-hydrate saturation (Sh) is equal to (1.0–Sw)] calculated fromthe downhole electrical resistivity log (DITE) at Hole 997B. The two stan-dard Archie calculations assume different sediment porosities: (1) directlymeasured and (2) average core porosity trends.
with the standard Archie derived water saturations, are the water sat-urations calculated by the quick-look Archie method. The quick-lookcalculated water-saturations are very similar to the water saturationscalculated by the standard Archie relation that employed averagecore porosities. However, the quick look–derived water saturationsare 2% to 3% higher, which is mostly controlled by the method usedto select the Ro baseline.
Gas-Hydrate Saturation Calculations—Summary
In logging Unit 2 (approximate depth of 185 to 450 mbsf) of allthree holes (Holes 994D, 995B, and 997B) on the Blake Ridge thestandard Archie relation yielded for the most part gas-hydrate satura-tions (Sh) ranging from 0% to a maximum near 20% (Fig. 9A–C);which are similar to the range of gas-hydrate saturations calculatedfrom interstitial water chloride freshening trends (Fig. 5). In compar-ison, the standard Archie relation that employed the nonstatisticallymanipulated core porosities resulted in the calculation of more highlyvariable gas-hydrate saturations than the saturation calculations thatused average core porosities. The use of data from different sources(downhole logs and core data) and noncompatible downhole depthshave likely contributed to the more variable nature of the gas-hydratesaturations calculated with the nonstatistically manipulated coreporosities. In comparison, however, the use of average porositytrends will mask localized porosity variations in complex geologicsystems, which could lead to erroneous gas-hydrate saturation calcu-lations. Because of the uniform nature of the sedimentary sectioncored on Leg 164, the log analysis methods that use both the non-statistically manipulated and average core porosities yield similarresults. The quick-look Archie method also yielded reasonable gas-hydrate saturations (Fig. 9A–C); however, the quick-look method isvery dependent on the selection of an accurate Ro baseline.
In general, the Archie relation appears to yield accurate hydrocar-bon (gas-hydrate and free gas) saturations on the Blake Ridge in spiteof the fact that the sedimentary section at all three core sites on theBlake Ridge consists of mostly clay (shale), which exhibits uniqueelectrical properties that must be corrected for in “conventional” loganalysis studies. In conventional log studies, a clay can be modeledas consisting of two components: electrically inert dry clay andbound water. The electrical conductivity of a clay-rich rock is mod-eled as being derived solely from the clay-bound and free water. Be-cause the porosity data used in the Archie resistivity log studies of theBlake Ridge gas hydrate accumulation actually represent the totalwater content of the sediments, which include both the clay-boundand free water, the Archie relation accounts for the electrical proper-ties of both the clay-bound and free water. This assumes the electricalconductivity of the clay-bound and free water are similar, which islikely true in these low salinity pore-water systems. It should be notedthat there are several electrical conductivity models that offerimprovements over the Archie relationship when considering clay-rich sediments (Serra, 1984). Application of these extended electricalconductivity models would be a step forward to fully understand theelectrical logs from the Blake Ridge boreholes. However, the use ofthese complex extended Archie relations are beyond the scope of thispaper.
VOLUME OF GAS HYDRATE AND FREE GAS
Recent estimates of the volume of gas that may be contained in thegas hydrate and free gas beneath the gas hydrate on the Blake Ridgerange from about 70 trillion m3 of gas over an area of 26,000 km2
(Dickens et al., 1997) to about 80 trillion m3 of gas for an area of100,000 km2 (Holbrook et al., 1996). The difference between thesetwo estimates has been attributed to the observation that the amountof free gas directly measured within pressure-core samples (Dickenset al., 1997) from beneath the gas hydrate is significantly larger than
189

T.S. COLLETT, J. LADD
that estimated from borehole vertical seismic profile data (Holbrooket al., 1996). Other published studies indicate that the gas hydrate atthe crest of the Blake Ridge alone (area of about 3,000 km) may con-tain more than 18 trillion m3 of gas (Dillon et al., 1993). The broadrange of these estimates demonstrates the need for high-resolutionmeasurements of the gas-hydrate and associated free-gas volumes onthe Blake Ridge. The log-interpreted gas-hydrate and free-gas satura-tions from Sites 994, 995, and 997 in this report provide several of thecritical parameters needed to accurately calculate the volume of gason the Blake Ridge. The volume of gas that may be contained in a gashydrate accumulation depends on five “reservoir” parameters (mod-ified from Collett, 1993): (1) areal extent of the gas hydrate occur-rence, (2) “reservoir” thickness, (3) sediment porosity, (4) degree ofgas-hydrate saturation, and (5) the hydrate gas yield volumetricparameter that defines how much free gas (at standard temperatureand pressure [STP]) is stored within a gas hydrate (also known as thehydrate number). In the following section, the five “reservoir”parameters (Table 4) needed to calculate the volume of gas associatedwith the gas hydrate on the Blake Ridge area are assessed. In addi-tion, the volume of free gas trapped beneath the gas hydrate on theBlake Ridge is also assessed (Table 5).
The region in which seismic reflection profiling indicates theoccurrence of gas hydrate on the Blake Ridge (shaded area on themap in Fig. 1) extends over an area of ~26,000 km2 (Dillon and Paull,1983; Dickens et al., 1997). Despite the fact that the reflection seis-mic characteristics of the bottom-simulating reflector (BSR) and in-ferred gas hydrate occurrences are similar throughout the BlakeRidge, it may be inappropriate to extrapolate gas hydrate and othergeologic data from Sites 994, 995, and 997 to the entire 26,000 km2
gas hydrate accumulation. Most certainly there are local variations inthe distribution of gas hydrate on the Blake Ridge that need to be fur-ther evaluated; however, this work is beyond the scope of this study.The following volumetric assessment of the amount of gas hydrate,therefore, has been conducted on a site-by-site basis; that is, for eachsite drilled on the Blake Ridge (Sites 994, 995, and 997) we have in-dividually calculated the volume of gas hydrate and associated freegas within a 1 km2 area surrounding each drill site (Tables 4, 5). Forthis “resource” assessment, we have defined the thickness of the gashydrate–bearing sedimentary section at all three drill sites to be thetotal thickness of logging Unit 2, which ranges from about 217 to 265m thick (Table 4). The core-derived sediment porosities in loggingUnit 2 range from about 50% to 80%, and average ~58% (Table 4).Gas-hydrate saturations in logging Unit 2 at all three drill sites, cal-culated from the standard Archie relation (Fig. 9A–C), range from an
190
average value of about 3% to 6% (Table 4). The hydrate gas yield pa-rameter or hydrate number is a factor that describes how much of theclathrate-cage structure is filled with gas. In this assessment, we haveassumed a hydrate number of 6.325 (90% gas filled clathrate), whichcorresponds to a gas yield of 164 m3 of methane (at STP) for everycubic meter of gas hydrate (Collett, 1993). Our calculations indicatethat the potential volume of gas within the log-inferred gas hydrate ateach drill site (Sites 994, 995, and 997) on the Blake Ridge rangesfrom about 670,000,000 to 1,450,000,000 m3 gas per km2 (Table 4).
For comparison purposes only, if we assume the geologic condi-tions and gas hydrate distribution at Site 997 (Table 4) is representa-tive of the entire seismic delineated gas hydrate accumulation(26,000 km2) on the Blake Ridge, it can be assumed that there is about37.7 trillion m3 of gas within the Blake Ridge gas hydrate accumula-tion. One of the reasons that this estimate differs from that of Dickenset al. (1997) and Holbrook et al. (1996) is because both of these pre-vious studies have included the volume of free gas trapped beneaththe gas hydrate in their total gas “resource” estimate. Therefore, wehave also used the available log data from Sites 994, 995, and 997 tocalculate the volume of free gas (Table 5) below the gas hydrate onthe Blake Ridge. The available acoustic and resistivity downhole logdata have been used to identify free gas–bearing zones within loggingUnit 3 of Holes 994D, 995B, and 997B (Table 5). At Site 994, one64-m-thick free-gas zone has been identified, while at Sites 995 and997, two laterally continuous free gas–bearing zones have been de-lineated with combined total thicknesses of 72 and 194 m, respective-ly (Table 5). The average porosity of the sediments within the freegas–bearing zones at all three drill sites on the Blake Ridge rangefrom about 53% to 55% (Table 5). The free gas–bearing zones atSites 994 and 995 are characterized by free-gas saturations, calculat-ed from the standard Archie relation of about 1% (Fig. 9A–C; Table5). However, the free-gas saturations within the zone immediatelybelow the base of the gas hydrate at Site 997 average about 5% (Table5). Our calculations indicate that the potential volume of gas withinthe log inferred free gas–bearing zones at each drill-site (Sites 994,995, and 997) on the Blake Ridge ranges from about 743,000,000 m3
of gas (at STP) per km2 at Site 997 to about 55,000,000 m3 of gas (atSTP) per km2 at Site 995 (Table 5). If we follow Dickens et al.’s(1997) suggestion and assume that the volume of free gas below thegas hydrate at Site 997 is representative of the free gas volumestrapped below the gas hydrate throughout the Blake Ridge area(26,000 km2), then the total volume of gas occurring as free gas onthe Blake Ridge is about 19.3 trillion m3 (at STP). Thus, the com-bined volume of gas within the gas hydrate and underlying free-gas
Table 4. Volume of natural gas within the downhole log–inferred gas-hydrate occurrences at Sites 994, 995, and 997 on the Blake Ridge.
Note: Gas volume calculation assumes a hydrate number of 6.325 (90% gas-filled clathrate), 1 m3 of gas hydrate = 164 m3 free gas at STP.
Site
Depth of logging Unit 2
(mbsf)
Thickness ofhydrate-bearing zone
(m)
Sediment porosity
(%)
Gas-hydrate saturation
(%)
Volume ofhydrate/km2
(m3)
Volume of gaswithin hydrate/km2
(m3)
994 212.0-428.8 216.8 57.0 3.3 4,083,577 669,970,673995 193.0-450.0 257.0 58.0 5.2 7,731,352 1,267,941,673997 186.4-450.9 264.5 58.1 5.8 8,839,915 1,449,746,073
Table 5. Volume of natural gas within the downhole log–inferred free-gas occurrences at Sites 994, 995, and 997 on the Blake Ridge.
Notes: Volume of in-place gas at in situ pressure and temperature conditions. STP: pressure = 101 kPa, temperature = 15°C.
Site
Depth of identified free-gas zones
(mbsf)
Thickness of freegas–bearing zone
(m)
Sediment porosity
(%)
Free-gas saturation
(%)
Volume of in-place gas/km2
(m3)
Volume of gas within free-gas/km2 at STP
(m3)
994 541-605 64 53.2 1.38 468,761 96,096,005995 450-480 30 55.4 0.60 99,010 24,752,500995 582-624 42 52.5 0.64 141,640 30,594,240997 451-520 69 54.5 4.83 1,818,083 410,886,758977 567-692 125 52.9 2.63 1,740,780 332,488,980

DETECTION OF GAS HYDRATE WITH DOWNHOLE LOGS
accumulations on the Blake Ridge would be about 57 trillion m3 ofgas, which is near the volume (70 trillion m3 of gas) estimated byDickens et al. (1997). However, it is unlikely that the Site 997 down-hole log or pressure core–calculated gas-hydrate concentrations arerepresentative for the entire Blake Ridge. We know, for example, thatthe volume of free gas below the gas hydrate at Site 995 is much lessthan the volume of free gas at Site 997 (Table 5). More work is need-ed to assess the regional distribution and variability of both the gashydrate and associated free-gas accumulations on the Blake Ridgebefore accurate resource estimates can be made.
CONCLUSIONS
Gas hydrate is known and inferred to occur on the Blake Ridgewithin the depth interval from about 185 to 450 mbsf. Based prima-rily on core-derived physical property data, the average sediment po-rosities within the gas hydrate–bearing interval on the Blake Ridgehave been determined to range from about 57% to 58%. The standardand quick-look Archie relations yielded for the most part accurategas-hydrate saturations, ranging from 0% to a maximum near 20%,within the ODP Leg 164 boreholes on the Blake Ridge. Downholeelectrical resistivity log data have also been used to assess the volumeof free gas beneath the gas hydrate accumulation on the Blake Ridge.The downhole log-derived gas-hydrate saturations, in combinationwith other reservoir data, indicate that the potential volume of gaswithin the log inferred gas hydrate at each drill site (Sites 994, 995,and 997) on the Blake Ridge ranges from about 670,000,000 to1,450,000,000 m3 of gas per km2. Well log calculations from theBlake Ridge also indicate that the potential volume of gas within thelog-inferred free-gas zones at each core site (Sites 994, 995, and 997)range from about 743,000,000 m3 of gas (at STP) per km2 at Site 997to about 55,000,000 m3 of gas (at STP) per km2 at Site 995. Collec-tively, the volume of gas within the gas-hydrate and free-gas accumu-lations on the Blake Ridge may be about 57 trillion m3 of gas.
ACKNOWLEDGMENTS
We wish to thank the international supporters of the Ocean Drill-ing Program for the opportunity to participate in Leg 164. Specialthanks is extended to Drs. C.K. Paull and R. Matsumoto, Co-ChiefScientists of Leg 164, for their support of an ambitious gas hydrateresearch cruise. We also wish to thank Dr. D. Goldberg and the entirestaff of the Borehole Research Group of the Lamont-Doherty EarthObservatory for the special support they afforded the Leg 164 welllogging program. Without the laboratory and computer facilities ofthe U.S. Geological Survey this project would not have been possi-ble. This study was partially funded by the U.S. Geological SurveyEnergy Resources Program, which was greatly appreciated.
REFERENCES
Archie, G.E., 1942. The electrical resistivity log as an aid in determiningsome reservoir characteristics. J. Pet. Technol., 5:1–8.
Bally, A.W., 1981. Atlantic type margins. In Bally, A.W. (Ed.), Geology ofPassive Continental Margins: History, Structure, and SedimentologicRecord. AAPG Educ. Course Note Ser., 19:1.1–1.48.
Collett, T.S., 1983. Detection and evaluation of natural gas hydrates fromwell logs, Prudhoe Bay, Alaska. Proc. Fourth Int. Conf. on Permafrost,169–174.
————, 1993. Natural gas hydrates of the Prudhoe Bay–Kuparuk Riverarea, North Slope, Alaska. AAPG Bull., 77:793–812.
————, 1995. Gas hydrate resources of the United States. In Gautier,D.L., Dolton, G.L., Takahashi, K.I., and Varnes, K.L. (Eds.), 1995National Assessment of United States Oil and Gas Resources on CD-ROM. U.S. Geol. Survey Digital Data Ser., 30.
————, 1998. Well log evaluation of gas hydrate saturations. Trans. Soc.Prof. Well Log Analysts, Thirty-Ninth Ann. Logging Symp., Pap. MM.
Collett, T.S., Godbole, S.P., and Economides, C.E., 1984. Quantification ofin-situ gas hydrates with well logs. Proc. Annu. Tech. Meet. Petrol. Soc.CIM, 35:571–582.
Dickens, G.R., Paull, C.K., Wallace, P., and the ODP Leg 164 ScientificParty, 1997. Direct measurement of in situ methane quantities in a largegas-hydrate reservoir. Nature, 385:427–428.
Dillon, W.P., Lee, M.W., Fehlhaber, K., and Coleman, D.F., 1993. Gashydrates on the Atlantic margin of the United States—controls on con-centration, In Howell, D.G. (Ed.), The Future of Energy Gases. Geol.Surv. Prof. Pap. U.S., 1570:313–330.
Dillon, W.P., and Paull, C.K., 1983. Marine gas hydrates, II. Geophysical evi-dence. In Cox, J.S. (Ed.), Natural Gas Hydrates: Properties, Occur-rences, and Recovery: Woburn, MA (Butterworth), 73–90.
Dillon, W.P., and Popenoe, P., 1988. The Blake Plateau basin and CarolinaTrough. In Sheridan, R.E., and Grow, J.A. (Eds.), The Atlantic Continen-tal Margin, U.S., Geol. Soc. Am., Geology of North America, I-2:291–328.
Holbrook, W.S., Hoskins, H., Wood, W.T., Stephen, R.A., Lizzarralde, D.,and the Leg 164 Science Party, 1996. Methane gas-hydrate and free gason the Blake Ridge from vertical seismic profiling. Science, 273:1840–1843.
Kvenvolden, K.A., 1988. Methane hydrate—a major reservoir of carbon inthe shallow geosphere? Chem. Geol., 71:41–51.
————, 1993. Gas hydrates as a potential energy resource: a review oftheir methane content. In Howell, D.G. (Ed.), The Future of EnergyGases. Geol. Surv. Prof. Pap. U.S., 1570:555–561.
Lee, M.W., Hutchinson, D.R., Dillon, W.P., Miller, J.J., Agena, W.F., andSwift, B.A., 1993. Method of estimating the amount of in situ gashydrates in deep marine sediments. Mar. Pet. Geol., 10:493–506.
Mathews, M., 1986. Logging characteristics of methane hydrate. The LogAnalyst, 27:26–63.
Paull, C.K., Matsumoto, R., Wallace, P.J., et al., 1996. Proc. ODP, Init.Repts., 164: College Station, TX (Ocean Drilling Program).
Pearson, C.F., Halleck, P.M., McGuire, P.L., Hermes, R., and Mathews, M.,1983. Natural gas hydrate deposits: a review of in-situ properties. J. Phys.Chem., 87:4180–4185.
Serra, O., 1984. Fundamentals of Well-Log Interpretation (Vol. 1): TheAcquisition of Logging Data: Dev. Pet. Sci., 15A: Amsterdam (Elsevier).
Shipboard Scientific Party, 1972. Sites 102-103-104—Blake-Bahama OuterRidge (northern end). In Hollister, C.D., Ewing, J.I., et al., Init. Repts.DSDP, 11: Washington (U.S. Govt. Printing Office), 135–218.
————, 1983. Site 533: Blake Outer Ridge. In Sheridan, R.E., Gradstein,F.M., et al., Init. Repts. DSDP, 76: Washington (U.S. Govt. PrintingOffice), 35–140.
————, 1985. Site 570. In von Huene, R., Aubouin, J., et al., Init. Rept.DSDP, 84: Washington (U.S. Govt. Printing Office), 283–336.
————, 1994. Site 892. In Westbrook, G.K., Carson, B., Musgrave, R.J.,et al., Proc. ODP, Init. Repts., 146 (Pt. 1): College Station, TX (OceanDrilling Program), 301–378.
————, 1996a. Site 994. In Paull, C.K., Matsumoto, R., Wallace, P.J., etal., Proc. ODP, Init. Repts., 164: College Station, TX (Ocean DrillingProgram), 99–174.
————, 1996b. Site 995. In Paull, C.K., Matsumoto, R., Wallace, P.J., etal., Proc. ODP, Init. Repts., 164: College Station, TX (Ocean DrillingProgram), 175–240.
————, 1996c. Site 997. In Paull, C.K., Matsumoto, R., Wallace, P.J., etal., Proc. ODP, Init. Repts., 164: College Station, TX (Ocean DrillingProgram), 277–334.
Tucholke, B.E., Bryan, G.M., and Ewing, J.I., 1977. Gas-hydrate horizonsdetected in seismic-profiler data from the western North Atlantic. AAPGBull., 61:698–707.
Yakushev, V.S., and Collett, T.S., 1992. Gas hydrates in Arctic regions: riskto drilling and production. Proc. Second Int. Offshore and Polar Eng.Conf., 669–673.
Date of initial receipt: 21 April 1998Date of acceptance: 10 December 1998Ms 164SR-219
191