17 06 14 10th%20cms final
DESCRIPTION
http://www.ecccyprus.org/images/2014news/2014june30/17.06.14-10th%20CMS_FINAL.pdfTRANSCRIPT

EN Error! No document variable supplied. EN
EUROPEAN COMMISSION
Brussels, XXX
[…](2013) XXX draft
COMMISSION STAFF WORKING DOCUMENT
Consumer Markets Scoreboard_Making markets work for consumers__10th edition -
June 2014

EN 2 Error! No document variable supplied. EN
COMMISSION STAFF WORKING DOCUMENT
Consumer Markets Scoreboard_Making markets work for consumers__10th edition -
June 2014
Table of Contents
1. EXECUTIVE SUMMARY .......................................................................................... 4
2. CONSUMERS' ASSESSMENT OF MARKET PERFORMANCE ........................... 6
2.1. Overall results .............................................................................................................. 7
2.2. Country differences in market assessment ................................................................. 10
2.3. Socio-demographic differences in market assessment ............................................... 12
2.4. Assessment of different market groups ...................................................................... 14
2.4.1. Fast moving retail ..................................................................................................... 15
2.4.2. (Semi-) durable goods markets ............................................................................... 16
2.4.3. Automotive cluster ................................................................................................... 17
2.4.4. Recreational services ................................................................................................ 18
2.4.5. Insurance services .................................................................................................... 19
2.4.6. Public transport ........................................................................................................ 20
2.4.7. Utilities ...................................................................................................................... 21
2.4.8. Telecoms .................................................................................................................... 22
2.4.9. Banking services ....................................................................................................... 23
2.5. Market assessment components ................................................................................. 24
2.5.1. Comparability ........................................................................................................... 24
2.5.2. Trust .......................................................................................................................... 27
2.5.3. Problems.................................................................................................................... 30
2.5.4. Complaints ................................................................................................................ 32
2.5.5. Overall satisfaction ................................................................................................... 35
2.5.6. Choice ........................................................................................................................ 36
2.5.7. Switching ................................................................................................................... 39
2.6. Market penetration ..................................................................................................... 43
3. ADDITIONAL INDICATORS .................................................................................. 45
3.1. Prices .......................................................................................................................... 45
3.2. Complaints ................................................................................................................. 54
3.3. Safety .......................................................................................................................... 59
ANNEXES ............................................................................................................................... 65
Annex I – Prices ....................................................................................................................... 65

EN 3 Error! No document variable supplied. EN
Table 7: Prices of goods and services ...................................................................................... 71
Annex II - National rankings of markets .................................................................................. 77
Belgium .................................................................................................................................... 79
Bulgaria ................................................................................................................................... 82
Czech Republic ....................................................................................................................... 85
Denmark .................................................................................................................................. 88
Germany .................................................................................................................................. 91
Estonia .................................................................................................................................... 94
Ireland .................................................................................................................................... 97
Greece .................................................................................................................................. 100
Spain .................................................................................................................................. 103
France .................................................................................................................................. 106
Croatia .................................................................................................................................. 109
Italy .................................................................................................................................. 111
Cyprus .................................................................................................................................. 114
Latvia .................................................................................................................................. 117
Lithuania ............................................................................................................................... 120
Luxembourg .......................................................................................................................... 123
Hungary ................................................................................................................................. 126
Malta .................................................................................................................................. 129
Netherlands ........................................................................................................................... 132
Austria .................................................................................................................................. 135
Poland .................................................................................................................................. 138
Portugal ................................................................................................................................. 141
Romania ................................................................................................................................ 144
Slovenia ................................................................................................................................. 147
Slovakia ................................................................................................................................. 150
Finland .................................................................................................................................. 153
Sweden .................................................................................................................................. 156
UK .................................................................................................................................. 159
Iceland .................................................................................................................................. 165
Annex III – Market names ..................................................................................................... 168

EN 4 Error! No document variable supplied. EN
1. EXECUTIVE SUMMARY
Since 2008, DG SANCO publishes on a regular basis the Consumer Scoreboards, which
monitor how the single market is performing for EU consumers and warn of potential
problems. There are two Scoreboard editions: the Consumer Conditions Scoreboard provides
data on national consumer conditions, cross-border trade and the development of e-commerce,
while the Consumer Markets Scoreboard, presented here, tracks the performance of specific
consumer markets.
A Single Market that serves consumers better can make a significant contribution to
stimulating economic growth, given that final consumption expenditure of households
accounts for 57% of EU GDP. Data from this edition of the Consumer Markets Scoreboard
have informed the annual report on the integration of the Single Market, which accompanied
the 2014 Annual Growth Survey, and the European Semester's country-specific
recommendations and accompanying staff working documents.
The main part of this 10th
Consumer Markets Scoreboard tracks the performance of 52
consumer markets, together accounting for almost 60% of household expenditure, based on
the indicators of comparability, trust, problems and complaints, overall satisfaction, choice
and switching. It also looks at national and socio-demographic differences in market
assessment, the link between market evaluations and economic indicators and (for the first
time) the penetration of different markets (proportion of consumers with recent purchasing
experience in a given market). The data come from the fourth wave of a large-scale, EU-wide
consumer survey, allowing for comparison of markets' performance over time.
In addition to survey data, the Scoreboard analyses price dispersion across EU countries,
complaints collected by national complaint handling bodies and available safety data.
The Scoreboard data allow European and national policymakers and stakeholders to tailor
policy measures to the sectors that perform poorly for consumers. As a follow-up, in-depth
studies of the sectors that appear to be underperforming are carried out to gain a better insight
into the problems and identify possible solutions. A number of problematic markets have
already been analysed in the light of previous Scoreboard findings and remedies are being
implemented.
Detailed statistics for each country over the last four years are provided in Annex II. In
addition to the report, an online dissemination platform is being set up, which will provide
user-friendly and interactive access to the underlying data.
Key findings
The consumers' overall assessment of market performance, across all markets and all
countries, has improved slightly between 2012 and 2013, continuing the positive trend
observed since 2010. However, the situation differs considerably from market to market and
from country to country. As in previous years, goods markets appear to be working
considerably better than services markets, although the gap between them has been
narrowing.
The overall ranking of markets has been largely stable over the last few years. Among goods
markets, fast moving retail goods receive the most positive assessment in spite of poor scores
given to the markets for 'meat and meat products' and 'fruit and vegetables'. Semi-durable
goods as a whole are assessed slightly less positively, with clothing and footwear registering
the lowest score. Automotive goods remain by far the worst performing market cluster, with
second-hand cars and fuel for vehicles again at the bottom of the goods markets ranking.
Among services markets, recreational services receive the most positive assessment, followed
by insurance services and public transport. Banking services remain the most problematic

EN 5 Error! No document variable supplied. EN
sector, with the markets for investment products and mortgages lying at the very bottom of
the services markets ranking. Telecoms and public utilities (in particular electricity and gas)
are also rated poorly by consumers.
The largest drop in performance compared to 2012 has been noted in the meat market, in
particular in the countries hit most by the horsemeat scandal. On the positive side, some of the
worst performing markets, such as vehicle fuels and train services, have improved the most
(in the latter case, this is likely to be due to the emergence of competition in some countries).
The results based on individual market assessment components confirm that services markets
are more problematic for consumers than goods markets across all the indicators. The gap
between the two market groups is most pronounced with regard to comparability of offers,
which may reflect the inherent complexity of some services markets, but also stems from
deliberate marketing strategies that hamper consumers' ability to choose the best deal.
Overall, consumers' trust in businesses to respect consumer protection rules is the lowest in
those markets where the asymmetry of information between the trader and the consumer is
most acute. There are considerable differences in the number of reported problems and related
complaints in different markets, with the worst situation occurring in the telecom sector.
Satisfaction with the choice of providers and the switching rates is lowest in the utilities
markets. Moreover, gas and electricity, in addition to mortgages, are perceived as the markets
where switching is the most difficult.
Market assessment shows considerable differences across EU countries. In general, markets
appear to perform better in EU15 Member States than in EU131. There is a modest positive
correlation between market assessment at country level and general economic circumstances
(as measured by Gross Domestic Product (GDP) per capita and consumers’ confidence in the
state of the economy). In addition, markets' performance is evaluated more positively in
countries where the overall consumer environment is more favourable. While some markets
(recreational services, certain durable goods) are assessed quite uniformly across the EU,
others (in particular banking and network services) show marked differences from country to
country.
Markets are assessed differently by different socio-demographic groups. The highest variation
is seen by occupation, with blue collar workers, the unemployed and the self-employed being
less positive about market performance, while students give the highest scores. Men tend to
be less positive in their market assessments than women across most markets, as do middle-
aged respondents in comparison with younger or older respondents. In addition, the
assessment of market performance appears to increase with the level of education.
There are marked differences in the penetration of different markets (proportion of consumers
with recent purchasing experience in a given market), with the lowest penetration rates
observed for online gambling services, vehicle rental and real estate services. The markets
which are more frequently used by consumers also tend to receive more positive evaluations.
The analysis of price data indicates that there has been a general process of price convergence
in the EU over the past decade. Nevertheless, price differences between EU countries
continue to exist, in particular in services markets. Overall, prices tend to be lower in
countries that joined the EU more recently. For most product categories, price differences
across countries are linked to differences in relative purchasing power.
There has been a considerable increase in the number of national complaint bodies submitting
complaints data according to the harmonised methodology set out in the 2010 Commission
1 'EU15' refers to the EU in its pre-2004 formation while 'EU13' refers to Member States that joined the
EU after 2004.

EN 6 Error! No document variable supplied. EN
Recommendation. Though the data are still incomplete, network services appear to account
for most complaints.
The data collected by hospitals in some EU countries suggest that building (components),
sport/recreation equipment and furniture are the product categories most often involved in
accidents and injuries. Further information on the safety of products on the market is provided
by the two EU-wide rapid alert systems for the notification of dangerous food (RASFF) and
non-food products (RAPEX). Clothing, toys, and fruit and vegetables each account for more
than a fifth of notifications.
Next steps
The Scoreboard is a screening tool for detecting underperforming markets and indicating to
EU and national policymakers the areas on which further analysis should focus. Based on the
findings of this Scoreboard, the Commission services will launch two in-depth market studies:
The first study will focus on the electricity market, which ranks fourth lowest among
the services markets, despite slight improvements since 2011. Assessment of the
market differs considerably across the EU and is the lowest in southern European
countries. The market scores particularly poorly scores on the choice of suppliers
available, comparability of offers and switching, suggesting that consumers are not yet
in a position to make full use of the saving opportunities created by market
liberalisation. The study will draw comparisons with the findings of an earlier (2010)
study2 into the market and assess if/how things have improved since then. It will also
examine the impact of the implementation of the Third Energy Package legislation as
well as of novel collaborative initiatives by consumers and/or consumer associations,
and will assess the need for possible future initiatives.
The second study will investigate (through behavioural testing) various conditions that
could increase consumers' willingness to read and their capacity to understand contract
terms and conditions. Scoreboard data consistently show that consumers struggle to
compare different offers and thus make informed choices, in particular in the services
markets. There is also evidence showing that consumers often accept contractual
obligations without reviewing them. This is not good for consumers (who run the risk
of blindly accepting disadvantageous contractual obligations) and thus for the market
in general.
The country reports annexed to the Scoreboard are intended to assist national authorities,
consumer organisations and business stakeholders in their efforts to improve the situation in
the underperforming markets, by pointing to sectors where further research, enforcement
and/or public awareness activities may be needed. Member States are also invited to use the
Scoreboard data when determining and evaluating their reforms in the context of the
European Semester process.
2. CONSUMERS' ASSESSMENT OF MARKET PERFORMANCE
This section of the Scoreboard presents the results of the 2013 Market Monitoring Survey3 on
consumers' assessment of the functioning of the most important consumer markets in 28 EU
2 http://ec.europa.eu/consumers/consumer_research/market_studies/docs/retail_electricity_full_study_en.pdf
3 The survey is based on telephone interviews conducted in March-April 2013 with a representative
sample of 500 people (aged 18+) for each of the 52 markets in each EU Member State, Iceland and
Norway (250 people in Cyprus, Luxembourg, Malta and Iceland).

EN 7 Error! No document variable supplied. EN
Member States, including for the first time Croatia4, as well as Iceland and Norway. The
survey covers 52 markets (21 goods and 31 services markets), together accounting for almost
60% of consumer expenditure. The list of markets is almost the same as in 2012 and 20115 (a
description of each market is provided in Annex III).
To ensure that it takes account of relevant experience, the survey is carried out among
consumers with recent purchasing experience in each market. 2013 was the fourth year of the
survey, thus allowing progress to be tracked over time both across markets and countries.
Detailed statistics for each country over the last four years are provided in Annex II.
The performance of different markets is assessed on the basis of six main criteria:
1) the ease of comparing goods or services on offer;
2) consumers’ trust in retailers/suppliers to comply with consumer protection rules;
3) problems experienced and the degree to which they have led to complaints;
4) consumer satisfaction (the extent to which markets live up to what consumers expect);
5) choice of retailers/providers; and
6) switching of tariffs/providers.
The first four indicators are applicable to all the markets and feed into the 'Market
Performance Indicator' (MPI) – a composite index serving as the basis for the main ranking
of the 52 markets. The four components of the index are equally weighted and the score is on
a scale from 0 to 1006.
2.1. Overall results
Consumer assessment of market performance continues to improve
Table 1 presents the yearly evolution of the MPI across all EU countries and markets (as well
as for goods and services markets separately). Consumers' overall assessment of market
performance improved slightly between 2012 and 2013 (by 0.3 points). This continues the
positive trend observed since 2010. While the performance of goods markets has remained
stable since 2012, services markets have improved by 0.5 point. As a consequence the
performance gap between the two market groups has slightly narrowed.
4 However, the 2013-2012 differences are based on EU27 results, given that Croatia was not included in
the previous waves of the survey. 5 The only difference is that the market for gambling and lottery services has been split into online and
offline gambling, given the different nature of the two markets and to inform the Commission's
upcoming Recommendation on online gambling. 6 The MPI is obtained by averaging (simple un-weighted average) the scores on each component and by
multiplying the result by 10. As a result of this, while the MPI ranges from 0 to 100, each of its
components ranges from 0 to 10. For the ‘comparability’, ‘trust’ and ‘satisfaction’ components, the
score was calculated by taking the mean of the answers of all respondents (on a scale from 0 to 10). The
score of the ‘problems and complaints’ component is calculated, based on the assumption that the
modality of complaining is an indicator of the seriousness of the problem encountered (highest score
when not reporting any problem, lowest score when complaining to a third-party complaints body, with
other situations scored in between) – see details on MPI rational and composition in the 2013 Consumer
Market Monitoring Survey report –
http://ec.europa.eu/consumers/consumer_research/editions/docs/monitoring_consumer_markets_eu_20
13_en.pdf.

EN 8 Error! No document variable supplied. EN
Table 1: MPI (Market Performance Indicator) – EU28, all markets
Source: Market monitoring survey, 2013
Lowest ranked markets have stayed largely the same…
Figure 1 presents the MPI performance at EU level for the 21 goods and 31 services markets
covered by the 2013 survey. The table to the right of the graph indicates the difference in
scores between successive years7 and the difference between each market and the average for
all goods or services markets, as appropriate8.
7 Due to the evolution of the market list, the 2011-2010 and 2013-2012 differences are not available for
all markets. 8 Statistically significant differences at 5% probability level are indicated by asterisks.

EN 9 Error! No document variable supplied. EN
Figure 1: MPI (Market Performance Indicator) – EU28, with subgroups
69,970,670,671,971,972,572,772,873,474,174,274,374,374,674,975,075,175,375,575,676,676,776,878,178,578,679,079,481,081,282,282,9
72,676,176,578,578,878,879,180,080,180,280,381,081,381,381,381,481,681,782,382,483,084,2
77,4
1.1*
0.2
1.3*
-0.21.8*
-0.5*
1.2*
0.8*
0.7*
1.1*-0.4
0.7*
0.9*
0.3
0.5*
0.8*
-0.1
1.2*
0
0.4
0.5*
0.1
0.8*
0.6*
0.9*
1.6*
0.4*0.6*
-0.20.2
0.6*
-2.1*1.5*
2.4*
-0.4*-0.3
0.1
0-0.2
0.3
0.5*
-0.3
-0.6*
-0.3
0
-0.1
-0.4*
-0.2
0.1
-0.1
-0.1
0
0.3*
0.7*
0.7*
0.5*
2.3*1.3*
0.3
1.1*
4*
1.4*
0.4*1.1*
0
0.6*
0.5*
0.8*
1.4*
0.8*
0.5*
1.3*
-0.7*
1.2*
1.1*
-0.9*
1.1*
0.2
-0.1
0.6*1.1*
0.4*0.4*
1.2*
1.4*0.7*
-0.2
1.3*1.3*
0.1
0.9*1.3*
0.6*
0.8*
1.4*
1.4*
1.4*
0.5*
1.3*
1.5*
1*
0.4*
1.2*
0.5*
1*
0.9*
3*
0.10.9*-0.9*
1.8*
1.1*
-0.1
1.2*
0.3
0.6*
-0.2*
-2.2*
1.2*
-1.1*
-0.1
0.3
1.2*
-0.4
0.2
0.9*
0.3
0.8*0.6*
1*0.2
0.6*
1.1*1.2*
-1.5*
0.6*1*
1.3*2.3*
1.4*
1.1*
0.9*
1.2*
1.4*
1.1*
0.9*
1.2*
3*
0.3
0.2
1.6*
0.5*
Investment products, private pensions and securities
Mortgages
Real estate services
Electricity services
Bank accounts
Internet provision
Train services
Mobile telephone services
Loans, credit and credit cards
Gas services
Private life insurance
Fixed telephone services
Maintenance services
TV-subscriptions
Legal and accountancy services
Water supply
Vehicle maintenance and repair
On-line gambling services
Tram, local bus, metro
All services markets
Postal services
Home insurance
Off-line gambling services
Vehicle insurance
Cafés, bars and restaurants
Vehicle rental services
Packaged holidays & tours
Airline services
Holiday accommodation
Commercial sport services
Culture and entertainment
Personal care services
Second hand cars
Fuel for vehicles
Meat and meat products
Clothing and footwear
Fruit and vegetables
ICT products
New cars
Maintenance products
All goods markets
Furniture and furnishings
Non-prescription medicines
Electronic products
Alcoholic drinks
Personal care products
Large household appliances
Small household appliances
Dairy products
Entertainment goods
Spectacles and lenses
Bread, cereals, rice and pasta
Non-alcoholic drinks
Books, magazines and newspapers
All markets
expectations problems&complaints trust comparability 2013 - 2012
2012 - 2011
2011 - 2010
S
E
R
V
I
C
E
S
G
O
O
D
S
Source: Market monitoring survey, 2013
The overall ranking of markets has been largely stable over the four waves of the survey. The
markets for 'books, magazines and newspapers', 'non-alcoholic drinks' and 'bread, cereals, rice
and pasta' remain the top performing goods markets, in line with the 2012 results. The
'second-hand cars' and 'fuel for vehicles' markets are again at the bottom of the ranking. In
contrast with 2012, the third to last market is now 'meat and meat products' (replacing
'clothing and footwear').
As in all other years of the survey since 2010, the top three services markets are 'personal care
services', 'culture and entertainment' and 'commercial sport services'. Additionally, in spite of
improvements, the bottom three services markets are identical to 2012, with 'investment
products' in the last position, preceded by 'mortgages' and 'real estate services'. The ten worst
performing services markets include two further banking services markets (with 'bank

EN 10 Error! No document variable supplied. EN
accounts' and 'loans and credit' ranked 27th
and 23rd
respectively), along with energy services
('electricity' ranked 28th
and 'gas' 22nd
), telecoms (with 'Internet provision' ranked 26th
and
'mobile telephone services' 24th
) and 'train services' (ranked in 25th
place).
… but some of the worst performing markets have improved the most
On the positive side, the biggest improvements in score since 2012 have occurred in some of
the worst performing markets. The market for vehicle fuels recorded the largest increase (2.4
points), due to improvements on all the MPI components. The score for train services
increased by 1.8 points, with the biggest increases noted in Italy (+6.7) and the Czech
Republic (+5.6). This may have been influenced by the fact that a second provider has entered
the market in both countries, with a likely positive impact in terms of prices and quality of
service. Other markets which saw an increase of more than 1 point include vehicle rental
services (+1.6), clothing and footwear (+1.5), water supply (+1.2), mortgages (+1.3), real
estate services (+1.2) and investment products (+1.1), all of which (with the exception of
vehicle rental) still score well below their respective market group average (goods or
services).
Downward assessment of the meat market following the horsemeat scandal
The largest decrease in score (-2.1) is seen in the market for 'meat and meat products', and is
particularly pronounced as regards the trust component. This drop in consumers' assessment
of the market is most likely due to the horsemeat scandal9 which affected most of the Member
States and was widely reported across Europe during the fieldwork period10
.
2.2. Country differences in market assessment
Overall market assessment shows considerable variation across EU countries. It should be
noted that scores can differ between countries, not only because of actual differences in
market performance, but also due to other factors such as cultural and economic differences as
well as different consumer environments.
Link between market performance and general economic situation
There is a modest positive correlation (+0.40) between Gross Domestic Product (GDP) per
capita and MPI in different countries, and in particular the trust component (0.48). While a
clear cause-effect relationship cannot be established, the relationship between the two
variables most likely works in both ways. On the one hand, consumers' assessment of market
functioning may be influenced by the general economic conditions in their country. This
could be linked to the fact that richer countries may invest more in enforcing consumer rules.
More affluent consumers are also able to choose from a broader range of goods and services,
including more expensive ones, which may be of better quality. On the other hand, the
functioning of consumer markets may influence economic development and therefore
countries where markets work better for consumers are also richer (because businesses tend to
be more efficient).
In addition, evaluation of market performance may be influenced by consumers' perceptions
of their personal and general economic situation. There is a modest positive correlation (0.25)
9 Fraudulent labelling of processed meat products, advertised as containing beef but in fact found to
contain undeclared horse meat - http://ec.europa.eu/food/food/horsemeat. 10
Not surprisingly, the overall assessment of the meat market has dropped most in the UK (-9.3) and
Ireland (-5.3), two of the countries most affected by the scandal.

EN 11 Error! No document variable supplied. EN
between MPI at country level and the Consumer Confidence Indicator11
, and this correlation
is the strongest for overall satisfaction (0.4).
An even lower negative correlation (-0.17) exists between MPI and price evolution (measured
via the Harmonised Index for Consumer Prices) in different markets in each country, meaning
that lower cumulative inflation12
is to some extent associated with higher MPI.
Link between market performance and general consumer conditions
Finally, markets appear to perform better in countries where the overall consumer
environment is more favourable, with a modest positive correlation (0.42) between MPI and
the Consumer Conditions Index (monitored in the Consumer Conditions Scoreboard)13
.
Consumers in EU15 more positive in their market assessments
Market performance is assessed more positively in the EU15 Member States (79.4) compared
to the EU13 (73.7)14
. This difference has been increasing slightly over the past four years and
holds true for all market clusters with the exception of telecoms. Differences are even bigger
between geographic clusters, i.e. market performance is assessed significantly better in
Western Europe and in Northern Europe than in Southern Europe and in Eastern Europe.
Table 2: Regional differences in market assessment15
EU15 EU13 Diff.
EU15-EU13
North South East West
All Markets 2012 78.0 75.5 2.5 77.3 75.3 75.4 79.4
Market clusters
Fast moving retail 82.0 77.5 4.4 80.5 80.5 77.4 82.9
(Semi-)durable goods 81.2 78.5 2.7 79.3 80.2 78.4 81.9
Automotive goods 77.0 72.0 5.0 78.3 73.5 71.8 78.8
Telecoms 73.3 74.3 -0.9 68.5 69.1 74.1 76.0
Transport 75.9 75.5 0.4 76.1 72.6 75.5 77.7
Utilities 74.5 73.9 0.7 77.0 69.8 73.8 76.9
Banking services 72.2 68.7 3.5 74.5 65.5 68.6 75.6
Insurance services 76.5 75.7 0.8 76.0 73.4 75.7 78.2
Recreational services 79.6 77.4 2.2 79.3 78.2 77.3 80.4
Other services 76.7 73.8 2.8 76.0 74.5 73.7 77.9
Source of raw data: Market monitoring survey, 2013
Poorly performing markets also show the widest divergence across the EU
In general, services markets (and in particular banking and network services) have more
uneven performance across EU countries than goods markets, which may be linked to their
lower cross-border tradability. The markets for mortgages, electricity services, mobile
11
This indicator has been developed by DG ECFIN in the framework of the business and consumer
survey programme. http://ec.europa.eu/economy_finance/db_indicators/surveys/index_en.htm. 12
The HICP (2005=100) measures the cumulative evolution of prices with respect to the base year (2005). 13
Over the period 2010-2012. 14
'EU15' refers to the EU in its pre-2004 formation while 'EU13' refers to Member States that joined the
EU after 2004. 15
EU countries have been divided into the four geographical regions as follows: North (Denmark,
Finland, Sweden), South (Cyprus, Greece Italy, Malta, Portugal, Spain), East (Bulgaria, Croatia, Czech
Republic, Estonia, Hungary, Latvia, Lithuania, Poland, Romania, Slovakia, Slovenia) and West
(Austria, Belgium, France, Germany, Ireland, Luxembourg, Netherlands, the UK).

EN 12 Error! No document variable supplied. EN
telephone services and train services show the widest divergence EU-wide16
. The most
uniformly assessed markets include recreational services (which may reflect the inherent
entertainment aspect of these markets and, in the case of tourism-related services, their cross-
border character) and certain durable goods such as household equipment (which tend to be
more uniform across the EU than other products). More integrated markets are also more
positively assessed overall, with a strong negative correlation (0.83) between MPI variance
and the actual MPI scores (Figure 2).
Figure 2: Correlation between MPI country variance and MPI EU-28 score
Fruits and vegetables
Meat and meat products
12
Non-alcoholic drinks
Culture and entertainment
Clothing and footwear
85
3
1
6
20
14
16
Second hand cars
Fuel for vehicles
1115
Real estate services
Maintenance services
13
Vehicle maintenance and repair
Bank accounts
Investment products, private pensions and securities
Home insurance 17
21
Fixed telephone services
Mobile telephone services
Internet provision
Tram, local bus, metro
Train services
18
Vehicle rental services
4
7
19
2Culture and entertainment
Private life insurance
Electricity services
Gas services
10
Mortgages
Private life insurance
9
TV subscriptions
Dairy products
Legal and accountancy services
Loans, credit and credit cards
Off-line gambling services
On-line gambling services
0.0
10.0
20.0
30.0
40.0
50.0
60.0
67 69 71 73 75 77 79 81 83 85 87
MP
I co
un
try
vari
ance
MPI EU score
1 Large household appliances2 Commercial sport services3 Electronic products4 Holiday accommodation5 Furniture and furnishings6 Small household appliances7 Packaged holidays & tours8 Maintenance products9 Spectacles and lenses10 Non prescription medicines11 Books, magazines and newspapers12 Bread, cereals, rice and pasta13 Personal care services14 Entertainment goods15 Personal care products16 New cars17 Vehicle insurance18 Airline services19 Cafés, bars and restaurants20 ICT products21 Postal services
Source of raw data: Market monitoring survey, 2013
2.3. Socio-demographic differences in market assessment
Markets are assessed differently by different socio-demographic groups, with the biggest
variability observed by occupation. When looking at different market components, the
differences are most pronounced in the case of complaints and trust, and smallest for choice.
The ongoing Commission study on consumer vulnerability across key markets (financial
sector, energy and online environment) - launched as a follow-up to the 8th
Consumer Markets
16
MPI variance is taken as a measure of spread (variance of the MPI for a given market and measured
across the Member States of the EU) and it is computed as follows:
EN 13 Error! No document variable supplied. EN
Scoreboard - will investigate whether some socio-demographic groups are more vulnerable to
problematic marketing practices than others. It will also propose more refined research tools
to use in connection with future Scoreboards and market studies.
Women, young people, students and better educated respondents are more positive about
market functioning
Overall, women are more positive than men in their assessment of all market clusters with the
exception of transport (where the assessments of the two groups align). The greatest gender
differences are seen in the case of automotive goods. This pattern is true for most market
components except for switching and complaints. Men switch providers or tariff plans more
often than women and consider switching to be easier. They also make fewer complaints than
women (even though they are more likely to report problems).
As for the different age groups, young people (aged 18-34) are the most positive in their
market assessments and in particular score the highest among all socio-demographic groups
on switching and second highest on comparability. Older people’s (55+ years) assessments
are also higher than average overall, accounting for third lowest percentage of reported
problems across all socio-demographic groups. Those aged 34-54 are the least optimistic
about market functioning. This largely holds for all market groups except for the automotive
cluster, assessment of which seems to improve with age. Indeed, this is the only market
cluster that the middle age group rates higher than the youngest age group, and the oldest age
group gives by far the highest scores.
Market assessment increases with the level of education, with the highest level of assessment
among students, followed by respondents who stayed in education until the age of 20 or later,
by those who went to school until 16 to 19 years old, and by people who finished their
education at the age of 15 or earlier. This pattern is the strongest for banking services, which
receive by far the lowest assessment from those with the lowest educational attainment, which
might be linked to the complexity of this group of markets. As for the different market
assessment components, the variations are particularly pronounced in the case of trust. The
lowest educated group shows a below-average level of trust across all market clusters, while
consumers with the highest educational attainment and students give above-average scores.
Across different occupational groups, blue collar workers and, in particular, the unemployed
and the self-employed are the most critical in their assessment of market performance. The
latter two groups show in particular by far the lowest levels of trust among all socio-
demographic groups. All other occupational groups score higher than average, with the
highest assessment among students, followed by house persons (not in paid employment,
taking care of the home), white collar workers who are not in a managerial position, managers
and retired persons.
Overall, consumers who use internet for private purposes are only slightly more positive in
their market assessments than those who do not. Looking at different market components,
internet users score higher on trust, switching, ease of switching, overall satisfaction and
choice. At the same time, they report more problems and complaints than the non-users.

EN 14 Error! No document variable supplied. EN
Table 3: Market assessment by socio-demographic groups
MPI Comparability Trust Problems ComplaintsActual
switching
Ease of
switching
Overall
satisfactionChoice
77,44 7,28 6,83 9,15 73,49 13,58 6,82 7,52 7,89
Diff. male-average -0.54* -0.04* -0.09* 0.45* -1.25* 0.56* 0.06* -0.06* -0.07*
Diff. female-
average0.54* 0.04* 0.09* -0.45* 1.38* -0.56* -0.06* 0.06* 0.07*
Diff. 18-34-
average0.51* 0.11* 0.11* 0.84* -1.29* 2.21* 0.14* 0.04* 0.03*
Diff. 35-54-
average-0.62* -0.05* -0.09* 0.61* -0.41 0.44* -0.05* -0.07* -0.03*
Diff. 55+ - average0.29* -0.04* 0.01 -1.47* -0.88* -2.16* -0.04* 0.04* 0.00
Diff. <15 year-
average-0.38* 0.01 -0.14* -0.45* 3.33* 0,51 -0.09* -0.04* -0.03*
Diff. 16-19 year-
average-0.11 0.02* -0.03* 0.52* -1.19* -0,06 -0.04* 0.00 0.06*
Diff. 20+-average 0.06 -0.02* 0.04* -0.15 -1.00* -0,27 0.04* 0.00 -0.02*
Diff. Still studying-
average0.95* 0.05* 0.24* -0.06 4.54* 1.17* 0.13* 0.10* -0.01
Diff. selfempl-
average-1.59* -0.07* -0.25* 2.33* 6.70* 3.13* -0.12* -0.12* -0.05*
Diff. manager-
average0.26* 0.00 0.06* 0.03 4.44* 1.66* 0.12* 0.06* 0.05*
Diff. other white-
average0.34* 0.00 0.10* -0.40* -5.09* -1.23* 0.06* -0.01 -0.04*
Diff. blue collar-
average-0.21* 0.06* -0.06* 1.12* -1.87* 1.23* 0.12* -0.01 0.07*
Diff. student-
average1.15* 0.06* 0.28* -0.02 5.57* 1.45* 0.12* 0.13* 0.02
Diff. houseperson-
average0.98* 0.17* 0.07* -0.67 2.18* -0.82* -0.01 0.11* 0.10*
Diff. unempl-
average-1.94* -0.06* -0.34* 2.30* 3.36* 3.64* -0.23* 0.10* -0.09*
Diff. retired-
average0.17* -0.07* -0.03* -1.77* 0.44 -1.95* -0.11* -0.19* 0.02*
Diff. yes - average0.03 0.00 0.02* 0.34* 0.32 0.64* 0.03* 0.01* 0.02*
Diff. no-average -0.17 -0.01 -0.12* -1.78* -2.14* -3.17* -0.17* -0.08* -0.11*
Internet Connection
at home
Population average
Gender
Age group
Education
Employment
Source of raw data: Market monitoring survey, 2013
2.4. Assessment of different market groups
In order to analyse broad market patterns, 52 individual markets have been grouped
thematically into nine market clusters: fast-moving retail goods, (semi-)durable goods,
automotive goods, telecoms, transport, utilities, banking services, insurance services, and
recreational services17
.
Table 4 shows the overall results for each market cluster and their evolution in the period
2010-2013. The colours indicate four categories of performance, depending on the quartile
that each result falls into (separately for all goods and services markets). Dark green, light
green, orange and red represent respectively high performance (the score is situated among
the top 25% of results), middle to high performance (50-75% of results), middle to low
performance (25-50% of results) and low performance (bottom 25% of results)18
.
Among goods markets, the fast-moving retail cluster receives the highest assessment,
followed by semi-durable goods. Automotive goods remain the worst performing cluster, with
a 4.5-point gap to the preceding cluster. At the same time, they have seen the highest increase
in score between 2012 and 2013 out of all clusters. The services markets clusters are clearly
led by recreational services, followed by insurance services and public transport. Banking
services are in last position despite steady improvement since 2010. Telecoms and utilities are
also ranked low by consumers.
17
The following services markets were not classified in any of the clusters: ‘legal and accountancy’,
‘personal care’, ‘maintenance’, ‘real estate’, ‘vehicle rental’ and ‘vehicle maintenance and repair’. 18
The colours indicated in the second to fourth columns indicate to which quartile the market cluster MPI
belonged in 2012, 2011 and 2010 respectively.

EN 15 Error! No document variable supplied. EN
Table 4: MPI (Market Performance Indicator) per market cluster
MPI 2013 Diff 2013-2012 Diff 2012-2011 Diff 2011-2010
Fast moving retail 81.0 -0.2 0.9 1.0
(semi)-durable goods 80.6 -0.1 1.2 1.8
Automotive goods 76.0 1.2 0.6 0.1
Recreational services 79.1 -0.8 0.8 0.9
Insurance services 76.3 0.7 0.4 -0.5
Transport 75.8 0.7 0.4 0.1
Utilities 74.4 0.9 0.2 -0.8
Telecoms 73.5 0.2 2.2 0.1
Banking services 71.5 0.7 0.8 2.2
Goods
Services
The following sections present more detailed results per market cluster. For each cluster, a
graph presents the MPI and component scores for 2013 (as well as their evolution since
2012), the performance of individual markets included in a given cluster and the cluster's
share in the household budget19
. The colour coding is the same as explained above.
2.4.1. Fast moving retail
Comparability 7.7
Trust 7.1
% Problems 5.0%
% Complaints 61.5%
Expectations7.9
Choice 8.3
Average MPI: 81.0
0.0
0.00.0
0.0%-0.1
-2.5%
-0.2
• Dairy products• Alcoholic drinks• Personal care products
• Books, magazines and newspapers
• Non-alcoholic drinks• Bread, cereals, rice and pasta
• Non prescription medicines
• Fruit and vegetables• Meat and meat products
% HBS:18%
The fast moving retail cluster is composed of nine goods markets (including six food and
drink markets), characterised by a high use and purchase frequency as well as high
‘substitutability’ of products. Altogether, these markets account for an important share of the
household budget (18%).
Good performance except for meat and fruit & vegetables markets
Given its importance in terms of household expenditure, it is encouraging that this cluster is
assessed as generally performing well, with above-median scores on comparability and choice
and relatively low incidence of problems and complaints. This is not surprising, given that
most products sold in these markets are relatively straightforward and low-value items.
The two notable exceptions to the positive assessment of this cluster are the markets for 'meat
and meat products' and 'fruit and vegetables', ranked lowest and fifth lowest among goods
markets, respectively. The Commission's 2012 in-depth study into the meat market found that
the main problems for consumers were limited availability of consumer information in
butchers’ shops, poor consumers' understanding of some key information elements (e.g. sell-
by date) as well as high prices and limited choice of specific meat types (such as organic or
19
Estimated on the basis of Eurostat 2005 (latest available) data from the Household Budget Survey
(HBS).

EN 16 Error! No document variable supplied. EN
animal welfare certified)20
. The entry into force of the new food labelling rules21
- which will
make it mandatory to indicate country of origin or place of provenance for unprocessed meat
of pigs, poultry, sheep and goats - is likely to increase consumers' ability to make informed
choices and reduce the risks of being misled on the characteristics of products.
2.4.2. (Semi-) durable goods markets
Comparability 7.7
Trust 7.2
% Problems 8.5%
% Complaints 76.1%
Expectations7.9
Choice 8.2
Average MPI: 80.6
-0.1
-0.10.0
-0.1%0.0
-2.9%
-0.1
• Small household appliances• Large household appliances
• Spectacles and lenses• Entertainment goods
• Furniture and furnishings• Maintenance products• Electronic products
• ICT products• Clothing and footwear
% HBS:12%
The (semi-)durable goods cluster encompasses nine goods markets (including household
goods, furnishings and clothing) that are used on a daily or frequent basis, but purchased
occasionally, requiring more substantial one-off spending. Overall, these markets account for
about 12% of the household budget.
Relatively good performance despite a high number of complaints
The markets in this cluster show a mixed performance. 'Spectacles and lenses' and
'entertainment goods' are among the best performing goods markets, while 'clothing and
footwear' and 'ICT products' are positioned towards the bottom of the goods markets ranking
(4th
and 6th
lowest position, respectively).
Most (semi)-durable goods components are given a middle to low assessment, with the
exception of trust (which is rated higher) and complaints (which are common in this market
cluster). This could be linked to the fact that most (semi-)durable goods have an ‘after sales’
element and retailers are required to offer a minimum duration of legal guarantee on products
sold. The Commission has recently launched an in-depth market study on the functioning of
legal and commercial guarantees in selected (semi-)durable goods markets (including
electronic products; ICT products; electrical household appliances; clothing and footwear;
new cars and second-hand cars) with a view to ensuring that EU legislation is consistently
implemented and applied across the Single Market.
20
http://ec.europa.eu/consumers/consumer_research/market_studies/meat_market_study_en.htm. 21
Regulation (EU) No 1169/2011, OJ L 304, 22.11.2011, p. 18.

EN 17 Error! No document variable supplied. EN
2.4.3. Automotive cluster
Comparability 7.3
Trust 6.3
% Problems 10.8%
% Complaints 71.1%
Expectations7.5
Choice 8.1
Average MPI: 76.0
0.1
0.00.2
-0.4%0.2
-5.2%
1.2
• Fuel for vehicles• Second hand cars
% HBS:7%
• New cars
The automotive goods cluster contains three markets linked to personal motorised
transportation: new cars, second-hand cars and fuel for vehicles. Together, these markets
account for around 7% of the household budget.
Poor, but improving, performance
This market cluster continues to be problematic for consumers, with markets for second-hand
cars and vehicle fuels at the very bottom of the goods markets ranking and new cars in
seventh lowest position. All the components (except for complaints) are rated as poor.
However, the cluster has seen a consistent improvement in performance since 2010 and the
biggest increase in score between 2012 and 2013 out of all the goods and services clusters.
The Commission's recent in-depth study into the market for vehicle fuels has confirmed the
central importance of clear and transparent consumer information, identifying differences in
fuel labelling both across and within EU countries (e.g. different colours for basic fuel types),
insufficient information on fuel quality and vehicle compatibility, as well as the practice of
frequent price changes, as the main factors limiting consumers' ability to make informed
choices in the market22
. An ongoing study on the functioning of the market for second-hand
cars will, inter alia, review the regulatory framework of the second-hand cars markets in all
Member States, assess dealers' practices and consider whether the information provided to
consumers is transparent enough to allow them to make informed choices, and identify the
main problems experienced by consumers.
22
The consumer market study and an accompanying Commission Staff Working Document on the
functioning of the market for vehicle fuels from a consumer perspective (to be published in June 2014)
http://ec.europa.eu/consumers/consumer_evidence/market_studies/vehicle_fuels/docs/study_en.pdf

EN 18 Error! No document variable supplied. EN
2.4.4. Recreational services
Comparability 7.5
Trust 7.0
% Problems 6.4%
% Complaints 72.3%
Expectations7.6
Choice 7.9
Average MPI: 79.1
-0.1
-0.1-0.1
0.3%-0.1
-4.6%
-0.8
• On-line gambling services • Off-line gambling services
• Culture and entertainment• Commercial sport services• Holiday accommodation• Cafés, bars and restaurants• Packaged holidays and tours
% Switching13.7%
-0.1%
Ease of switching7.6
0.0
% HBS:8%
The recreational services cluster comprises all markets that offer services used by consumers
in their leisure time, which together cover 8% of the household budget.
Best performer among services markets
Perhaps due to the inherent entertainment aspect of recreational services, this market cluster
receives by far the highest evaluation among services markets, with very good or good scores
on all the components.
All of the individual markets are assessed above the median of the services markets and the
majority of them are situated in the top quartile. The only exceptions are the markets for
online and offline gambling.
Even though recreational services are in general assessed better than other services markets,
they account for a relatively large number of cross-border complaints received by the network
of European Consumer Centres23
. Likewise, an EU-wide investigation of websites selling air
travel and hotel accommodation in 2013 found that 69% of the 552 websites checked were in
breach of consumer protection rules24
. The Commission has taken targeted action to further
enhance consumer conditions in this sector. For instance, the proposed update to the 1990
Package Travel Directive25
extends the protection for traditional ready-made travel packages
to customised travel arrangements bought over the internet. The ongoing study on online
consumer reviews in the hotel sector investigates the problem of misleading and fake reviews,
and will identify best practices to address this issue (results are due mid-2014). As regards
online gambling, a Commission Recommendation will be presented in 2014 aimed at ensuring
that consumers of online gambling services enjoy a common high level of protection
throughout the internal market.26
23
The European Consumer Centres Network 2012 Annual Report,
http://ec.europa.eu/consumers/ecc/docs/report_ecc-net_2012_en.pdf 24
http://ec.europa.eu/consumers/enforcement/sweep/online_travel_booking/ 25
COM(2013) 513 final, http://ec.europa.eu/justice/consumer-marketing/files/com_2013_513_en.pdf 26
http://ec.europa.eu/internal_market/gambling/initiatives/index_en.htm

EN 19 Error! No document variable supplied. EN
2.4.5. Insurance services
Comparability 7.1
Trust 6.6
% Problems 6.0%
% Complaints 73.0%
Expectations7.3
Choice 8.1
Average MPI: 76.3
0.0
0.00.1
-0.6%0.1
-3.6%
0.7• Vehicle insurance• Home insurance
% Switching11.5%
-0.5%
Ease of switching7.1
0.0
% HBS:2%
• Private life insurance
The insurance services cluster groups the markets for home, vehicle and private life insurance,
which together account for 2% of the household budget.
Low incidence of consumer problems
The cluster is assessed as medium to high performing, despite poorer performance of private
life insurance. The majority of components, except for trust and switching, are assessed
relatively well. The score for choice is the highest among services market clusters and the
incidence of problems is the lowest. The latter could be linked to the fact that actual claims on
insurance policies are relatively rare, so there is less scope for problems to arise than in other
markets.
EN 20 Error! No document variable supplied. EN
2.4.6. Public transport
Comparability 7.1
Trust 6.9
% Problems 12.6%
% Complaints 68.6%
Expectations7.2
Choice 7.4
Average MPI: 75.8
0.0
-0.10.1
-1.5%0.1
0.9%
0.7
• Tram, local bus, metro
• Airline services % HBS:1%
• Train services
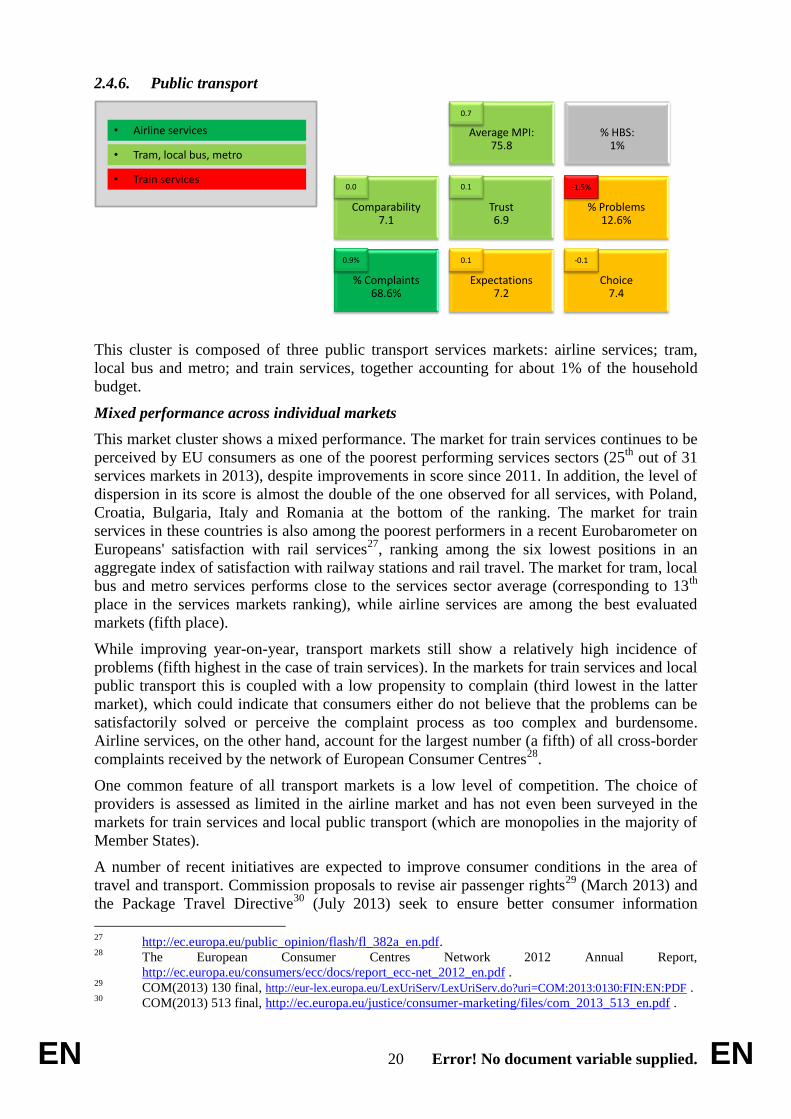
This cluster is composed of three public transport services markets: airline services; tram,
local bus and metro; and train services, together accounting for about 1% of the household
budget.
Mixed performance across individual markets
This market cluster shows a mixed performance. The market for train services continues to be
perceived by EU consumers as one of the poorest performing services sectors (25th
out of 31
services markets in 2013), despite improvements in score since 2011. In addition, the level of
dispersion in its score is almost the double of the one observed for all services, with Poland,
Croatia, Bulgaria, Italy and Romania at the bottom of the ranking. The market for train
services in these countries is also among the poorest performers in a recent Eurobarometer on
Europeans' satisfaction with rail services27
, ranking among the six lowest positions in an
aggregate index of satisfaction with railway stations and rail travel. The market for tram, local
bus and metro services performs close to the services sector average (corresponding to 13th
place in the services markets ranking), while airline services are among the best evaluated
markets (fifth place).
While improving year-on-year, transport markets still show a relatively high incidence of
problems (fifth highest in the case of train services). In the markets for train services and local
public transport this is coupled with a low propensity to complain (third lowest in the latter
market), which could indicate that consumers either do not believe that the problems can be
satisfactorily solved or perceive the complaint process as too complex and burdensome.
Airline services, on the other hand, account for the largest number (a fifth) of all cross-border
complaints received by the network of European Consumer Centres28
.
One common feature of all transport markets is a low level of competition. The choice of
providers is assessed as limited in the airline market and has not even been surveyed in the
markets for train services and local public transport (which are monopolies in the majority of
Member States).
A number of recent initiatives are expected to improve consumer conditions in the area of
travel and transport. Commission proposals to revise air passenger rights29
(March 2013) and
the Package Travel Directive30
(July 2013) seek to ensure better consumer information
27
http://ec.europa.eu/public_opinion/flash/fl_382a_en.pdf. 28
The European Consumer Centres Network 2012 Annual Report,
http://ec.europa.eu/consumers/ecc/docs/report_ecc-net_2012_en.pdf . 29
COM(2013) 130 final, http://eur-lex.europa.eu/LexUriServ/LexUriServ.do?uri=COM:2013:0130:FIN:EN:PDF . 30
COM(2013) 513 final, http://ec.europa.eu/justice/consumer-marketing/files/com_2013_513_en.pdf .

EN 21 Error! No document variable supplied. EN
(respectively in case of delayed or cancelled flights and when buying combinations of travel
services) and strengthen passenger protection when something goes wrong. A fact-finding
study on passenger rights in urban public transport31
is expected to lead to the development of
a set of ambitious voluntary commitments to protect the rights of travellers and of persons
with reduced mobility. Finally, the urban mobility package32
of December 2013 aims at
making urban mobility easier and greener.
2.4.7. Utilities
Comparability 6.5
Trust 6.6
% Problems 10.2%
% Complaints 71.8%
Expectations7.3
Choice 6.5
Average MPI: 74.4
0.1
0.20.1
-0.2%0.1
-3.5%
0.9• Postal services
• Electricity services
% Switching10.2%
0.1%
Ease of switching6.4
0.2
% HBS:4%
• Water supply• Gas services
Th
e utilities cluster comprises four markets that provide public utilities. These markets are often
characterised by the presence of a limited number of potential suppliers. Such services are
used on a daily or frequent basis and account for 4% of the household budget.
Low scores for comparability, choice and switching
While assessed as middle to low performing overall, the utilities market cluster shows a
mixed performance across individual markets. Electricity services rank fourth lowest among
the services markets, despite slight improvements since 2011, with market performance
differing significantly from one country to another and particularly low scores recorded in
southern European countries. Water supply and gas services are assessed slightly better
(corresponding to 22nd
and 16th
place in the services markets ranking), while postal services
are among the middle to high performing markets (12th
place).
Despite improvements since 2012, utilities markets continue to score poorly on comparability of
offers, choice of providers (this component was not measured in the water provision market,
which is a monopoly in most countries), ease of switching and actual switching (the latter two
questions were only asked in respect of electricity and gas markets). This suggests that
consumers are not yet able to actively participate in the market and benefit from market
liberalisation.
The Commission is working with key stakeholders on increasing the transparency of energy
offers and bills, ensuring customers' access to their consumption data (also by promoting
smart meter roll-out) and facilitating switching33
. In the postal sector, the Commission's
December 2013 Communication on a roadmap for completing the Single Market for parcel
31
http://ec.europa.eu/transport/themes/urban/studies/doc/2012-11-fact-finding-study-passenger-rights.pdf 32
http://ec.europa.eu/transport/themes/urban/ump_en.htm . 33
http://ec.europa.eu/consumers/archive/strategy/docs/consumer_agenda_2012_en.pdf

EN 22 Error! No document variable supplied. EN
delivery, build trust in delivery services and encourage online sales34
attributes specific tasks
to stakeholders to increase transparency and information on delivery solutions, improve the
availability, quality and affordability of delivery solutions, and enhance complaint handling
and redress mechanisms for consumers.
2.4.8. Telecoms
• Fixed telephone services• TV-subscriptions
Comparability 7.1
Trust 6.4
% Problems 17.5%
% Complaints 83.1%
Expectations7.3
Choice 7.5
Average MPI: 73.5
0.0
0.10.0
0.0%0.0
-1.1%
0.2
% Switching17.9%
0.8%
Ease of switching6.9
0.1
% HBS:3%
• Internet provision• Mobile telephone services
Th
e telecom cluster includes the markets for fixed and mobile telephone services along with the
markets for internet provision and TV subscriptions, which together make up 3% of the
household budget. These markets are characterised by a limited number of potential suppliers.
Telecom services are generally used on a daily or frequent basis, whereas the decision on
potential supplier is often made from a long-term perspective, usually through the signing of a
contract.
High incidence of problems and complaints
This market cluster is rated as middle to low performing, with relatively low scores for trust,
choice of providers and overall consumer satisfaction, and the highest incidence of problems
and complaints of all the market clusters. On the positive side, the scores for comparability
and ease of switching and the switching rates are the highest among all cluster groups.
In September 2013, the Commission adopted the 'Connected Continent' legislative package35
laying down measures concerning the European single market for electronic communications
and aiming at inter alia enhancing the provision of and access to electronic communications
services across the EU, pushing roaming premiums out of the market by 2016 at the latest and
improving consumers' choice of telecom providers and services (including from other EU
countries). In addition, the proposal strengthens and harmonises consumer rights in the field
of electronic communications across the EU, in particular with regard to: elimination of
restrictions and discrimination; cross-border dispute resolution mechanisms; freedom to
provide and avail of open internet access and safeguards for quality of services; enhancing the
34
COM/2013/0886final;
http://eur-lex.europa.eu/LexUriServ/LexUriServ.do?uri=CELEX:52013DC0886:EN:NOT. 35
Commission proposal for a Regulation of the European Parliament and of the Council laying down
measures concerning the European single market for electronic communications and to achieve a
Connected Continent - COM(2013) 627 final.
http://ec.europa.eu/digital-agenda/en/connected-continent-single-telecom-market-growth-jobs

EN 23 Error! No document variable supplied. EN
transparency and publication of information, including through comparison tools; enhanced
information requirements for contracts of fixed and mobile telephony and internet access
services; control of consumption measures; contract duration and termination rules;
provisions on bundled offers of services; and facilitating switching providers. The proposal
builds inter alia on the results of an in-depth study and a related Staff Working Document36
on
the functioning of the market for internet access and provision from a consumer perspective.
2.4.9. Banking services
Comparability 6.5
Trust 6.1
% Problems 11.4%
% Complaints 75.2%
Expectations6.8
Choice 7.6
Average MPI: 71.5
0.1
-0.10.1
-0.5%0.1
-2.1%
0.7
• Loans, credit and credit cards
• Bank accounts• Mortgages• Investment products, private
pensions and securities
% Switching12.5%
-0.2%
Ease of switching6.5
0.1
% HBS:0.1%
The banking services cluster includes the markets for bank accounts; loans, credit and credit
cards; mortgages; and investment products. This market cluster has an important impact on the
general financial situation of households, given its link with their financial assets and liabilities,
despite its relatively low share in household expenditure (as measured by Eurostat)37
.
Poor scores on all components
Banking services are the worst performing cluster from a consumer perspective, with the
markets for investment products and mortgages occupying the two bottom places in the
services markets ranking. However, all markets in this cluster have seen a consistent
improvement in performance over the past four years.
The cluster scores particularly low on trust, comparability, ease of switching and overall
consumer satisfaction, and relatively better (in line with the average for all services) on choice.
This suggests that choice among providers is less of a problem than issues such as transparency
of offers and businesses' compliance with consumer legislation.
Ensuring that financial services are working to the benefit of consumers in the current
economic climate is an essential component of EU consumer policy. The recently adopted
Directive on mortgage credit38
as well as the soon to be adopted legislation on packaged retail
investment products (PRIPs)39
and payment accounts (PAD)40
and the forthcoming review of
36
http://ec.europa.eu/consumers/consumer_research/market_studies/internet_services_provision_study_en.htm, the
study was carried out as a follow-up to the 4th Consumer Markets Scoreboard.
37
This mainly stems from the fact that in the case of 'loans, credit and credit cards' and 'mortgages', only
charges associated with the loans are included. 38
OJ L 60 of 28.02.2014. 39
http://europa.eu/rapid/press-release_STATEMENT-14-129_en.htm .

EN 24 Error! No document variable supplied. EN
other legislation dealing with consumer protection on investment services41
aim to improve
consumer conditions inter alia by means of more transparent and comparable pre-contractual
information, making it easier for consumers to choose the products that best suit their needs.
The PAD also facilitates switching from one payment services provider to another and
ensures that every EU citizen has the right of access to basic payment account services.
Furthermore, the recently adopted report on the implementation of the Consumer Credit
Directive42
analyses the functioning of the consumer credit market and the impact of
regulatory choices taken by the Member States.
2.5. Market assessment components
The following sections present individual results for different market assessment components.
Additionally, the average scores for all 52 markets as well as for the 21 goods and 31 services
markets are indicated where relevant. Most scores (unless stated otherwise) reflect the
answers on a scale from 0 to 10 and have been grouped into three categories: high rating
(score 8-10), average rating (score 5-7) and low rating (score 0-4).
2.5.1. Comparability
The ability to easily and reliably compare price and quality of different goods and services is
indispensable for consumers to be able to make informed choices. As in previous years,
consumers find it considerably more difficult to compare services than goods. In fact, the
comparability component records the biggest difference between the average scores of the
two market groups (7.0 and 7.7, respectively). To some extent, this can be linked to the very
nature of services, which are by definition less tangible than goods and thus their quality is
more difficult to evaluate. However, this inherent intangibility of services may be further
exacerbated by 'confusopoly' marketing practices such as overly abundant and opaque offers,
packaging products into unduly complex bundles and complicated contractual terms, which
hamper consumers' ability to choose the best deal43
. For instance, there is evidence showing
that the complexity of contract terms and conditions leads many consumers to accept their
contractual obligations without reviewing them44
. The recent Commission report on the
implementation of the Consumer Credit Directive has shown that many borrowers do not even
recall the essential elements of their credit contracts 45
. This is not good for consumers (who
run the risk of blindly accepting disadvantageous contractual obligations) and thus for the
market in general.
40
http://europa.eu/rapid/press-release_STATEMENT-14-123_en.htm . 41
Namely the review of the "Markets on Financial Instruments Directive" ( MiFID-2) and of the Directive
on the retail investment funds (UCITS-5) . 42
http://ec.europa.eu/consumers/rights/docs/ccd_implementation_report_en.pdf 43
Office of Fair Trading, An Introduction to Confusopoly:
http://oft.gov.uk/shared_oft/events/confusopoly/introduction-confusopoly.pdf
44 Special Eurobarometer 342 on Consumer empowerment, April 2011,
http://ec.europa.eu/consumers/consumer_empowerment/docs/report_eurobarometer_342_en.pdf
The Guardian, Terms and conditions: not reading the small print can mean big problems, 11th May
2011.
Bakos, Yannis; Marotta-Wurlger, Florencia; and Trossen, David R., "Does Anyone Read the Fine Print?
Testing a Law and Economics Approach to Standard Form Contracts" (2009). New York University Law
and Economics Working Papers. Paper 195. 45
http://ec.europa.eu/consumers/rights/docs/ccd_implementation_report_en.pdf

EN 25 Error! No document variable supplied. EN
Complex markets and utilities are difficult to compare
As shown in Figure 3, among goods markets, comparison is most difficult in the markets for
second-hand cars, non-prescription medicines and fuel for vehicles, as has been the case in
two previous waves of the survey. Among services markets, the ranking of bottom markets
has also remained stable, with banking services (investment products, mortgages, bank
accounts), utilities (water supply, electricity services, gas services); real estate services and
legal and accountancy services perceived as the most difficult to compare. The biggest
improvements in score were noted in the markets for vehicle fuels, train services and water
supply (all +0.2).
Comparing markets' scores on comparability with their overall evaluation (MPI scores), the
markets for water supply; spectacles and lenses; non-prescription medicines; postal services;
and legal and accountancy services are assessed particularly poorly on this component. In
contrast, telecom markets (internet provision, mobile telephone services, TV-subscriptions)
and the fruit and vegetables market rank higher on comparability than in terms of overall
MPI.

EN 26 Error! No document variable supplied. EN
Figure 3: Comparability
22%
20%
18%
21%
17%
14%
15%
16%
14%
16%
15%
15%
12%
14%
14%
13%
12%
14%
13%
9%
11%
10%
10%
11%
7%
6%
6%
6%
6%
7%
6%
5%
11%
13%
13%
8%
7%
8%
9%
8%
7%
8%
7%
7%
6%
7%
5%
5%
5%
6%
5%
5%
5%
4%
10%
43%
37%
42%
35%
38%
45%
42%
41%
42%
37%
40%
38%
42%
39%
35%
37%
37%
34%
37%
41%
38%
35%
36%
33%
36%
36%
35%
33%
32%
32%
32%
31%
37%
32%
29%
35%
33%
33%
31%
31%
34%
30%
31%
30%
29%
28%
29%
31%
29%
27%
28%
28%
27%
28%
35%
35%
43%
40%
43%
45%
41%
43%
43%
44%
47%
45%
47%
46%
47%
51%
49%
50%
52%
50%
50%
51%
54%
54%
56%
56%
58%
59%
61%
62%
61%
62%
65%
52%
55%
58%
57%
60%
59%
60%
61%
59%
63%
62%
64%
65%
65%
65%
64%
65%
67%
67%
67%
67%
68%
55%
6.1
6.3
6.3
6.4
6.6
6.6
6.6
6.6
6.7
6.7
6.7
6.9
6.9
6.9
7.0
7.0
7.0
7.1
7.1
7.1
7.1
7.2
7.3
7.3
7.4
7.5
7.6
7.7
7.7
7.7
7.8
7.8
7.2
7.2
7.3
7.4
7.6
7.6
7.6
7.6
7.6
7.7
7.7
7.7
7.8
7.8
7.8
7.9
7.9
7.9
7.9
7.9
8.0
8.0
7.3
0.1
0.2*
0.1*
0.1*
0.1*
0.1*
0.1*
0.1*
0.1*
0.2*
0
0.1*
0
0
0
0
0*
0.1
-0.1*
0
0.1*
0
0.1*
0
0
0
0
-0.1*
0
0
0
0.1
0.2*
-0.1*
0
-0.1*
0.2*
-0.1*
-0.1*
-0.1*
0*
0
-0.1*
-0.1*
0
0*
-0.1*
-0.1*
0
-0.1*
0
0
0
0.1*
0
0
0.2*
0
0.1*
0.1*
0
0.1*
0.1*
0.2*
-0.1*
0.1*
0.1*
0
0.1*
0.1*
0.1*
0.3*
0.1*
0.3*
0.1*
0
0.1*
0
0
0.1*
0.1*
0.1*
0.1*
0.1*
0.1*
0
0.2*
0.1*
0.2*
0.2*
0.1
0.2*
0.2*
0.1*
0.1*
0.2*
0.3*
0.1*
0.1*
0.1*
0.2*
0.2*
0.2*
0.1*
0.2*
0.1*
0.2*
-0.3*
-0.3*
0
0.1*
0
-0.3*
-0.2*
0.1*
0
-0.1*
0.2*
0*
0.2*
0.1*
0.1*
0.1*
0
0.2*
0
0
0.2*
0.3*
0.1*
0.2*
0.1*
0.1*
-0.1*
0.2*
0.2*
0.2*
0.1*
0.3*
0.2*
0.2*
0.2*
0.2*
0.2*
0.3*
0.1*
0.2*
0.1*
0.2*
0
0.2*
0.1*
Investment products
Water supply
Mortgages
Electricity services
Gas services
Real estate services
Legal and accountancy services
Bank accounts
Private life insurance
Train services
Loans, credit and credit cards
Postal services
Maintenance services
Vehicle maintenance and repair
Tram, local bus, metro
Fixed telephone services
Services markets
Mobile telephone services
Internet provision
On-line gambling services
Home insurance
TV-subscriptions
Off-line gambling services
Vehicle insurance
Vehicle rental services
Packaged holidays & tours
Commercial sport services
Culture and entertainment
Airline services
Cafés, bars and restaurants
Personal care services
Holiday accommodation
Second hand cars
Non-prescription medicines
Fuel for vehicles
Meat and meat products
New cars
Furniture and furnishings
Clothing and footwear
Spectacles and lenses
Maintenance products
ICT products
Goods markets
Personal care products
Electronic products
Fruit and vegetables
Dairy products
Entertainment goods
Alcoholic drinks
Large household appliances
Bread, cereals, rice and pasta
Small household appliances
Books, magazines and newspapers
Non-alcoholic drinks
EU28 - All markets
On a scale from 0 to 10, how difficult or easy was it to compare <the services/products> sold by different <suppliers/retailers> ?
0-4 5-7 8-10
2013
Services
Goods
Diff 2012-2011
Diff 2013-2012
Diff 2011-2010
Source: Market monitoring survey, 2013
A number of horizontal and sectorial initiatives at EU level aim at enhancing the transparency
of consumer markets and thus reducing search costs and boosting consumers' ability to
evaluate alternative offerings. Internet offers a considerable opportunity for consumers to
compare price and quality, and is increasingly used to inform both online and offline
purchases. The Commission has been working, together with stakeholders, on improving the
reliability and transparency of digital comparison tools. Following a report from the multi-
stakeholder group (presented at the March 2013 Consumer Summit46
), an ongoing in-depth
46
http://ec.europa.eu/consumers/documents/consumer-summit-2013-msdct-report_en.pdf

EN 27 Error! No document variable supplied. EN
study will inform decisions on the way forward, which could include the development of
horizontal guidelines on the functioning of comparison tools. In the telecom sector, the
“Connected Continent” proposal47
contains enhanced provisions on information requirements
for contracts, including clear, comprehensive and easily accessible information as regards
contracts for electronic communications (including internet access services), and enhanced
transparency and publication of information measures, with more comparable information,
including in particular end-user rights to access certified comparison tools in all Member
States. In the area of financial services, the recently adopted Directive on mortgage credit48
as
well as the soon to be adopted legislation on packaged retail investment products (PRIPs)49
and payment accounts (PAD)50
and a review of other legislation dealing with consumer
protection on investment services51
will enhance transparency, and simplify and standardise
pre-contractual information that is provided to consumers on the characteristics of financial
products on offer. The PAD also standardises ex-post fee information and gives consumers
access to at least one comparison website comparing payment account offers in each Member
State that meets certain quality criteria. As a result, consumers will be able to better compare
different offers and ultimately choose the ones that best suit their needs. As regards postal
services, the Commission Communication Roadmap on parcel delivery aims at increasing
transparency and possibilities of comparison of offers52
. Finally, in the framework of the
Citizens’ Energy Forum, the multi-stakeholder Working Group Report on e-Billing and
Personal Energy Data Management highlights best practices on how to improve transparency,
comparability and, ultimately, consumer trust and participation in energy markets.53
2.5.2. Trust
The ‘trust’ component measures the extent to which consumers trust businesses to respect
consumer protection rules. It can therefore be seen as a proxy for the level of compliance with
consumer legislation. Proper enforcement is crucial not only to minimise consumer detriment,
but also to protect respectable businesses from unfair competition. Trust in retailers (7.1)
remains higher than in service providers (6.7), even though the latter has increased slightly
compared to 2012 (by 0.1 point).
Low trust linked to information asymmetry
As in previous years, the market for second-hand cars is the least trusted out of all 52 markets
surveyed. The fuel for vehicles market comes second last among goods markets, and the
market for meat and meat products ranks third lowest. Among services markets, continuous
services are generally assessed worse than one-off services. More than a fifth of respondents
do not trust suppliers in the markets for mortgages; real estate services; bank accounts;
investment products; electricity services; mobile telephone services; and loans, credit and
credit cards.
47
Commission proposal for a Regulation of the European Parliament and of the Council laying down
measures concerning the European single market for electronic communications and to achieve a
Connected Continent - COM(2013) 627 final.
http://ec.europa.eu/digital-agenda/en/connected-continent-single-telecom-market-growth-jobs 48
OJ L 60 of 28.02.2014 49
http://europa.eu/rapid/press-release_STATEMENT-14-129_en.htm 50
http://europa.eu/rapid/press-release_STATEMENT-14-123_en.htm 51
Namely the review of the "Markets on Financial Instruments Directive" ( MiFID-2) and of the Directive
on the retail investment funds (UCITS-5) 52
COM/2013/0886final; http://eur-lex.europa.eu/LexUriServ/LexUriServ.do?uri=CELEX:52013DC0886:EN:NOT 53
http://ec.europa.eu/energy/gas_electricity/doc/forum_citizen_energy/20131219-e-
billing_energy_data.pdf

EN 28 Error! No document variable supplied. EN
In general, it appears that trust is lowest in those markets where the asymmetry of information
between the trader and the consumer is the most acute. Second-hand cars, banking services,
and real estate services, all of which lie at the bottom of the trust ranking, are also classic
examples of situations where the seller is usually better informed than the buyer.
Comparing the results on trust with the overall MPI results, a negative impact of the trust
component can be noted in the markets for alcoholic drinks, online gambling services and
home insurance. The opposite trend can be seen in the markets for non-prescription
medicines; postal services; legal and accountancy services; and train services.
Trust in meat market drops following the horsemeat scandal
The market for meat and meat products has seen its trust score drop by 0.5 points since 2012
(biggest change on any single component). The drop was the highest in the UK (-1.9) and
Ireland (-1.6), two of the countries most affected by the horsemeat scandal. The biggest
increases in the trust score were noted in the markets for vehicle fuels; vehicle rental services
(+0.3 both); house maintenance services; investment products; mortgages; and clothing and
footwear (all +0.2).

EN 29 Error! No document variable supplied. EN
Figure 4: Trust
23%
22%
24%
22%
23%
22%
21%
18%
17%
18%
18%
17%
17%
14%
16%
15%
15%
15%
16%
16%
14%
11%
13%
12%
9%
9%
10%
6%
9%
5%
5%
6%
26%
21%
20%
13%
13%
11%
10%
11%
11%
7%
8%
9%
7%
8%
9%
7%
7%
10%
9%
8%
5%
5%
13%
42%
46%
37%
43%
38%
41%
40%
45%
45%
41%
40%
40%
43%
47%
42%
43%
40%
41%
41%
37%
39%
45%
39%
40%
46%
43%
42%
46%
38%
39%
39%
36%
45%
40%
40%
40%
39%
41%
41%
39%
39%
43%
43%
40%
42%
41%
38%
40%
40%
34%
36%
35%
32%
32%
40%
35%
33%
39%
35%
38%
37%
39%
37%
39%
40%
42%
43%
40%
39%
42%
42%
45%
44%
44%
48%
47%
44%
48%
48%
45%
48%
48%
48%
52%
55%
56%
58%
29%
40%
40%
47%
49%
48%
49%
50%
50%
49%
49%
51%
51%
51%
54%
53%
53%
56%
55%
57%
62%
62%
46%
6.0
6.0
6.1
6.1
6.2
6.2
6.3
6.4
6.5
6.5
6.5
6.5
6.5
6.6
6.6
6.7
6.7
6.7
6.7
6.8
6.8
6.9
6.9
7.0
7.0
7.0
7.0
7.2
7.2
7.4
7.5
7.6
5.8
6.3
6.4
6.9
6.9
7.0
7.0
7.1
7.1
7.1
7.2
7.2
7.2
7.3
7.3
7.3
7.3
7.3
7.3
7.4
7.7
7.7
6.8
0.2*
0.1*
0
0.2*
0.1
0.1*
0
0
0.1*
0.1
0
#N/A
0
0.2*
0.2*
0.1*
0.1*
0.1*
0.1*
0.1*
#N/A
-0.1
0.1*
0
0
0.3*
-0.1*
0.1*
0.1*
0.1*
0
0
0.1*
0.3*
-0.5*
-0.1*
0
0.1*
0
0.2*
0
0
0
0
0
0
0
-0.1*
-0.1*
0
0
0
0
0
0*
-0.1
0.1*
0
0
0
0
0.1*
0.1*
0
-0.1*
0.1*
#N/A
0.1*
0
0.2*
0
0.4*
0*
-0.1
0
#N/A
0.1*
0
-0.1
0.1*
0
0.1*
0.1*
-0.1*
0.1*
0.1*
0
0.1*
-0.1
0.2*
0.2*
0.2*
0
0.1*
0.2*
0.1*
0.2*
0.1*
0
0.1*
0.1*
0
0.2*
0.2*
0
0.1*
0.1*
0.1*
0
0.1*
#N/A
0.1
0
0.5*
-0.2*
0
#N/A
0.2*
#N/A
0.2*
0.2*
#N/A
-0.2*
-0.1*
-0.2*
0
#N/A
0*
0.1*
0
#N/A
0.2*
#N/A
0
0.1*
0
0.1*
0
0
0.1*
0
0.2*
0
-0.1*
0.2*
0
0.1*
0.1*
0.1
0.3*
0.2*
0.3*
0.2*
0.2*
0.1*
0.4*
#N/A
0.1*
0.1*
0.4*
0.3*
0.2*
#N/A
0
0.1*
Mortgages
Real estate services
Bank accounts
Investment products
Electricity services
Mobile telephone services
Loans, credit and credit cards
Internet provision
Private life insurance
Gas services
Fixed telephone services
On-line gambling services
Vehicle maintenance and repair
Maintenance services
Train services
Home insurance
TV-subscriptions
Services markets
Vehicle insurance
Water supply
Off-line gambling services
Cafés, bars and restaurants
Legal and accountancy services
Tram, local bus, metro
Packaged holidays & tours
Vehicle rental services
Airline services
Holiday accommodation
Postal services
Commercial sport services
Culture and entertainment
Personal care services
Second hand cars
Fuel for vehicles
Meat and meat products
Fruit and vegetables
Alcoholic drinks
New cars
ICT products
Clothing and footwear
Goods markets
Maintenance products
Furniture and furnishings
Personal care products
Electronic products
Entertainment goods
Dairy products
Large household appliances
Small household appliances
Non-prescription medicines
Non-alcoholic drinks
Bread, cereals, rice and pasta
Spectacles and lenses
Books, magazines and newspapers
EU28 - All markets
On a scale from 0 to 10, to what extent do you trust <suppliers/retailers> to respect the rules and regulations protecting consumers?
0-4 5-7 8-10
2013
Services
Goods
Diff 2012-2011
Diff 2013-2012
Diff 2011-2010
Source: Market monitoring survey, 2013
The EU has taken a number of initiatives to strengthen consumer protection in the low-trust
markets. The above-mentioned initiatives in the banking services and telecom areas all aim to
reduce information imbalance between providers and consumers, by making sure that sellers
cannot hide crucial information from consumers such as variable rate loans and foreign
currency loans in the case of mortgages or in the field of electronic communications actual
speeds provided to customers and data volume limitations in the case of internet access

EN 30 Error! No document variable supplied. EN
services. In the second-hand car market, the roadworthiness package, recently adopted54
,
clamps down on mileage (odometer) fraud through the registering of mileage readings and
making odometer manipulation a punishable offence. The Commission's ongoing in-depth
study is expected to shed further light on dealers' practices and compliance with the existing
regulatory framework. The Commission is also reflecting on how best to step up enforcement
of consumer economic rights legislation. From October 2013 to February 2014, a public
consultation55
was held on the review of the Consumer Protection Cooperation Regulation,
which sets up a network among national authorities to stop cross-border infringements of EU
consumer rules and to combat malpractices. An impact assessment currently explores the
options available to strengthen the authorities’ powers and to improve the enforcement
cooperation and alert mechanisms among authorities. (Final results are expected by the end of
2014).
2.5.3. Problems
On average, 9.2% of respondents encountered at least one problem with goods/services or
retailers/providers across the 52 markets in 2013, continuing the slight downward trend since
2010. In general, problems are less common in the goods markets (7.3%) than in the services
markets (10.4%).
Highest incidence of problems in telecoms, lowest in gambling and insurance markets
Among goods markets, respondents are most likely to encounter problems in the markets for
second-hand cars; ICT products; and clothing and footwear. The services markets that cause
most problems for consumers include telecoms (internet provision, mobile telephone services,
TV subscriptions), train services, real estate services and bank accounts. The high incidence
of problems with internet service provision has been confirmed by a recent Commission
study, with interruptions in the internet connection and a slower than anticipated speed being
the most common problems. The overall detriment to consumers due among others to internet
outages and time spent solving problems has been estimated at between € 1,4 billion and € 3,9
billion for EU2756
.
Interestingly, only 2% of respondents report problems in the market for offline gambling
(lowest proportion across all markets surveyed) while 8% have experienced problems when
gambling online. In addition, relatively few respondents (6%) experience problems in the
three insurance markets, probably because these markets are only 'activated' in relatively rare
circumstances such as accident, illness or robbery.
The highest increase in the proportion of consumers reporting problems can be noted in the
markets for alcoholic drinks and for cafés, bars and restaurants (both +0.9 percentage point),
54
Directive 2014/45/EU of the European Parliament and of the Council of 3 April 2014 on periodic
roadworthiness tests for motor vehicles and their trailers and repealing Directive 2009/40/EC
Directive 2014/47/EU of the European Parliament and of the Council of 3 April 2014 on the technical
roadside inspection of the roadworthiness of commercial vehicles circulating in the Union and repealing
Directive 2000/30/EC
Directive 2014/46/EU of the European Parliament and of the Council of 3 April 2014 amending
Council Directive 1999/37/EC on the registration documents for vehicles 55
http://ec.europa.eu/dgs/health_consumer/dgs_consultations/ca/consumer_protection_cooperation_regul
ation_201310_en.htm 56
Consumer market study on the functioning of the market for internet access and provision from a
consumer perspective" (2012) – conducted on behalf of the European Commission by Civic Consulting.
http://ec.europa.eu/consumers/consumer_research/market_studies/internet_services_provision_study_e
n.htm

EN 31 Error! No document variable supplied. EN
while the biggest decline is observed in the markets for train services (-2.6); vehicle
maintenance and repair (-2.3); and fuel for vehicles (-1.3).
Figure 5: Problems (as percentage of respondents)
21%
18%
18%
16%
15%
14%
14%
13%
13%
13%
12%
12%
12%
12%
10%
10%
10%
10%
9%
9%
9%
8%
8%
8%
7%
6%
6%
6%
5%
4%
3%
2%
15%
13%
12%
11%
10%
9%
9%
8%
8%
7%
7%
7%
7%
7%
6%
5%
5%
3%
3%
3%
3%
2%
9%
-0.5
-0.1
0.4
-2.6*
-1.2*
0
-0.1
0.3
-0.7
-0.8*
-0.8*
0
0.1
-2.3*
-0.7
-0.5*
0.9*
-1.1*
-0.9*
-0.5
-0.3
-0.1
-0.2
-0.6
-0.6*
0.6*
-1.6*
0.3
0.2
0
-0.3
0.3
-0.9*
0.4
0.1
0.6
0.4
0.1
0.3
0.1
-0.1
-0.3
-1.3*
-1.2*
-0.6*
-0.1
-0.3
0.9*
-0.2
0.2
-0.1
-0.5*
-0.3
-6.1*
-4.3*
-8.9*
-0.3
-1.9*
-3.9*
-3.1*
-2.3*
1.8*
2*
-1.4*
-2.3*
-3*
-2.1*
-3.2*
-2*
1*
-3.1*
-2.4*
-0.3
-3.2*
-1.4*
-1.4*
-2.7*
-1.7*
-1.1*
-0.6
-3.1*
-0.9*
-0.3
-2.8*
-1.1*
2.8*
-3.5*
1.7*
0.6
-2.1*
-1*
-2.9*
-2.7*
-0.8*
-0.7*
0.6*
-1.4*
1.4*
-1*
0.2
-1.8*
-1.7*
-1.3*
0
-1*
-1.5
-0.1
2.1*
#N/A
-3.2*
-3.2*
-1.9*
-0.5
-1.7*
0.8*
-1.2*
1.5*
-2.6*
-6.4*
-0.5*
-0.9*
-1.3*
-1*
-1.4*
0.8*
-0.7*
-0.8*
-1.2*
-1.2*
-1*
0.3
-1.6*
-1*
-0.3
0
-1.2*
0.2
0.1
-0.9*
-1.8*
1*
-0.8*
-0.4*
1*
-2.2*
-3.4*
0.2
1.2*
1*
0.7*
0.1
0.3
-0.5
Internet provision
Mobile telephone services
TV-subscriptions
Train services
Real estate services
Maintenance services
Bank accounts
Fixed telephone services
Postal services
Tram, local bus, metro
Legal and accountancy services
Loans, credit and credit cards
Electricity services
Vehicle maintenance and repair
Investment products, private pensions and securities
EU27-services markets
Cafés, bars and restaurants
Mortgages
Airline services
Vehicle rental services
Packaged holidays & tours
Gas services
on-line gambling
Water supply
Holiday accommodation
Private life insurance
Home insurance
Vehicle insurance
Commercial sport services
Personal care services
Culture and entertainment
Off-line gambling services
Second hand cars
ICT products
Clothing and footwear
New cars
Fruit and vegetables
Meat and meat products
Large household appliances
Small household appliances
Electronic products
Furniture and furnishings
EU27-goods markets
Spectacles and lenses
Fuel for vehicles
Maintenance products
Dairy products
Entertainment goods
Bread, cereals, rice and pasta
Alcoholic drinks
Non-prescription medicines
Personal care products
Non-alcoholic drinks
Books, magazines and newspapers
EU27 - All markets
Did you experience a problem with <the service/product> or <the supplier/retailer>, where you thought you had a legitimate cause for complaint?
%yes
Services
Goods
Diff 2012-2011
Diff 2013-2012
Diff 2011-2010

EN 32 Error! No document variable supplied. EN
Source: Market monitoring survey, 2013
The markets that score particularly poorly in the problems ranking (with relatively high
incidence of problems) compared to the overall MPI ranking include airline services; postal
services; TV-subscriptions; tram, local bus and metro; spectacles and lenses; as well as small
and large household appliances. The opposite is true for the markets for private life insurance;
mortgages; investment products; gas services; vehicle fuels; electricity services and offline
gambling services.
2.5.4. Complaints
Almost three quarters (73%) of those who experienced problems complained about them to at
least one party (official complaint body, retailer/provider, manufacturer or friends/family).
Consumers are more likely to complain about services (75%) than about goods (69%). At the
same time, consumers' propensity to complain has dropped for both goods and services
markets compared to the past two years.
Retailers/providers are the first point of contact
For all markets, the party most likely to be contacted is the seller of the goods or the provider
of the service (57%) – thus the immediate and known point of contact and (in the case of
(semi-)durable goods) the one legally responsible for any faults in the product. A third of
those who had a problem (31%) shared their bad experience with friends and family.
Complaints to official third parties (such as public authorities, consumer organisations or
ombudsmen) were much less frequent (8% across all markets) except for certain services
markets (20%, 18% and 15% in the markets for legal and accountancy services; investment
products; and real estate services, respectively), which in the Scoreboard analysis is an
indicator of the severity of the problem. Finally, only 4% of consumers addressed their
complaint to a manufacturer57
but this proportion can go up to 20% in the markets for new
cars, ICT products and large household appliances, which are most often sold with an
additional manufacturer's warranty.
In general, complaints are most common in markets which cause most problems
Among goods markets, consumers are most likely to complain about ICT products (83%),
new cars and large household appliances (80% both), i.e. arguably the goods of highest
monetary value, covered by legal and most often also commercial guarantees. The opposite is
true for non-prescription medicines; non-alcoholic drinks; and fuel for vehicles. In the latter
case, a recent Commission market study58
concluded that the difficulty of establishing the
facts ex-post represents a considerable challenge for consumers seeking redress in case of
problems; thus, preventive measures and more effective enforcement of existing legislation
are key in reducing consumer detriment.
Services markets that attract the largest share of complaints (over 80%) include the four
telecom markets. In contrast, problems with online and offline gambling are the least likely to
lead to complaints, followed by local transport.
57
The base for this figure is all markets where this answer was available. The answer option ‘to a
manufacturer’ was only possible for the following services markets: House and garden maintenance
services, Personal care services, Vehicle maintenance and repair services, Fixed telephone services,
Mobile telephone services, Internet provision. Among goods markets, the question applied to all the
markets except for vehicle fuels.
58 To be published in June 2014 at
http://ec.europa.eu/consumers/consumer_evidence/market_studies/vehicle_fuels/docs/study_en.pdf

EN 33 Error! No document variable supplied. EN
Services markets where the largest share of consumers complain when facing problems (over
80%) include the four telecom markets. In contrast, problems with online and offline
gambling are the least likely to lead to complaints, followed by local transport.
In general, the markets that cause most problems tend to be the ones that consumers complain
the most about, with a moderate (0.54) correlation between the percentage of consumers
reporting problems in each market and the likelihood that complaints will be followed up.
This is particularly true for telecom services, ICT products and new cars. But there are some
exceptions to this pattern. Relatively high proportions of consumers report problems in the
markets for train services; tram, local bus and metro; real estate services; fruits and
vegetables; and second-hand cars, but few of them have complained about these problems. In
contrast, the markets for commercial sport services and for books, magazines and newspapers
show a low incidence of problems but a high proportion of complaints.

EN 34 Error! No document variable supplied. EN
Figure 6: Complaints (as percentage of consumers who experienced a problem)
7%
7%
8%
5%
9%
12%
9%
9%
4%
12%
5%
9%
18%
6%
13%
8%
13%
8%
13%
8%
9%
13%
15%
9%
20%
7%
8%
11%
6%
9%
6%
5%
7%
7%
4%
4%
3%
2%
6%
5%
6%
7%
3%
4%
5%
3%
2%
1%
4%
2%
2%
4%
2%
4%
8%
75%
73%
73%
71%
61%
62%
63%
69%
63%
59%
59%
59%
57%
60%
61%
62%
58%
62%
50%
63%
61%
55%
52%
58%
44%
57%
42%
50%
41%
37%
38%
41%
68%
67%
65%
63%
66%
56%
63%
57%
59%
56%
56%
53%
49%
42%
40%
40%
41%
31%
42%
32%
30%
31%
57%
10%
8%
10%
0%
11%
0%
7%
2%
0%
6%
0%
17%
20%
17%
9%
8%
7%
13%
11%
13%
5%
11%
9%
8%
3%
3%
6%
7%
4%
3%
4%
5%
4%
29%
25%
32%
34%
34%
34%
39%
34%
34%
36%
32%
32%
30%
30%
30%
27%
27%
28%
36%
32%
21%
33%
35%
27%
33%
30%
41%
29%
32%
35%
29%
24%
28%
31%
26%
22%
30%
40%
22%
25%
28%
31%
25%
31%
33%
39%
33%
33%
28%
37%
32%
33%
31%
26%
31%
85% .
84% .
82% .
81% .
80% .
80% .
80% .
77% .
77% .
76% .
75% .
75% .
74% .
74% .
74% .
73% .
73% .
73% .
73% .
73% .
73% .
73% .
72% .
71% .
70% .
69% .
69% .
68% .
65% .
62% .
57% .
56% .
80% .
80% .
79% .
78% .
76% .
75% .
73% .
73% .
72% .
72% .
71% .
69% .
65% .
63% .
63% .
61% .
61% .
59% .
56% .
52% .
52% .
52% .
73% .
-0.6
-2.4*
-0.2
-1.6*
-2.3*
1.1*
0.2
-1.6*
-2.5*
-1.2*
-3.3*
-2.2*
-0.9
-2.7*
-2.7*
-3.6*
-3.1*
-2.2*
-6.5*
-3.8*
-3.9*
-3.8*
-2.5*
-0.6
-4.2*
-5.6*
-0.8
-8.4*
0.4
5.1*
-1.5*
-6.5*
-2.4*
16.6*
0.1
-2.5*
-6.8*
-1.5*
-0.4
-5*
-6.9*
-3.4*
-6.2*
-1.6*
-5.4*
0.4
-3.9*
-6.8*
-3.7*
-6.5*
-5.4*
-7.5*
-2.6*
-5.3*
-1*
-6.3*
-6.7*
-1.1*
0.2
2.2*
-8.5*
0
1.4*
-1.9*
-4.6*
-4.3*
-3.8*
-5.8*
-6.7*
-0.1
-3.3*
11.5*
-5*
-4.1*
-7*
-8.5*
-13.2*
-2.3*
-6.6*
2.8*
-2.5*
-10.8*
-4.4*
-3.3*
-0.9*
-1.7*
-17.9*
-0.2
-3.7*
1*
-1.4*
-13.1*
-2.5*
-3.3*
-6.3*
-1.2*
-9.7*
-3.6*
-15.3*
-14.5*
-14.3*
-7.9*
-12.6*
-10.7*
-24.7*
-5.1*
Internet provision
Fixed telephone services
Mobile telephone services
TV-subscriptions
Maintenance services
Packaged holidays & tours
Commercial sport services
Bank accounts
Cafés, bars and restaurants
Airline services
Vehicle maintenance and repair
Services markets
Investment products
Holiday accommodation
Loans, credit and credit cards
Vehicle insurance
Private life insurance
Postal services
Culture and entertainment
Electricity services
Home insurance
Mortgages
Real estate services
Gas services
Legal and accountancy services
Vehicle rental services
Train services
Water supply
Personal care services
Tram, local bus, metro
Off-line gambling services
On-line gambling services
ICT products
New cars
Large household appliances
Books, magazines and newspapers
Spectacles and lenses
Clothing and footwear
Electronic products
Maintenance products
Furniture and furnishings
Second hand cars
Small household appliances
Goods markets
Entertainment goods
Meat and meat products
Dairy products
Bread, cereals, rice and pasta
Personal care products
Alcoholic drinks
Fruit and vegetables
Fuel for vehicles
Non-alcoholic drinks
Non-prescription medicines
EU28 - All markets
Have you complained about <this problem/one of these problems>?
Yes - third party Yes - retailer/provider Yes - manufacturer yes - friends family
Goods
Services
TOTALcomplained
2013
Diff
2013 -2012
Diff
2012 -2011
Source: Market monitoring survey, 2013

EN 35 Error! No document variable supplied. EN
2.5.5. Overall satisfaction
The 'satisfaction' component measures the extent to which different markets meet consumers'
expectations.
Satisfaction closely linked to overall market assessment
It follows very closely the overall MPI ranking, with goods markets (7.8) evaluated higher
than services markets (7.3). In addition, the bottom three markets among both goods and
services market groups are the same in the two rankings. Second-hand cars and fuel for
vehicles remain the lowest-scoring goods markets even though the latter has recorded a
considerable (+0.4 percentage point) increase in score since 2012. Meat and meat products are
third from bottom, following a decrease in score (-0.2). Despite slight increases in score since
2012, the markets for investment products, mortgages (both + 0.2 points) and real estate
services (+0.1) remain at the bottom of the services markets satisfaction ranking.

EN 36 Error! No document variable supplied. EN
Figure 7: Overall satisfaction
14%
14%
14%
14%
13%
9%
10%
10%
11%
10%
9%
10%
9%
9%
9%
7%
9%
8%
9%
6%
7%
8%
8%
5%
6%
4%
5%
4%
3%
3%
3%
3%
8%
9%
6%
6%
4%
3%
5%
4%
3%
5%
4%
4%
4%
4%
3%
3%
3%
3%
3%
3%
4%
3%
7%
47%
44%
44%
38%
41%
44%
39%
38%
36%
39%
40%
38%
38%
35%
37%
40%
36%
37%
36%
39%
35%
32%
35%
37%
34%
35%
34%
31%
32%
31%
30%
28%
39%
35%
37%
36%
34%
35%
31%
31%
32%
30%
30%
29%
28%
29%
28%
30%
29%
28%
27%
28%
25%
25%
34%
39%
42%
42%
48%
46%
47%
50%
52%
53%
50%
51%
52%
53%
55%
54%
53%
55%
55%
55%
54%
57%
60%
58%
58%
60%
61%
62%
65%
65%
66%
68%
69%
53%
55%
56%
59%
61%
61%
64%
65%
65%
65%
66%
67%
68%
67%
68%
67%
68%
69%
69%
69%
72%
71%
59%
6.5
6.6
6.7
6.8
6.9
7.0
7.1
7.1
7.1
7.1
7.2
7.2
7.2
7.3
7.3
7.3
7.3
7.3
7.3
7.4
7.5
7.5
7.5
7.6
7.6
7.7
7.7
7.8
7.9
7.9
8.0
8.1
7.2
7.3
7.4
7.6
7.7
7.7
7.8
7.8
7.9
7.9
7.9
7.9
7.9
8.0
8.0
8.0
8.0
8.0
8.0
8.0
8.1
8.2
7.5
0.2*
0.2*
0.1*
0.1*
0.1*
0
0.1*
0.1*
0
0.1*
0.1
0.2*
-0.1*
0
0.1*
0.1*
0.1*
0.1*
0.1*
0.2*
0.1*
0
0.1*
0
0.2*
0
0.1*
0.1*
0
0
0
0.4*
-0.2*
0
0.2*
0
0
0*
0
0
0
-0.1*
0.1*
0
0
0
0.1*
0
0
0
0
0*
0*
0
0
0.1*
0.2*
0
0
0.1*
-0.1*
0.1*
-0.1*
0
0.2*
0.1*
0
0
0*
0
0
0.1*
0
-0.1*
0
0
0
-0.1*
0
0
0
0
0*
0
-0.1*
0.1*
0.2*
0.1*
0.1*
0.1*
0.1*
0
0
0.1*
0.1*
0
0
0.1*
0.1*
0
0.1*
0.1*
0.1*
0*
0
0*
0.1*
0
-0.2*
-0.1*
-0.2*
0
0.1
0
0
0
0
-0.1*
0
0
-0.2*
0
0.2*
0.1*
0.1*
0
0.1*
0.1*
0
0
0.2*
0.1*
-0.2*
0.1*
0.1*
0.1*
0.2*
0.1*
0.1*
0.2*
0.2*
0.1*
0.1*
0.1*
0.1*
0.3*
0
0.1*
0.1*
0.1*
0.1*
0*
Investment products
Mortgages
Real estate services
Off-line gambling services
Train services
Private life insurance
Bank accounts
On-line gambling services
Electricity services
Tram, local bus, metro
Internet provision
Gas services
Loans, credit and credit cards
TV-subscriptions
Fixed telephone services
Maintenance services
Mobile telephone services
Services markets
Legal and accountancy services
Home insurance
Vehicle maintenance and repair
Water supply
Postal services
Cafés, bars and restaurants
Vehicle insurance
Airline services
Vehicle rental services
Packaged holidays & tours
Commercial sport services
Holiday accommodation
Culture and entertainment
Personal care services
Second hand cars
Fuel for vehicles
Meat and meat products
Fruit and vegetables
Clothing and footwear
Maintenance products
ICT products
Goods markets
Personal care products
Non-prescription medicines
Furniture and furnishings
Small household appliances
New cars
Dairy products
Bread, cereals, rice and pasta
Entertainment goods
Alcoholic drinks
Electronic products
Large household appliances
Non-alcoholic drinks
Spectacles and lenses
Books, magazines and newspapers
EU28 - All markets
On a scale from 0 to 10, to what exctent did <the services/products> on offer from different <suppliers/retailers> live up to what you wanted within <the past period>?
0-4 5-7 8-10
2013
Services
Goods
Diff 2012-2011
Diff 2013-2012
Diff 2011-2010
Source: Market monitoring survey, 2013
The markets that score higher on satisfaction than in the overall MPI ranking include mobile
telephone services; new cars; electronic products and internet provision. The opposite is true
for offline gambling; online gambling; and tram, local bus and metro.
2.5.6. Choice
The choice component measures the extent to which respondents believe that the supply of
retailers/providers is sufficient in each market, thus reflecting the level of local competition as
perceived by consumers. Overall, choice is the highest assessed component, although there is
a considerable difference in score between goods and services markets (8.2 and 7.6
respectively). The choice question was not asked in the markets for local transport, train
services and water supply, where only one main provider is available in most countries.

EN 37 Error! No document variable supplied. EN
Choice assessed the lowest in the markets for vehicle fuels, non-prescription medicines,
meat and utilities
Among goods markets, fuel for vehicles, non-prescription medicines, and meat and meat
products are at the bottom of the choice ranking. The low availability of certain meat types
(such as organic or animal welfare certified) was also confirmed by a recent Commission’s in-
depth study59
. Among services markets, utilities (gas, electricity and postal services) score the
worst. However, the latter three markets, together with the markets for TV subscriptions and
clothing and footwear, have seen the largest improvements in score since 2012 (of 0.2 points).
In contrast, the scores on choice for small household appliances and for bank accounts have
deteriorated the most (-0.2 points).
59
http://ec.europa.eu/consumers/consumer_research/market_studies/meat_market_study_en.htm

EN 38 Error! No document variable supplied. EN
Figure 8: Choice
22%
21%
20%
13%
14%
11%
9%
10%
11%
8%
10%
7%
9%
9%
7%
7%
8%
7%
8%
5%
6%
6%
6%
5%
4%
4%
4%
4%
3%
8%
7%
5%
5%
4%
6%
5%
4%
6%
6%
5%
5%
4%
3%
4%
3%
4%
3%
3%
3%
3%
2%
7%
35%
31%
35%
35%
32%
32%
35%
34%
31%
35%
30%
35%
30%
30%
30%
31%
27%
30%
27%
30%
28%
27%
26%
29%
27%
24%
21%
22%
20%
25%
25%
26%
26%
28%
25%
24%
26%
23%
21%
23%
23%
23%
22%
22%
23%
22%
21%
21%
19%
20%
19%
27%
43%
48%
45%
52%
54%
57%
55%
56%
59%
58%
60%
58%
61%
62%
63%
62%
64%
63%
65%
65%
66%
66%
67%
67%
68%
73%
75%
75%
78%
67%
68%
69%
68%
68%
69%
71%
70%
71%
74%
72%
73%
73%
74%
74%
73%
74%
76%
76%
78%
77%
79%
66%
6.3
6.6
6.6
7.1
7.1
7.4
7.4
7.4
7.5
7.5
7.5
7.5
7.6
7.6
7.8
7.8
7.8
7.8
7.8
7.9
7.9
7.9
8.0
8.0
8.1
8.3
8.4
8.4
8.5
7.9
8.0
8.0
8.1
8.1
8.1
8.1
8.2
8.2
8.2
8.2
8.2
8.2
8.3
8.3
8.3
8.3
8.4
8.4
8.5
8.5
8.6
7.9
0.2*
0.3*
0.2*
-0.1*
0.2*
0
0.1*
-0.1*
0
0
-0.1*
0
0.1*
0
0
-0.2*
0
0
0
0
0
-0.1*
0*
0.1*
0
0
-0.1*
0.1*
0
0
-0.1*
0
-0.1*
-0.1*
-0.1*
-0.1*
0.2*
0*
-0.1*
-0.1*
0
-0.1*
0
-0.2*
-0.1*
0
0
0*
0.1*
0*
0.1*
0.2*
-0.2*
-0.2*
0.1*
0.1
0*
-0.1*
0.1
0.1
0.1*
0
0*
0
0.1
0.1*
0
0.1
0
0
0.1
0*
0.1*
0*
0
0
0.1*
-0.1*
0
0.1
0*
0
0*
0.2*
0.1*
0*
0.1*
0*
0.1*
0*
0
0.1*
0
0.1*
0*
0.1
0.1
0*
0*
0*
Gas services
Electricity services
Postal services
Mortgages
TV-subscriptions
Fixed telephone services
Vehicle rental services
Airline services
Internet provision
Maintenance services
Culture and entertainment
Investment products
Commercial sport services
Services markets
On-line gambling services
Real estate services
Bank accounts
Legal and accountancy services
Off-line gambling services
Private life insurance
Vehicle maintenance and repair
Loans, credit and credit cards
Mobile telephone services
Packaged holidays & tours
Home insurance
Vehicle insurance
Cafés, bars and restaurants
Personal care services
Holiday accommodation
Fuel for vehicles
Non-prescription medicines
Meat and meat products
Furniture and furnishings
Second hand cars
Entertainment goods
Fruit and vegetables
Maintenance products
Books, magazines and newspapers
Clothing and footwear
Goods markets
ICT products
Electronic products
Dairy products
Large household appliances
New cars
Small household appliances
Spectacles and lenses
Bread, cereals, rice and pasta
Non-alcoholic drinks
Personal care products
Alcoholic drinks
EU28 - All markets
On a scale from 0 to 10, would you say there are enough different <suppliers/retailers> of <the services/products> you can choose from?
0-4 5-7 8-10
2013
Services
Goods
Diff 2012-2011
Diff 2013-2012
Source: Market monitoring survey, 2013

EN 39 Error! No document variable supplied. EN
The markets which score much better on choice than in the overall MPI ranking include
mobile telephone services; real estate services; loans, credit and credit cards; bank accounts;
and investment products. The opposite is true for airline services; culture and entertainment;
vehicle rental services; postal services; commercial sport services; books, magazines and
newspapers; and entertainment goods.
2.5.7. Switching
The possibility to switch providers is important, as it allows consumers to optimise their
choice and thus to exert competitive pressure in the market. The switching component
captures both the level of actual switching and the (perceived) ease of switching and covers
the 14 services markets in which switching is possible (i.e. 'continuous' service markets where
the consumer has an on-going contract with the supplier and where alternative suppliers are
available).
Switching most common in telecom sector and investments
Overall, 14% of consumers switched their provider or a product with the same provider
during the reference period. Consumers are more likely to switch supplier (9%) than products
or services with the same supplier (6%), and this is true for all of the 'switching' markets
except for TV subscriptions, mobile telephone services and mortgages (in the latter market,
the proportions of supplier and product switchers are the same).
Switching is most common in the markets for mobile telephone services (23%), internet
provision (19%) and investment products (17%). On the other hand, only a tenth of
consumers or less have switched in the markets for mortgages (possibly due to early
repayment penalties applied to most fixed-term mortgage deals), home insurance, gas,
electricity and private life insurance.
While, at EU level, there has been little change in the incidence of switching between 2012
and 2013 (the largest increase, of 1.3 percentage points, has been noted in the market for
mobile telephone services), considerable improvements have occurred at country level in
some markets. Notably, switching rates in both gas and electricity markets have improved by
more than 10 percentage points in Belgium and Portugal, following important action taken by
their governments and consumer organisations.

EN 40 Error! No document variable supplied. EN
Figure 9: Actual switching
88%
91%
91%
91%
91%
91%
89%
91%
90%
87%
89%
90%
89%
90%
89%
87%
89%
89%
86%
87%
87%
86%
86%
86%
82%
87%
86%
83%
84%
85%
83%
86%
85%
82%
82%
83%
81%
81%
81%
77%
78%
77%
85%
87%
86%
7%
5%
5%
3%
2%
2%
5%
3%
3%
6%
4%
4%
4%
3%
4%
6%
3%
4%
6%
4%
4%
3%
3%
3%
10%
7%
9%
5%
3%
3%
9%
7%
8%
9%
8%
8%
10%
8%
10%
14%
12%
13%
7%
5%
6%
6%
5%
5%
7%
7%
8%
7%
6%
8%
8%
8%
7%
8%
8%
8%
8%
9%
8%
10%
10%
9%
11%
12%
11%
9%
7%
7%
12%
14%
13%
9%
9%
8%
12%
12%
12%
11%
11%
11%
11%
12%
12%
9%
9%
9%
2011
2012
mortgages 2013
2011
2012
home insurance 2013
2011
2012
gas services 2013
2011
2012
electricity services 2013
2011
2012
private life insurance 2013
2011
2012
loans, credit and credit cards 2013
2011
2012
bank accounts 2013
2011
2012
commercial sport services 2013
2011
2012
TV-subscriptions 2013
2011
2012
vehicle insurance 2013
2011
2012
fixed telephone services 2013
2011
2012
investments, private pensions and securities 2013
2011
2012
internet provision 2013
2011
2012
mobile telephone services 2013
2011
2012
EU28- switching markets 2013
For <services>, have you switched <tariff plan> or <supplier> in <the past period>?
No Yes - goods/services with same provider Yes - supplier
Source: Market monitoring survey, 2013

EN 41 Error! No document variable supplied. EN
Switching mortgages, gas and electricity seen as most difficult
Switching supplier is perceived as being easiest in the markets for commercial sports services
and vehicle insurance, followed by mobile telephone services and home insurance. This could
be linked to the fact that some contracts in these markets require renewal after a certain period
of time. Mortgages have the lowest score on ease of switching, followed by gas and electricity
services. These three markets also rank lowest, third lowest and fourth lowest, respectively,
on actual switching. Investment products are also perceived as difficult to switch but are
switched relatively often.
Switching supplier is rated as easier by those with switching experience (7.6) than by non-
switchers (6.8), regardless whether the latter considered switching or not, and this holds true
for all 14 'switching' markets. The difference between the assessments of switchers and non-
switchers is the greatest in the markets for gas and electricity services. These are also the two
markets where ease of switching improved the most between 2012 and 2013 (both +0.2).
Countries with the biggest improvements on this aspect in both electricity and gas markets are
again Portugal (+2.1 and +1.8, respectively) and Belgium (+1.3 and +1).
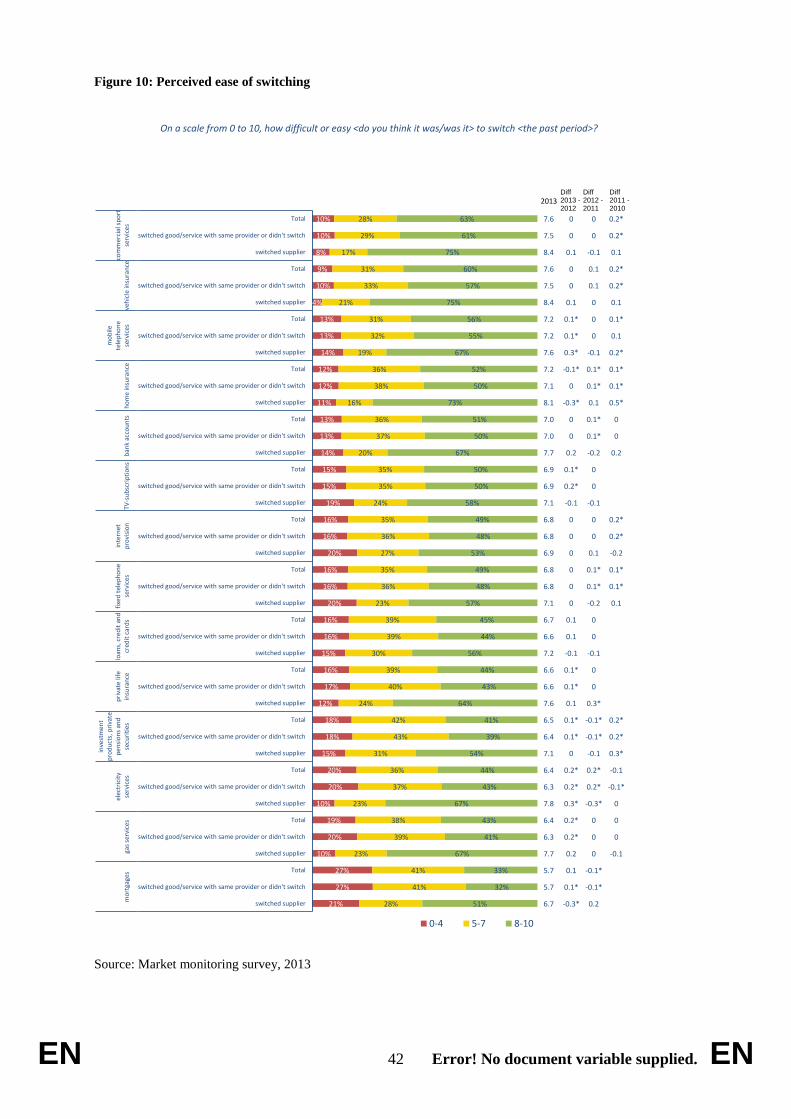
EN 42 Error! No document variable supplied. EN
Figure 10: Perceived ease of switching
21%
27%
27%
10%
20%
19%
10%
20%
20%
15%
18%
18%
12%
17%
16%
15%
16%
16%
20%
16%
16%
20%
16%
16%
19%
15%
15%
14%
13%
13%
11%
12%
12%
14%
13%
13%
4%
10%
9%
8%
10%
10%
28%
41%
41%
23%
39%
38%
23%
37%
36%
31%
43%
42%
24%
40%
39%
30%
39%
39%
23%
36%
35%
27%
36%
35%
24%
35%
35%
20%
37%
36%
16%
38%
36%
19%
32%
31%
21%
33%
31%
17%
29%
28%
51%
32%
33%
67%
41%
43%
67%
43%
44%
54%
39%
41%
64%
43%
44%
56%
44%
45%
57%
48%
49%
53%
48%
49%
58%
50%
50%
67%
50%
51%
73%
50%
52%
67%
55%
56%
75%
57%
60%
75%
61%
63%
6.7
5.7
5.7
7.7
6.3
6.4
7.8
6.3
6.4
7.1
6.4
6.5
7.6
6.6
6.6
7.2
6.6
6.7
7.1
6.8
6.8
6.9
6.8
6.8
7.1
6.9
6.9
7.7
7.0
7.0
8.1
7.1
7.2
7.6
7.2
7.2
8.4
7.5
7.6
8.4
7.5
7.6
-0.3*
0.1*
0.1
0.2
0.2*
0.2*
0.3*
0.2*
0.2*
0
0.1*
0.1*
0.1
0.1*
0.1*
-0.1
0.1
0.1
0
0
0
0
0
0
-0.1
0.2*
0.1*
0.2
0
0
-0.3*
0
-0.1*
0.3*
0.1*
0.1*
0.1
0
0
0.1
0
0
0.2
-0.1*
-0.1*
0
0
0
-0.3*
0.2*
0.2*
-0.1
-0.1*
-0.1*
0.3*
0
0
-0.1
0
0
-0.2
0.1*
0.1*
0.1
0
0
-0.1
0
0
-0.2
0.1*
0.1*
0.1
0.1*
0.1*
-0.1
0
0
0
0.1
0.1
-0.1
0
0
-0.1
0
0
0
-0.1*
-0.1
0.3*
0.2*
0.2*
0.1
0.1*
0.1*
-0.2
0.2*
0.2*
0.2
0
0
0.5*
0.1*
0.1*
0.2*
0.1
0.1*
0.1
0.2*
0.2*
0.1
0.2*
0.2*
switched supplier
switched good/service with same provider or didn't switch
Total
switched supplier
switched good/service with same provider or didn't switch
Total
switched supplier
switched good/service with same provider or didn't switch
Total
switched supplier
switched good/service with same provider or didn't switch
Total
switched supplier
switched good/service with same provider or didn't switch
Total
switched supplier
switched good/service with same provider or didn't switch
Total
switched supplier
switched good/service with same provider or didn't switch
Total
switched supplier
switched good/service with same provider or didn't switch
Total
switched supplier
switched good/service with same provider or didn't switch
Total
switched supplier
switched good/service with same provider or didn't switch
Total
switched supplier
switched good/service with same provider or didn't switch
Total
switched supplier
switched good/service with same provider or didn't switch
Total
switched supplier
switched good/service with same provider or didn't switch
Total
switched supplier
switched good/service with same provider or didn't switch
Total
mo
rtga
ges
gas
serv
ices
elec
tric
ity
serv
ices
inve
stm
ent
pro
du
cts,
pri
vate
pen
sio
ns
and
secu
riti
esp
riva
te li
fein
sura
nce
loan
s, c
red
it a
nd
cred
it c
ard
sfi
xed
tel
eph
on
ese
rvic
esin
tern
etp
rovi
sio
nTV
-su
bsc
rip
tio
ns
ban
k ac
cou
nts
ho
me
insu
ran
ce
mo
bile
tele
ph
on
ese
rvic
esve
hic
le in
sura
nce
com
mer
cial
sp
ort
serv
ices
On a scale from 0 to 10, how difficult or easy <do you think it was/was it> to switch <the past period>?
0-4 5-7 8-10
2013Diff 2013 -2012
Diff 2012 -2011
Diff 2011 -2010
Source: Market monitoring survey, 2013

EN 43 Error! No document variable supplied. EN
A number of recent Commission initiatives aim to make consumers aware of switching
possibilities, and make the switching process as easy as possible. Following the
Commission’s in-depth study into the market for internet service provision60
, which found
persistent barriers to switching, the “Connected Continent” legislative package61
contains
enhanced provisions on switching of phone and Internet providers or contracts by enhancing
the transparency and information requirements of telecom contracts. The proposal maintains
the current rules on maximum duration of a contract (24 months) while obliging each operator
to offer at least one package with a minimum duration of 12 months; contains enhanced
consumer protection rules in relation to automatic extension of contracts, and introduces the
right to terminate any contract after six months without penalty by giving one month's notice.
Furthermore, the significant and non-temporary discrepancy between the actual performance
of the services regarding speed or other quality of service parameters and the performance
indicated by the provider in the contract shall also be considered as non-conformity of the
performance terms under the contract. Finally, in view of the increasing relevance of bundles
of services provided in the market and the importance of enhancing consumers protection as
regards these bundled offers, the proposal contains specific provisions under which contract
termination and switching rules will apply to all services in bundled offers comprising at least
a connection to an electronic communications network or one electronic communications
service. Likewise, the soon to be adopted Directive on payment accounts will establish a
simple and quick procedure for consumers who wish to change their payment account to one
with another provider. In addition, the Commission has launched a multi-stakeholder Working
Group that will analyse the potential of new ways for consumers to get better deals (such as
collective switching and via new business intermediaries). A report highlighting good
(national) practices is expected to be presented at the next Citizens' Energy Forum62
.
2.6. Market penetration
The graph below presents the penetration of different markets in terms of percentage of
consumers who bought goods/services within the reference period in each market63
in the
EU28.
Market penetration varies considerably both between markets and between countries.
Penetration highest for food and utilities, lowest for recreational and financial services
The highest-penetration markets (used by at least two-thirds of respondents in the reference
period) include all six food and drink markets covered by in the survey; utilities (electricity,
water supply); clothing and footwear; personal care products; mobile phone services; books,
magazines and newspapers; and non-prescription medicines.
The lowest-penetration markets (used by less than a third of respondents) are mostly services
markets. Online gambling64
has the lowest penetration, followed by a range of financial
60
Consumer market study on the functioning of the market for internet access and provision from a
consumer perspective" (2012) – conducted on behalf of the European Commission by Civic Consulting.
http://ec.europa.eu/consumers/consumer_research/market_studies/internet_services_provision_study_e
n.htm 61
Commission proposal for a Regulation of the European Parliament and of the Council laying down
measures concerning the European single market for electronic communications and to achieve a
Connected Continent - COM(2013) 627 final.
http://ec.europa.eu/digital-agenda/en/connected-continent-single-telecom-market-growth-jobs
62 http://ec.europa.eu/energy/gas_electricity/doc/forum_citizen_energy/20131220_citizen_forum_meeting.zip
63 As a proportion of all consumers who were asked if they qualified for this market.

EN 44 Error! No document variable supplied. EN
markets (mortgages; investment products; private life insurance; loans, credit and credit
cards); travel-related markets (vehicle rental; packaged holidays and tours; airline services);
real estate services; and legal and accountancy services. Among goods markets, new and
second-hand cars are the least frequently bought products.
Figure 11: Market penetration
13%
14%
15%
16%
20%
21%
25%26%
28%30%
31%
33%34%
35%
37%40%
40%
41%42%
42%42%
45%
45%
46%46%
48%48%
48%
48%50%
51%
52%54%
58%
59%61%
61%62%
65%
66%
66%68%
69%71%
72%
74%79%
80%81%
82%
82%
82%
on-line gambling and lottery services
vehicle rental services
real estate services
new cars
second hand cars
mortgages
packaged holidays & tours
investments products
private life insurance
legal and accountancy services
airline services
loans, credit and credit cards
off-line gambling and lottery services
commercial sport services
holiday accommodations
home insurances
electronic products
furniture and furnishings
large household appliances
train services
maintenance services
small household appliances
spectacles and lenses
TV-subscriptions
ICT products
vehicle maintenance and repair services
gas services
tram, bus and metro services
entertainment goods
fixed telephone services
maintenance products
vehicle insurances
internet provision
bank accounts
postal services
cultural and entertainment services
personal care services
fuels
cafés, bars and restaurants
non prescription medicines
alcoholic drinks
books, magazines and newspapers
water supply
mobile telephone services
personal care products
electricity services
meat and meat products
fruit and vegetables
dairy products
clothing and footwear
non alcoholic drinks
bread, cereals, rice and pasta
Market penetration - EU28 Proportion of consumers who bought a product or service within the reference period in
each market
% Penetration
64
Additional online recruitment was conducted for this market in some countries, which indicates that the
actual penetration is even lower.

EN 45 Error! No document variable supplied. EN
Source: Market monitoring survey, 2013
The markets which are more 'familiar' to consumers also tend to receive better assessments,
with a modest positive correlation (0.34) between market penetration and MPI scores at
country level.
In addition, markets with higher penetration EU-wide show lower differences in penetration
between countries65
(there is a negative correlation of 0.81 between the two). Everyday
necessities (clothing and footwear; non-alcoholic beverages; dairy products; bread and
cereals; meat and meat products; fruit and vegetables) have the least differences in market
penetration across the EU. On the contrary, the biggest variation in market penetration is
noted in some of the lowest-penetration markets: packaged holidays and tours; investment
products; airline services; new cars; and mortgages.
3. ADDITIONAL INDICATORS
3.1. Prices
Price dispersion across Member States and its evolution over time should be carefully
monitored as the single market should favour price convergence (in particular for tradable
goods), while at the same time it is not reasonable to expect price differences to disappear
completely. However, comparable and representative data on price levels across Member
States are still rather limited.
The data shown here come from several sources. In addition to purchasing power parities
(PPPs) price level indices66
, detailed price-level data are available for certain categories of
goods and services. The prices of network services include data routinely provided to Eurostat
by Member States (gas and electricity), complemented by data from relevant Commission
reports (broadband internet access).67
Vehicle fuel prices are published weekly by the
Commission’s Market Observatory for Energy, which uses data received from Member
States. Lastly, a pilot project carried out by the European Statistical System, currently in its
fifth year, collects detailed price levels for specific groups of products68
. The project currently
covers 156 products and 24 Member States (in addition to Iceland, Switzerland, Turkey)69
.
Price differences between EU countries decrease over time
In order to see whether the single market coincides with price convergence, it is important to
study how price differences across the EU have evolved over time70
. Figure 12 shows price
dispersion between EU countries in 2012 (horizontal axis) and its evolution since 2001
65
As measured through the coefficient of variation. 66
The collection of prices within the purchasing power standards is done every three years and only in
capital cities. In addition, price level indices and changes in them over time not only reflect differences
in the prices of comparable products but are also influenced by different patterns of consumption across
Member States and over time. 67
Broadband Internet Access Cost (BIAC), Study on behalf of the European Commission, Directorate-
General Communications Networks, Content and Technology.
Digital Agenda Scoreboard. https://ec.europa.eu/digital-agenda/en/scoreboard. 68
The products included within the same general product description are not necessarily fully comparable.
In different countries, different products may be selected, e.g. those which are most typical for the
country concerned, and the products selected may therefore be of different quality, different brands or
from different types of outlets. Further details are available at:
http://epp.eurostat.ec.europa.eu/portal/page/portal/hicp/methodology/prices_data_for_market_monitorin
g. 69
Data presented in this Scoreboard are from 2012. 70
Even if a clear cause-effect relation cannot be established.

EN 46 Error! No document variable supplied. EN
(vertical axis)71
for actual individual consumption and for the different product categories into
which it can be broken down72
(based on Purchasing Power Parities).
In the period monitored, there was a general process of price convergence in the EU, with
price variation going down on average by more than 15% in relative terms.73
The highest
decrease in price variation, both in absolute and in relative terms, was observed for
'electricity, gas and other fuels'74
while 'households appliances', 'education' and
'communication services' were the only categories where price differences between countries
increased.
Nevertheless, price dispersion across countries continues to exist, in particular in services
markets. It is very low for products which are, at least partly, manufactured outside the EU
('audio-visual, photographic and information processing equipment', 'clothing', 'footwear’).
Price differences across countries are higher than average75
, among others, for personal
services ('education', 'health', 'restaurants and hotels'), which could be linked to differences in
the cost of labour in different countries.
Figure 12: Price variation across the EU in 2012 and its evolution between 2001 and 201276
Actual individual consumption
Food
Bread and cereals
Meat
Fish
Milk, cheese and eggs
Oils and fats
Fruits, vegetables, potatoes
Other food
Non-alcoholic beverages
Alcoholic beverages
Tobacco
Clothing
Footwear
Electricity, gas and other fuels
Housing, water, el ectricity, equipment and maintenance
Furniture and furnishings, carpets and other floor coverings
Households appliances
Health
Transport
Personal transport equipment
Transport services
Communication
Recreation and culture
Audio-visual, photographic and information processing equipment
Education
Restaurants and hotels
Miscellaneous goods and services
-0.20
-0.15
-0.10
-0.05
0.00
0.05
0.00 0.10 0.20 0.30 0.40 0.50 0.60 0.70
Pri
ce v
aria
tio
n a
cro
ss t
he
EU (
dif
f 2
01
2-2
001
)
Price variation across the EU (2012)
71
The coefficient of variation in 2012 is computed on price level indices (EU28=100) while the
coefficient of variation in 2001 is computed on price level indices (EU27=100). 72
Based on COICOP — Classification of Individual Consumption according to Purpose. 73
The coefficient of variation on actual individual consumption went down from 0.37 to 0.31. 74
From 0.39 to 0.20, i.e. almost half in relative terms. It should be considered that the process of
convergence mainly took place between 2001 and 2008 (coefficient of variation down from 0.39 to
0.26). Data refer to the COICOP "Electricity, gas and other fuel", which includes the following:
electricity, gas, liquid fuels, solid fuels and heat energy. Additional information on what is entailed in
each of these sub-categories can be found in the RAMON website of Eurostat.
http://ec.europa.eu/eurostat/ramon/index.cfm?TargetUrl=DSP_PUB_WELC 75
Simple arithmetic average of prices for the different COICOP categories. 76
Source: own estimate based on Eurostat data (purchasing power parities domain).

EN 47 Error! No document variable supplied. EN
Prices are lower in Member States that joined the EU more recently
Price dispersion can be further analysed on the basis of detailed price data, available for
specific groups of goods and services77
. The boxplot in Figure 13 shows for each country78
the distribution of price level indices (computed for all goods and services as the percentage
of the price in a particular country with respect to the average price in all the countries for
which data are available79
)
Figure 13: Box plot of price level indexes by country 80
Source of raw data: Table 6
77
Data sources used are those mentioned in the introduction to this chapter. However, since the
goods/services for which prices are provided do not reflect overall consumption and the country
coverage is not necessarily the same for different goods/services, the results should be considered as
indicative. 78
The boxplot covers the prices of goods and services indicated in table 6. 79
For all the goods and services contained in table 6, the price level index is computed as follows:
P(I)/P(A)*100
where P(I) is the price in country I and P(A) is the average price for all the EU countries for which data
are available. A price level index of 110 means that in country I the price of that goods/service in 10%
higher than the average in all the countries (for which data are available).
A very few outliers are not shown in the graph (the vertical axis was cut at 300). 80
For each country, the top of the box represents the 75th percentile, the bottom of the box represents the
25th percentile, and the line in the middle represents the 50th percentile (median). The whiskers (the
lines that extend from the top and bottom of the box) represent the highest and lowest values that are not
outliers or extreme values. Outliers (values above 1.5 times the interquartile range) are represented by
circles or stars beyond the whiskers.

EN 48 Error! No document variable supplied. EN
Overall, prices are lower in countries that joined the EU after 200481
. In five of these Member
States (Bulgaria, Czech Republic, Hungary, Poland and Romania), prices for at least three-
quarters of the products covered are below the average computed for all the Member States
for which data are available82
, while in Lithuania and Latvia they are just above that average.
Conversely, in Belgium, Italy, Luxembourg, Ireland and Austria, at least three-quarters of the
products are more expensive than the average for all EU countries83
.
Price dispersion across countries is in general related to differences in economic conditions
Detailed price data have been split in Figures 14 to 18 into the following groups (reflecting
the market clusters identified in the Scoreboard): fast- moving retail goods, (semi-) durable
goods, vehicle fuels, recreational and personal care services, and network services (the latter
group covering public utilities, telecom and transport services). Each point in the scatterplot,
which refers to a specific good/service, provides the following information:
position on horizontal axis: price dispersion for each product between countries84
(for
which data are available);
position on the vertical axis: the degree of correlation between price levels and actual
individual consumption per capita (AIC) in euro85
.
By combining the information described above, it is possible (for each good/service) to, on
the one hand, see price dispersion between countries and, on the other hand, to have an
indication of whether or not the observed differences in prices tend to reflect differences in
economic conditions and cost of labour across countries.
Products falling in the upper left quadrant86
of the graphs have a low price variation across the
EU and a high correlation between price levels and actual individual consumption. The upper
right quadrant brings together products with a high price variation across the EU, which is
however still linked to economic differences between countries. These differences play less of
a role in the case of products falling in the lower part of the graph. This means that consumers
in less affluent countries pay (relatively) higher prices and that price dispersion for that
good/service cannot be explained by differences in the cost of labour across countries. While
this can be explained in some cases by differences in consumption patterns (e.g. olive oil is
much more popular in southern than in northern Europe), it may also be a sign of market
malfunctioning, especially where price variation across countries turns out to be high (lower
right quadrant of the graphs).
81
However, the number of goods/services for which prices data are available is not the same by country
and this could have an influence on the findings. 82
75% percentile is below 100. 83
25% percentile is above 100. 84
Measured through the coefficient of variation. However, the country coverage is not necessarily the
same for all the product categories, which could have an impact on the differences observed across
products. 85
Actual individual consumption is the total of individual goods and services consumed by households
and financed from both private and public sources. It provides an indication of the purchasing power of
consumers and it tends to also to be correlated with cost of labour in the country. 86
For all the 4 scatterplots (figures from 14 to 18), the space is divided into 4 quadrants: upper left
quadrants (coefficient of variation<0.5 and correlation between prices and AIC>0), bottom left quadrant
(coefficient of variation<0.5 and correlation between prices and AIC<0), upper right quadrant
(coefficient of variation>0.5 and correlation between prices and AIC>0) and lower right quadrant
(coefficient of variation>0.5 and correlation between prices and AIC<0). The choice to cross the y-axis
with the x-axis at 0.5 is based on the fact that the observed coefficients of variation range from 0.038 to
1.012.

EN 49 Error! No document variable supplied. EN
However, since overall there are almost no items in the bottom right quadrant, it is possible to
conclude that differences in prices across countries are in general related to differences in
relative labour costs and purchasing power. This could be the result of producers’ pricing
strategies (for tradable goods) and of differences in the cost of labour (in the case of services
and non-tradable goods).
Price dispersion is greater for services than for goods
Again, as it was seen with the purchasing parities data above, the analysis of detailed price
data confirms that price variation87
tends to be greater in services markets than in goods
markets, a reflection of the lower tradability of services. Recreational and personal care
services - which are more labour intensive – show the most price variation among all product
groups (0.49) as well as the highest correlation between prices and actual individual
consumption per capita (0.73). Network services show less price dispersion (0.38) and a
considerably lower link with consumption levels (0.30).
Among goods markets, vehicle fuels have both the lowest level of price dispersion (0.13) and
the lowest correlation with consumption levels per capita (0.16). Fast-moving and (semi-)
durable goods show similar average levels of price dispersion (0.38 and 0.32, respectively),
but the latter have a higher correlation with actual consumption (0.57 vs. 0.43). This could be
explained by the fact that differences in the price of (semi-) durable goods are more likely to
reflect differences in the quality of goods purchased in different countries (i.e. the fact that
consumers in more affluent countries may buy better-quality products). Price variation of
some goods could also be explained by their non-tradability. This is clearly the case for
newspapers and magazines, which are non-tradable mostly because of language and cultural
barriers. Finally, price variation may be linked to differences in tax and excise levels. This is
the case for cigarettes and to a lesser extent for alcoholic beverages, which show a
higher-than-average price variation and a strong correlation with purchasing power, most
likely reflecting the fact that, in some richer (e.g. northern) countries, taxes on these products
tend to be particularly high.
87
Coefficients of variation observed on price relatives (ratio between the prices in the country and the
arithmetic average across all the EU countries for which data are available) for all the products within
the market cluster.

EN 50 Error! No document variable supplied. EN
Figure 14: Prices of fast-moving retail goods — variation across EU countries and relation to
consumption88
All-purposes household cleaner
Battery
Beer
Black pepper
Black tea Blank compact disc (CD-R)
Blank DVD (R), slimcase
Butter
Canned fruit
Carbonated drink, orange flavoured
Carrots
Cheese, Camembert type
Cheese, Gouda type
Chicken breast, fillets
Chicken eggs4
Cleaner for WC
Cleaning liquid for windows
Coffee
Cotton buds
Cream cheese 5
Deodorant
1
Dish washer tablets
Disposable nappies
Dog food dry
Fresh bananas
Fresh milk, unskimmed
Fresh tomatoes
Frozen French fries Fruit yoghurt
Jam
2Loaf of white breadLong-grain rice
Magazine
7Margarine
Milk chocolate
Mineral salt
Mineral water, carbonated
Mineral water, still
Movie DVD
Music CD - Pop Chart
Natural yoghurt
Novel
Olive oil
Orange juice
Paper
Detergent for washing machine, concentrated, all
Pencil
Pork, cutlet ("escalope")Pork, loin chop
Potato crisps
Potatoes
Potting soilRed wine
3 Sausage, Frankfurter/Wiener
Shampoo
Shower gel
Tampons
Tinned pink tuna
6 Tomato ketchup
Tooth paste
Vegetable oil
Vodka
Wheat flour
White sugar
White wine
Whole chicken
-1.00
-0.80
-0.60
-0.40
-0.20
0.00
0.20
0.40
0.60
0.80
1.00
0.00 0.20 0.40 0.60 0.80 1.00
Co
rrel
atio
n b
etw
een
pri
ces
and
act
ual
ind
ivid
ual
co
nsu
mp
tio
n p
er c
apit
a
Price variation across EU countries
1 - Detergent for washing machine, concentrated2 - Light bulb energy saving type3 - Salmon Steak4 - Cigarettes5 - Daily newspaper6 - Toilet paper7 - Manuale toothbrush
Source: Table 6
88
2012 data collected in the framework of the pilot project carried out by the European Statistical System.
The chart shows products for which price data of at least 12 Member States are available.

EN 51 Error! No document variable supplied. EN
Figure 15: Prices of (semi-)durable goods — variation across EU countries and relation to consumption89
Board game, Monopoly
5
4
Cartridges for safety razor, men
Cement
Children's jeans trousers
Children's sport shoes
2
Cobber
Compact disc, digital
Cooking pot
Electric razor
Flat plate
Fridge-freezer
Girls' tights
Glass, water
Kettle
Ladies' blouse
Ladies' conventional court shoes
1Ladies' pullover
Ladies' skirt
Ladies' straight trousers
Ladies' top coat
Ladies' T-shirtLaptop
Men' s shirt
Men's blue jeans
6
3 Men's street shoes
7
Men's trousers
Men's T-shirt, short sleeves
Microwave oven
Monitor
Paint, indoor use
Silicone
Television
-1.00
-0.80
-0.60
-0.40
-0.20
0.00
0.20
0.40
0.60
0.80
1.00
0.00 0.20 0.40 0.60 0.80 1.00
Co
rrel
atio
n b
etw
een
pri
ces
and
act
ual
ind
ivid
ual
co
nsu
mti
on
per
cap
ita
Price variation across EU countries
1 - Ladies' long boots2 - Children's T-shirt3 - Men's lace-up shoes4 - Brassiere, push-up5 - Boys' socks6 - Men's boxer briefs7 - Men's suit, wool
Source: Table 6
89
2012 data collected in the framework of the pilot project carried out by the European Statistical System.
The chart shows products for which price data of at least 12 Member States are available.

EN 52 Error! No document variable supplied. EN
Figure 16: Prices of fuels — variation across EU countries and relation to consumption90
Diesel + tax
Diesel no tax
Euro-super 95 + tax
Euro-super 95 no tax
Heating oil + tax
Heating oil no tax
LPG + tax
LPG no tax
-1.00
-0.80
-0.60
-0.40
-0.20
0.00
0.20
0.40
0.60
0.80
1.00
0.00 0.20 0.40 0.60 0.80 1.00
Co
rre
lati
on
be
twe
en
pri
ces
and
act
ual
ind
ivid
ual
co
nsu
mp
tio
n p
er
cap
ita
Price variation across EU countries
Source: Table 7
90
2013 data published by the Commission's Market Observatory for Energy.

EN 53 Error! No document variable supplied. EN
Figure 17: Prices of recreational and personal care services — variation across EU countries and relation
to consumption91
Beer (lager), domestic -glass
Cinema ticketCup of coffee
Digital photo print service
Dry cleaning
Hotel weekendLadies - haircutMen's scissors cut, wet
Menu of the day
Red house wine - glassTaxi
Urban bus transport, single ticket
-1.00
-0.80
-0.60
-0.40
-0.20
0.00
0.20
0.40
0.60
0.80
1.00
0.00 0.20 0.40 0.60 0.80 1.00
Co
rrel
atio
n b
etw
een
pri
ces
and
act
ual
ind
ivid
ual
co
nsu
mp
tio
n p
er c
apit
a
Price variation across EU countries
Source: Table 6
91
2012 data collected in the framework of the pilot project carried out by the European Statistical System.
The chart shows products for which price data of at least 12 Member States are available.

EN 54 Error! No document variable supplied. EN
Figure 18: Prices of network services — variation across EU countries and relation to consumption92
1 M Wh < Electricity < 2.5 M Wh
1 M Wh < Electricity < 2.5 M Wh + tax
2.5 M Wh < Electricity < 5 M Wh
5 M Wh < Electricity < 15 M Wh
5 M Wh < Electricity < 15 M Wh + tax Electricity < 1 M Wh
Electricity < 1 M Wh + tax
Electricity > 15 M Wh
Internet access 12Mbps-30Mbps
Internet access 1Mbps-2MbpsInternet access 2Mbps-4Mbps
Internet access 30+Mbps
Internet access 4Mbps-8Mbps
Internet access 512kbps-1MbpsInternet access 8Mbps-
12Mbps
2.5 M Wh < Electricity < 5 M Wh + tax
20 GJ < Gas < 200 GJ Gas > 200 GJ + taxes20 GJ < Gas < 200 GJ + taxes
Electricity > 15 M Wh + tax
Gas < 20 GJ
Gas < 20 GJ + taxes
Gas > 200 GJ
-1.00
-0.80
-0.60
-0.40
-0.20
0.00
0.20
0.40
0.60
0.80
1.00
0.00 0.20 0.40 0.60 0.80 1.00
Co
rrel
atio
n b
etw
een
pri
ces
and
act
ual
ind
ivid
ual
co
nsu
mp
tio
n p
er c
apit
a
Price variation across EU countries
Source: Table 7
3.2. Complaints
The Commission has been supporting national third-party complaint bodies in the
implementation of its 2010 Recommendation, which introduced a harmonised methodology
for classifying consumer complaints and enquiries93
. This includes the exchange of best
practices with national partners through the Consumer Complaints Expert Group as well as
bilateral contacts (country workshops, IT expert support). The Commission offers free
software to all interested organisations that do not yet have a specific IT data-collection
system in place. In addition, a new grant scheme will be launched in 2014 for organisations
adapting their existing IT systems to the requirements of the Recommendation.
Uptake of the Commission's complaints recommendation on the increase
In 2013, 43 complaint bodies from 11 Member States transmitted harmonised complaint data
to the Commission, compared to 37 bodies from 9 countries in 2012. Sweden, Belgium and
Spain have by far the largest number of participating bodies. In addition, the database
includes cross-border complaints collected by the European Consumer Centres (in 27 EU
Member States, Iceland and Norway)94
. Currently, the database contains 387,000 complaints
and 932,000 enquiries. This is a clear increase since the last Scoreboard (December 2012),
92
Gas and electricity prices refer to first semester of 2013 (source: Eurostat) and internet prices (which are
expressed in euro - purchasing power parities) refer to 2013 (source: Digital Agenda Scoreboard). 93
C(2010)3021 final. 94
Data received from the European Consumer Centres constituted a quarter (26%) of all the complaints
submitted to the database in 2013.

EN 55 Error! No document variable supplied. EN
when the figures were respectively 55,000 and 307,000. Figure 19 presents the number of
complaints transmitted to the Commission in 2013, broken down by country (of the
organisation which transmitted the data).
Figure 19: Harmonised consumer complaints by country, transmitted to the Commission in 201395
106
191
304
305
351
470
619
795
954
1127
1306
2176
2389
2425
2690
2819
2848
3362
3893
5064
5808
7815
7832
9427
11331
13552
13992
18507
89881
0 10000 20000 30000 40000 50000 60000 70000 80000 90000 100000
IS*
CY*
SK*
BG*
RO
EE*
EL*
SI
LV*
CZ
HU
LT
NL*
FI*
NO*
MT
PL*
PT
DK*
LU*
DE*
FR*
IE*
BE
UK*
ES
AT*
IT
SE
* Indicates countries where only European Consumer Centres transmitted data.
For all the countries, the complaint data collected according to the harmonised methodology
still represent only a tiny fraction of all the complaints collected by third-party complaint
bodies96
. Yet, it already provides useful insights into problem areas.
95
The transmission date (when the data are transmitted from the organisation to the Commission) does not
necessarily overlap with the creation date (when the complaint was sent by the consumer to the
organisation). 96
The comparison between the data now available in the database and estimations based on the market
monitoring survey also point in this direction.
EN 56 Error! No document variable supplied. EN
Network services account for most complaints
Focusing on Spain, which is one of the countries having transmitted the highest number of
complaints since the start of the project, a breakdown by sector97
is presented below. Overall,
the number of complaints relating to services markets is more than six times that for goods
markets. Network services record the highest number of complaints: mobile telephone
services are at the top of the list, followed by fixed telephone services, airlines, electricity and
internet services. The goods markets with the highest number of complaints are electronic
goods, furnishings and small household appliances. Hard complaints data largely confirm the
picture emerging from the market monitoring survey, with a correlation of 0.75 between the
number of complaints against Spanish traders per market recorded in the database and the
estimated number of complaints, based on survey results.98
97
The Complaints Recommendation is based on a modified COICOP classification and includes 86
sectors, 49 of which are covered in the Scoreboard. 98
Own estimation based on Market Monitoring Survey, EU SILC and Eurostat population data.

EN 57 Error! No document variable supplied. EN
Figure 20: Harmonised consumer complaints by market – complaints made by Spanish consumers against
Spanish traders in 2011-1399
Figure 21 shows that issues related to 'invoicing / billing and debt collection' were the most
common reasons for complaints in Spain, representing almost a fifth of all complaints. These
are followed by issues linked to 'quality of goods/services', 'contracts and sales' and 'delivery
of goods/provision of services'.
99
The category "other" and those containing fewer than 20 complaints are now shown.

EN 58 Error! No document variable supplied. EN
Figure 21: Harmonised consumer complaints by problem – complaints made by Spanish consumers
against Spanish traders in 2011-13100
As for the selling methods, face-to-face sales record the highest number of complaints,
followed by mobile commerce and distance selling.
Figure 22: Harmonised consumer complaints by selling method - complaints made by Spanish consumers
against Spanish traders in 2011-13101
100
Excluding the 'Other issues' category'. 101
Excluding the 'Don't know' category'.

EN 59 Error! No document variable supplied. EN
3.3. Safety
Ensuring that products on the market are safe is a basic objective of consumer policy. High
safety and health standards have the potential to increase consumer confidence and
consequently drive further market integration. The EU has laid down general safety rules
applicable to non-food products102
as well as specific provisions for certain products such as
toys and cosmetics, while food chain rules aim to ensure the safety of foodstuffs103
. The rules
in question are designed to prevent or contain risks as far as possible, and to remedy
dangerous situations. The recently proposed package of measures on product safety and
market surveillance104
(February 2013) aims at further strengthening and simplifying the
safety rules applying to non-food products in the EU.
In the area of services safety, specific measures exist on the safety of passenger transport (by
ship, rail and air). In addition, the Commission is planning to launch a Green paper on the
safety of tourism accommodation services105
. The aim of the consultation is to gather input on
the added value of possible EU action in this field.
Aside from some specific sectors, such as transport, there is a lack of comparable data on the
safety of goods and services. Data on safety issues are gathered at different levels, via
different channels and are not reported consistently. This chapter relies on data available
through three different sources: European Injury Database (IDB), Rapid Alert System for non-
food consumer products (RAPEX) and Rapid Alert System for Food and Feed (RAFFS).
Building (components), sport/recreation equipment and furniture are product categories
most often involved in accidents
The Injury Database (IDB)106
provides information on accidents and injuries treated in
emergency departments in the EU, product-related or not. The IDB records about 300 000
incidents a year, collected by more than 100 hospitals in 18 EU countries, 15 of which
provide more information on injuries that may be related to products107
.
As the IDB product categories are not based on the COICOP classification, in most cases it is
difficult to establish a direct link with the categories used in the Scoreboard. However, some
categories, such as furniture and household appliances, are similar in both classification
systems.
Figure 23 presents the share of specific product categories involved in injuries and accidents
between 2010 and 2012. Excluding the 'other'108
and 'unspecified' product categories (which
account for 50% and 26% of reported cases, respectively),‘building (component) or related
fitting’ (e.g. tiled or wooden floors, stairs, bathroom fixtures), ‘equipment used in
sports/recreation’ (e.g. balls, skiing equipment, horse riding), and ‘furniture/furnishings’
(doors, tables, chairs) are the categories most often involved in accidents and injuries. The
distribution and total number of different product-related injuries at EU level is consistent
over time.
102
Directive 2001/95/EC 103
Regulation (EC) No 178/2002 104
COM(2013) 75 final, COM(2013) 76 final, COM(2013) 78 final 105
http://ec.europa.eu/atwork/synthesis/amp/doc/sanco_mp_en.pdf (p26). 106
http://ec.europa.eu/health/data_collection/databases/idb/index_en.htm 107
Data included in the IDB only concern injuries registered in emergency departments of hospitals. As
injuries treated in primary health care are not included, the actual number of injuries is higher than
registered in this database. In addition, the registration of a product involved in an incident does not
give information on the actual cause of the injury, whether it was due to the product's lack of safety or
its faulty use. 108
“Other products” include e.g. vehicles.
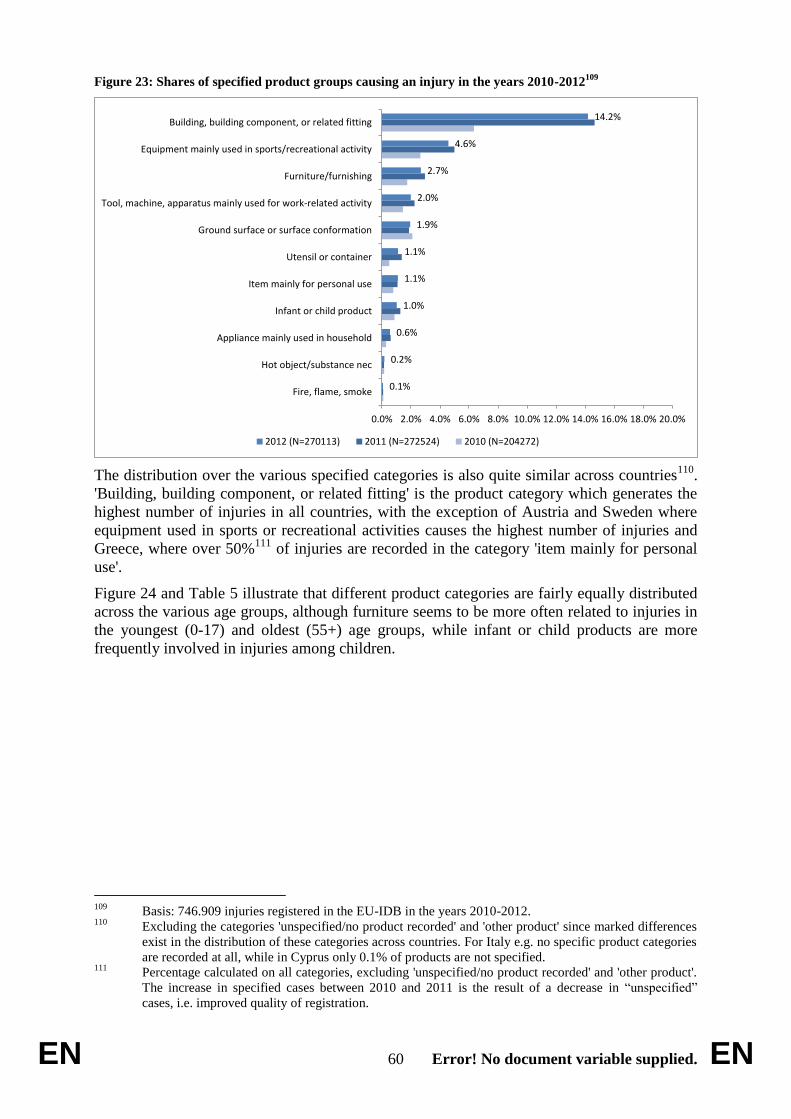
EN 60 Error! No document variable supplied. EN
Figure 23: Shares of specified product groups causing an injury in the years 2010-2012109
0.1%
0.2%
0.6%
1.0%
1.1%
1.1%
1.9%
2.0%
2.7%
4.6%
14.2%
0.0% 2.0% 4.0% 6.0% 8.0% 10.0% 12.0% 14.0% 16.0% 18.0% 20.0%
Fire, flame, smoke
Hot object/substance nec
Appliance mainly used in household
Infant or child product
Item mainly for personal use
Utensil or container
Ground surface or surface conformation
Tool, machine, apparatus mainly used for work-related activity
Furniture/furnishing
Equipment mainly used in sports/recreational activity
Building, building component, or related fitting
2012 (N=270113) 2011 (N=272524) 2010 (N=204272)
The distribution over the various specified categories is also quite similar across countries110
.
'Building, building component, or related fitting' is the product category which generates the
highest number of injuries in all countries, with the exception of Austria and Sweden where
equipment used in sports or recreational activities causes the highest number of injuries and
Greece, where over 50%111
of injuries are recorded in the category 'item mainly for personal
use'.
Figure 24 and Table 5 illustrate that different product categories are fairly equally distributed
across the various age groups, although furniture seems to be more often related to injuries in
the youngest (0-17) and oldest (55+) age groups, while infant or child products are more
frequently involved in injuries among children.
109
Basis: 746.909 injuries registered in the EU-IDB in the years 2010-2012. 110
Excluding the categories 'unspecified/no product recorded' and 'other product' since marked differences
exist in the distribution of these categories across countries. For Italy e.g. no specific product categories
are recorded at all, while in Cyprus only 0.1% of products are not specified. 111
Percentage calculated on all categories, excluding 'unspecified/no product recorded' and 'other product'.
The increase in specified cases between 2010 and 2011 is the result of a decrease in “unspecified”
cases, i.e. improved quality of registration.

EN 61 Error! No document variable supplied. EN
Figure 24 and Table 5: Injuries with the involvement of specified products by age group112
31%
22%
20%
27%
0.22%
0 to 17
18 to 34
35 to 54
55+
Unspecified
0 to 17 18 to 34 35 to 54 55+ Unspecified Total
% % % % % %
Appliance mainly used in household 0.5% 0.4% 0.5% 0.5% 2.0% 0.5%
Building, building component, or related fitting 8.0% 7.7% 9.1% 14.6% 7.4% 9.9%
Equipment mainly used in sports/recreational activity 8.0% 4.7% 2.7% 0.7% 0.1% 4.2%
Fire, flame, smoke 0.1% 0.1% 0.1% 0.1% 0.1% 0.1%
Furniture/furnishing 3.2% 1.1% 1.4% 3.5% 13.6% 2.5%
Ground surface or surface conformation 1.8% 2.2% 2.6% 2.6% 1.9% 2.3%
Hot object/substance nec 0.3% 0.1% 0.2% 0.1% 0.6% 0.2%
Infant or child product 3.2% 0.2% 0.2% 0.1% 14.7% 1.1%
Item mainly for personal use 0.7% 0.8% 0.8% 1.8% 0.9% 1.0%
Tool, machine, apparatus mainly used for work-related activity 0.5% 2.2% 3.6% 2.7% 0.1% 2.1%
Utensil or container 0.6% 1.5% 1.4% 0.7% 1.4% 1.0%
Other product 21.5% 28.6% 28.6% 25.4% 18.0% 25.5%
Unspecified 21.2% 22.6% 22.6% 21.0% 30.1% 21.8%
No product recorded 30.5% 27.7% 26.1% 26.3% 9.1% 27.9%
Total recorded (N) 394370 285272 251998 336899 2760 1271299
estimate/year (N) 12561000 9086000 8026000 10730000 88000 40490000
Product group
Looking at more detailed product categories causing injuries (Figure 25), clearer differences
between age groups can be found. For children below the age of five, injuries are most often
caused by indoor equipment and furnishings, followed by outdoor play equipment. After the
age of 14, 'do-it-yourself' (DIY) activities, household activities and sports take an important
share in the total number of injuries that require treatment in emergency departments. Product
categories involved in DIY-activities include stepladders and a wide range of tools and
machinery. Home injuries often involve powered equipment such as vacuum cleaners, water
heaters and food processors as well as the omnipresent extension cords. Sports-related injuries
occur most often in team ball-sports, followed by horse riding and snow sports.
112
Basis: 1.485.337 injuries registered in the EU-IDB in the years 2008-2012, representing estimated
40.490.000 injuries per year in the EU-28.

EN 62 Error! No document variable supplied. EN
Figure 25: Top 10 products involved in different types of injuries
1.0%
1.0%
1.2%
1.4%
1.5%
1.5%
1.8%
2.1%
2.8%
3.1%
0% 10% 20%
Upholstered chair, sofa, couch,lounge, divan
Unspecified bed, bedding or beddingaccessories
Unspecified chair, sofa
Door, door sill
Pedal cycle
Floor - tile, brick, concrete
Stairs, steps
Floor - carpeted
Other specified person
Person, self
Top 10 products involved in injuries to small children (N=1087848)
1.1%
1.2%
1.3%
1.3%
1.3%
1.7%
1.8%
2.0%
3.3%
4.7%
0% 10% 20%
Chainsaw
Cutting/slicing machinary or fixedplant
Other specified building, buildingcomponent or filling
Unspecified tool, machine, apparatus,mainly used for work related activities
Cutting tool
Tree, plant
Other power saw
Grinder, buffer, polisher, sander
Wood - timber, board, splinter nec
Ladder, movable step
Top 10 products involved in 'Do It Yourself'-activities amongst those aged 15+ (N=47934)
3,5%
3,6%
4,4%
4,9%
5,3%
5,6%
6,5%
7,8%
8,2%
10,4%
0% 10% 20%
Television
Dishwasher
Food processor, blender, juicer
Electric or gas radiator, heater
Electric lamp
Scissors
Stove, oven, cooktop
Other specified household appliance
Cord of household appliance,extension cord
Vacuum cleaner
Top 10 products involved in home injuries amongst those aged 15+ (N=3939)
1.0%
1.1%
1.4%
1.6%
1.7%
2.6%
2.8%
3.7%
6.3%
6.8%
0% 10% 20%
Unspecified ball
Floor - tile, brick, concrete
Pedal cycle
Floor - carpeted
Snow, ice
Horse, pony, donkey, mule, ass
Snow ski
Person, self
Other specified person
Soft ball
Top 10 products involved in sport injuries (N=210214)
Clothing, toys and fruit & vegetables are the most frequently notified dangerous products
Further information on the safety of products on the market is provided by the two EU-wide
rapid alert systems for the notification of dangerous goods: RAPEX113
for non-food products
113
RAPEX: Rapid Alert System for non-food dangerous products
http://ec.europa.eu/consumers/safety/rapex/index_en.htm

EN 63 Error! No document variable supplied. EN
and RASFF114
for food and feed products. Both systems facilitate the rapid exchange of
information between Member States and the Commission, enabling countries to act quickly
and in a coordinated manner in order to contain safety risks as they arise on the market.
Before starting the alert system, Member States need to evaluate whether the product presents
a risk and to what extent this risk has also a cross-border effect. Consequently, the RAPEX
and RASFF databases show only EU-wide alert cases or cases that were deemed important
enough to report EU-wide. Furthermore, resources spent on inspections can differ extensively
between countries, with some Member States notifying systematically more cases than others.
Resources spent on inspections may be also unequally spread between different product
categories. In relation to foodstuffs, where specific obligations are imposed on Member States
to carry out regular checks at a frequency commensurate with the risk posed by different
commodities, differences between Member States may be less obvious.
Figures 26 and 27 show a breakdown by product category, excluding the categories
accounting for less than 1% notifications. 'Clothing, textiles and fashion items', 'toys', and
'motor vehicles' are the non-food products notified most often, while 'fruit and vegetables',
'fish and fish products', and 'nuts, nut products and seeds' top the list of notifications among
food and feed products.
Figure 26: Notifications of dangerous non-food products by product category
0.1%
0.8%
0.9%
0.9%
1.0%
1.0%
1.1%
1.4%
1.5%
1.8%
2.0%
2.1%
2.4%
2.5%
2.8%
2.8%
3.5%
4.4%
8.5%
8.7%
22.2%
27.4%
0% 5% 10% 15% 20% 25% 30% 35% 40% 45% 50%
Stationery
Furniture
Jewellery
Laser pointers
Decorative articles
Lighters
Communication and media equipment
Food-imitating products
Machinery
Protective equipment
Other
Lighting chains
Hobby/sports equipment
Chemical products
Childcare articles and children’s equipment
Lighting equipment
Cosmetics
Electrical appliances
Motor vehicles
Toys
Clothing, textiles and fashion items
2013 (N=2009)
2012 (N=1963)
2011 (N=1555)
2010 (N=1963)
Source: RAPEX Annual Report 2013.
114
RASFF: Rapid Alert System for Food and Feed http://ec.europa.eu/food/food/rapidalert/index_en.htm
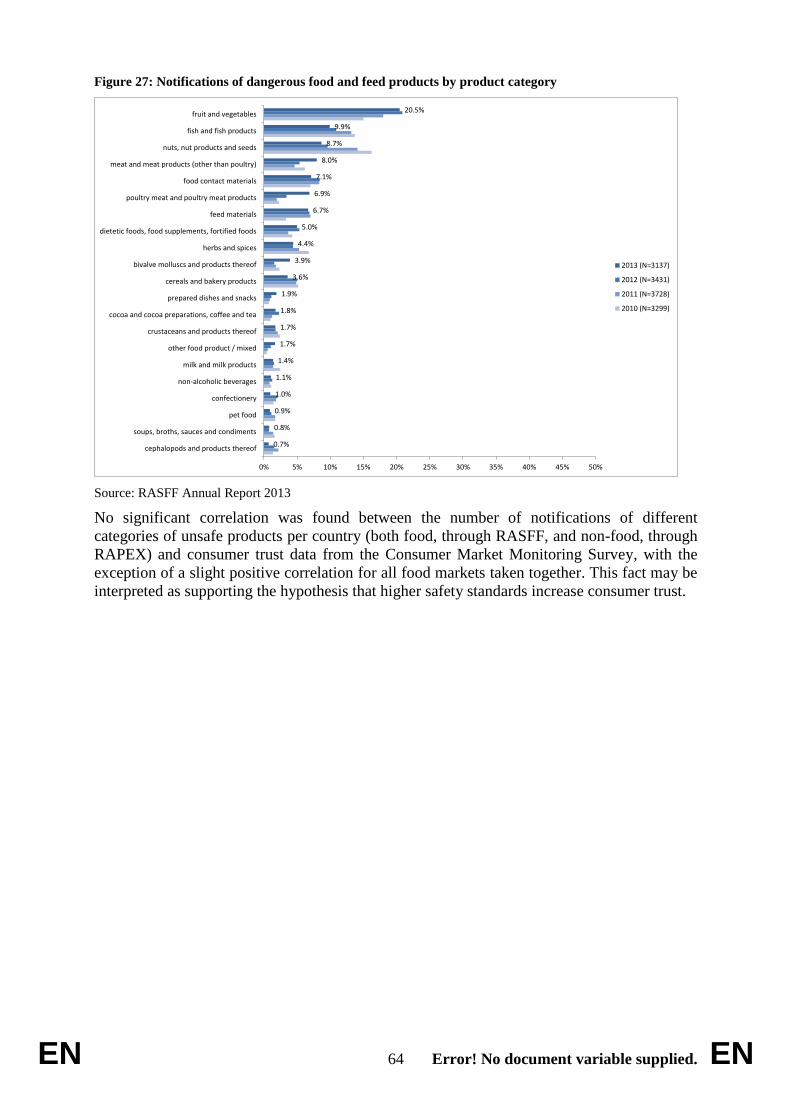
EN 64 Error! No document variable supplied. EN
Figure 27: Notifications of dangerous food and feed products by product category
0.7%
0.8%
0.9%
1.0%
1.1%
1.4%
1.7%
1.7%
1.8%
1.9%
3.6%
3.9%
4.4%
5.0%
6.7%
6.9%
7.1%
8.0%
8.7%
9.9%
20.5%
0% 5% 10% 15% 20% 25% 30% 35% 40% 45% 50%
cephalopods and products thereof
soups, broths, sauces and condiments
pet food
confectionery
non-alcoholic beverages
milk and milk products
other food product / mixed
crustaceans and products thereof
cocoa and cocoa preparations, coffee and tea
prepared dishes and snacks
cereals and bakery products
bivalve molluscs and products thereof
herbs and spices
dietetic foods, food supplements, fortified foods
feed materials
poultry meat and poultry meat products
food contact materials
meat and meat products (other than poultry)
nuts, nut products and seeds
fish and fish products
fruit and vegetables
2013 (N=3137)
2012 (N=3431)
2011 (N=3728)
2010 (N=3299)
Source: RASFF Annual Report 2013
No significant correlation was found between the number of notifications of different
categories of unsafe products per country (both food, through RASFF, and non-food, through
RAPEX) and consumer trust data from the Consumer Market Monitoring Survey, with the
exception of a slight positive correlation for all food markets taken together. This fact may be
interpreted as supporting the hypothesis that higher safety standards increase consumer trust.

EN 65 Error! No document variable supplied. EN
ANNEXES
Annex I – Prices
Table 6: Indicative price levels for consumer products in euro.
The data presented in Table 6 comes from a Eurostat research project carried out with national statistical offices. Prices refer to the calendar
year 2012 except for five countries where prices refer to June 2012 only. The four Member States for which information is missing chose not
to participate in the project.
Item Name BE BG CZ DE IE EL ES HR IT CY LV LT LU HU MT NL AT PL PT RO SI SK FI UK IS CH TR
Long-grain rice 2.3 1.24 1.36 . . 2.98 1.31 2.71 2.54 2.33 1.31 1.04 3.46 1.85 2.81 1.9 2.11 1.73 0.96 1.33 2.22 1.66 2.36 3.52 2.27 . 2.04
Wheat flour 1.01 0.54 0.46 . . 1.22 0.73 0.73 0.78 1.2 0.76 0.72 0.94 0.57 0.93 1.34 1.07 0.55 0.66 0.68 0.87 0.48 0.62 0.94 0.87 . 0.86
Cornflakes 5.24 4.66 3.25 . . . . 4.23 6.02 4.77 3.29 4.49 4.82 7.17 . 3.43 4.49 3.55 3.69 . 4.77 3.21 . . 4.5 . 6.23
Loaf of white bread
2.7 0.71 0.91 . 1.63 2.1 2.78 1.59 2.8 1.98 1.66 1.56 3.74 0.99 1.99 1.28 5.18 1.05 2.65 0.98 1.83 . . 1.96 2.8 . 1.03
Pizza 3.71 2.67 3.01 3.57 . . . 4.58 3.46 5.33 2.83 2.59 4.03 2.54 3.52 3.25 4.01 2.1 3.78 3.22 3.28 3.17 3.87 . 5.46 . .
Pasta 1.72 . 1.21 . 2.28 1.74 . 2.1 1.56 2.28 1.89 2.11 1.93 2.22 1.62 1.58 3.14 2.12 1.18 2 2.19 2.4 . 2.46 2.32 . 0.96
Minced beef 9.64 . 3.6 . . . . . 10.2 9.29 . 4.65 9.64 8.13 6.65 5.44 . 3.12 6.36 4.2 5.25 . 9.63 9.03 9.02 13.5
8 10.2
9
Pork, cutlet ("escalope")
9.68 4.19 . . . . . 5.46 8.82 4.93 . 4.04 10.5
2 4.43 5.04 8.63 9.37 3.26 3.83 4.87 5.6 4.88 . . .
22.74
.
Pork, loin chop . 4.25 4.49 6.49 7.82 5.58 . 5.03 7.33 . . 3.87 9.15 4.77 5.48 8.27 6.37 3.63 3.84 4.33 5.58 4.69 . . 9.63 . .
Whole chicken 4.2 2.56 2.49 2.35 3.59 3.89 2.88 3.19 4.64 4.06 2.52 2.61 6.09 2.7 2.79 4.42 4.87 1.86 2.12 2.36 3.93 2.61 . 3.88 4.87 . 2.51
Chicken breast, fillets
11.69
5.22 5.81 . . 8.21 . . 9.6 9.58 5.23 4.96 14.5
1 5.1 7.1 7.85 11.7 3.92 6.62 4.53 8.86 5.73
13.06
. 13.3
6 . 4.23
Sausage, Frankfurter/Wi
ener
. 3.74 4.83 . . . . 7.54 7.99 8 4.35 4.5 11.6
8 5.66 . 2.33 . 3.95 5.39 4 6.35 5 7.39 . . 9.85 .
Sausage, salami type
16.44
7.96 7.23 . . 7.66 . 11.6
9 18.0
6 6.67 . 9.83 15.4
12.19
13.67
13.7 19.0
8 7.71
12.11
5.61 11.3
8 7.67
14.69
. . . .
Salmon, steak 17.6 . 14.0
9 . .
12.57
. . 12.3
9 16.6
3 8.98
10.23
15.32
13.11
10.55
. . 17.5
7 7.65 9.31 . . .
19.47
11.78
. 5.06
Tinned pink tuna
10.44
6.49 13.6
9 . . . .
11.14
11.7 8.65 . . 12.1
3 7.23 8.76 8.42 9.16 6.9 7.5 .
13.92
. 11.7
3 8.89 7.67 . .
Fish fingers 3.35 . . . . . . 3.22 4.77 4.69 . 1.83 3.51 . 3.5 2.48 3.84 2.49 4.15 . . . . . . . .
Fresh milk, unskimmed
. 0.97 0.76 . . 1.28 0.77 0.76 1.49 1.33 0.96 0.82 1.28 0.8 0.81 0.88 0.98 0.61 0.79 1.01 0.85 0.88 0.83 0.73 0.74 1.29 0.94
Natural yoghurt
2.78 1.06 1.89 . . 3.26 . . 4.55 4.03 2.38 2.67 3.18 1.6 2.4 0.83 . 1.55 . 1.42 2.28 1.61 . . . 3.35 1.49
Fruit yoghurt 3.27 . 2.79 2.74 . . . 2.54 4.55 8.1 2.94 3.5 4.12 2.08 2.36 1.26 2.71 1.88 4.02 2.49 2.29 2.41 1.95 . 3.31 3.09 .

EN 66 Error! No document variable supplied. EN
Item Name BE BG CZ DE IE EL ES HR IT CY LV LT LU HU MT NL AT PL PT RO SI SK FI UK IS CH TR
Cream cheese 2.34 . 1.63 . . . . 1.49 2.45 2.18 1.44 1.14 2.02 0.98 1.95 . 1.61 0.95 2.14 1.41 . 1.67 . . 1.9 . 1.45
Cheese, Camembert
type
7.04 14.6
7 9.61 . . . . .
13.89
27.44
19.45
12.25
8.73 10.7
4 16.9
3 6.78 8.82 8.56
11.13
10.89
12.65
9.51 . . 16.4
7 . .
Cheese, Gouda type
8.17 9.27 7.43 . . . . 7.99 10.1
1 11.4
7 7.38 6.45 9.78 .
12.36
7.47 8.1 4.51 8.21 7.48 8.61 8.21 . . 8.16 . .
Chicken eggs 2.52 1.57 1.42 . . 2.84 1.54 1.9 2.38 2.55 1.53 1.41 2.63 1.45 1.6 1.76 2.62 1.47 1.6 1.59 1.68 2.05 . 3.26 2.44 5.07 1.24
Butter 1.74 1.99 1.35 . . 2.89 . 2.18 2.19 2.52 1.81 1.69 1.93 1.96 2.21 1.15 1.51 1.22 1.48 1.81 2.01 2.03 . 1.85 1.01 2.48 2.37
Margarine . . 0.9 . . 1.1 . 0.8 0.95 1.23 0.76 0.92 0.85 1.05 1.01 0.76 1.09 0.57 0.98 0.73 0.86 0.72 1.18 . 0.79 . 0.67
Olive oil 6.56 6.94 10.3
6 . . 5.32 2.68 8.5 5 4.96 8.3 6.85 7.6 9.16 6.64 4.84 8.06 8.41 3.88 7.28 9.11
10.08
. . 6.74 . 4.55
Vegetable oil 2.25 1.55 1.71 . . 2.48 . 1.7 1.96 2.3 2.31 1.63 3.39 1.71 . 1.45 3.49 1.63 1.89 1.62 2.02 1.83 3.44 . 2.9 . 2.59
Apples 1.42 0.95 1.24 1.89 . 1.72 1.65 1.12 1.76 1.65 1.05 1.28 2.36 0.93 1.64 1.66 1.93 0.87 1.2 0.94 1.15 1.17 1.92 2.13 1.61 . 0.9
Fresh bananas 1.97 1.3 1.22 . . 1.75 . 1.24 1.73 1.31 1.39 1.24 2.15 1.36 1.5 1.68 1.73 1.26 1.4 1.23 1.32 1.37 1.62 . 1.6 . 1.67
Canned fruit 2.62 . 1.81 . . 3.5 . . 4.02 3 1.94 . 3.04 2.07 2.23 2.11 . 1.74 . 1.85 1.89 . . 2.37 2.26 . .
Carrots 1 0.7 0.7 . . 0.99 0.99 1.04 1.26 1.12 0.54 0.51 1.18 0.89 1.11 1.12 1.52 0.82 0.57 0.54 1.13 0.77 1.69 1.1 2.61 . 0.6
Fresh tomatoes
2.02 0.99 1.51 . . 1.49 . 1.88 2.33 1.33 1.82 1.44 2.11 1.77 1.55 1.96 2.55 1.39 1.39 1.26 1.91 1.83 2.38 . 2.36 . 0.73
Potatoes 1.03 0.53 0.42 . . 0.7 0.75 0.58 0.94 0.72 0.32 0.29 1.2 0.43 0.69 2.08 1.19 0.5 0.46 0.34 0.57 0.43 0.7 0.87 1.22 2.21 0.42
Tinned sweet corn
1.4 1.13 . . . . . 1.48 1.91 1.22 1.4 0.7 1.45 1.04 1.15 . . 1.07 0.99 1.34 0.8 1.02 . . 0.97 . .
Frozen French fries
1.9 1.4 1.31 . . . . 1.8 2.38 2.55 1.8 1.53 1.48 1.78 2.23 1.14 2.5 2.15 1.33 1.79 1.53 1.98 1.92 . 2.8 . .
Potato crisps 1.2 1.25 1.74 . . 1.81 . 2.3 1.62 1.55 1.55 1.46 1.64 2.12 1.94 1.04 1.74 1.63 1.3 1.28 1.74 1.77 . . 2.69 . 1.55
White sugar 1.03 1.17 0.97 0.94 1.34 1.08 0.98 0.97 1.15 1.46 1.21 1.16 1.26 1.04 1.33 0.96 1.19 0.92 1.12 1.13 1.09 1.14 1.06 1.23 1.38 1 1.31
Jam 3.61 . 4.6 . . 6.58 3.08 . 4.88 4.3 4.85 3.61 4.3 2.97 3.27 3.21 4.89 3.33 5.7 3.3 3.14 . 5.38 3.28 5.3 . 4.07
Milk chocolate 11.8
5 7.24 9.04 7.6 .
10.97
. 11.3
9 11.4
3 12.1
2 10.2
9 8.53
10.96
9.79 9.23 8.27 9.69 . 8.26 7.74 8.09 8.63 10.7 . 10.5 10.3
1 10.5
1
Chewing gum 0.95 . 0.49 . . 1 . 0.6 . 1.11 0.46 0.46 0.93 0.54 0.77 0.5 0.71 0.49 0.79 0.44 0.52 0.54 . . 0.57 . 0.83
Ice cream 3.44 2.42 . . . . . 3.49 3.2 4.76 2.34 2.77 4.72 3.88 2.39 2.29 3.2 2.34 2.01 . 3.53 3.3 2.43 3.02 2.95 . 2.3
Baby food, meat base
. . 3.36 . . . . . . 3.56 3.64 3.47 3.72 3.05 . 2.31 2.88 3.3 3.65 4.77 . . . . 3.75 . .
Tomato ketchup
2.96 1.24 2.1 1.4 . . . 2.37 . 2.42 1.04 0.97 2.71 2.4 2.61 2.22 1.92 2.33 2.26 2.32 1.37 2.41 3.16 . . . 2.26
Mineral salt 0.49 0.3 0.21 . . . . 0.59 0.44 . 0.37 0.35 0.96 0.33 0.59 0.51 0.79 0.26 . 0.32 0.4 0.24 . . 0.93 . 0.54
Black pepper 6.32 . 2.42 . . . . 1.92 3.82 4.18 2.85 3.08 5.08 2.38 1.82 1.61 . 2.12 3.15 2.16 2.41 . . . 5.73 . 1.82

EN 67 Error! No document variable supplied. EN
Item Name BE BG CZ DE IE EL ES HR IT CY LV LT LU HU MT NL AT PL PT RO SI SK FI UK IS CH TR
Coffee 11.8
6 8.65
12.22
. . 14.6
2 7.32
10.82
11.63
9.46 14.3
5 12.1
9 13.4
4 10.4
1 . 8.79 .
10.32
9.96 11.7
1 7.68
11.91
8.18 14.9
9 10.1
5 .
41.91
Black tea 1.45 1.31 1.11 . . 2.15 . . 1.41 1.25 1.61 1.3 1.93 1.17 0.75 . 2.1 1.34 1.24 . . 1.07 . . 2.13 . .
Cocoa instant drink
3.07 . . 3.58 . 6.47 . . . 7.16 5.64 5.48 6.13 . 6.18 . 5.27 . 5.73 4.38 4.97 6.87 7.54 . 5.62 . 8.42
Mineral water, carbonated
0.46 . 0.35 . . . . 0.45 0.26 0.98 0.42 0.39 0.69 0.24 0.76 0.37 0.35 0.31 1.21 0.3 0.31 0.34 1.25 . 0.9 . 0.84
Mineral water, still
0.49 0.22 . . . 0.32 . 0.44 0.26 0.34 0.42 0.46 0.45 0.24 0.32 0.31 . 0.3 0.31 0.27 . 0.35 . . . . 0.38
Carbonated drink, orange
flavoured
. 0.4 0.74 . . . . . 0.76 1.09 0.72 0.64 0.87 . 0.83 0.86 0.81 . 0.58 0.5 0.65 0.62 . . 0.87 . 0.78
Orange juice 1.39 1.14 1.31 . . 1.41 0.84 . . 1.28 1.33 1.45 1.35 1.39 1.32 1.57 1.38 1.05 1.15 1.38 0.97 1.45 1.19 2.79 1.43 . 0.93
Vodka 15.6
1 9.54
10.83
. 25.0
3 22 . 9.07 .
13.39
11.61
13.71
11.9 12.5
4 16.0
7 .
12.89
. 14.4
2 9.96 .
14.14
. 22.4
5 43.7
1 . .
Red wine . 1.01 2.05 . . 4.83 . 2.63 1.45 4.42 4.17 4.45 4.63 0.71 1.7 2.62 . 4.12 0.96 2.15 . 1.45 . 7.56 9.95 . 8.75
White wine . 1.15 1.92 . . 4.33 . 2.46 1.45 3.89 4.17 4.15 5.16 0.71 1.71 2.8 . 4.16 1.06 2.19 1.07 1.39 . 7.1 10.2
5 . .
Beer 1.55 0.95 1.55 1.51 . 2.17 . 1.55 1.72 2.7 1.53 1.36 2.39 1.28 2.53 1.58 1.65 1.21 1.97 1.41 1.91 1.31 . . 5.7 2.04 3.13
Cigarettes 5.42 2.44 2.9 5.09 9.04 3.29 . 2.81 4.59 3.76 3.04 2.32 4.24 2.74 4.11 5.51 4.22 2.41 3.87 2.68 3.38 2.91 . 9.34 6.09 5.83 2.75
Men's suit, wool
284.5
101.3
213.1
. . . . 227.
5 312.
1 141.
5 .
215.3
. 153.
6 . 298
215.2
111.2
237.7
. 209.
1 193.
5 . . . .
108.8
Men's trousers . 24.5
8 45.3
8 . . . . .
77.96
66.76
. 59.5
7 .
35.65
33.99
74 62.7
7 .
65.62
. 63.7
2 61.9 . . . . 29.7
Men's blue jeans
57.03
30.15
40.56
. . 64.3
9 .
50.86
67.59
42.05
. 37.6 . 33.2
7 28.7
2 71.9
5 66.3
6 .
35.27
. 48.9
2 52.0
1 . . . .
31.32
Men' s shirt 39.9
6 19.2
4 22.1
7 . .
49.04
. 36.1 . 31.5
3 .
27.76
. 19.8
9 24.0
6 42.7
8 36.3
7 21.1
1 30.0
6 16.8
4 35.6
1 27.8
4 .
31.79
. . 21.2
4
Men's T-shirt, short sleeves
16.96
10.52
14.63
. . . . 13.5
4 .
15.57
8.99 11.2
2 .
12.89
16.88
11.49
21.83
. 8.34 . 16.0
1 18.9
6 . . . .
18.06
Men's boxer briefs
11.33
3.56 6.76 . . . . 9.03 8.39 10.2
7 5.97 6.55 . 5.62 5.79 6.93
11.29
4.52 8.08 . 9.45 9.16 . . . . .
Ladies' top coat
. 73.8
3 145.
3 . . . .
154.4
238 102.
6 140
165.9
. 94.3
9 .
123.2
117.4
73.21
129.2
. . 145.
4 . . . .
73.16
Ladies' blazer, woolmix
. 34.2
8 63.4 . . . . .
120.9
66.7 . 83.9
7 .
52.01
. 86.4
6 80.5
4 .
72.27
. . 89.6
5 . . . . .
Ladies' straight trousers
54.15
20.55
34.89
. . . . . 66.0
3 27.1
4 32.4
5 37.8
9 .
21.99
26.25
57.86
48.15
. 35.7
9 .
54.18
32.87
. . . . 24.7
3
Ladies' jeans 53.8
9 24.8
5 37.4
6 . .
62.22
. 49.8
5 .
27.03
. 42.2
9 .
26.76
26.76
59.63
63.42
28.73
45.93
. 48.9
2 44.9
8 . . . .
28.43
Ladies' skirt 60.4
6 22.2
4 37.5
8 . . . . .
64.42
35.94
. 40.9 . 29.1
4 24.0
3 52.8
51.21
. 47.2
1 .
48.25
40.26
. 33.1
8 . .
26.52
Ladies' blouse 48.1
6 19.0
1 26.4
8 . . . .
37.34
56.14
30.82
21.66
31.35
. 21.7
1 24.2
42.38
73.13
21 29.7
9 .
40.72
30.65
. . . . 10.9
6
Ladies' T-shirt 19.6
2 9.86
13.74
. . . . 20.9
3 22.5
1 10.3
8 10.6
5 15.9
6 .
10.89
14.75
22.99
26.61
12.82
11.59
. 24.8
4 16.1
2 . . . .
12.22
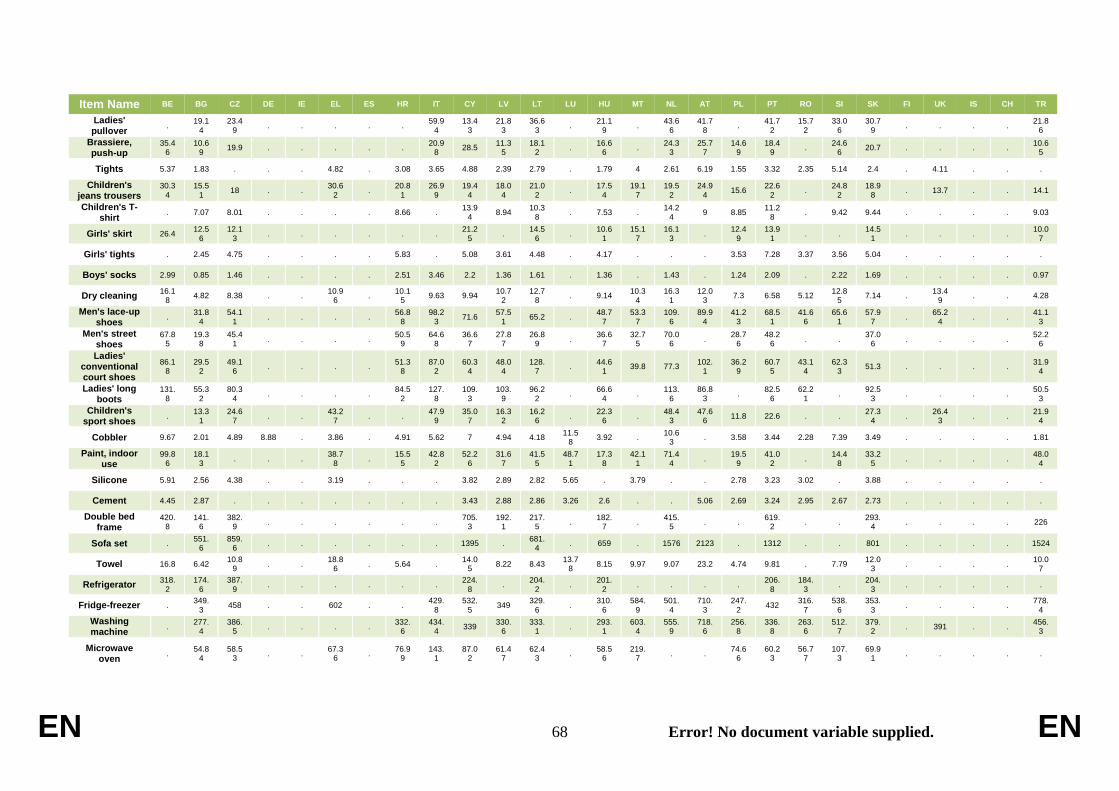
EN 68 Error! No document variable supplied. EN
Item Name BE BG CZ DE IE EL ES HR IT CY LV LT LU HU MT NL AT PL PT RO SI SK FI UK IS CH TR
Ladies' pullover
. 19.1
4 23.4
9 . . . . .
59.94
13.43
21.83
36.63
. 21.1
9 .
43.66
41.78
. 41.7
2 15.7
2 33.0
6 30.7
9 . . . .
21.86
Brassiere, push-up
35.46
10.69
19.9 . . . . . 20.9
8 28.5
11.35
18.12
. 16.6
6 .
24.33
25.77
14.69
18.49
. 24.6
6 20.7 . . . .
10.65
Tights 5.37 1.83 . . . 4.82 . 3.08 3.65 4.88 2.39 2.79 . 1.79 4 2.61 6.19 1.55 3.32 2.35 5.14 2.4 . 4.11 . . .
Children's jeans trousers
30.34
15.51
18 . . 30.6
2 .
20.81
26.99
19.44
18.04
21.02
. 17.5
4 19.1
7 19.5
2 24.9
4 15.6
22.62
. 24.8
2 18.9
8 . 13.7 . . 14.1
Children's T-shirt
. 7.07 8.01 . . . . 8.66 . 13.9
4 8.94
10.38
. 7.53 . 14.2
4 9 8.85
11.28
. 9.42 9.44 . . . . 9.03
Girls' skirt 26.4 12.5
6 12.1
3 . . . . . .
21.25
. 14.5
6 .
10.61
15.17
16.13
. 12.4
9 13.9
1 . .
14.51
. . . . 10.0
7
Girls' tights . 2.45 4.75 . . . . 5.83 . 5.08 3.61 4.48 . 4.17 . . . 3.53 7.28 3.37 3.56 5.04 . . . . .
Boys' socks 2.99 0.85 1.46 . . . . 2.51 3.46 2.2 1.36 1.61 . 1.36 . 1.43 . 1.24 2.09 . 2.22 1.69 . . . . 0.97
Dry cleaning 16.1
8 4.82 8.38 . .
10.96
. 10.1
5 9.63 9.94
10.72
12.78
. 9.14 10.3
4 16.3
1 12.0
3 7.3 6.58 5.12
12.85
7.14 . 13.4
9 . . 4.28
Men's lace-up shoes
. 31.8
4 54.1
1 . . . .
56.88
98.23
71.6 57.5
1 65.2 .
48.77
53.37
109.6
89.94
41.23
68.51
41.66
65.61
57.97
. 65.2
4 . .
41.13
Men's street shoes
67.85
19.38
45.41
. . . . 50.5
9 64.6
8 36.6
7 27.8
7 26.8
9 .
36.67
32.75
70.06
. 28.7
6 48.2
6 . .
37.06
. . . . 52.2
6
Ladies' conventional court shoes
86.18
29.52
49.16
. . . . 51.3
8 87.0
2 60.3
4 48.0
4 128.
7 .
44.61
39.8 77.3 102.
1 36.2
9 60.7
5 43.1
4 62.3
3 51.3 . . . .
31.94
Ladies' long boots
131.8
55.32
80.34
. . . . 84.5
2 127.
8 109.
3 103.
9 96.2
2 .
66.64
. 113.
6 86.8
3 .
82.56
62.21
. 92.5
3 . . . .
50.53
Children's sport shoes
. 13.3
1 24.6
7 . .
43.27
. . 47.9
9 35.0
7 16.3
2 16.2
6 .
22.36
. 48.4
3 47.6
6 11.8 22.6 . .
27.34
. 26.4
3 . .
21.94
Cobbler 9.67 2.01 4.89 8.88 . 3.86 . 4.91 5.62 7 4.94 4.18 11.5
8 3.92 .
10.63
. 3.58 3.44 2.28 7.39 3.49 . . . . 1.81
Paint, indoor use
99.86
18.13
. . . 38.7
8 .
15.55
42.82
52.26
31.67
41.55
48.71
17.38
42.11
71.44
. 19.5
9 41.0
2 .
14.48
33.25
. . . . 48.0
4
Silicone 5.91 2.56 4.38 . . 3.19 . . . 3.82 2.89 2.82 5.65 . 3.79 . . 2.78 3.23 3.02 . 3.88 . . . . .
Cement 4.45 2.87 . . . . . . . 3.43 2.88 2.86 3.26 2.6 . . 5.06 2.69 3.24 2.95 2.67 2.73 . . . . .
Double bed frame
420.8
141.6
382.9
. . . . . . 705.
3 192.
1 217.
5 .
182.7
. 415.
5 . .
619.2
. . 293.
4 . . . . 226
Sofa set . 551.
6 859.
6 . . . . . . 1395 .
681.4
. 659 . 1576 2123 . 1312 . . 801 . . . . 1524
Towel 16.8 6.42 10.8
9 . .
18.86
. 5.64 . 14.0
5 8.22 8.43
13.78
8.15 9.97 9.07 23.2 4.74 9.81 . 7.79 12.0
3 . . . .
10.07
Refrigerator 318.
2 174.
6 387.
9 . . . . . .
224.8
. 204.
2 .
201.2
. . . . 206.
8 184.
3 .
204.3
. . . . .
Fridge-freezer . 349.
3 458 . . 602 . .
429.8
532.5
349 329.
6 .
310.6
584.9
501.4
710.3
247.2
432 316.
7 538.
6 353.
3 . . . .
778.4
Washing machine
. 277.
4 386.
5 . . . .
332.6
434.4
339 330.
6 333.
1 .
293.1
603.4
555.9
718.6
256.8
336.8
263.6
512.7
379.2
. 391 . . 456.
3
Microwave oven
. 54.8
4 58.5
3 . .
67.36
. 76.9
9 143.
1 87.0
2 61.4
7 62.4
3 .
58.56
219.7
. . 74.6
6 60.2
3 56.7
7 107.
3 69.9
1 . . . . .

EN 69 Error! No document variable supplied. EN
Item Name BE BG CZ DE IE EL ES HR IT CY LV LT LU HU MT NL AT PL PT RO SI SK FI UK IS CH TR
Vacuum cleaner
. 63.0
3 121.
5 . . . .
90.79
129 101.
7 92.6
7 83.3
9 .
58.29
84.75
. 196.
2 82.6
6 89.5
4 56.7
8 158.
9 89.5
5 . . . .
100.7
Kettle 34.5
2 29.1
9 35.3
9 . . . . . .
38.85
31.05
34.7 . 21.3
1 44.6
4 42.4
9 . 29.5
39.79
29.21
. 34.7
5 . . . .
33.11
Glass, water 1.25 0.92 1.02 . . . . 0.82 1.69 1.25 1.13 0.8 1.11 0.76 1.09 0.84 3.9 0.4 0.97 . 1.27 1.15 . . . . 0.22
Flat plate 5.2 1 2.62 . . 2.9 . . 3.47 2.25 2.35 2.91 3.08 1.77 . . 17.9
7 3.02 3.44 . 3.31 . . . . . 1.76
Cup and saucer
5.32 1.78 4.19 . . . . . 3.17 3.19 . 2.57 . 3.14 . 5.83 . 5.01 3.88 . 3.8 . . . . . .
Cooking pot . 16.8
1 33.2
7 . . . . .
50.94
28.94
18.68
33.54
. 22.8
6 32.7
3 52.4
8 144.
8 .
24.87
. 39.9
2 17.9
2 . . . .
17.74
Battery 1.63 0.64 0.43 . . 0.97 . . 1.09 0.95 0.69 0.62 . 0.9 0.97 1.01 1.28 0.59 0.89 0.66 1.2 0.97 . 1.12 1.37 . 0.79
Light bulb . 0.4 . . . 1.02 . 0.45 . 0.65 . 0.49 . . . 1.22 . . 1.81 . . 0.45 . 2.56 0.49 . .
Light bulb energy saving
type
. 4.28 5.92 . . 5.74 . 4.67 7 6.14 4.19 3.59 7.26 4.95 5.57 5.53 9.54 4.7 6.43 . 6.77 5.6 . . 4.68 . 2.97
Detergent for washing machine,
concentrated
5.38 2.18 3.06 1.73 . . . . 3.26 2.65 . 2.62 5.79 2.43 3.26 4.58 . . . . . 2.61 . . 2.85 . 2.58
Dish washer tablets
1.06 2.44 2.42 . . . . 2.25 2.05 2.24 2.37 2.37 1.48 2.31 2.37 1.36 . 2.08 1.43 . 2.37 2.93 . . 1.21 . 2.38
Detergent for washing machine,
unconcentrated
. . . . . 3.02 . 2.89 3.26 2.21 2.87 . . . 3.06 3.06 . 2.12 2.68 2.01 3.07 . . . . . .
All-purposes household
cleaner
1.92 1.51 2.41 . . 2.3 . 2.64 2.6 1.96 . 1.97 1.75 2.99 3.39 1.15 2.12 . 1.33 . 3.17 2.53 2.6 . 3.99 . 1.68
Cleaner for WC 2.18 1.91 2.5 . . . . 2.52 2.55 2.38 2.7 2.58 1.9 . 3.42 1.62 . 2.71 2.39 2.32 2.35 2.4 . . 3 . 1.03
Cleaning liquid for windows
3.87 2.27 3.5 . . . . . 2.6 2.75 3.54 2.76 3.14 3.33 3.11 2.7 . 2.98 4.06 2.66 . 3.79 . . 3.71 . .
Scourer sponge
1.11 0.23 0.37 . . 0.62 . . . 0.36 0.34 0.37 0.72 . . 0.41 . . 0.59 . . 0.4 . . 0.4 . 0.53
Urban bus transport,
single ticket
1.39 0.45 0.46 . . . . . 1.11 1 0.55 0.53 1.5 0.89 1.2 1.49 1.53 0.6 1.3 0.4 1.07 0.57 . . 2.18 . 0.6
Taxi 10.8
8 2.2 6.07 . . . . 1.92 . 6.6 5.21 3.3 . 5.35 14 16
10.37
3.7 5.6 2.32 6.4 4.68 . . 9.58 . 2.54
Television . 403.
9 390.
8 . .
404.8
. 386.
1 445.
9 357.
6 366.
6 452.
1 .
411.3
417.9
707.7
653.5
369.7
475.2
339.1
597.3
403 . . . . 488.
8
DVD recorder with hard disk
. . 254.
9 . . . . .
89.89
. . 336.
8 .
237.5
. 302.
5 364.
5 .
239.3
266.7
. 263.
2 .
310.5
. . .
Portable MP3 player
. 128.
7 57.2 . .
103.3
. 37.7
7 72.3
8 190.
3 .
178.9
. . . . 159.
9 .
136.3
152.5
52.83
. . . . . 32.2
8

EN 70 Error! No document variable supplied. EN
Item Name BE BG CZ DE IE EL ES HR IT CY LV LT LU HU MT NL AT PL PT RO SI SK FI UK IS CH TR
Compact digital camera
. 100.
3 137.
6 . .
96.07
. 150.
4 .
119.8
. 156.
8 .
89.32
117.5
134.3
202.7
133 120.
1 81.4
3 205.
4 205.
1 . . . .
171.8
Camcorder . . 278.
1 . . . . . . . . . .
340.7
. 244.
6 300.
5 255.
4 974.
9 . . . . . . .
339.6
Laptop . 521.
3 547.
5 . . . . . . 749
619.1
615 . 527.
2 .
675.9
. 576.
4 670.
8 581.
4 798.
9 598.
5 . . . .
644.6
Monitor 173.
2 149
156.2
. . 164.
8 .
159.4
. 166.
2 147.
1 119.
6 .
148.5
. . 142.
1 124.
3 150.
5 146
183.3
141.6
. . . . .
Music CD - Pop Chart
17.32
8.75 10.6
3 15.8
6 . . .
12.02
13.6 12.5
2 10.0
8 . .
12.09
. 15.3
9 17.1 9.89
12.83
7.83 14.6 12.8
2 .
12.41
19.18
. 7.25
Movie DVD 17.9
5 6.75
10.93
. . . . 10.7
7 14.0
8 20.1
1 . . .
10.17
19.87
15.47
15.12
. 17.0
9 10.7
14.72
12.77
. . 15.7
9 . .
Blank compact disc (CD-R)
. 0.33 0.35 . . 0.43 . 0.35 1.26 0.53 0.8 0.32 0.79 0.59 . . . 0.3 0.59 0.26 . 0.35 . . . . 0.24
Blank DVD (R), slimcase
. 4.53 3.95 . . . . 4.82 12.6
1 8.02 . 3.86 7.52 7.49 .
13.36
12.73
3.61 7.88 3.31 3.63 4.23 . . . . .
Board game, Monopoly
31.85
21.72
. 32.5
8 . . .
15.92
31.48
34.99
. 28.6
2 .
31.81
60 33.9
9 31.5
1 .
36.86
24.01
27.25
30.45
. . . . .
Video game, PlayStation 3
48.45
50.04
. 53.9
8 . . . .
51.34
55.05
. . 49.2
9 39.4
8 50.8
52.14
. 33.5
7 50.6
5 . .
36.64
. . 62.7
3 . .
Potting soil 2.4 1.69 1.89 . . 2.31 . 1.4 1.83 1.53 1.79 0.99 2.48 1.64 2.15 1.07 1.97 1.05 1.54 . 2.48 1.54 . . . . .
Dog food meat 2.66 1.75 1.54 . . . . . . 1.76 . 1.62 1.41 1.55 1.1 1.19 . . 1.85 . 1.72 1.97 . . 3.83 . .
Dog food dry 1.8 2.14 2.27 . . . . 2.21 . 2.35 1.79 1.69 . 1.74 1.15 1.5 1.84 2.18 3.02 . . 2.28 2.31 . 3.07 . .
Digital photo print service
7.34 5.33 8.73 . . 8.11 . 6.88 7.55 8.86 5.74 7.65 . 5.77 . 4.5 . . 7.13 5.64 . 7.59 . . . . 5.4
Item Name BE BG CZ DE IE EL ES HR IT CY LV LT LU HU MT NL AT PL PT RO SI SK FI UK IS CH TR
Cinema ticket 8.32 3.77 4.15 7.64 8.98 7.79 . 3.1 7.94 7.91 3.5 4.26 8 4.54 5.55 9.08 8.67 3.8 6.21 . 5.12 3.27 10.9
3 . 7.64 . 4.07
Novel 20.0
3 7.34 . . . . .
15.41
. 18.6
3 12.4 9.25 .
11.81
10.8 16.2
7 15.3
7 8.54
16.26
. . 10.8
2 . . . . 8.31
Daily newspaper
1.08 0.47 0.68 . . . . 0.93 1.3 1.95 0.68 0.52 1.3 0.54 0.62 1.5 1 0.43 1.06 0.35 1.26 0.45 . . . 2.59 0.22
Magazine . 0.78 1.1 1.21 . . . 1.6 1.58 3.45 1.82 0.83 2.05 0.71 4.2 3.15 3.53 . 1.38 . 1.61 0.79 . . 5.57 . 1.34
Paper 5.32 3.89 3.71 4.25 . 4.53 . 4.33 4.67 4.22 4.16 4.3 4.47 . . 4.53 . 3.74 3.56 3.47 5.35 3.7 . . . . 2.99
Pencil 0.76 0.26 . . . 0.56 . . 0.66 0.53 0.33 0.31 0.64 0.32 0.36 0.77 0.62 0.23 0.47 . 0.65 0.23 . . . . 0.29
Menu of the day
21.35
3.42 . . . . . . . 17.9 . 3.32 11.7 3.75 25.6
8 25.8
9 7.91 5.42 7.05 . 8.47 3.25 . . .
17.02
.
Red house wine – glass
2.87 1.11 1.24 2.33 . . . . . 3.94 . 1.79 . 0.6 2.56 3.54 2.1 1.51 0.87 0.83 1.18 0.76 . 4.02 . . .
Beer (lager), domestic -
glass
1.92 0.71 1.16 2.31 . . . . . 2.24 1.43 1.08 2.36 0.91 1.98 2.39 3.23 1.21 1.08 0.75 2.92 0.87 . 2 4.49 4 2.45
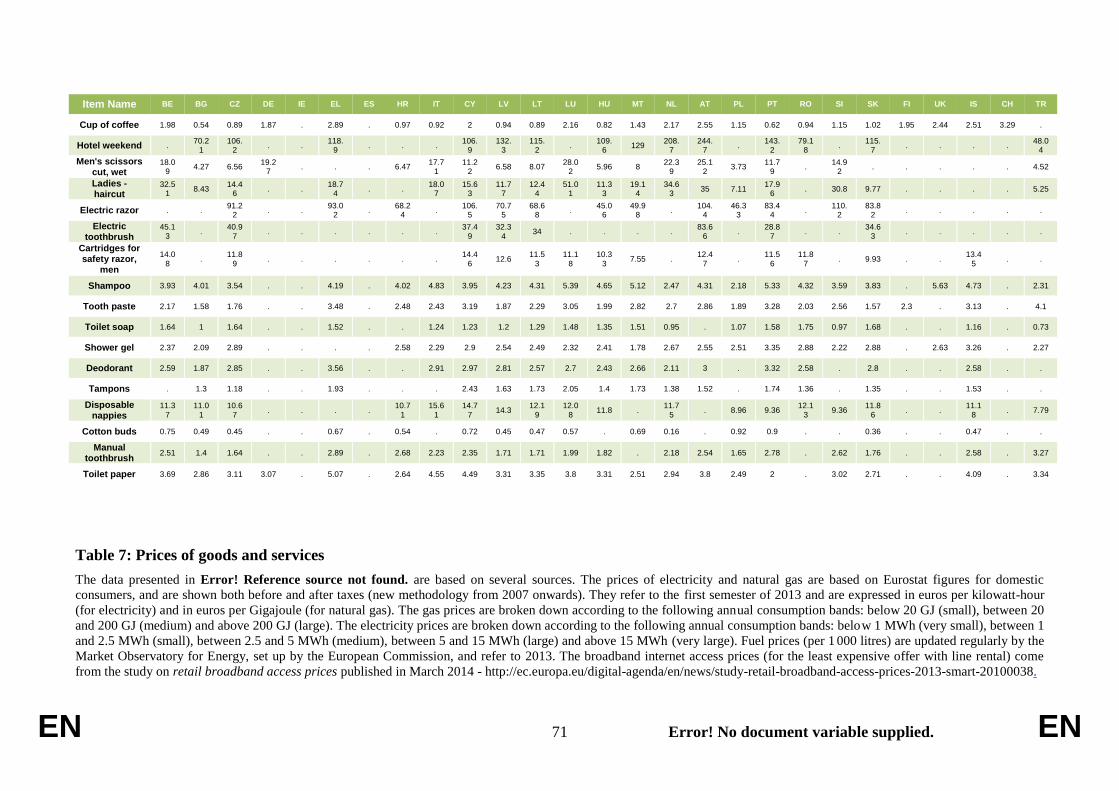
EN 71 Error! No document variable supplied. EN
Item Name BE BG CZ DE IE EL ES HR IT CY LV LT LU HU MT NL AT PL PT RO SI SK FI UK IS CH TR
Cup of coffee 1.98 0.54 0.89 1.87 . 2.89 . 0.97 0.92 2 0.94 0.89 2.16 0.82 1.43 2.17 2.55 1.15 0.62 0.94 1.15 1.02 1.95 2.44 2.51 3.29 .
Hotel weekend . 70.2
1 106.
2 . .
118.9
. . . 106.
9 132.
3 115.
2 .
109.6
129 208.
7 244.
7 .
143.2
79.18
. 115.
7 . . . .
48.04
Men's scissors cut, wet
18.09
4.27 6.56 19.2
7 . . . 6.47
17.71
11.22
6.58 8.07 28.0
2 5.96 8
22.39
25.12
3.73 11.7
9 .
14.92
. . . . . 4.52
Ladies - haircut
32.51
8.43 14.4
6 . .
18.74
. . 18.0
7 15.6
3 11.7
7 12.4
4 51.0
1 11.3
3 19.1
4 34.6
3 35 7.11
17.96
. 30.8 9.77 . . . . 5.25
Electric razor . . 91.2
2 . .
93.02
. 68.2
4 .
106.5
70.75
68.68
. 45.0
6 49.9
8 .
104.4
46.33
83.44
. 110.
2 83.8
2 . . . . .
Electric toothbrush
45.13
. 40.9
7 . . . . . .
37.49
32.34
34 . . . . 83.6
6 .
28.87
. . 34.6
3 . . . . .
Cartridges for safety razor,
men
14.08
. 11.8
9 . . . . . .
14.46
12.6 11.5
3 11.1
8 10.3
3 7.55 .
12.47
. 11.5
6 11.8
7 . 9.93 . .
13.45
. .
Shampoo 3.93 4.01 3.54 . . 4.19 . 4.02 4.83 3.95 4.23 4.31 5.39 4.65 5.12 2.47 4.31 2.18 5.33 4.32 3.59 3.83 . 5.63 4.73 . 2.31
Tooth paste 2.17 1.58 1.76 . . 3.48 . 2.48 2.43 3.19 1.87 2.29 3.05 1.99 2.82 2.7 2.86 1.89 3.28 2.03 2.56 1.57 2.3 . 3.13 . 4.1
Toilet soap 1.64 1 1.64 . . 1.52 . . 1.24 1.23 1.2 1.29 1.48 1.35 1.51 0.95 . 1.07 1.58 1.75 0.97 1.68 . . 1.16 . 0.73
Shower gel 2.37 2.09 2.89 . . . . 2.58 2.29 2.9 2.54 2.49 2.32 2.41 1.78 2.67 2.55 2.51 3.35 2.88 2.22 2.88 . 2.63 3.26 . 2.27
Deodorant 2.59 1.87 2.85 . . 3.56 . . 2.91 2.97 2.81 2.57 2.7 2.43 2.66 2.11 3 . 3.32 2.58 . 2.8 . . 2.58 . .
Tampons . 1.3 1.18 . . 1.93 . . . 2.43 1.63 1.73 2.05 1.4 1.73 1.38 1.52 . 1.74 1.36 . 1.35 . . 1.53 . .
Disposable nappies
11.37
11.01
10.67
. . . . 10.7
1 15.6
1 14.7
7 14.3
12.19
12.08
11.8 . 11.7
5 . 8.96 9.36
12.13
9.36 11.8
6 . .
11.18
. 7.79
Cotton buds 0.75 0.49 0.45 . . 0.67 . 0.54 . 0.72 0.45 0.47 0.57 . 0.69 0.16 . 0.92 0.9 . . 0.36 . . 0.47 . .
Manual toothbrush
2.51 1.4 1.64 . . 2.89 . 2.68 2.23 2.35 1.71 1.71 1.99 1.82 . 2.18 2.54 1.65 2.78 . 2.62 1.76 . . 2.58 . 3.27
Toilet paper 3.69 2.86 3.11 3.07 . 5.07 . 2.64 4.55 4.49 3.31 3.35 3.8 3.31 2.51 2.94 3.8 2.49 2 . 3.02 2.71 . . 4.09 . 3.34
Table 7: Prices of goods and services
The data presented in Error! Reference source not found. are based on several sources. The prices of electricity and natural gas are based on Eurostat figures for domestic
consumers, and are shown both before and after taxes (new methodology from 2007 onwards). They refer to the first semester of 2013 and are expressed in euros per kilowatt-hour
(for electricity) and in euros per Gigajoule (for natural gas). The gas prices are broken down according to the following annual consumption bands: below 20 GJ (small), between 20
and 200 GJ (medium) and above 200 GJ (large). The electricity prices are broken down according to the following annual consumption bands: below 1 MWh (very small), between 1
and 2.5 MWh (small), between 2.5 and 5 MWh (medium), between 5 and 15 MWh (large) and above 15 MWh (very large). Fuel prices (per 1 000 litres) are updated regularly by the
Market Observatory for Energy, set up by the European Commission, and refer to 2013. The broadband internet access prices (for the least expensive offer with line rental) come
from the study on retail broadband access prices published in March 2014 - http://ec.europa.eu/digital-agenda/en/news/study-retail-broadband-access-prices-2013-smart-20100038.

EN 72 Error! No document variable supplied. EN
Item Name
BE BG CZ DK DE EE IE EL ES FR HR IT CY LV LT LU HU MT NL AT PL PT RO SI SK FI SE UK IS NO TR
Gas < 20 GJ
20.48
11.51
22.26
13.82
22.61
14.9
16.55
20.29
20.01
28.02
10.44
19.53
. 17.27
20.37
20.6
10.23
. 20.71
19 15.05
22.99
4.238
17.85
23.43
. 31.08
15.91
. . 9.283
20 GJ < Gas < 200 GJ
14.53
11.87
14.71
13.82
13.77
11.44
15.13
17.4
16.16
15.69
10.34
15.66
. 11.14
13.84
15.66
9.457
. 13.28
15.84
10.61
18.25
4.22
14.14
11.54
. 18.64
14.03
. . 9.367
Gas > 200 GJ
13.51
12.11
13.87
13.82
12.94
11.05
14.46
17.06
15.16
13.88
10.34
14.53
. 11.
1 12.39
15.79
9.333
. 12.45
13.85
10.28
16.41
4.163
14.06
11.83
. 17.07
13.05
. . 9.3
8
Gas < 20 GJ + taxes
25.66
13.81
26.93
31.38
29.65
18.62
19.78
24.67
25 33.65
13.05
25.97
. 21.48
24.65
22.53
12.99
. 31.55
25.49
18.51
29.34
7.955
23.02
28.12
. 49.64
16.71
. . 11.25
20 GJ < Gas < 200 GJ + taxes
18.32
14.24
17.8
31.38
18.35
14.57
18.15
21.44
20.34
18.83
12.92
23.17
. 14.05
16.75
17.34
12.01
. 22.56
21.32
13.05
23.23
7.911
18.57
13.85
. 34.09
14.74
. . 11.35
Gas > 200 GJ + taxes
17.01
14.54
16.79
31.38
17.36
13.93
17.35
21.06
19.13
16.62
12.93
23.49
. 14 14.99
17.41
11.85
. 21.56
18.84
12.65
20.94
7.738
18.47
14.2
. 32.12
13.69
. . 11.37
Electricity < 1 M Wh
0.219
0.08
0.265
0.154
0.26
0.106
0.481
0.166
0.292
0.218
0.19
0.2 0.254
0.097
0.117
0.213
0.12
0.371
0.314
0.214
0.148
0.168
0.092
0.158
0.225
0.221
0.266
0.194
0.247
0.355
0.119
1 M Wh < Electricity < 2.5 M Wh
0.174
0.078
0.193
0.154
0.17
0.103
0.232
0.109
0.191
0.12
0.119
0.138
0.226
0.108
0.115
0.163
0.112
0.19
0.16
0.159
0.12
0.131
0.091
0.132
0.157
0.145
0.153
0.18
0.105
0.216
0.119

EN 73 Error! No document variable supplied. EN
Item Name
BE BG CZ DK DE EE IE EL ES FR HR IT CY LV LT LU HU MT NL AT PL PT RO SI SK FI SE UK IS NO TR
2.5 M Wh < Electricity < 5 M Wh
0.158
0.077
0.125
0.13
0.149
0.099
0.195
0.117
0.175
0.101
0.109
0.15
0.228
0.114
0.113
0.145
0.106
0.162
0.132
0.141
0.116
0.121
0.089
0.118
0.138
0.11
0.136
0.166
0.083
0.137
0.119
5 M Wh < Electricity < 15 M Wh
0.142
0.077
0.108
0.112
0.138
0.096
0.172
0.117
0.153
0.089
0.104
0.183
0.223
0.117
0.11
0.131
0.101
0.171
0.116
0.128
0.109
0.112
0.088
0.109
0.122
0.095
0.109
0.15
0.073
0.094
0.118
Electricity > 15 M Wh
0.124
0.078
0.095
0.112
0.135
0.085
0.152
0.098
0.141
0.078
0.1 0.209
0.21
0.12
0.104
0.119
0.106
0.314
0.093
0.118
0.108
0.115
0.085
0.099
0.107
0.079
0.094
0.135
0.041
0.081
0.119
Electricity < 1 M Wh + tax
0.291
0.096
0.322
0.33
0.426
0.142
0.608
0.207
0.371
0.272
0.239
0.279
0.307
0.117
0.142
0.239
0.157
0.39
. 0.318
0.188
0.325
0.136
0.239
0.273
0.295
0.373
0.203
0.311
0.464
0.15
1 M Wh < Electricity < 2.5 M Wh + tax
0.234
0.093
0.235
0.33
0.317
0.139
0.279
0.144
0.243
0.168
0.149
0.196
0.274
0.131
0.139
0.186
0.147
0.2 0.117
0.236
0.154
0.23
0.135
0.189
0.192
0.201
0.232
0.189
0.132
0.289
0.15
2.5 M Wh < Electricity < 5 M Wh + tax
0.217
0.092
0.153
0.3 0.292
0.135
0.23
0.156
0.223
0.147
0.137
0.229
0.276
0.138
0.137
0.167
0.14
0.17
0.192
0.208
0.148
0.208
0.132
0.161
0.17
0.158
0.21
0.174
0.105
0.191
0.15
Item Name
BE BG CZ DK DE EE IE EL ES FR HR IT CY LV LT LU HU MT NL AT PL PT RO SI SK FI SE UK IS NO TR

EN 74 Error! No document variable supplied. EN
5 M Wh < Electricity < 15 M Wh + tax
0.198
0.093
0.132
0.227
0.278
0.131
0.199
0.173
0.195
0.135
0.131
0.285
0.271
0.141
0.134
0.152
0.134
0.18
0.227
0.189
0.14
0.192
0.13
0.144
0.15
0.139
0.176
0.157
0.092
0.137
0.149
Electricity > 15 M Wh + tax
0.174
0.093
0.116
0.227
0.271
0.118
0.173
0.152
0.179
0.123
0.126
0.32
0.254
0.146
0.125
0.14
0.139
0.33
0.183
0.176
0.138
0.191
0.127
0.128
0.132
0.119
0.158
0.142
0.052
0.121
0.15
Internet access 144kbps-512kbps
. . . 22.01
. . . 58.28
81.38
. . . . . 5.189
. 11.14
. . . 17.23
57.85
. 16.69
17.31
. . . . . .
Internet access 512kbps-1Mbps
. . 14.21
. 22.
8 12.32
25.02
69.37
43.19
. . 57.17
. 17.33
10.08
. 11.
2 . .
18.06
26.59
. . 19.08
18.12
33.97
10.62
. . . .
Intern
et access 1Mbps-2Mbps
. . 24.19
24.94
35.46
27.03
. 35.79
. . 16.88
39.05
23.66
12.06
11.39
. 11.49
. . 18.06
44.07
. 24.77
21.86
13.92
22.16
11.86
. . . .

EN 75 Error! No document variable supplied. EN
Item Name
BE BG CZ DK DE EE IE EL ES FR HR IT CY LV LT LU HU MT NL AT PL PT RO SI SK FI SE UK IS NO TR
Internet access 2Mbps-4Mbps
. 23.26
19.77
. . . 40.82
32.39
41.46
. 25.61
. 47.39
10.28
14.31
. 16.
7 27.28
. 26.32
28.03
24.86
13.16
21.46
17.31
29.53
12.37
. . . .
Internet access 4Mbps-8Mbps
. 77.
4 15.94
29.51
18.98
13.51
35.16
21.69
47.94
35.41
19.02
21.78
31.6
12.06
8.462
22.28
27.59
. 16.71
18.06
23.69
30.92
17.7
35.77
18.78
17.99
11.08
31.04
. . .
Internet access 8Mbps-12Mbps
. 22.51
19.77
19.73
15.41
17.76
52.3
47.71
43.88
. 36.21
29.54
39.52
19.26
8.462
46.11
17.55
40.08
18.18
16.32
18.71
18.19
18.37
27.42
15.37
15.92
11.39
. . . .
Internet access 12Mbps-30Mbps
22.83
14.95
22.53
18.64
20.09
24.48
31.42
21.69
38.73
25.28
29.33
26.36
46.33
14.6
10.38
27.77
17.88
23.43
18.99
23.22
23.78
30.92
11.3
19.08
15.37
24.32
17.64
18.11
. . .
Internet access 30+Mbps
42.23
17.22
28.06
29.24
20.19
27.6
37.17
36.25
64.2
25.28
. 36.61
78.99
19.26
11.32
46.04
23.77
69.46
21.34
23.73
25.52
34.66
12.07
30.78
23.09
27.3
11.85
29.43
. . .
Euro-super 95 + tax
1582
1318
1396
1677
1603
1311
1588
1583
1432
1538
1369
1560
1377
1351
. 133
6 140
8 146
6 173
8 139
3 130
7 158
0 127
8 149
0 148
8 164
3 167
2 158
3 . . .

EN 76 Error! No document variable supplied. EN
Item Name
BE BG CZ DK DE EE IE EL ES FR HR IT CY LV LT LU HU MT NL AT PL PT RO SI SK FI SE UK IS NO TR
Diesel + tax
1403
1334
1393
1482
1430
1320
1514
1361
1359
1351
1298
1489
1407
1309
. 121
7 143
6 137
8 142
2 135
7 130
5 138
8 132
3 138
0 139
1 152
4 164
6 165
6 . . .
Heating oil + tax
844 865
.6 924
.7 153
7 876
.7 996
.4 107
1 114
8 911
.7 927
.9 884
.1 111
0 103
9 924
.9 .
769.9
1436
1044
1002
947.4
903.8
1287
1224
1008
. 109
3 138
7 825
.9 . . .
LPG + tax
669.7
649.5
670.5
. 739
.4 737
.5 . .
766.6
873.4
674.3
629.9
. 579
.7 .
605.3
921.3
. 729
.2 .
593.1
749.3
661.9
773.8
723.6
. . . . . .
Euro-super 95 no tax
693.9
734.9
658.2
750.5
692.2
669.8
683.4
692.4
718.9
674 656
.4 714
.2 727
.2 683
.7 702
.6 700
.1 693
.2 758
.5 682
.6 654
.3 664
.8 699
.3 662
.6 665
.1 669
.9 706
.1 686 637 . . .
Diesel no tax
731.6
782.2
728.7
781.2
731.2
707.2
731.8
788.7
753.1
690.4
703.2
750.4
781.9
729.4
763.2
723 747
.7 770
.3 727
.5 710
.4 714
.1 760
.8 728
.3 694
.1 752
.8 770
.6 755
.3 697
.9 . . .
Heating oil no tax
679 695
.8 672
.6 829
.8 675
.4 719
.4 834
.6 701
666.1
719.2
662 760
.4 745
.3 729
.4 653
.5 677
.4 747
.7 727
.5 409
.3 680
.3 679
.5 743
.6 648
.8 656
.1 0
724.4
657.2
655.5
. . .
LPG no tax
553.5
447.3
470.8
. 529
.6 544
.7 . .
601.2
. 532
.2 515 .
344.3
378.4
517 619
.1 .
501.8
. 371
.3 544
464.7
556.3
504.8
. . . . . .

EN 77 Error! No document variable supplied. EN
Annex II - National rankings of markets
Annex 2 presents an analysis of the market performance of the 52 markets surveyed by
country. For each country, a graph displays the overall MPI scores for all markets combined,
for all goods and all services markets combined, as well as for each of the 52 individual goods
and services markets. The graph also displays the year-on-year changes in MPI scores from
2010 through to 2013. In addition, the difference between country scores and EU28 average
scores is included.115
Following the graph, the main findings are described, comprising:
The overall country MPI score (including differences with the EU28 average, and
previous years);
The combined scores for all goods markets and all services markets respectively
(including differences with the EU28 average, and previous years).
This is followed by a more detailed examination of the findings across the individual goods
and services markets, respectively; this comprises:
The top three and bottom three performing markets;
The markets showing the highest increase and the highest decrease since 2012 based
on a ranking of markets highlighting statistically significant changes from 2012;
The markets performing considerably better and significantly worse than the EU28
average based on a ranking of markets highlighting statistically significant differences
between country and EU28 results; and
The individual component scores having an important impact on the overall MPI
scores.
In addition, the potential causes of large year-on-year changes in the performance of
individual markets are highlighted.116
All differences mentioned in the text are statistically significant unless otherwise mentioned.
Asterisks are used to signal the statistically significant differences in tables and charts.117
It should be noted that scores can differ between countries, not only because of actual
differences in market performance, but also because of cultural differences, differences in
consumption patterns and different consumer environments (e.g. well-informed and
empowered consumers may be more critical and/or have higher expectations than consumers
elsewhere). Economic differences may also play a role, with GDP118
, price evolution and
consumer confidence in the state of the economy all having a statistically significant, albeit
115
It must be noted that comparing country results to EU28 results weighted for population size of each
country would give a biased image of the performance of markets especially for small countries.
Therefore the country results are compared to the EU28 results where all countries are given equal
weight. (Equal weights mean that the results of all countries are given an equal weight, regardless of
their population size. Population weights mean that each country counts towards the overall results
according to its relative size within the European Union – for instance, a country with 7 million
inhabitants will have a weight 7 times higher than a country with one million inhabitants.) 116
These explanations for market fluctuations were consulted with country representatives in the
Consumer Markets Expert Group. 117
Statistical significance is calculated at the 95% confidence level meaning that the null hypothesis of no
difference has been rejected at 5% probability level. It should also be mentioned that, especially for
indicators referring to the whole EU, given the high sample size on which they are computed, some
differences could be statistically significant from 0 even if their absolute magnitude is very small. 118
In 2013, a small (but statistically significant) correlation was found with the GDP.

EN 78 Error! No document variable supplied. EN
small to modest, influence on how markets are evaluated. Economic, social and business
statistics are regularly provided by Eurostat119
. The latest overview of consumer conditions in
EU Member States, plus Iceland and Norway, can be found in the July 2013 Consumer
Conditions Scoreboard120
.
119
http://epp.eurostat.ec.europa.eu 120
http://ec.europa.eu/consumers/consumer_research/editions/docs/9th_edition_scoreboard_en.pdf

EN 79 Error! No document variable supplied. EN
Belgium
69,970,771,071,471,572,072,572,673,673,673,673,973,974,674,975,675,775,876,476,776,877,077,778,478,978,979,179,780,881,582,783,4
73,278,178,278,479,379,580,580,680,880,880,980,981,082,182,382,682,983,483,883,984,384,4
77,9
-0.43.7*0.20.2
-3.2*2.5*-1.70.8-1.4-0.1
-0.5-0.1-0.53.4*7.4*6.7*0.5*-0.3
2*1.9-1
-0.10.5-0.8-0.4-0.60.30.6-1.20.6
00.51.51.20.10.31.1
-1.9*1.4*-0.70.7
1.6*0.7*2.5*0.5
1.3*0.50.8
1.4*1.3*-0.70.7
0.5*
1.21.50
2.5*3*2
-0.95.7*1.6
-2.3*
-0.22.7*0.8
-2.9*0.2-1.10.7*1.9
-0.11.3-0.3-0.50.7-0.42.1*1.10.31.11.20.1
0.6-1
-0.9-0.2-0.30.90.5
4.6*-1.31.10.8
-2.1*0.1
-2.1*0.70.2-0.10.1-0.40.40.6-0.1
0.5*
-3*-2.6*3.60.4
-0.4-0.7
1.5
-1.50.4
-0.3-5.1*-0.7
-0.9*-1.2
-2.9*0.6
2.4*0.41.10.3
2.1*1
0.1-0.80.7
2.6*-1.1-0.62.4*
00
0.70.70.70.5-0.1
10.5*-1.11.2
-1.8*2.4*
-1.4-0.50.5
-0.3*
-4.6*-3.31.60.7-3
-1.6-3.9-1.4-0.1-0.3-1.2
-4.7*-2.14*0.93.70.4-0.41.30.22.32.6-1
0.8-0.60.4-1.50.4-0.90.3-1.10.4
2.32.82.5-0.52.1-0.7
110
-0.40
0.81.3*4.7*0.71.31.31.12.81.9-0.11.9
0.3
Train services
Mobile telephone services
Investment products, private pensions and…
Real estate services
Legal and accountancy services
Internet provision
Tram, local bus, metro
TV-subscriptions
Maintenance services
Loans, credit and credit cards
On-line gambling services
Postal services
Fixed telephone services
Mortgages
Bank accounts
Electricity services
Gas services
All services markets
Vehicle maintenance and repair
Off-line gambling services
Private life insurance
Water supply
Vehicle rental services
Home insurance
Vehicle insurance
Cafés, bars and restaurants
Airline services
Packaged holidays & tours
Commercial sport services
Holiday accommodation
Personal care services
Culture and entertainment
Second hand cars
Meat and meat products
Clothing and footwear
ICT products
Fruit and vegetables
Furniture and furnishings
Maintenance products
New cars
Personal care products
Large household appliances
Electronic products
Non-prescription medicines
All goods markets
Fuel for vehicles
Small household appliances
Alcoholic drinks
Entertainment goods
Spectacles and lenses
Dairy products
Bread, cereals, rice and pasta
Books, magazines and newspapers
Non-alcoholic drinks
All markets
expectations problems&complaints trust comparability 2013 - 2012
2012 - 2011
2011 - 2010
Country-EU28
MPI per market
S
E
R
V
I
C
E
S
G
O
O
D
S
Overall Performance
The average performance of all consumer markets surveyed, as assessed by Belgian
consumers is broadly in line with the situation for the EU28 as a whole. Belgium’s goods
markets show a higher Market Performance Index than the EU28. No statistically significant
difference is observed in terms of MPI for services markets between the country and the
whole EU.
The country’s overall score has increased by 0.5 points compared to 2012, driven by
improvements in both the goods and services markets.

EN 80 Error! No document variable supplied. EN
Goods Markets
Overall, the top three goods markets in Belgium are the non-alcoholic drinks, books,
magazines and newspapers and bread, cereals, rice and pasta markets. The bottom three are
the second-hand cars, meat and meat products and clothing and footwear markets.
Across the individual goods markets, in market performance scores have increased the most
in the markets for fuel for vehicles and non-prescription medicines. The greatest decrease in
score is seen in the market for new cars.
Belgium’s goods markets are performing considerably better than the EU28 average. The
biggest difference in score is noted in the fuel for vehicles and meat and meat products
markets. The fuel for vehicles market, experiences statistically significant higher scores for
trust, expectations, and a lower proportion of problems. Moreover, this market scores more
highly for choice. The furniture and furnishing and for ICT products markets receive a lower
score than the EU28 average (although not significantly so). These markets score particularly
poorly on trust. For the furniture and furnishings market a lower score can be found for this
trust component.
Services Markets
Overall, the top three services markets in Belgium are the culture and entertainment, personal
care services and holiday accommodation markets. The bottom three are the train services,
mobile telephone services and investment products, private pensions and securities markets.
Across the individual services markets, electricity, gas and mobile telephone services show
the highest increase compared to 2012. The market for mobile telephone services shows an
increase in comparability, trust and choice. In the electricity and gas services markets, this
increase is driven by higher levels of comparability, trust, and expectations. A big drop in the
proportion of problems is also noted, but only in the gas services market is this decrease
statistically significant. Furthermore, these two markets also show an increase in scores for
choice. The improved performance in these markets following a decline from 2011 to 2012
could be linked to several measures taken by the Belgian government: amendment of the
energy law making it easier to switch provider; organisation of a joint campaign with local
communes to inform and assist consumers in using comparison tools for comparing energy
prices; and promotion of joint energy purchases in Wallonia and Brussels.
The markets with the greatest decrease in score are those for legal and accountancy services
(the only one with a statistically significant change); tram, local bus and metro services; and
maintenance services. For the legal and accountancy services; and tram and local bus services
markets, scores for comparability and expectations have fallen considerably, coupled with an
increase in the proportion of problems encountered. In the maintenance services market, an
important decrease in score is noted for the trust component. This market also shows a
decrease for the choice component.
In comparison with the EU28 average, the assessments of the markets for mortgages,
electricity services and water supply are the most positive. For the mortgages market this
difference in score is statistically significant, and the evaluation is more positive for all
components except complaints. In the electricity services market, consumers are more likely
to complain. Similarly, a comparatively high proportion of complaints can be found in the
water supply market; yet this market also shows an improvement in scores for expectations
and in the proportion of problems.
The markets for postal services, train services and tram and local bus services are assessed the
least positively in comparison to the EU28 average. For the postal services market, decreases

EN 81 Error! No document variable supplied. EN
in scores are noted for all components, while the proportions of problems and complaints
increased.
MPIComparability
(Avg)Trust (Avg)
Expectations
(Avg)
Problems
(%)
Complaints
(%)Choice (Avg)
46 Electricity services 7.4* 1.1* 1.2* 0.5* -2 2.1 0.7*
47 Gas services 6.7* 0.8* 0.9* 0.6* -5.2* 13.7* 0.9*
33 Mobile telephone services 3.7* 0.6* 0.7* 0.2 0.1 -7* 0.7*
26 Bank accounts 3.4* 0.4* 0.7* 0.3* -0.8 -11.3* 0.1
34 Internet provision 2.5* 0.4* 0.3* 0.3* -0.4 2.1 0.3
MPIComparability
(Avg)Trust (Avg)
Expectations
(Avg)
Problems
(%)
Complaints
(%)Choice (Avg)
57 Legal and accountancy services -3.2* -0.3 -0.1 -0.2 8.1* 1.4 0.1
15 New cars -1.9* -0.2 -0.2 -0.1 3.7 -10.2* 0.1
35 Tram, local bus, metro -1.7 -0.1 0.1 -0.2 6.4* 9.2*
21 Maintenance services -1.4 -0.1 -0.2 0.1 4.3 4.3 -0.1
22 Personal care services -1.2 -0.1 -0.2* -0.1 0 42.2* 0.2*
MPIComparability
(Avg)Trust (Avg)
Expectations
(Avg)
Problems
(%)
Complaints
(%)Choice (Avg)
17 Fuel for vehicles 4.7* 0.1 0.6* 0.7* -5.9* -12.2* 0.5*
51 Mortgages 4* 0.3* 0.5* 0.6* -4.3* -2.6 0.4*
46 Electricity services 3.7 0.6* 0.2* 0.6* -2.3 13.4* 1.7*
2 Meat and meat products 2.8 0 0.5* 0.4* -2.8* -9.7* 0.1
55 Dairy products 2.8 -0.1 0.5* 0.4* -2.7* -18.2* 0.1
MPIComparability
(Avg)Trust (Avg)
Expectations
(Avg)
Problems
(%)
Complaints
(%)Choice (Avg)
31 Postal services -4.7* -0.7* -0.4* -0.3* 5.1* 4.3* -0.7*
36 Train services -4.6* -0.3* -0.3* -0.5* 12.8* -17*
35 Tram, local bus, metro -3.9 -0.5* -0.1 -0.3* 9.7* 0.8
33 Mobile telephone services -3.3 -0.6* -0.4* -0.2* 2.6 -6.2* -0.3*
57 Legal and accountancy services -3 -0.5* 0 -0.1 6.2* 1.9 -0.1
5 Bottom markets
(compared to EU28 Average)
Difference with 2012
Improved most since 2012
Deteriorated most since 2012
Difference with EU28
5Top markets
(compared to EU28 Average)

EN 82 Error! No document variable supplied. EN
Bulgaria
48,9
58,659,961,963,263,465,365,967,769,870,370,470,470,670,871,672,072,472,772,873,273,573,974,074,1
76,776,778,079,480,080,782,7
62,864,766,066,667,168,9
72,173,373,474,574,775,275,976,176,276,376,377,177,377,878,5
82,0
71,7
-6.9*0.8
-3.3*0.3-2.11.40.4-0.4-0.7-1.6
1.50.3
2.5*0.62.1-1.6-0.50.5-0.81.20.83*1
0.83.4*0.5-0.12.8*0.9
2.4*
-1.7-1.52.8*0.2-1
-0.5-1.80.60
0.81.1
2.4*1.20.50.10.81.31.42
3.4*1.50.5
0.4
2.31.20.10.94.21.2-0.72.2
3.7*2.1
0.51.6*1.70.8-0.53.3*4.3*1.3
7.6*0.81
3.6*0
2.3*1.70.92
-2.1*-0.2
0
1.61.50.4-0.30.5
3.3*1.7
1.8*-0.22.1
3.7*3.1*3.1*2.6*2.2*2.9*1.91
3.1*0.50.32*
1.7*
-6*
-3.2*-0.9-1
-14*-0.50.1
0.7-3.2*-3.4*
-5.4*-4.8*-4.3*-3.5*
-2.3*-0.2
-5.8*0
-1.7-2.6*-0.5-3.3
1-0.6
-3.7*
1.7-2.5
-8.7*1.8
-4.2*2
-1.8*-1.5-1.9
-3.3*-4.6*-0.9-1.3
-4.2*3.7*-3.3*0.2-4*-1.8
-4*
-2.6*
-23.1*-12*
-14.6*-8.7*-6.2*
-10.7*-9.1*-9.2*-6.2*-4.7*-4.5*-6.1*-3.3
-5.5*-5.5*-2.8-3.2
-5.2*-1
-1.2-0.8
-5.1*-4.7*-2.1
-5.1*-4.5*-2.8
-3.7*0.8-3
0.1-1.1
-8.2*-10.5*-11.5*-9.1*
-13.8*-8.4*-7.4*-6.4*-5.6*-6.9*-4.8*-6.8*-5.8*-4.1*-6.3*-5.3*-4.4*-4.2*-3.6-2.3
-3.8*-2.4
-5.9*
Electricity services
Mortgages
Water supply
Real estate services
Investment products, private pensions and…
Mobile telephone services
Train services
Vehicle maintenance and repair
Loans, credit and credit cards
Legal and accountancy services
On-line gambling services
Off-line gambling services
Maintenance services
All services markets
Tram, local bus, metro
Private life insurance
Gas services
Home insurance
Internet provision
Bank accounts
TV-subscriptions
Cafés, bars and restaurants
Vehicle rental services
Fixed telephone services
Packaged holidays & tours
Holiday accommodation
Vehicle insurance
Commercial sport services
Postal services
Culture and entertainment
Airline services
Personal care services
Second hand cars
Meat and meat products
Fuel for vehicles
Clothing and footwear
Dairy products
Fruit and vegetables
Maintenance products
All goods markets
ICT products
Alcoholic drinks
New cars
Bread, cereals, rice and pasta
Small household appliances
Furniture and furnishings
Non-alcoholic drinks
Entertainment goods
Personal care products
Large household appliances
Electronic products
Non-prescription medicines
Spectacles and lenses
Books, magazines and newspapers
All markets
expectations problems&complaints trust comparability 2013 - 2012
2012 - 2011
2011 - 2010
Country-EU28
MPI per market
S
E
R
V
I
C
E
S
G
O
O
D
S
Overall Performance
Bulgaria is one of the worst performing countries in terms of MPI, with an overall Market
Performance Index of 71.7. In general, its performance in the goods markets is slightly better
than in the services markets; however, Bulgaria’s market performance is poorer in both
markets compared to the EU28 average.
Compared to 2012, the country’s overall score has increased slightly (+0.4 percentage points),
although this change is not statistically significant. The goods markets show a somewhat
larger increase compared to the services markets, although neither are statistically significant.

EN 83 Error! No document variable supplied. EN
Goods Markets
Overall, the top three goods markets in Bulgaria are the books, magazines and newspapers,
spectacles and lenses and non-prescription medicines markets. The bottom three are the
second-hand cars, meat and meat products, and fuel for vehicles markets.
The following Bulgarian markets are all ranked in the 26th
position across the EU28: non-
alcoholic drinks; books, magazines and newspapers; furniture and furnishings; alcoholic
drinks; electronic products; personal care products; clothing and footwear; fruit and
vegetables; and ICT products.
The following markets are all ranked in 27th
position across the EU28: spectacles and lenses;
new cars; small household appliances; entertainment goods; large household appliances;
maintenance products; dairy products; second-hand cars; bread, cereals, rice and pasta; meat
and meat products; and fuel for vehicles.
Across the individual goods markets, compared to 2012 the largest increases in market
performance scores are noted in the non-prescription medicines; fuel for vehicles; and bread,
rice and cereals markets. Higher expectations are reported for the first two markets. And, in
the fuel for vehicles market, trust and choice have also increased, while complaints have
decreased compared to 2012. The markets with the largest decrease in year-on-year scores are
the maintenance products and second-hand cars markets: however, neither of these changes is
statistically significant.
Overall, Bulgaria’s goods markets perform significantly worse than the EU28 average, with
the exception of three: non-prescription medicines; books, magazines and newspapers; and
electronic products. The dairy products and fuel for vehicles markets were evaluated least
positively in comparison to the EU28 average. In the dairy products market, this relatively
poor performance is driven by lower scores for comparability, trust and expectations. In the
fuel for vehicles market, the lower MPI score is driven by lower scores for both the trust and
expectations components, as well as a higher proportion of problems.
Services Markets
Overall, the top three services markets in Bulgaria are the personal care services, airline
services and culture and entertainment markets. The bottom three are the electricity services,
mortgages and water supply markets
The following Bulgarian markets all ranked 26th
across the EU28: culture and entertainment;
cafés, bars and restaurants; home insurance; legal and accountancy services; offline gambling
and lottery services; mobile telephone services; and vehicle rental services. The following
markets all ranked 27th
across the EU28: holiday accommodation; water supply; vehicle
maintenance and repair; electricity services; packaged holidays & tours; commercial sport
services; real estate.
Across the individual services markets, the markets for vehicle insurance; fixed telephone
services; culture and entertainment services; personal care services; and tram, metro and local
bus services show the highest increases compared to 2012 results. The vehicle insurance
market score is a lot higher for trust and the proportion of problems encountered has greatly
decreased. For the fixed telephone services market a much higher score can be found for
comparability, trust and expectations. This market also shows an increase for the choice
component. The market for culture and entertainment shows an important decrease in the
proportion of problems. Surprisingly, there is also an increase in the proportion of complaints.
The services markets with the largest decrease in score compared to 2012 are those for
electricity services and water supply. For the former, this is due to a drop in the comparability

EN 84 Error! No document variable supplied. EN
and trust components; an increase in the proportion of problems; and, whilst not significant,
an important decrease in the expectations component.
The deterioration in performance of the electricity services market could be put down to some
issues faced by Bulgarian electricity consumers since the start of 2012. Price increases,
incorrect and unclear electricity price calculations, and a lack of choice of supplier have been
reported in this sector. This potentially had an impact on market performance.
Compared to EU28, all but two services markets are assessed less positively in Bulgaria.
Assessments of the postal services and airline services markets are more positive in Bulgaria
than the EU28 as a whole; however, these differences are not statistically significant. The
evaluation of the postal services market is more positive for the comparability and choice
components.
The electricity services, water supply and mortgages markets are assessed least positively
compared to the EU28 average. Other differences in market performance can be found in the
majority of services markets.
MPIComparability
(Avg)Trust (Avg)
Expectations
(Avg)
Problems
(%)
Complaints
(%)Choice (Avg)
30 Vehicle insurance 3.4* 0.3 0.5* 0.3 -4* -2.2 0.2
48 Non-prescription medicines 3.4* 0.2 0.3 0.6* -4* -2.6 0.3
32 Fixed telephone services 3* 0.3* 0.4* 0.6* 2.5 1.5 0.6*
43 Culture and entertainment 2.8* 0.3 0.3* 0.4* -2.3 9* 0.5*
17 Fuel for vehicles 2.8 -0.1 0.5* 0.5* -0.6 -9.8* 0.5*
MPIComparability
(Avg)Trust (Avg)
Expectations
(Avg)
Problems
(%)
Complaints
(%)Choice (Avg)
46 Electricity services -6.9* -0.7* -0.9* -0.4 11.1* -9* 0
45 Water supply -3.3* -0.8* -0.2 -0.1 3.2 -7.5*
28Investment products, private
pensions and securities-2.1 -0.5* -0.3 -0.1 -0.1 -3.2 0.1
8 Maintenance products -1.8 -0.2 -0.3* -0.1 2 -4.9 0.3
16 Second hand cars -1.7 0 -0.5* 0.1 3.6 1.8 0.1
MPIComparability
(Avg)Trust (Avg)
Expectations
(Avg)
Problems
(%)
Complaints
(%)Choice (Avg)
31 Postal services 0.8 0.5* -0.1 0.1 1.6 0.9 0.3*
37 Airline services 0.1 -0.1 0 0.1 -0.2 5.9* -0.1
54 TV-subscriptions -0.8 0.5* -0.5* 0 4.3* -5.2* -0.5*
34 Internet provision -1 0.4* -0.2 -0.1 7.3* 2.1 -0.2
22 Personal care services -1.1 0.1 -0.4* -0.1 1.5 -4.7* 0
MPIComparability
(Avg)Trust (Avg)
Expectations
(Avg)
Problems
(%)
Complaints
(%)Choice (Avg)
46 Electricity services -23.1* -1.6* -3.2* -2.6* 25.8* -1.7 -4.5*
45 Water supply -14.6* -0.7* -2.2* -1.7* 17.2* 3.3
55 Dairy products -13.8* -0.8* -2.2* -1.8* 12.1* -3.1 -0.4*
51 Mortgages -12* -0.9* -1.8* -1.3* 13* -9.6* 0
17 Fuel for vehicles -11.5* -0.2 -1.7* -1.7* 16.2* 1.9 0.1
5 Bottom markets
(compared to EU28 Average)
Difference with 2012
Improved most since 2012
Deteriorated most since 2012
Difference with EU28
5Top markets
(compared to EU28 Average)

EN 85 Error! No document variable supplied. EN
Czech Republic
65,5
70,170,971,071,371,571,972,072,973,773,773,974,174,575,075,275,375,675,976,176,877,478,878,879,980,180,580,882,183,785,185,9
64,970,672,072,573,7
77,177,278,478,778,979,179,680,180,881,181,182,082,282,382,484,486,1
76,9
0.71.81
0.2-0.31.51.40.53*
3.1*
0.50.1
0.9-0.8
01.8
1.6*4.5*3.9*1.61.20.9
5.6*2.7*-0.13.8*2.3*1.11.4
2.6*
1.61.5-1.61.3
3.3*1
0.11*
-0.61
-1.3-0.63.5*2.9*1.30
-0.82.50.81.71.81.5
1.4*
0.5-0.7-1.6-1.8
-4.2*-1.4
-4.3*-4.2*-1.3
-3.7*
0.11.8
0.2-2
-3.7*-1.8
-1.8*-3.3*-4.3*-2.3*-1.6-0.8
0-4.6*-1.2-0.1-0.4-3*
-2.1*-2.3*
-2.4*-1.9
-3.6*-5.6*-3*
-3.4*-2.8*-2.1*
-1-2.8*
-1-0.8
-2.5*-2.3*-1.4-1.70.9
-2.6*-0.6
-2.2*-2.1*
-1
-1.9*
-3.2*
-3-2.3-0.8
-3.9*-1.8-3*
-2.5*
-3.9*-3*-0.1
-3.3*-3.3*
-3.8*-2.7*-0.6
-2.9*-2.1-0.3-1.40.9
-2.8*0.4-0.3
-2.4*
-4.6*-2.3*-4*-1.4-4*-0.5
-1.3*-2.2*1.8
-3.9*0.5-1.2-1.8
-2.7*0.6
-3.3*1.5*1.20.4
-2.7*
-2.5*
-5.1*-0.51.4-2.7
-4.8*-2.4-2.1-3.3
1-0.8-2.8-0.10.1-0.31.4-3.4-3.31.2-0.21.61.7-0.2-0.5-0.75.5*3.7*-0.72.21.52
2.12.1
-6.1*-5.1*-5.2*-2.8-3.8-2.5
-3.8*-1.3*-2.7-0.6-2.9-0.7
01.80.30.2-0.40.61.10.82.11.7
-0.7*
Real estate services
Mortgages
Investment products, private pensions and…
Maintenance services
Fixed telephone services
Loans, credit and credit cards
Mobile telephone services
Gas services
Electricity services
Private life insurance
Off-line gambling services
Bank accounts
TV-subscriptions
On-line gambling services
Internet provision
Postal services
Cafés, bars and restaurants
Water supply
All services markets
Legal and accountancy services
Vehicle maintenance and repair
Home insurance
Packaged holidays & tours
Vehicle insurance
Train services
Tram, local bus, metro
Holiday accommodation
Vehicle rental services
Airline services
Commercial sport services
Culture and entertainment
Personal care services
Second hand cars
Clothing and footwear
Fruit and vegetables
Meat and meat products
Fuel for vehicles
New cars
Dairy products
All goods markets
Alcoholic drinks
Maintenance products
Bread, cereals, rice and pasta
Furniture and furnishings
Non-prescription medicines
ICT products
Personal care products
Electronic products
Non-alcoholic drinks
Entertainment goods
Large household appliances
Small household appliances
Spectacles and lenses
Books, magazines and newspapers
All markets
expectations problems&complaints trust comparability 2013 - 2012
2012 - 2011
2011 - 2010
Country-EU28
MPI per market
S
E
R
V
I
C
E
S
G
O
O
D
S
Overall Performance
On average, Czech consumers are less positive in their assessment of their markets
performance than those of the whole EU28. The goods markets show a lower Market
Performance Index with respect to the EU28 average. The MPI for the services markets is
broadly in line with that observed for the EU as a whole.
Compared to 2012, the overall score has increased by 1.4 points. Both the services and goods
markets show a yearly increase.

EN 86 Error! No document variable supplied. EN
Goods Markets
Overall, the top three goods markets in the Czech Republic are the books, magazines and
newspapers, spectacles and lenses and small household appliances markets. The bottom three
are the second-hand cars, clothing and footwear and fruit and vegetables markets.
Across the individual goods markets, the largest increase in market performance scores can be
found in the non-prescription medicines; fuel for vehicles; and ICT products markets. The
markets with the largest decrease in scores are those for fruit and vegetables and bread,
cereals, rice and pasta, although these changes are not statistically significant.
The Czech goods markets are performing more poorly than the EU28, especially the second-
hand cars and fruit and vegetables markets: both MPI scores for these markets are lower than
the EU28. This poor performance is driven by the scores for trust and expectations, and higher
proportions of problems and complaints. The second-hand cars market also shows a slightly
lower score for comparability (but not significantly so). Other goods markets that perform
worse than the EU28 are clothing and footwear and dairy products.
A number of Czech goods markets do perform better than the EU28. Whilst not significantly
so, the spectacles and lenses and ICT products markets have the highest differences in MPI
scores when compared to the EU28 average. In the spectacles and lenses market, the higher
MPI scores are driven by higher scores for comparability, and lower proportions of problems
and complaints. The trust component for this market is also higher than the EU28 average
(but it is not statistically significant). In the ICT products market, higher scores are noted for
the comparability and expectations components.
Services Markets
Overall, the top three services markets in the Czech Republic are the personal care services,
culture and entertainment and commercial sport services markets. The bottom three are the
real estate services, mortgages and investment products, private pensions and securities
markets.
Across the individual services markets, the scores for ten markets increased statistically
significantly from 2012. The train services market shows the largest increase compared to
2012, driven by higher comparability, trust and expectations ratings combined with a decrease
in the proportion of problems. A possible explanation for the more positive assessments of the
train services market in the Czech Republic could be that a second provider has entered the
market. As a consequence, prices have fallen and service quality is perceived to have risen.
Furthermore, the market for legal and accountancy services shows an increase in trust and
expectations and an important decrease in the proportion of problems.
Across the individual services markets, lower scores are found in the postal services, fixed
telephone services and holiday accommodation markets; however, these decreases are not
statistically significant. These are the only markets that show a decrease in MPI score
compared to 2012. For the postal and fixed telephone services markets, an increase was noted
in the proportion of problems. For the postal services market, there is a marked change in
comparability. The holiday accommodation market also shows an important decrease for the
comparability component.
Compared to the EU28, assessments of the train services, tram, local bus and metro and
vehicle rental services markets are the most positive. For the train services market, the
evaluation is more positive for all components except for complaints; whilst the proportion of
complaints decreased, this change is not statistically significant. The tram, local bus and
metro market performance improved in terms of comparability, expectations and amount of

EN 87 Error! No document variable supplied. EN
problems encountered. For the vehicle rental services market, more positive evaluations are
noted for comparability, as well as a lower proportion of problems. The proportion of
complaints, on the contrary, is much higher than the EU28 average.
The real estate services, fixed telephone services and postal services markets are assessed
least positively in comparison to the EU28 average. The first two of those are noted as being
lower than average. In the real estate services market, lower evaluations are noted for all
components. The lower MPI score for the fixed telephone services market is driven by a
higher proportion of problems and lower scores for trust and expectations. The choice
component also appears to be lower compared to EU28. As for postal services, it seems the
biggest difference is related to the proportion of problems, which is higher in the Czech
Republic.
MPIComparability
(Avg)Trust (Avg)
Expectations
(Avg)
Problems
(%)
Complaints
(%)Choice (Avg)
36 Train services 5.6* 0.7* 0.6* 0.6* -5* -7.9*
57 Legal and accountancy services 4.5* 0.4* 0.5* 0.6* -2.9 -2.7 0.3*
23 Vehicle maintenance and repair 3.9* 0.5* 0.4* 0.5* -2.3 -9.6* 0
38 Vehicle rental services 3.8* 0.4* 0.4* 0.6* -1.1 20.6* 0.2
48 Non-prescription medicines 3.5* 0.4* 0.4* 0.5* -1.2 2.1 0.5*
MPIComparability
(Avg)Trust (Avg)
Expectations
(Avg)
Problems
(%)
Complaints
(%)Choice (Avg)
1 Fruit and vegetables -1.6 0.2 -0.1 -0.1 8.4* -2.1 -0.2
3 Bread, cereals, rice and pasta -1.3 0 -0.2 -0.2 2 14.1* -0.1
5 Non-alcoholic drinks -0.8 0.1 -0.1 -0.3* 0.5 25* 0
31 Postal services -0.8 0.4* -0.2 0 7.7* -4.6* 0.3
9 Furniture and furnishings -0.6 0 -0.2 -0.1 0.2 0.6 0
MPIComparability
(Avg)Trust (Avg)
Expectations
(Avg)
Problems
(%)
Complaints
(%)Choice (Avg)
36 Train services 5.5* 0.7* 0.5* 0.4* -8.3* -0.8
35 Tram, local bus, metro 3.7* 0.5* 0.2 0.4* -4.9* 7.3*
38 Vehicle rental services 2.2 0.5* -0.2 0.4* -3.3* 25.2* -0.1
43 Culture and entertainment 2.1 0.4* 0.1 0.3* -0.8 -6.6* 0.6*
53 Spectacles and lenses 2.1 0.3* 0.2 0.2 -2.5* -9.3* 0.2*
MPIComparability
(Avg)Trust (Avg)
Expectations
(Avg)
Problems
(%)
Complaints
(%)Choice (Avg)
16 Second hand cars -6.1* -0.2 -1.4* -0.4* 4.9* 9.5* 0.3*
1 Fruit and vegetables -5.2* 0 -0.6* -0.4* 14.3* 12.1* -0.6*
20 Real estate services -5.1* -0.2* -1* -0.3* 7.4* 8.8* 0.3*
7 Clothing and footwear -5.1* -0.2 -0.4* -0.3* 13.4* 15.4* -0.6*
32 Fixed telephone services -4.8* 0 -0.7* -0.6* 8* 6.8* -1.3*
5 Bottom markets
(compared to EU28 Average)
Difference with 2012
Improved most since 2012
Deteriorated most since 2012
Difference with EU28
5Top markets
(compared to EU28 Average)

EN 88 Error! No document variable supplied. EN
Denmark
67,968,668,970,772,973,173,574,074,574,574,975,275,375,375,475,675,676,176,276,877,077,077,378,278,278,779,881,181,681,7
84,185,4
70,771,1
75,475,977,378,778,779,579,980,080,981,181,181,581,982,883,083,183,383,683,885,4
77,6
0-0.41.61.41.8-0.60.8-0.50.1-1.50.5-0.41.10.91.6
-0.40.6*0.4-1.30.6
2.7*0.50.1
3.6*0.40.20.20.41
0.2
-2.8*2.4*0.7-1
2.5*-0.90.41.20.3-0.2-0.8-0.70.11.20.31.4-0.70.7-0.6-0.51.53*
0.5*
4.4*0.9
4.6*0.1-0.42.2*1.1
3.5*-0.73*
-0.6-2.8*0.8
-3.3*-0.1
1.50.31.6-0.1-0.3
-2.8*-0.7-1.4
-1.8-0.4-1
1.1-0.8-0.1
0
-10.4
-2.9*-2.4*1.30.30.60.7-0.3-0.6-0.41.20.70.70.51.3
-2.5*-1.3-0.4
-1.5*1.1-1.6
0
0.51.5
2.62.4*0.40.5-0.7
-1.5-2
1.9*
-0.40.6
-0.1-0.4*-1.4
0.7
0.61.7
-3.1*3.2*2.6*
-10.61.50.5
5.1*-1.7
13.8*-0.34.2*1.60.1
1.9*2.7*2*0
1.61
0.70.6
1.6*1.6*
3*0.5
0.6*
-6.2*-5.1*-5.1*1.2-1.1-2.92.90.30.5-0.6-3.6-3.30.8-1.13.40.8
-3.9*-0.1-1.46.2*1.72.6-1.33.7*1.7
4.2*0.60.50.5-2
2.42.4
-4.5*0.2-0.3-1.3-1.7-2.1-2.2-0.10.2-0.2-1.10.9-1.2
20.31.5-1.30.61.92.62.38*
0
Mobile telephone services
Internet provision
TV-subscriptions
Investment products, private pensions and…
Bank accounts
Fixed telephone services
Real estate services
Maintenance services
Loans, credit and credit cards
Vehicle maintenance and repair
Postal services
Cafés, bars and restaurants
Private life insurance
Tram, local bus, metro
Electricity services
On-line gambling services
Vehicle insurance
All services markets
Home insurance
Mortgages
Gas services
Legal and accountancy services
Vehicle rental services
Water supply
Off-line gambling services
Train services
Packaged holidays & tours
Airline services
Holiday accommodation
Personal care services
Commercial sport services
Culture and entertainment
Meat and meat products
Second hand cars
Clothing and footwear
Fruit and vegetables
ICT products
Personal care products
Electronic products
New cars
All goods markets
Non-prescription medicines
Bread, cereals, rice and pasta
Furniture and furnishings
Spectacles and lenses
Maintenance products
Small household appliances
Large household appliances
Books, magazines and newspapers
Non-alcoholic drinks
Alcoholic drinks
Dairy products
Entertainment goods
Fuel for vehicles
All markets
expectations problems&complaints trust comparability 2013 - 2012
2012 - 2011
2011 - 2010
Country-EU28
MPI per market
S
E
R
V
I
C
E
S
G
O
O
D
S
Overall Performance
Danish consumers’ assessments of market performance overall are in line with the EU28
average. The country’s MPI score has increased by 0.5 points compared to 2012. While both
the services and goods markets have shown improvement, this was only statistically
significant in the case of the services markets.
Goods Markets
Overall, the top three goods markets in Denmark are the fuel for vehicles, entertainment
goods and dairy products markets. The bottom three goods markets are meat and meat
products, second-hand cars and clothing and footwear. The Danish fuel for vehicles market is
rated as the best performing across the EU28.

EN 89 Error! No document variable supplied. EN
On an individual level, only the fuel for vehicles market’s score was significantly higher than
the EU28. Its MPI score is driven by increases in comparability, trust and expectations, and a
lower proportion of problems.
In addition, two markets have significantly lower scores in Denmark than the EU28 average:
meat and meat products; and electronic products. The meat and meat products market shows
higher levels of problems and lower levels of trust. The electronic products market is below
the EU28 average, with lower scores for trust.
Compared to 2012, neither the goods markets nor the services markets show much change.
The most noteworthy changes in the goods markets are an increase in positive assessments of
the fuel for vehicles; ICT products; and second-hand car markets. The meat and meat products
market’s score decreased from last year.
Services Markets
Overall, the top three services markets in Denmark are the culture and entertainment,
commercial sport services and personal care services markets. The bottom three are the
mobile telephone services, internet provision and TV-subscriptions markets. The commercial
sport services and culture and entertainment markets are both assessed as the third best
performing across the EU28.
Across the individual services markets, mortgages, train services and water supply are
assessed more positively than the EU average. The high score for the mortgages market is
driven by lower proportions of problems and a higher score for trust. The water supply market
scores highly on trust and expectations, and has a lower proportion of complaints.
The Mobile telephone service, internet provision and TV-subscriptions are the poorest
performing services markets in comparison with the EU28. All these communication services
have lower scores than the EU28 average. The comparatively low score overall for the TV-
subscriptions market is driven by poor comparability.
Across the services markets, the scores for train services and legal and accountancy services
increased. They decreased for vehicle maintenance, mortgages and fixed telephone services,
although these changes are not statistically significant.
MPIComparability
(Avg)Trust (Avg)
Expectations
(Avg)
Problems
(%)
Complaints
(%)Choice (Avg)
36 Train services 3.6* 0.4* 0.3* 0.4* -5.6* 5.2
17 Fuel for vehicles 3* 0.4* 0.2 0.5* -0.6 -23.9* 0.1
57 Legal and accountancy services 2.7* 0.2 0.4* 0.1 -4.8* -3.3 0
13 ICT products 2.5* 0.3* 0.1 0.2 -5.5* 7* 0.3*
16 Second hand cars 2.4* 0.2 0.4* 0.2 -2.5 0 0.2
MPIComparability
(Avg)Trust (Avg)
Expectations
(Avg)
Problems
(%)
Complaints
(%)Choice (Avg)
2 Meat and meat products -2.8* -0.3* -0.8* -0.3* -2.4 -14.3* -0.2
23 Vehicle maintenance and repair -1.5 -0.2 -0.2 -0.1 1.2 5.4* 0
51 Mortgages -1.3 -0.2 -0.3 -0.1 -0.2 -5.4* -0.2
1 Fruit and vegetables -1 -0.1 -0.5* -0.1 -2.7 -9.8* -0.3*
19 Personal care products -0.9 -0.1 0 -0.1 1.2 24.1* -0.1
Difference with 2012
Improved most since 2012
Deteriorated most since 2012

EN 90 Error! No document variable supplied. EN
MPIComparability
(Avg)Trust (Avg)
Expectations
(Avg)
Problems
(%)
Complaints
(%)Choice (Avg)
17 Fuel for vehicles 8* 0.5* 0.8* 1.5* -5.5* 8* 0.7*
51 Mortgages 6.2* 0 1.3* 0.8* -6.1* 3.9 0.2
36 Train services 4.2* 0 0.8* 0.9* -1 6.4*
45 Water supply 3.7* -1.1* 1.1* 1.1* -4.8* -7.1*
46 Electricity services 3.4 -1.1* 0.8* 1* -8.4* 4.2* 0.6*
MPIComparability
(Avg)Trust (Avg)
Expectations
(Avg)
Problems
(%)
Complaints
(%)Choice (Avg)
33 Mobile telephone services -6.2* -1.3* -0.4* 0.2 12.2* 3.9* 0.9*
54 TV-subscriptions -5.1* -1.7* -0.3* 0 0.7 2.1 -0.1
34 Internet provision -5.1* -1.2* -0.4* 0.1 6.5* -5.2* 0.4*
2 Meat and meat products -4.5* -0.5* -0.9* 0 6.1* -0.7 0.1
30 Vehicle insurance -3.9* -1.8* -0.2* 0.4* -1.5 16.8* 0
5 Bottom markets
(compared to EU28 Average)
Difference with EU28
5Top markets
(compared to EU28 Average)

EN 91 Error! No document variable supplied. EN
Germany
77,277,477,878,178,178,278,578,578,678,779,080,080,080,080,380,380,480,581,181,181,281,381,481,481,581,781,882,082,983,283,283,7
79,279,281,381,581,781,781,981,982,582,883,083,083,283,383,683,884,184,684,885,086,386,6
81,4
2.8*-1.6-3*-1.6-1.4-0.34.3*-1.51.8*-0.7-1.7-0.1-1.11.10
0.10.4-0.5
1-0.2-0.92.2*-1.31.7*-0.70.60.7
-1.6*-0.20.4
0.31.1
-2.8*-0.5-2*-1.20.2
-2.5*1.1
-2.5*-0.2-0.6
-1.5*-1
-0.90.2-0.11.5*0.60.7
3.2*1.4*
-0.1
4.6*2.7*3.4*4.7*1.8*3.3*4.3*3.7*1.3
4.3*2.1*2.4*3.5*-0.12.7*
2.5*2.8*1.5
1.9*2.1*2.5*3.1*3.1*-0.41.31.4
5.1*3.4*2.3*
1
1.41
3.4*3.5*3.2*3.2*2.1*4.2*0.6
4.3*2.5*4.2*3.5*1.9*3.2*0.6
2.3*3.1*2.9*0.61.2
1.8*
2.6*
2.14.3*-0.24.6*2.9*4.6*6.9*6.8*
8.7*2.3*1.7
2.9*
3.5*2.9*
4.2*1.3
3.6*2.2*2*
3.2*3.5*3.8*
1.13.8*-0.5
4*0.73*3*
3.3*2.5*3.1*3.2*3*0.13*
4.7*-2.4*
1.22.8*2*
4.7*2.1*
7.3*2.5*
3*
2.72.1-0.8
20.6
7.5*9*
4.5*4.2*5*2.6
4.9*6.1*9.4*4.1*3.8*5.9*6.5*1.6
6.3*7.5*0.12.2
9.4*2.93.11.1
7.6*8.9*-0.61.50.7
8.3*1.80.42.51.51.52.40.43
1.23.2*7.7*-1.2
12.42.4
3.3*7.4*2.8
4.1*10.6*4.2*
3.8*
Train services
Gas services
Postal services
Fixed telephone services
Home insurance
Real estate services
Investment products, private pensions and…
Mobile telephone services
Private life insurance
Internet provision
Tram, local bus, metro
Vehicle maintenance and repair
Loans, credit and credit cards
Mortgages
All services markets
Off-line gambling services
Legal and accountancy services
Bank accounts
Vehicle insurance
On-line gambling services
Maintenance services
Holiday accommodation
Packaged holidays & tours
Electricity services
Cafés, bars and restaurants
Vehicle rental services
Airline services
Water supply
TV-subscriptions
Personal care services
Commercial sport services
Culture and entertainment
Second hand cars
Fuel for vehicles
Electronic products
ICT products
Furniture and furnishings
Non-prescription medicines
Maintenance products
Entertainment goods
New cars
Small household appliances
All goods markets
Meat and meat products
Books, magazines and newspapers
Spectacles and lenses
Large household appliances
Alcoholic drinks
Personal care products
Fruit and vegetables
Bread, cereals, rice and pasta
Dairy products
Clothing and footwear
Non-alcoholic drinks
All markets
expectations problems&complaints trust comparability 2013 - 2012
2012 - 2011
2011 - 2010
Country-EU28
MPI per market
S
E
R
V
I
C
E
S
G
O
O
D
S
Overall Performance
In Germany, consumer assessments of market performance are above those observed in the
EU28 as a whole; equally, both the goods markets and the services markets outperform the
EU28 average. Taking into account the scores for 2012 in the services and goods markets, no
statistically significant differences were found.
Goods Markets
Overall, the top three goods markets in Germany are the non-alcoholic drinks, clothing and
footwear, and dairy products markets. The bottom three are the second-hand cars, fuel for
vehicles and electronic products markets.

EN 92 Error! No document variable supplied. EN
Germany’s large household appliances, personal care products, non-alcoholic drinks, clothing
and footwear markets are all rated as the second best performing across the EU28. The meat
and meat products and fruit and vegetables markets are both rated as the third best.
Across the individual goods markets, a total of seven markets outperform the EU28 average.
The top performers are clothing and footwear and the market for second-hand cars – both
outperforming the EU28 average on all components. Books, magazines and newspapers is the
only goods markets with a worse performance than average; however, the difference is not
statistically significant.
Compared to 2012, across the goods markets, the clothing and footwear; non-alcoholic drinks;
and fruit and vegetables markets show improved performance. For the clothing and footwear
market, this was driven by a statistically significant increase in comparability, trust,
expectations and choice. The electronic products; small household appliances; entertainment
goods; furniture and furnishing; and books, magazines and newspapers markets show a
decline from last year.
Services Markets
Overall, the top three services markets in Germany are the culture and entertainment,
commercial sport services and personal care services markets. The bottom three are the train
services, gas services and postal services markets.
Germany’s water supply and electricity services markets are all rated as the best performing
across the EU28. The TV-subscriptions, online gambling and betting services and
maintenance services markets are all assessed as the second best performing across the EU28,
while the investment products, private pensions and securities market is assessed as the third
best across the EU28.
Across the individual markets, a total of sixteen German services markets have a higher score
than the average. Indeed, electricity services, mortgages and investment products score 9 or
more points higher than the EU28 average. Only postal services and personal care services
score lower than the EU28 average, and then not significantly so.
Compared to 2012, the investment products; train services; electricity services; private life
insurance; and vehicle rental services markets all improved. The postal services market and
the personal care services market both declined from last year.
MPIComparability
(Avg)Trust (Avg)
Expectations
(Avg)
Problems
(%)
Complaints
(%)Choice (Avg)
28Investment products, private
pensions and securities4.3* 0.5* 0.6* 0.3* -3.3* -23.5* -0.5*
7 Clothing and footwear 3.2* 0.4* 0.7* 0.3* 1.7 5.1 0.3*
36 Train services 2.8* 0.3* 0.4* 0.1 -4.6* 15.4*
46 Electricity services 2.2* 0.2 0.5* 0.1 -0.8 -29.7* 0.2
52 Private life insurance 1.8* 0.3* 0.2 0.2 -1.2 -15.3* -0.5*
MPIComparability
(Avg)Trust (Avg)
Expectations
(Avg)
Problems
(%)
Complaints
(%)Choice (Avg)
31 Postal services -3* -0.4* -0.3* -0.4* 2.2 -10.7* -0.5*
10 Electronic products -2.8* -0.3* -0.4* -0.3* 1.4 -24.1* -0.3*
14 Entertainment goods -2.5* -0.4* -0.3* -0.3* 0.4 -12.6* -0.4*
12 Small household appliances -2.5* -0.5* -0.4* -0.3* -2.3 -5.8* -0.5*
9 Furniture and furnishings -2* -0.4* -0.2* -0.3* -1.5 -22.2* -0.4*
Difference with 2012
Improved most since 2012
Deteriorated most since 2012
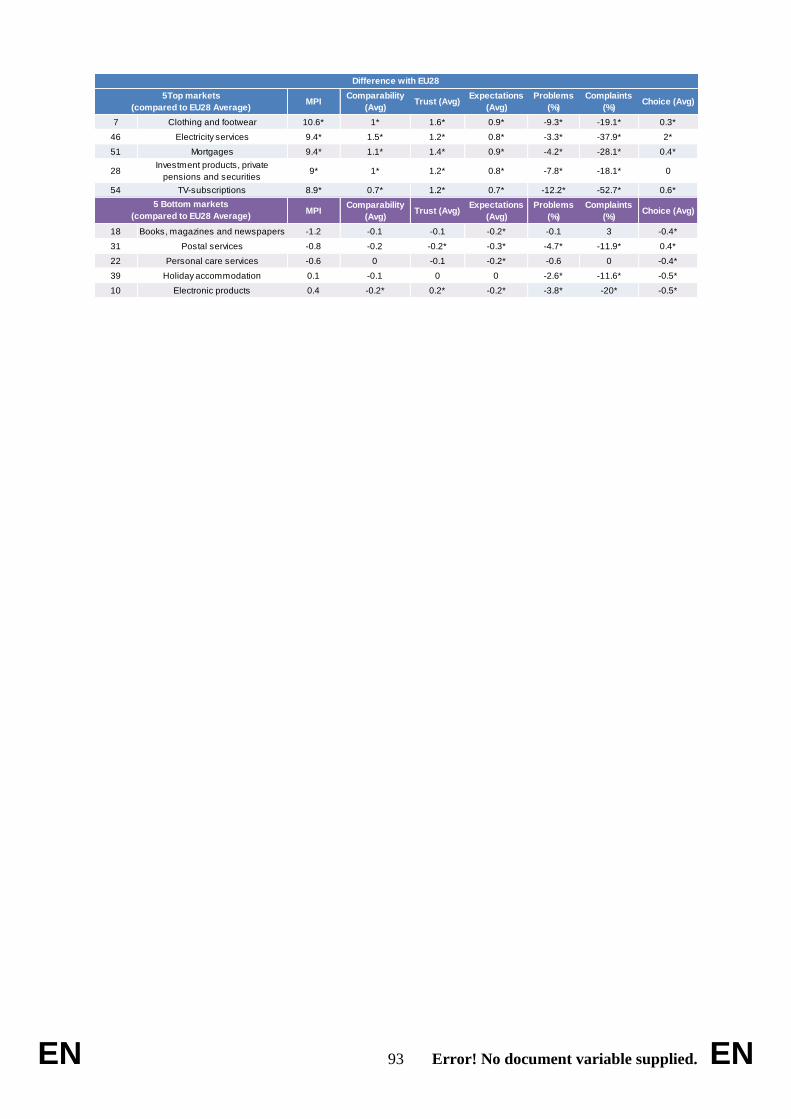
EN 93 Error! No document variable supplied. EN
MPIComparability
(Avg)Trust (Avg)
Expectations
(Avg)
Problems
(%)
Complaints
(%)Choice (Avg)
7 Clothing and footwear 10.6* 1* 1.6* 0.9* -9.3* -19.1* 0.3*
46 Electricity services 9.4* 1.5* 1.2* 0.8* -3.3* -37.9* 2*
51 Mortgages 9.4* 1.1* 1.4* 0.9* -4.2* -28.1* 0.4*
28Investment products, private
pensions and securities9* 1* 1.2* 0.8* -7.8* -18.1* 0
54 TV-subscriptions 8.9* 0.7* 1.2* 0.7* -12.2* -52.7* 0.6*
MPIComparability
(Avg)Trust (Avg)
Expectations
(Avg)
Problems
(%)
Complaints
(%)Choice (Avg)
18 Books, magazines and newspapers -1.2 -0.1 -0.1 -0.2* -0.1 3 -0.4*
31 Postal services -0.8 -0.2 -0.2* -0.3* -4.7* -11.9* 0.4*
22 Personal care services -0.6 0 -0.1 -0.2* -0.6 0 -0.4*
39 Holiday accommodation 0.1 -0.1 0 0 -2.6* -11.6* -0.5*
10 Electronic products 0.4 -0.2* 0.2* -0.2* -3.8* -20* -0.5*
5 Bottom markets
(compared to EU28 Average)
Difference with EU28
5Top markets
(compared to EU28 Average)

EN 94 Error! No document variable supplied. EN
Estonia
66.270.270.872.373.174.776.076.576.776.777.477.978.078.178.278.278.478.478.778.779.379.880.480.980.981.082.082.382.482.983.0
87.2
66.270.3
76.477.878.078.278.979.480.180.680.981.181.481.682.282.382.783.684.184.586.186.4
78.9
-8.3*-3.1-0.9-1.70.7-1
0.4-1.7
-4.2-4.4
-2.3*-2.6-2.2-1.2-3.2-1.9
0-2.4-0.9-1.7-0.9-2
-4.5-4.1-0.5-1.7-2.5-2.9-1.61.2
-1.72.40
-3.4-1.61.21.5-1.8-0.6-1.7-0.9-0.7-2.2-0.7-2.7-3.21.20.80
0.2-0.51.9
-1.6*
3.12.62.73.9-0.1
21.8
6.6*
31.5
1.8*2.41.72.90.60.80.52.41.81.60.71.52.41.6-1.62.42.70.70.60.1
0.8-3.11.34.22
0.60.12.1
1.2*1.21.11.92.51.44.52.10.70.70.90.50.4-0.3
1.6*
-6.6*-0.50.3-0.9-0.1
-1
-1.5*-1.3-1
-1.1-1.4-0.81.1-1.2-2.6-1.1
-0.8-2.1-1.8-1.5-2.2-1.40.40.20.7
1.8-0.2-0.1-2
0.61.20.60.5
1.1*1.21.72.80
1.3
1.62.210
0.80.8
-0.4
-5.8*-0.51.3-1.4-2
4.1*1.62.40.21.93
3.41.9*-1.1-0.44.5*-2.2
20.1
4.6*4.1*2.2
6.5*-0.32.45*
7.5*0.7
8.4*3.4*
03.4*
-4.7*-5.4*-0.8-2.4-1.5
31.50.40.4-0.31.3-0.50.70.4-0.12.21.12.21.6
3.5*1.7
4.4*
1.3*
Electricity services
Real estate services
Investment products, private pensions and…
Maintenance services
Vehicle maintenance and repair
Mortgages
Water supply
TV-subscriptions
Off-line gambling services
On-line gambling services
Private life insurance
Legal and accountancy services
All services markets
Packaged holidays & tours
Vehicle rental services
Internet provision
Airline services
Tram, local bus, metro
Cafés, bars and restaurants
Mobile telephone services
Gas services
Home insurance
Loans, credit and credit cards
Holiday accommodation
Postal services
Fixed telephone services
Train services
Commercial sport services
Bank accounts
Vehicle insurance
Culture and entertainment
Personal care services
Second hand cars
Clothing and footwear
Fruit and vegetables
Furniture and furnishings
Maintenance products
Meat and meat products
Fuel for vehicles
ICT products
All goods markets
Electronic products
New cars
Entertainment goods
Personal care products
Large household appliances
Spectacles and lenses
Non-prescription medicines
Small household appliances
Alcoholic drinks
Non-alcoholic drinks
Dairy products
Books, magazines and newspapers
Bread, cereals, rice and pasta
All markets
expectations problems&complaints trust comparability 2013 - 2012
2012 - 2011
2011 - 2010
Country-EU28
MPI per market
S
E
R
V
I
C
E
S
G
O
O
D
S
Overall Performance
Estonian consumers' market assessments are higher than the EU28 average (by 1.3 points).
This is mainly driven by their assessments of the services markets, which are better than
average (by 1.9 points).
Compared to 2012, there was a decline in the overall MPI performance (-1.6). Again, this is
mainly driven by the assessment of the services markets score, which declined by 2.3 points.
Goods Markets
Overall, the top three goods markets in Estonia are the bread, cereals, rice and pasta, the
books, magazines and newspapers and the dairy products markets. The bottom three are the

EN 95 Error! No document variable supplied. EN
second-hand cars, clothing and footwear and fruit and vegetables markets. Estonia’s bread,
cereals, rice and pasta market is rated third best performing across the EU28.
Across the individual goods markets, two perform better than the EU28 average: the bread,
cereals, rice and pasta, and dairy products markets. While only the bread, cereals, rice and
pasta market scores higher than average on trust, both markets score higher on comparability
and expectations.
Clothing and footwear and second-hand cars are the two markets that have lower scores than
the EU28 average. Again both markets suffer from poor assessments of comparability and
trust and, in the case of clothing and footwear, also a high proportion of problems.
Surprisingly, the market for second-hand cars has a lower level of complaints.
Compared to 2012, there has been a positive evolution in the goods markets for clothing and
footwear and bread, cereals, rice and pasta. Both markets score better than last year and enjoy
higher scores for expectations. The bread, cereals, rice and pasta market also has a higher
score for comparability and trust, but this is again not statistically significant. In contrast, the
non-prescription medicines; furniture and furnishing; spectacles and lenses; and personal care
products markets score lower than in 2012. The non-prescription medicines market shows low
levels of expectations, while the furniture market scores lower on the comparability
component.
Services Markets
Overall, the top three services markets in Estonia are the personal care services, culture and
entertainment and vehicle insurance markets. The bottom three are the electricity services,
real estate services and investment products, private pensions and securities markets.
Estonia’s train services and bank accounts markets are both assessed as the second best
performing across the EU28. The personal care services market is rated as the third best.
Across the individual services markets, three have a higher score than the EU28 average. The
bank accounts, train services, and loans, credit and credit cards markets are assessed better by
Estonian consumers than the EU28 as a whole. All three markets have a higher score on
comparability. The bank accounts market also scores higher on trust and expectations and has
a lower proportion of problems. The train services market has higher scores on trust,
comparability and expectations, and a lower proportion of problems compared to the EU28.
On the other hand, the electricity services, has a lower score than the EU28 average. The
market scores lower on comparability, trust and expectations, but has less complaints and a
better score on choice.
Year-on-year, across the services markets, only three improved: the water supply, personal
care services; and vehicle maintenance and repair markets; however, these differences are not
statistically significant. The vast majority of services markets deteriorated compared to 2012,
with 15 markets declining year-on-year. The most substantial drops are seen in the electricity
services, postal services and legal and accountancy services markets. Driving the decline in
the first market are decreases in the comparability and trust components. This decline could
be linked to the opening of the electricity market since 1 January 2013.

EN 96 Error! No document variable supplied. EN
MPIComparability
(Avg)Trust (Avg)
Expectations
(Avg)
Problems
(%)
Complaints
(%)Choice (Avg)
7 Clothing and footwear 2.4* -0.1 0.2 0.7* -3.2 16.6* 0.6*
3 Bread, cereals, rice and pasta 1.9* 0.2 0.2 0.2* -2.5 32.5* 0.3*
17 Fuel for vehicles 1.5 0 0.5* 0.2 -0.1 29.6* 0.4*
22 Personal care services 1.2 0.2 0 0.2 -0.8 -23* 0.1
2 Meat and meat products 1.2 0.1 0.2 0 -3.3 12.4* 0.3*
MPIComparability
(Avg)Trust (Avg)
Expectations
(Avg)
Problems
(%)
Complaints
(%)Choice (Avg)
46 Electricity services -8.3* -2.1* -1.2* -0.1 -1.7 -0.8 (note)
31 Postal services -4.5* -0.9* -0.4* -0.2 3.7 -5.1 0.3
57 Legal and accountancy services -4.4* -0.9* -0.4* -0.5* -0.2 -6.7* -0.2
52 Private life insurance -4.2* -1* -0.5* -0.2 -0.4 8.1* -0.4*
32 Fixed telephone services -4.1* -0.7* -0.6* -0.2 2.4 -5.8* 0
Difference with 2012
Improved most since 2012
Deteriorated most since 2012
MPIComparability
(Avg)Trust (Avg)
Expectations
(Avg)
Problems
(%)
Complaints
(%)Choice (Avg)
26 Bank accounts 8.4* 0.7* 1.3* 0.8* -7.2* -13.6* 0.4*
36 Train services 7.5* 0.7* 0.8* 0.6* -12.8* -3.1
58 Loans, credit and credit cards 6.5* 0.5* 1* 0.6* -6.1* -16.2* 0.2*
32 Fixed telephone services 5* 0.3* 0.8* 0.6* -3.3* -3.1 0
33 Mobile telephone services 4.6* 0.3* 0.9* 0.5* -2.2 -4.3* 0.5*
MPIComparability
(Avg)Trust (Avg)
Expectations
(Avg)
Problems
(%)
Complaints
(%)Choice (Avg)
46 Electricity services -5.8* -0.8* -1* -0.5* 1.4 -15.9* 0.6*
7 Clothing and footwear -5.4* -1.1* -0.4* -0.2 7.2* 7.8* -0.8*
16 Second hand cars -4.7* -0.9* -1.2* -0.2 -2.9 -27.1* 0.3*
9 Furniture and furnishings -2.4 -0.6* -0.3* -0.1 0.1 -2.2 -0.2
37 Airline services -2.2 -0.4* -0.2 -0.3* 0.1 -4.6* -1.1*
5 Bottom markets
(compared to EU28 Average)
Difference with EU28
5Top markets
(compared to EU28 Average)

EN 97 Error! No document variable supplied. EN
Ireland
63,063,163,3
67,768,968,969,071,071,171,271,473,073,273,473,473,574,174,675,175,575,977,277,978,779,079,579,680,481,181,682,082,6
70,075,275,878,178,278,379,179,880,080,581,481,581,581,882,482,482,683,283,884,385,185,8
76,7
0.1-0.1-0.52.2
-2.5*1.1-1.71.20.82.5-1.20.5
-0.71.41.50.2
-2.9*0.4-0.2-0.5-12
0.90.8-0.4
1.4-0.6
1-0.7
1
-1.4-5.3*0.7-0.50.1-1.3
-2.8*0
1.5-0.6*0.90
-0.20.5-0.4-0.5-0.1-0.1-1.6-1
-0.30.1
-0.1
-1.43.6*3.70
1.92.6*2.1*
0-0.2-1.3-1.3-1.2
-0.13.7*0.1-0.10.5-1.3-1.7-0.9
-2.8*-0.30.8-0.31.4
-2.9*1
-1.8*-2.1*-1.6
3.2*0.2-0.80.1
2.1*1
1.8*-2.4*0.70.30.30.9-0.5-1.41.4-2*0.60.60.40.80.5-1.1
0
-11.6*-3.4
-7.5*-9.2*
-11.2*
-5.4*-3.5*-3.4*
-2.5*
-4*-3.5*-2.2*-3.5*-1.5-1.11.7-0.60.50.7-0.3
1.20.3
2.5*2.9*2.1*
-5.3*0.4-0.3-0.7-1.5-1
0.22.4*-2.2*
1*-0.1
03*1
-0.3
2.5*1.8*2.9*2.9*
5.6*
-1.6*
-7.6*-10.9*-6.2*
-3-5.6*-4.8*-4.9*-3.5-3.4-2.9
-4.6*-0.7-1.6
-5.2*-0.6-1.6
-2.1*-0.73.1-0.91.4-1.30.3-1.9-0.2
03.11.8-0.60.5-1.8-0.4
-0.9-0.1-1.72.3-1.4-1.91.8-0.3
10.70.10.6211
0.21
1.61.81.9
4.2*1.5
-0.9*
Mortgages
Bank accounts
Investment products, private pensions and…
Real estate services
Water supply
Internet provision
Loans, credit and credit cards
Private life insurance
Legal and accountancy services
Mobile telephone services
Fixed telephone services
Maintenance services
On-line gambling services
Vehicle rental services
TV-subscriptions
Vehicle maintenance and repair
All services markets
Gas services
Electricity services
Tram, local bus, metro
Train services
Cafés, bars and restaurants
Home insurance
Airline services
Packaged holidays & tours
Vehicle insurance
Off-line gambling services
Postal services
Commercial sport services
Holiday accommodation
Personal care services
Culture and entertainment
Second hand cars
Meat and meat products
Fuel for vehicles
Clothing and footwear
New cars
Furniture and furnishings
Fruit and vegetables
Non-prescription medicines
ICT products
All goods markets
Large household appliances
Electronic products
Maintenance products
Personal care products
Alcoholic drinks
Spectacles and lenses
Entertainment goods
Small household appliances
Bread, cereals, rice and pasta
Non-alcoholic drinks
Dairy products
Books, magazines and newspapers
All markets
expectations problems&complaints trust comparability 2013 - 2012
2012 - 2011
2011 - 2010
Country-EU28
MPI per market
S
E
R
V
I
C
E
S
G
O
O
D
S
Overall Performance
Overall, Irish consumers’ market performance assessments were, on average, stable compared
to 2012. However, their market performance assessments are less positive than the EU28 (-0.9
percentage points).
While average assessments of the services markets have remained essentially stable in Ireland
compared to 2012, the goods markets have declined. However, compared to the EU28 as a
whole, Ireland’s services markets are assessed less positively (a difference of -2.1 points),
while the assessment of goods markets is in line with the EU28 average.

EN 98 Error! No document variable supplied. EN
Goods Markets
Overall, the top three goods markets in Ireland are the books, magazines and newspapers,
dairy products and non-alcoholic drinks markets. The bottom three are the second-hand cars,
meat and meat products, and fuel for vehicles markets.
Looking across individual goods markets, the highest increase in performance assessments
was in the ICT products market which rose slightly, but not significantly, by 1.5 percentage
points compared to 2012. Similarly the large household appliances market rose slightly.
However, assessments of the meat and meat products market were poorer compared to 2012.
This could potentially be linked with the horsemeat scandal which had emerged in Europe
before the fieldwork for the survey took place.121
The fruit and vegetables market’s score also
decreased by 2.8 percentage points, driven by a worse assessment of the trust component and
an increase in problems and complaints.
Compared to the EU28 average, the only Irish goods market which is rated as being different
is that of dairy products. This market is assessed 4.2 percentage points higher than the EU28
average by Irish consumers. The clothing and footwear market is rated higher than the EU28
average; however, this difference is not statistically significant.
Services Markets
Overall, the top three services markets in Ireland are the culture and entertainment, personal
care services, and holiday accommodation markets. The bottom three are the mortgages, bank
accounts, and investment products, private pensions and securities markets. The Irish bank
accounts market is rated in 26th position across the EU28, while the vehicle rental services
market is assessed in 27th position.
Looking at individual services markets in Ireland, there were no statistically significant
changes in assessment compared with 2012. There were some slight improvements in the
mobile telephone services, real estate, and home insurance markets. The gas services and
water supply markets fared worse.
Overall, compared to the EU28 average, the markets assessed the best in Ireland are the dairy
products, offline gambling services, and electricity services markets. The bank accounts
market; the mortgages market and the investment products, private pensions and securities
market perform the worst against the EU28.
MPIComparability
(Avg)Trust (Avg)
Expectations
(Avg)
Problems
(%)
Complaints
(%)Choice (Avg)
33 Mobile telephone services 2.5 0.2 0.4* 0.1 -3.4 1.4 0
20 Real estate services 2.2 0.2 0.3* 0.3* 0 -7.8* -0.1
29 Home insurance 2 0.2 0.2 0.2 -3.2* 13.4* 0.1
23 Vehicle maintenance and repair 1.5 0.1 0.3 0.1 -1.4 -0.6 -0.1
13 ICT products 1.5 -0.1 0.2 0.2 -4.3 0.7 0.2
MPIComparability
(Avg)Trust (Avg)
Expectations
(Avg)
Problems
(%)
Complaints
(%)Choice (Avg)
2 Meat and meat products -5.3* -0.1 -1.6* -0.3* 1.2 0.1 0
47 Gas services -2.9* -0.4* -0.2 -0.3* 4* -5.4* -0.2
1 Fruit and vegetables -2.8* -0.2 -0.4* -0.1 4.4* 18.4* -0.3*
45 Water supply -2.5* -0.3 -0.1 -0.7* -0.9 -5.3
58 Loans, credit and credit cards -1.7 -0.1 -0.1 -0.2 3.4 -2.5 -0.2
Difference with 2012
Improved most since 2012
Deteriorated most since 2012
121
http://ec.europa.eu/food/food/horsemeat/

EN 99 Error! No document variable supplied. EN
MPIComparability
(Avg)Trust (Avg)
Expectations
(Avg)
Problems
(%)
Complaints
(%)Choice (Avg)
55 Dairy products 4.2* 0.4* 0.6* 0.5* -1.7 12.4* 0.2*
59 Off-line gambling services 3.1 0 0.4* 0.9* -0.1 7.2* -0.1
46 Electricity services 3.1 0.2 0.7* 0.3* -1.3 18.2* 0.1
7 Clothing and footwear 2.3 0.3* 0.5* 0.3* 1.9 5.7* -0.1
8 Maintenance products 2 0.1 0.5* 0.2* -1.2 5.6* -0.4*
MPIComparability
(Avg)Trust (Avg)
Expectations
(Avg)
Problems
(%)
Complaints
(%)Choice (Avg)
26 Bank accounts -10.9* -0.8* -1.6* -1.1* 10.6* 6* -1.7*
51 Mortgages -7.6* -0.7* -1* -1.2* 1.7 2.8 -2*
28Investment products, private
pensions and securities-6.2* -0.6* -0.7* -0.8* 4.8* 2.1 -1.1*
45 Water supply -5.6* -0.9* -0.1 -0.8* 7.4* -9.5*
38 Vehicle rental services -5.2* -0.4* -0.4* -0.6* 8.6* 10.3* -0.2
5 Bottom markets
(compared to EU28 Average)
Difference with EU28
5Top markets
(compared to EU28 Average)

EN 100 Error! No document variable supplied. EN
Greece
65,270,972,673,574,175,876,276,376,476,877,677,878,278,378,478,478,579,179,379,379,780,080,581,081,281,681,982,082,082,082,5
85,1
73,079,779,880,780,981,581,581,781,982,082,282,482,682,682,982,983,183,483,683,784,484,8
79,7
4.2*5.5*2.6*6.7*
3.7*5.2*4.5*1.9
4.1*4.6*4.7*3.1*3.4*0.9
6.3*1.9
2.2*2.5*1.8*
2.4*2.1*3.1*1.9*3.1*4.5*0.8
1.7*0.74*0.5
5.9*2.4*0.71.2
2.6*1.31.41
2.1*0.3
2.9*1.2
2.4*4.6*2.1*1.7*1.8*1.3
2.3*3.6*1.8*0.8
2.6*
-6.8*-4.9*-2.2-3*
0.1-2
-0.13.5*-1.92.4*2.9*-0.3-0.11.5
-3.5*2.9*
0-0.4-0.3
0-0.5
1-0.84.4*-0.80.3-1.30.4-0.2-0.2
-2.8*1.70
0.62.8*-0.5-0.8-1.4-0.40.4-1.30.7-0.3
-2.3*-1.8*
-1-0.1
10.6
-1.6*-1.5*0.2
-0.3*
-3.1*
-1.9
4.7*
-2.6*-4*
5.1*5.9*6.4*1.3*
13.7*2.2*-2*
2.8*0.5
3.2*0.7-0.63.4*
5.6*-0.7
13.8*2.2*
-1
-0.52.9*0.7-0.10.7
6.6*-0.32*1.3
1.8*2.9*1.5
2.2*6.4*2.9*-0.10.70.8
3.5*0.7
1.6*
-6.8*-3
-1.92.9-2.31.81.81.90
3.18.2*7.1*2.1*4.3*4.7*0.83.2
4.6*4.2*-0.24.9*-1.2
25*2.7
7.6*2.71.3-1
0.33.9*1.3
-4.4*8.8*4.5*3.5
5.2*0.52
1.62.1*3.10.92.21.23
1.32
1.10.9230
2.6
2.1*
Electricity services
Loans, credit and credit cards
Water supply
Mortgages
Off-line gambling services
Bank accounts
Private life insurance
Train services
Tram, local bus, metro
Maintenance services
Investment products, private pensions and…
Real estate services
All services markets
Mobile telephone services
Internet provision
Home insurance
Gas services
Legal and accountancy services
Vehicle maintenance and repair
Vehicle insurance
On-line gambling services
Holiday accommodation
Postal services
Fixed telephone services
Cafés, bars and restaurants
TV-subscriptions
Packaged holidays & tours
Airline services
Culture and entertainment
Commercial sport services
Vehicle rental services
Personal care services
Fuel for vehicles
Second hand cars
Meat and meat products
Fruit and vegetables
Clothing and footwear
Dairy products
Maintenance products
Non-prescription medicines
All goods markets
ICT products
Large household appliances
Furniture and furnishings
Alcoholic drinks
New cars
Entertainment goods
Electronic products
Bread, cereals, rice and pasta
Non-alcoholic drinks
Small household appliances
Personal care products
Books, magazines and newspapers
Spectacles and lenses
All markets
expectations problems&complaints trust comparability 2013 - 2012
2012 - 2011
2011 - 2010
Country-EU28
MPI per market
S
E
R
V
I
C
E
S
G
O
O
D
S
Overall Performance
The assessment of consumer markets is on average higher in Greece than in the whole EU28.
This is the case for both goods and services markets (+2.1 difference, in each case). In
addition, both markets show higher than average scores for comparability and trust.
Compared to the score from 2012, both markets show improvement (goods markets, +2.1;
services markets, +3.1). Overall, the markets in Greece show an improvement of 2.6 when
compared to last year.
Goods Markets
Overall, the top three goods markets in Greece are the spectacles and lenses, books,
magazines and newspapers, and personal care products markets. The bottom three are the fuel

EN 101 Error! No document variable supplied. EN
for vehicles, second-hand cars, and meat and meat products markets. The Greek new cars and
spectacles and lenses markets are both rated as the third best performing across the EU28.
Across the individual goods markets, the second-hand cars (4th) and clothing and footwear
(6th) have higher scores than the EU28 average. Both markets show a low level of problems
and high scores for comparability and expectations. The second-hand cars market also scores
relatively highly for trust. Fuel for vehicles is the only Greek goods market to be under the
EU average; it scores relatively poorly for expectations, comparability and trust, and has
relatively high proportions of problems and complaints.
Compared to 2012, the fuel for vehicles market showed the most improvement, which was
driven by higher levels of trust and fewer problems. Another 12 markets showed positive
changes.
Services Markets
Overall, the top three services markets in Greece are the personal care services, vehicle rental
services, and commercial sport services markets. The bottom three are the electricity services,
loans, credit and credit cards and water supply markets. The vehicle rental services market is
rated as the second best performing across the EU28, while the online gambling and betting
services and TV-subscriptions markets are assessed as the third best performing across the
EU28.
Across the individual services markets, investment products, TV-subscriptions and real estate
services score higher when compared to the EU28 average. The investment products, private
pensions and securities market scores highly for comparability and expectations, and has a
low proportion of complaints. The TV-subscriptions market has relatively few problems and
relatively high levels of trust and expectations. The real estate services market scores higher
on trust and expectations. The electricity services market is the one market that performs
significantly poorer than the EU28 average. Nevertheless, the loans, credit and credit cards,
and the offline gambling services markets both score relatively poorly.
Compared to 2012, across the services markets, the biggest improvements are seen in the
mortgages; home insurance; and the loans, credit and credit cards markets. Another 20
markets show a positive increase in score. The increase of the market for mortgages is driven
by high scores for the trust and expectations components and a low level of problems. The
home insurance market improved in terms of trust, expectations and comparability.
MPIComparability
(Avg)Trust (Avg)
Expectations
(Avg)
Problems
(%)
Complaints
(%)Choice (Avg)
51 Mortgages 6.7* 0.5* 0.9* 0.9* -6* 7.6* 0.4*
29 Home insurance 6.3* 0.7* 0.9* 0.7* -2.9* 7.2* 0.5*
17 Fuel for vehicles 5.9* 0.3* 1.2* 0.4* -6* -0.9 -0.3*
58 Loans, credit and credit cards 5.5* 0.5* 0.9* 0.5* -4.6* 10.1* -0.1
52 Private life insurance 5.2* 0.6* 0.6* 0.6* -4.7* 9.9* 0.3*
MPIComparability
(Avg)Trust (Avg)
Expectations
(Avg)
Problems
(%)
Complaints
(%)Choice (Avg)
13 ICT products 0.3 0 0.1 -0.1 -0.8 -5.6* -0.3*
22 Personal care services 0.5 -0.1 0.1 0.1 -1.7 51.3* -0.3*
42 Commercial sport services 0.7 0 0.1 0.2 0.5 0.7 0.1
2 Meat and meat products 0.7 0.1 0.3* 0 1.4 -11.8* -0.6*
53 Spectacles and lenses 0.8 0.2 0.2 -0.1 -0.3 -13.7* -0.1
Difference with 2012
Improved most since 2012
Improved the least since 2012
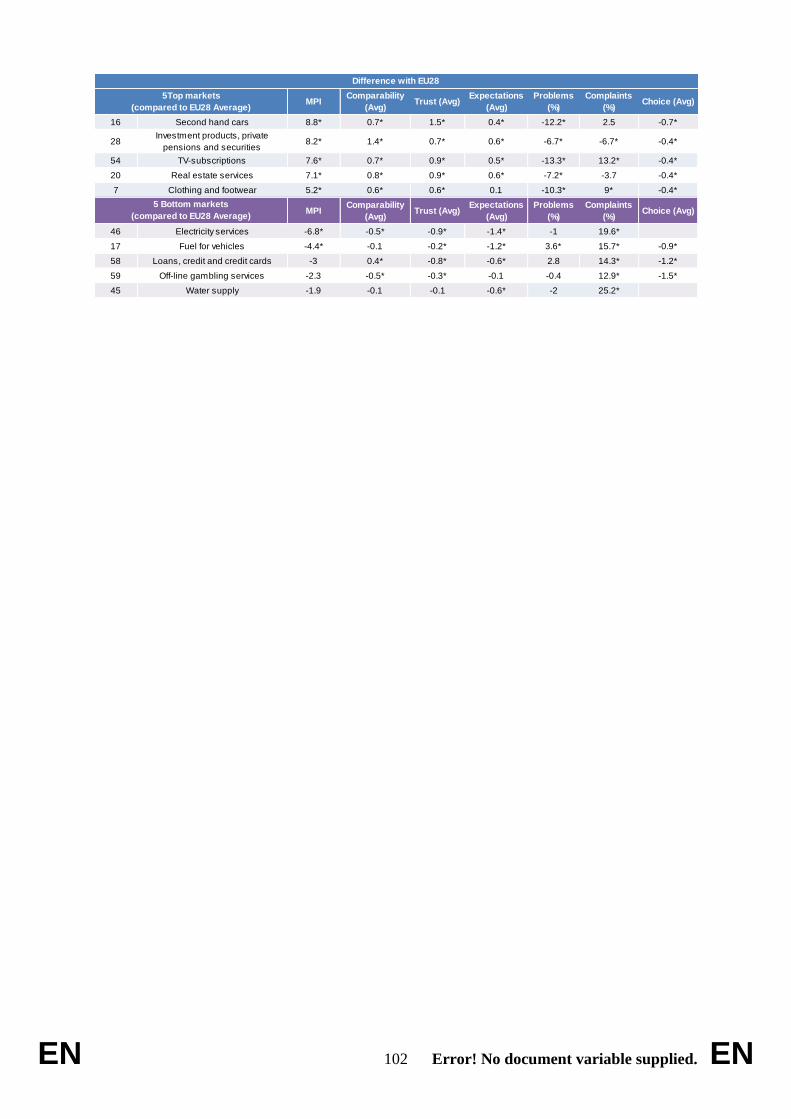
EN 102 Error! No document variable supplied. EN
MPIComparability
(Avg)Trust (Avg)
Expectations
(Avg)
Problems
(%)
Complaints
(%)Choice (Avg)
16 Second hand cars 8.8* 0.7* 1.5* 0.4* -12.2* 2.5 -0.7*
28Investment products, private
pensions and securities8.2* 1.4* 0.7* 0.6* -6.7* -6.7* -0.4*
54 TV-subscriptions 7.6* 0.7* 0.9* 0.5* -13.3* 13.2* -0.4*
20 Real estate services 7.1* 0.8* 0.9* 0.6* -7.2* -3.7 -0.4*
7 Clothing and footwear 5.2* 0.6* 0.6* 0.1 -10.3* 9* -0.4*
MPIComparability
(Avg)Trust (Avg)
Expectations
(Avg)
Problems
(%)
Complaints
(%)Choice (Avg)
46 Electricity services -6.8* -0.5* -0.9* -1.4* -1 19.6*
17 Fuel for vehicles -4.4* -0.1 -0.2* -1.2* 3.6* 15.7* -0.9*
58 Loans, credit and credit cards -3 0.4* -0.8* -0.6* 2.8 14.3* -1.2*
59 Off-line gambling services -2.3 -0.5* -0.3* -0.1 -0.4 12.9* -1.5*
45 Water supply -1.9 -0.1 -0.1 -0.6* -2 25.2*
5 Bottom markets
(compared to EU28 Average)
Difference with EU28
5Top markets
(compared to EU28 Average)

EN 103 Error! No document variable supplied. EN
Spain
55,655,657,358,558,658,9
62,064,065,365,866,467,668,368,769,469,770,070,472,374,174,474,776,276,376,576,876,877,479,279,681,482,5
68,872,073,1
76,676,977,778,078,178,278,478,478,578,679,079,279,880,182,382,482,582,782,8
73,2
-3.7*0.40.2-1.4
-3.8*-2.5-1.32.2-2.5-1.5-1.8-0.3-0.5-0.3-0.2-0.5
-2.7*0.7-1.1
0.3-1.41.2-0.7
2.7*1.7-0.90.9-1.11.60.9
-1.2-1.6-0.1
-1.9*-0.9
-2.9*-1.61.90.1
-0.8*0.7-1.3-1.1-1.5-1.50.8-0.2-0.7-0.7-1
0.3-1.3
-0.7*
-3.6*2.8*2.3
4.6*-1.2
-4.1*3.1*0.70.80.7
5.4*-0.70.5
-5.1*0.60.22.2-0.83.1*
-0.90.30.1
2.7*
-1.10.7-0.8
-1.9*0.20.30.1
0.6-0.53.6*3.7*
01.61.30.70.7
0.9*-1.41.91.61.40.8
1.9*0.3-1.1
1-0.30.2
1.7*
0.5*
-4.7*
-11.6*-14.4*
-2.4*-9.8*-8.2*
-4.9*
-7.5*
0.6-3.4*-4.2*
-1-3.2*-2.3
-2.1*-1.8
-2.6*-3*
-1.8-1
1.9*0.5
1.6*1.3
1.8*
-6*-2.4*-5.9*-1.6-0.1-1.70.3-1.9-1.2-0.31.5
-2.8*-2.2*3.2*-0.1-0.41.7
-0.12.9*
2.5*
-2.5*
-18.4*-15*
-16.7*-13.5*-15.3*-10.6*-11.6*-6.6*-9.1*
-10.2*-7.6*-6.9*-6.1*-5*
-5.9*-6.4*-7.6*
-10.2*-2.8-0.7-0.1-1.7-2.4-2.9
0-1.8-2.6-1.1-2.5-3.40.2-1.3
-8.6*-7*2.1-3
-3.22.4-3.32.3-2.7
-1.4*-3.11.3-2.7-0.5-1.5-0.4-1.6
00.4-1.91.80.3
-4.4*
Bank accounts
Mortgages
Mobile telephone services
Electricity services
Loans, credit and credit cards
Investment products, private pensions and…
Internet provision
Real estate services
Legal and accountancy services
Fixed telephone services
TV-subscriptions
Water supply
Private life insurance
Maintenance services
Gas services
All services markets
Home insurance
Airline services
Vehicle maintenance and repair
On-line gambling services
Train services
Tram, local bus, metro
Postal services
Packaged holidays & tours
Off-line gambling services
Vehicle rental services
Vehicle insurance
Cafés, bars and restaurants
Commercial sport services
Culture and entertainment
Holiday accommodation
Personal care services
Fuel for vehicles
ICT products
Second hand cars
New cars
Non-prescription medicines
Meat and meat products
Large household appliances
Clothing and footwear
Electronic products
All goods markets
Entertainment goods
Fruit and vegetables
Alcoholic drinks
Maintenance products
Personal care products
Furniture and furnishings
Small household appliances
Spectacles and lenses
Bread, cereals, rice and pasta
Books, magazines and newspapers
Dairy products
Non-alcoholic drinks
All markets
expectations problems&complaints trust comparability 2013 - 2012
2012 - 2011
2011 - 2010
Country-EU28
MPI per market
S
E
R
V
I
C
E
S
G
O
O
D
S
Overall Performance
The average performance of consumer markets in Spain is much lower than in the EU28 as a
whole – 4.4 points below. This is largely driven by a very low comparative score for the
services markets – 6.4 points below. The average score for Spain’s goods markets is also
lower than in the EU28 – 1.4 points below.
Compared to 2012, the overall assessments of the markets have declined, driven by lower
ratings for the goods markets and a marginal – but not significant – downward assessment of
the services markets.

EN 104 Error! No document variable supplied. EN
Goods Markets
Overall, the top three goods markets in Spain are the non-alcoholic drinks, dairy products and
books, magazines and newspapers markets. The bottom three are the fuel for vehicles, ICT
products and second-hand cars markets. The Spanish new cars, large household appliances
and fuel for vehicles markets are all ranked in 26th position across the EU28. The ICT
products market is ranked in 27th place.
Across the individual goods markets, no market statistically significantly outperforms the
EU28 average; although the meat and meat products and clothing and footwear markets both
have a slightly higher score. Only two goods markets have a lower score than the average: the
fuel for vehicles and ICT products markets. The market for fuel for vehicles scores lower for
trust, comparability and expectations; the ICT products market also scores lower for trust, and
has a higher proportion of complaints.
Across the goods markets, no statistically significant improvements can be reported compared
to 2012; nevertheless the largest increases in positive assessments are found in the clothing
and footwear and furniture and furnishings markets. Significant declines are found in the meat
and meat products and the new cars markets. The meat and meat products market suffered
lower scores for trust and expectations and a high proportion of problems; this is likely to be
driven by the horsemeat scandal which was reported widely across Europe just prior to
fieldwork in January 2013. The new cars market is rated poorly for comparability.
Services Markets
Overall, the top three services markets in Spain are the personal care services, holiday
accommodation and culture and entertainment markets. The bottom three are the bank
accounts, mortgages, and mobile telephone services markets.
Spain’s TV-subscriptions, real estate services, electricity services and mortgages markets are
all rated in 26th position across the EU28.
The following markets are all rated in 27th
position across the EU28:investment products,
private pensions and securities; maintenance services; fixed telephone services; legal and
accountancy services; internet provision; airline services; mobile telephone services; bank
accounts; home insurance; private life insurance; loans, credit and credit cards; ICT products;
and culture and entertainment.
On an individual level, a total of 17 services markets have a lower score in Spain than the
EU28 average.
The bank accounts, mobile telephone services and the loans, credit and credit cards markets
all score more than 15 percentage points lower than the EU28 average. All three markets
experience very high levels of problems (bank accounts -23 points; mobile telephone services
-21; and loans, credit and credit cards -14), but also receive relatively low scores for the trust,
expectations and comparability components. The only markets that receive scores equal to the
EU28 are those for holiday accommodation, offline gambling and lottery services, and train
services.
There was a positive change in the vehicle rental services score, as well as negative changes
in the loans, credit and credit cards, bank accounts and home insurance markets. The vehicle
rental services market enjoyed increases in trust, comparability and expectations. The loans,
credit and credit cards market suffered lower levels of trust and expectations, combined with
higher levels of problems.

EN 105 Error! No document variable supplied. EN
MPIComparability
(Avg)Trust (Avg)
Expectations
(Avg)
Problems
(%)
Complaints
(%)Choice (Avg)
38 Vehicle rental services 2.7* 0.3* 0.4* 0.3* -0.2 -3.7* 0
20 Real estate services 2.2 0.3* 0.1 0.2 -3.4 -0.6 0.1
7 Clothing and footwear 1.9 0.2 0.2 0 -3.5 -5* -0.2
30 Vehicle insurance 1.7 -0.1 0.4* 0.2 -2.7 -10.2* 0
39 Holiday accommodation 1.6 0.1 0.1 0.1 -2.9 -16.4* 0
MPIComparability
(Avg)Trust (Avg)
Expectations
(Avg)
Problems
(%)
Complaints
(%)Choice (Avg)
58 Loans, credit and credit cards -3.8* -0.2 -0.8* -0.3 3.3 -5* 0
26 Bank accounts -3.7* -0.1 -0.7* -0.1 8.1* 1.3 -0.6*
2 Meat and meat products -2.9* 0 -0.6* -0.2 4.2* -20.2* 0
29 Home insurance -2.7* -0.4* -0.1 -0.3 4.3* -3.2 -0.2
28Investment products, private
pensions and securities-2.5 -0.5* -0.4* 0.1 2.2 -1.8 0
Difference with 2012
Improved most since 2012
Deteriorated most since 2012
MPIComparability
(Avg)Trust (Avg)
Expectations
(Avg)
Problems
(%)
Complaints
(%)Choice (Avg)
2 Meat and meat products 2.4 0.3* 0.3* 0.1 -3.4* -8* 0
7 Clothing and footwear 2.3 0.5* -0.1 0.1 -7.2* 5.4* 0.1
16 Second hand cars 2.1 0 0.7* 0.2 -1.3 19.4* -0.3*
55 Dairy products 1.8 0.3* 0.1 0.1 -3.3* 24.9* 0.1
1 Fruit and vegetables 1.3 0.3* -0.1 0 -5.4* 4.2 0.2*
MPIComparability
(Avg)Trust (Avg)
Expectations
(Avg)
Problems
(%)
Complaints
(%)Choice (Avg)
26 Bank accounts -18.4* -1.3* -2.6* -1.5* 23.4* 18* -0.8*
33 Mobile telephone services -16.7* -0.9* -2.5* -1.6* 20.5* 9.3* -0.7*
58 Loans, credit and credit cards -15.3* -1.4* -2.3* -1.3* 13.5* 15.3* -0.8*
51 Mortgages -15* -1.5* -2.8* -1.3* 4.8* 15.5* -1.6*
46 Electricity services -13.5* -1.2* -1.9* -1.3* 12.3* 5.9* -1.4*
5 Bottom markets
(compared to EU28 Average)
Difference with EU28
5Top markets
(compared to EU28 Average)

EN 106 Error! No document variable supplied. EN
France
75,976,276,676,676,876,977,077,077,177,277,377,677,677,878,678,678,979,079,179,179,279,279,480,180,380,580,680,780,781,281,581,9
77,778,678,978,980,380,480,680,780,880,880,980,981,181,181,281,582,183,283,383,683,785,2
79,7
2.3*0.5
3.7*1.61.1
1.9*4.7*2.6*2.9*
00.2
4.6*2.7*4.2*2.3*0.3
3.9*2.7*4.3*4*
-0.13.2*4.3*8.2*-1.3*0.40.5
2.5*0.40.5
1.4-0.70.3
2.8*1.10
-0.4-0.21.9*-0.32.5*1.7*0.3-0.21.3*6.6*1.31.1
3.2*0.5
2.1*2.2*
1.9*
-1.5-0.8
-4.2*-0.2-1.3-1.1
-2.7*-0.6-1
-1.20.6
-3.9*-4.1*-4.9*-1.2*4.6*
-4.3*-2.5*-4.2*-1.8*3.4*-2.1*-1.9*-2.9*1.8*1.5*
-1-2.3*0.5-0.4
0.81.6*-1.4-1.4
-1.7*1.10.7-0.2-1
1.1-1.10.10.8
1.9*-0.1
-3.8*-0.1-0.2
-2.2*0.40.62*
-0.8*
12*10.2*
6.5*4.3*8.2*8.3*
11.6*3.8*2.3*4.9*
4*4.8*4.8*
4.3*3.8*
5.5*4*
2.6*5.9*
-0.10.7
4.9*0.9
4.7*2.6*
6.5*3.3*4.1*3.5*3.9*4.2*2.1*4*
4.2*3.6*2.2*3.8*2.1*
3.4*1.4
1.7*
0.44.4*1.8*4.9*
4.3*
5.2*2.5
5.9*2.20.71.833
7.6*-2.2-0.22.33.7-0.72.5*4.2*4.1*2.60.5
4.6*7.2*5.5*0.8
5.6*6.3*-2.5-0.51.4-3
0.5-0.25.4*
6.7*-0.9-0.7-1.20.11.5-1
-0.83.6*-0.50.2
5.7*0.2-1.11.4*4.1*0.72.2-1.11.11.7
9.5*
2.1*
Real estate services
Internet provision
Mortgages
Private life insurance
Fixed telephone services
Vehicle maintenance and repair
Mobile telephone services
Bank accounts
Investment products, private pensions and…
Vehicle insurance
Home insurance
Gas services
Loans, credit and credit cards
Postal services
All services markets
Train services
On-line gambling services
Tram, local bus, metro
Cafés, bars and restaurants
Legal and accountancy services
Electricity services
Maintenance services
Vehicle rental services
Water supply
TV-subscriptions
Culture and entertainment
Holiday accommodation
Packaged holidays & tours
Personal care services
Airline services
Commercial sport services
Off-line gambling services
Second hand cars
Maintenance products
New cars
Non-prescription medicines
Furniture and furnishings
ICT products
Small household appliances
Entertainment goods
Fruit and vegetables
Large household appliances
Personal care products
Meat and meat products
Electronic products
Spectacles and lenses
All goods markets
Fuel for vehicles
Alcoholic drinks
Dairy products
Books, magazines and newspapers
Non-alcoholic drinks
Bread, cereals, rice and pasta
Clothing and footwear
All markets
expectations problems&complaints trust comparability 2013 - 2012
2012 - 2011
2011 - 2010
Country-EU28
MPI per market
S
E
R
V
I
C
E
S
G
O
O
D
S
Overall Performance
Consumer markets are assessed more positively in France than in the EU28 as a whole (a
difference of 2.1 point), both overall and for goods and services markets separately. In
addition, all three indicators have increased from 2012.
Goods Markets
Overall, the top three goods markets in France are the clothing and footwear, bread, cereals,
rice and pasta and non-alcoholic drinks markets. The bottom three are the second-hand cars,
maintenance products and new cars markets.

EN 107 Error! No document variable supplied. EN
Across the individual goods markets, five markets statistically outperform the EU28; clothing
and footwear and second-hand cars are the top performing markets in this regard. The
clothing and footwear market scores comparatively highly for the trust, comparability and
expectations components, with a comparatively lower proportion of problems. The second-
hand cars market scores higher for trust, and has a lower proportion of problems.
No individual French goods market showed a score that was statistically lower than the EU28
average; nevertheless, the lowest comparative scores are observed in the non-prescription
medicines and the spectacles and lenses markets.
Compared to 2012, eight goods markets improved, especially the fuel for vehicles market.
Another notable improvement was seen in the books, magazines and newspapers market,
driven by high scores for the expectations, trust and comparability components in 2013. The
maintenance products and small household appliances markets’ scores decreased from last
year, although these changes are not statistically significant.
Services Markets
Overall, the top three services markets in France are the offline gambling and lottery services,
commercial sport services and airline services markets. The bottom three are the real estate
services, internet provision and mortgages markets. The French offline gambling and lottery
services market is rated as the second best performing across the EU28. The personal care
services market is assessed in 26th position across the EU28.
Across the individual services markets, a total of eleven markets are assessed higher by
French consumers than by the EU28 consumers, in particular the investment products, private
pensions and securities, electricity services, and TV-subscriptions markets. The investment
market shows a higher score for the trust, comparability and expectations components. The
electricity services market scores relatively highly for comparability and trust; while the TV-
subscriptions market has a relatively low proportion of problems and complaints.
Personal care services, culture and entertainment, and vehicle insurance markets all score
somewhat lower than the EU 28 average but these differences are not statistically significant.
Compared to 2012, across the services markets, the largest year-on-year difference is an
increase in positive assessments of the TV-subscriptions market; this market shows higher
levels of trust, comparability and expectations, combined with a decrease in the proportion of
problems. Scores increased for another 17 services markets. On the negative side, the culture
and entertainment market’s score decreased compared to 2012.
MPIComparability
(Avg)Trust (Avg)
Expectations
(Avg)
Problems
(%)
Complaints
(%)Choice (Avg)
54 TV-subscriptions 8.2* 0.9* 1.2* 0.8* -5.8* -9* 0.9*
17 Fuel for vehicles 6.6* 0.6* 0.9* 1* -1.3 -30.3* 0.7*
33 Mobile telephone services 4.7* 0.6* 0.8* 0.4* -0.8 -9.9* 0.3*
47 Gas services 4.6* 0.6* 0.6* 0.6* -0.5 -1.7 0.8*
57 Legal and accountancy services 4.3* 0.5* 0.5* 0.5* -1.6 -20.3* 0.3*
MPIComparability
(Avg)Trust (Avg)
Expectations
(Avg)
Problems
(%)
Complaints
(%)Choice (Avg)
43 Culture and entertainment -1.3* 0 -0.2* -0.2* 1.2 -4.4 0
8 Maintenance products -0.7 -0.3* 0.2 -0.1 0.6 8.3* -0.2*
12 Small household appliances -0.4 0 0 -0.1 1.2 -31* 0.1
11 Large household appliances -0.3 -0.1 0 0 0.7 -3.4 0.1
14 Entertainment goods -0.2 0 0 0 0.6 -18.1* 0
Difference with 2012
Improved most since 2012
Deteriorated most since 2012

EN 108 Error! No document variable supplied. EN
MPIComparability
(Avg)Trust (Avg)
Expectations
(Avg)
Problems
(%)
Complaints
(%)Choice (Avg)
7 Clothing and footwear 9.5* 1* 1.3* 0.6* -10.4* -39.7* 0.2*
28Investment products, private
pensions and securities7.6* 0.9* 1* 0.6* -6.2* -34.9* -0.3*
46 Electricity services 7.2* 1.1* 1.1* 0.3* -4.3* -34.2* 1.3*
16 Second hand cars 6.7* 0.3* 1.5* 0 -12.5* -33.8* -0.8*
54 TV-subscriptions 6.3* 0.4* 0.9* 0.3* -11* -47.5* 0.5*
MPIComparability
(Avg)Trust (Avg)
Expectations
(Avg)
Problems
(%)
Complaints
(%)Choice (Avg)
22 Personal care services -3 -0.4* -0.2* -0.6* -0.2 -18.9* -0.7*
43 Culture and entertainment -2.5 -0.2* -0.2* -0.6* -0.4 -22.5* -0.1
30 Vehicle insurance -2.2 -0.4* -0.1 -0.5* 0.4 -39.9* -0.4*
48 Non-prescription medicines -1.2 0.1 -0.1 -0.5* 1.9 -33.6* -0.5*
53 Spectacles and lenses -1.1 -0.1 -0.2* -0.5* -4.1* -38.7* -0.6*
5 Bottom markets
(compared to EU28 Average)
Difference with EU28
5Top markets
(compared to EU28 Average)

EN 109 Error! No document variable supplied. EN
Croatia122
60.260.761.161.662.463.163.363.965.165.266.168.168.468.568.669.670.070.070.871.372.772.973.173.673.6
76.177.878.279.679.780.680.8
60.264.365.366.267.169.470.771.271.271.372.373.373.373.673.673.874.174.274.475.575.977.2
70.6
-10.4*-8.8*-9.6*
-12.4*-12.1*-11.3*-10.7*
-8*-9.3*-8.5*-7.6*-7.9*-5.6*-6.7*-5.3*-5.5*-6.4*-6.1*-5.6*-3.2-2.1
-5.7*-4.5*-4.9*-4.9*-3.1-3.3-1.3-2.1-0.9-3.2-2.2
-10.8*-11*
-11.9*-9.5*
-10.4*-11.6*-8.2*-8.3*
-10.8*-8.4*-7.9*-6.9*-8.2*-7.6*-7.3*-8.7*-5.5*-7.4*-6.4*-5.9*-6.4*-7.1*
-7*
Mortgages
Investment products, private pensions and…
Real estate services
TV-subscriptions
Legal and accountancy services
Water supply
Mobile telephone services
Electricity services
Train services
Internet provision
Maintenance services
Fixed telephone services
Bank accounts
Gas services
Loans, credit and credit cards
Vehicle maintenance and repair
Tram, local bus, metro
All services markets
Off-line gambling services
Private life insurance
On-line gambling services
Vehicle rental services
Home insurance
Postal services
Cafés, bars and restaurants
Packaged holidays & tours
Holiday accommodation
Vehicle insurance
Commercial sport services
Airline services
Personal care services
Culture and entertainment
Second hand cars
Meat and meat products
Fruit and vegetables
Clothing and footwear
Fuel for vehicles
Dairy products
ICT products
Maintenance products
Bread, cereals, rice and pasta
All goods markets
Non-prescription medicines
Furniture and furnishings
Entertainment goods
Large household appliances
Electronic products
Non-alcoholic drinks
New cars
Small household appliances
Personal care products
Alcoholic drinks
Spectacles and lenses
Books, magazines and newspapers
All markets
expectations problems&complaints trust comparability 2013 - 2012
2012 - 2011
2011 - 2010
Country-EU28
MPI per market
S
E
R
V
I
C
E
S
G
O
O
D
S
Overall Performance
In general, the performance of consumer markets in Croatia are assessed worse than the EU28
average, with a difference of 7.0 points. The overall score for goods markets in Croatia is 8.4
points lower than the EU28 average, and the overall score for services markets is 6.1 points
below the EU28 average.
Goods Markets
Overall, the top three goods markets in Croatia are the books, magazines and newspapers,
spectacles and lenses and alcoholic drinks markets. The bottom three are the second-hand
cars, meat and meat products and fruit and vegetables markets.
122
Please note Croatia was not included in the survey before 2013 – no trend data are available.

EN 110 Error! No document variable supplied. EN
The alcoholic drinks market is rated in 26th position across the EU28. The fuel for vehicles,
dairy products, and clothing and footwear markets are assessed in 27th place. All of the
following markets are assessed in 28th
position across the EU28: second-hand cars; non-
alcoholic drinks; new cars; non-prescription medicines; maintenance products; meat and meat
products; spectacles and lenses; books, magazines and newspapers; fruit and vegetables;
furniture and furnishings; ICT products; entertainment goods; large household appliances;
electronic products; small household appliances; bread, cereals, rice and pasta; and personal
care products.
On an individual level, all goods markets in Croatia perform worse than the EU28 average,
with the market for fruit and vegetables and the market for dairy products both performing
particularly poorly. These two markets also score lowest for trust and expectations. In terms
of performance components, every goods market in Croatia shows a lower score compared to
the EU28 average in respect of comparability and trust. In addition, the majority of goods
markets in Croatia score worse than average in terms of expectations and the levels of
problems and complaints. The markets for ICT products and maintenance products have the
highest proportion of consumer complaints.
Services Markets
Overall, the top three services markets in Croatia are the culture and entertainment, personal
care services and airline services markets. The bottom three are the mortgages, investment
products, private pensions and securities and real estate services markets.
The following markets are all rated in 26th position across the EU28: electricity services;
holiday accommodation; internet provision; cafés, bars and restaurants; and postal services.
The markets assessed as being in 27th position are: water supply; investment products, private
pensions and securities; fixed telephone services; mobile telephone services; tram, local bus,
metro; and personal care services. The real estate services; legal and accountancy services;
TV-subscriptions; vehicle rental services; and maintenance services markets are all ranked in
28th position across the EU28.
The majority of services markets in Croatia perform worse than the EU28 average. The
services markets for TV subscriptions, legal and accountancy services, and water supply
perform particularly poorly. The market for TV subscriptions has very low scores for the trust
and expectations components in particular. The services markets with the highest volume of
problems are internet provision, mobile telephone services, and legal and accountancy
services.
MPI
Comparability
(Avg)Trust (Avg)
Expectations
(Avg)
Problems
(%)
Complaints
(%)Choice (Avg)
37 Airline services -0.9 -0.6* 0.2 0.1 1.4 -12.6* -0.9*
30 Vehicle insurance -1.3 -0.1 -0.4* 0 0.5 -15.8* 0.2*
60 On-line gambling services -2.1 -0.3* -0.2 -0.4* -1.2 6* -0.1
42 Commercial sport services -2.1 -0.5* -0.4* 0 0 -32.8* -0.5*
43 Culture and entertainment -2.2 -0.5* -0.2 -0.1 1.6 -11.3* -1*
MPIComparability
(Avg)Trust (Avg)
Expectations
(Avg)
Problems
(%)
Complaints
(%)Choice (Avg)
54 TV-subscriptions -12.4* -1.3* -1.9* -1.7* 2.4 -3.5 -0.5*
57 Legal and accountancy services -12.1* -1.2* -1.5* -1.2* 12.3* -9.5* -0.4*
1 Fruit and vegetables -11.9* -1.4* -2* -1.1* 4.5* -14.2* -0.4*
55 Dairy products -11.6* -1.3* -1.8* -1.1* 5.9* -2.7 -0.3*
45 Water supply -11.3* -1.3* -1.7* -1* 8.5* -3.2
5 Bottom markets
(compared to EU28 Average)
Difference with EU28
5Top markets
(compared to EU28 Average)

EN 111 Error! No document variable supplied. EN
Italy
65,565,765,767,468,268,669,069,670,370,571,071,371,371,871,972,072,973,373,373,573,575,576,676,877,678,278,679,480,781,182,183,0
69,771,4
76,576,676,778,679,579,880,080,080,180,380,580,580,881,181,581,782,383,083,684,4
75,8
0.4-4.2*6.7*0.91.11.9-1.7-0.5-0.1
-0.40
0.40.71
2.7*0.41.8
2.4*2
3.3*3*
2.5*-2.4*-2.4*0.6
1.9*-1.6*0.9-0.2
-1.9*
21.3
-2.4*-2.2*1.30.20.2-0.60.10.3-0.81.7-0.6
10.8-0.70.5-0.4
01.50.8-0.9
0.3
-1.91
-4.1*0.20.1-0.40.21.31
-0.73*0.71.1
2.5*
-1.40.4*-0.3-0.41.2
-2.7*0.50.12*
2.1*0.70.4
1.7*1.1
1.9*2*
-0.7-0.71.41.31.40.9
0.8*1.2
2.4*1.10.6-0.80.70.7
1.9*1.3
1.5*1.11.50
-1.22.5*
0.6*
0.4-3*-0.62.2
3.2*
-2.8*-4.8*1.7
0.5
2.8*
-2.3
-2.9*-1.4*1.5
-3.6*
-2*
-22*1.1-0.4-1
-0.7-0.3-0.6-2*
-0.10.4-1.3-0.3-1.10.40.1
-2.4*-0.50.9-2*-0.21.40.60.5
-1.9*0.21.1
1.9*
-2.9*
-0.7*
-8.5*-6.3*-8.8*-3.2-1.3-2.1
-7.4*-4.9*-3.4-6*
-4.2*-2.7
-4.8*-2.6-2.2-2.8
-5.7*-2.9*-0.4-6*-0.9-2.12.71.8-3
-0.40
0.2-10
-0.9-0.8
-7.7*0.41.2-0.6
1-0.9-0.3-1.2-1.4
1-1.10.2-0.2
10.6-0.5-1
-0.21.41.51.30
-1.8*
Bank accounts
Electricity services
Train services
Real estate services
Investment products, private pensions and…
Mortgages
Tram, local bus, metro
Water supply
Internet provision
Off-line gambling services
Gas services
TV-subscriptions
Fixed telephone services
Private life insurance
Mobile telephone services
On-line gambling services
Postal services
All services markets
Maintenance services
Vehicle insurance
Legal and accountancy services
Home insurance
Loans, credit and credit cards
Vehicle maintenance and repair
Airline services
Cafés, bars and restaurants
Vehicle rental services
Packaged holidays & tours
Commercial sport services
Holiday accommodation
Culture and entertainment
Personal care services
Fuel for vehicles
Second hand cars
Meat and meat products
Fruit and vegetables
Clothing and footwear
New cars
All goods markets
Dairy products
Alcoholic drinks
ICT products
Large household appliances
Non-prescription medicines
Personal care products
Maintenance products
Furniture and furnishings
Small household appliances
Non-alcoholic drinks
Bread, cereals, rice and pasta
Electronic products
Entertainment goods
Spectacles and lenses
Books, magazines and newspapers
All markets
expectations problems&complaints trust comparability 2013 - 2012
2012 - 2011
2011 - 2010
Country-EU28
MPI per market
S
E
R
V
I
C
E
S
G
O
O
D
S
Overall Performance
On average, consumer markets' performance, as assessed by Italian consumers should be
considered as stable, and the minor increase of 0.3 percentage points compared to 2012 is not
statistically significant. However, this average assessment is worse in Italy than in the EU28
as a whole (-1.8 percentage points).
Assessments of all goods markets and all services markets were also, on average, fairly stable
in Italy compared to 2012.
While the Italian services markets are assessed less positively than the EU28 as a whole, the
goods markets are broadly in line with the average.

EN 112 Error! No document variable supplied. EN
Goods Markets
Overall, the top three goods markets in Italy are the books, magazines and newspapers,
spectacles and lenses and entertainment goods markets. The bottom three are the fuel for
vehicles, second-hand cars and meat and meat products markets.
Looking at individual goods markets, the highest increase in performance assessment was in
the fuel for vehicles market which rose slightly, but not significantly, compared to 2012.
However, this market is still rated -7.7 percentage points lower than the EU28 average and is,
comparatively speaking, the poorest performing market. The non-prescription medicines
market improved by 1.7 points year-on-year, although this change is not statistically
significant, with an increase in the expectation component.
There were lower assessments of the meat and meat products market and the fruit and
vegetables market compared to 2012. Indeed, the meat and meat products market suffered a
fall in the comparability and trust components. This can potentially be linked with the
horsemeat scandal which was widely reported across Europe just prior to fieldwork
completion.
Entertainment and electronic goods are the markets in Italy which are assessed most
positively compared to the EU average. On the other hand, assessments of the fuel for
vehicles market in Italy are more negative than the EU28 average.
Services Markets
Overall, the top three services markets in Italy are the personal care services, culture and
entertainment and holiday accommodation markets. The bottom three are the bank accounts,
electricity services and train services markets. The Italian postal services and airline services
markets are both rated in 26th position across the EU28. The vehicle insurance and tram, local
bus, metro markets are assessed in 27th position.
The train services market shows an improvement in assessments since 2012, with an increase
of 6.7 percentage points. This increase could have been influenced by the entry of a new
operator (Nuovo Trasporto Viaggiatori) into the high-speed rail transport market (with a
positive impact in terms of prices and quality of service offered driven by augmented
competition)123
. Despite this increase in positive assessments, the train services market
remains the poorest performing service market in Italy compared to the EU28 average (23rd
position out of 26).
Other services markets which have improved since 2012 are the home insurance; packaged
holidays; vehicle maintenance; vehicle insurance; postal services; and loans, credit and credit
cards markets. On the other hand, the electricity services, airline services; personal care
services; commercial sports services; and cafés, bars and restaurants markets assessments
have deteriorated since 2012.
Compared to the EU28 average, in Italy, the services markets which perform comparatively
well are the loans, credit and credit cards and vehicle maintenance and repair services
markets; however none are significantly more positively than the EU28. A number of services
markets in Italy are assessed more negatively than the EU28 average: namely the train
services, bank accounts and tram, local bus, metro and underground services markets.
123
Il Sole (2012) Alta velocità e concorrenza: parte la sfida. Retrieved from:
http://www.ilsole24ore.com/art/impresa-e-territori/2012-04-24/alta-velocita-concorrenza-parte-
160359.shtml?uuid=AbHufzSF

EN 113 Error! No document variable supplied. EN
MPIComparability
(Avg)Trust (Avg)
Expectations
(Avg)
Problems
(%)
Complaints
(%)Choice (Avg)
36 Train services 6.7* 1.1* 0.5* 0.4* -8.7* -7.1*
29 Home insurance 3.3* 0.4* 0.7* 0.1 -0.8 -11.3* 0
58 Loans, credit and credit cards 3* 0.3 0.4* 0.3* -2.4 -2.4 0
31 Postal services 2.7* 0.4* 0.2 0.2 -3.4 9.5* 0.7*
23 Vehicle maintenance and repair 2.5* 0.1 0.2 0.1 -7* 2.6 0
MPIComparability
(Avg)Trust (Avg)
Expectations
(Avg)
Problems
(%)
Complaints
(%)Choice (Avg)
46 Electricity services -4.2* -0.8* -0.6* 0 3.7 5.6* -0.1
37 Airline services -2.4* -0.2 -0.4* -0.2 2.1 5.7 -0.3*
2 Meat and meat products -2.4* -0.5* -0.6* 0 -1.9 15.4* -0.1
41 Cafés, bars and restaurants -2.4* -0.4* -0.2 -0.1 2.9 2.2 -0.2
1 Fruit and vegetables -2.2* -0.5* -0.4* 0 0.6 0.1 -0.3*
Difference with 2012
Improved most since 2012
Deteriorated most since 2012
MPIComparability
(Avg)Trust (Avg)
Expectations
(Avg)
Problems
(%)
Complaints
(%)Choice (Avg)
58 Loans, credit and credit cards 2.7 0.4* 0 0.4* -3* 10.4* -0.9*
23 Vehicle maintenance and repair 1.8 0.3* 0 0 -6* 7.9* -0.7*
14 Entertainment goods 1.5 0.3* 0 0.1 -2.3* 13.7* -0.4*
10 Electronic products 1.4 0.3* 0 0.1 -2.4* 7.4* -0.6*
53 Spectacles and lenses 1.3 0.4* -0.2* 0.2* -2.1* -0.1 -0.9*
MPIComparability
(Avg)Trust (Avg)
Expectations
(Avg)
Problems
(%)
Complaints
(%)Choice (Avg)
36 Train services -8.8* -0.3* -1.4* -1.2* 7.3* -2.8
26 Bank accounts -8.5* -0.7* -1.8* -0.7* 2.1 6.9* -1.8*
17 Fuel for vehicles -7.7* -0.7* -1.3* -1.1* -0.2 4 -1.7*
35 Tram, local bus, metro -7.4* -0.3* -1.3* -1.1* 3.4* 1.7
46 Electricity services -6.3* -0.6* -1.2* -0.3* 4* 13.2* -0.1
5 Bottom markets
(compared to EU28 Average)
Difference with EU28
5Top markets
(compared to EU28 Average)

EN 114 Error! No document variable supplied. EN
Cyprus
90,290,8
70,773,274,675,476,277,778,879,179,379,379,480,581,282,282,284,384,584,584,785,185,385,385,486,086,886,986,988,1
83,283,685,485,785,886,286,286,586,987,187,287,287,587,687,688,388,888,988,989,289,891,6
84,3
9.5*12.5*6.9*4.9*
13.8*3.9*
7.2*4.4*6.7*
6.7*2.2
7.9*
7*7.7*8.5*7.2*4.4*3.9*7.1*5.5*
11.5*7.3*10*7.3*5.4*
12.4*12.8*4.7*
8.6*5.2*
17.4*3.4*6.6*5.8*7.5*4.9*6.6*5.2*7.3*7.8*5.5*7.6*3.7*8.7*7.6*7.3*7.3*5.8*9.8*
11.3*
7.2*
2.3
3.4*1.33.6*
-8.3*-0.2
-1.31.70.4
4.1*3.3*
-0.4
0.12.22.9
1.4*11.4*
2.30.7
3.4*-1.71.2-1.88.6*0.5
7.3*1
2.1
1.31
-4.6*1.6-0.5-0.1-1.43.7*2.4
4.4*1.3*-0.7-0.4
13.2*5.2*1.2
3.8*6.7*2.8*0.5
-4.4*
1.3*
-0.14.5* 7*
2.3
5.3*
6.1*1.4
-0.7
11.7*
2.91.92*
-5.2*2.20.9
5.1*5.3*
2.17.2*6.1*
3.1*6.4*
4.6*5.5*1.7
8.4*2.6
2.9*3.4*3.9*6.6*3.9*4.9*
1.62.3-1
6.5*1.21.4
5.5*1.6
5.7*
2.9*
4.7*
-3.9*
7.5*5.8*
-1.3-1.3
41
1.88.2*4
8.5*1.72.85.5*6.8*7.2*6*3.61.38.4*5.3*9.7*5.7*
11.3*9*
6.9*12*
13.1*5.2*
12.3*4.1
7.9*4.8*4.2
6.6*6.1*5.3*
11.6*8.1*7.5*5.9*5.2*6.8*5.6*
11.1*7.2*8*
13.2*6.7*9.5*7.2*
6.7*
Electricity services
Legal and accountancy services
Mortgages
Water supply
Private life insurance
Investment products, private pensions and…
On-line gambling services
Real estate services
Home insurance
Off-line gambling services
Loans, credit and credit cards
Maintenance services
Bank accounts
All services markets
Vehicle rental services
Culture and entertainment
Fixed telephone services
Packaged holidays & tours
Vehicle maintenance and repair
Vehicle insurance
Mobile telephone services
Tram, local bus, metro
Postal services
TV-subscriptions
Internet provision
Commercial sport services
Holiday accommodation
Airline services
Cafés, bars and restaurants
Personal care services
Second hand cars
Maintenance products
Fuel for vehicles
Dairy products
Entertainment goods
New cars
Non-prescription medicines
Large household appliances
Meat and meat products
ICT products
All goods markets
Alcoholic drinks
Spectacles and lenses
Personal care products
Bread, cereals, rice and pasta
Fruit and vegetables
Small household appliances
Electronic products
Clothing and footwear
Non-alcoholic drinks
Furniture and furnishings
Books, magazines and newspapers
All markets
expectations problems&complaints trust comparability 2013 - 2012
2012 - 2011
2011 - 2010
Country-EU28
MPI per market
S
E
R
V
I
C
E
S
G
O
O
D
S
Overall Performance
Cyprus’s consumer markets, on average, score higher than the EU28 – by 6.7 percentage
points; in addition, there has been a sharp rise in market performance since 2012 – by 7.2
points. Cyprus performs better for goods markets and services markets – compared both to
2012 and to the EU28 average.
Goods Markets
Overall, the top three goods markets in Cyprus are books, magazines and newspapers,
furniture and furnishings and non-alcoholic drinks. The bottom three are the second-hand
cars, maintenance products, and fuel for vehicles markets.

EN 115 Error! No document variable supplied. EN
The following Cypriot markets are all rated as the best performing across the EU28: non-
prescription medicines; non-alcoholic drinks; books, magazines and newspapers; furniture
and furnishings; electronic products; personal care products; clothing and footwear; fruit and
vegetables; ICT products; spectacles and lenses; new cars; small household appliances;
entertainment goods; large household appliances; second-hand cars; bread, cereals, rice and
pasta; and meat and meat products.
The alcoholic drinks, dairy products and maintenance products markets are all assessed as the
second best performing across the EU28, while the fuel for vehicles market is assessed as the
third best performing.
All the individual goods markets have improved their performance compared to 2012, in
particular the markets for fuel for vehicles and books, magazines and newspapers, driven by
greater comparability and higher expectations in both markets. Additionally, the fuel market
shows an increase in trust and decrease in the proportion of problems.
Other increases can be found in various other goods markets, notably: furniture and
furnishings; fruit and vegetables; second-hand cars; alcoholic drinks; small household
appliances; personal care products; non-prescription medicines; clothing and footwear;
electronic products; and meat and meat products. The two markets that have increased their
MPI score the least are the markets for dairy products and bread, cereals, rice and pasta.
All goods markets score higher than the EU28 average, with only the maintenance products
and entertainment goods markets showing a difference that is not statistically significant. The
top performing markets in this regard are those for clothing and footwear and second-hand
cars. In the market for clothing and footwear, this difference in performance is driven by a
better rating on all the components.
Services Markets
Overall, the top three services markets in Cyprus are the personal care services, cafés, bars
and restaurants and the airline services markets. The bottom three are the electricity services,
the legal and accountancy services and mortgages markets.
The Cypriot markets rated as the best performing across the EU28 are: airline services;
internet provision; TV-subscriptions; fixed telephone services; personal care services; tram,
local bus, metro; cafés, bars and restaurants; mobile telephone services; holiday
accommodation; vehicle maintenance and repair; packaged holidays & tours; and commercial
sport services. The postal services and real estate services markets are both assessed as the
second best performing across the EU28, while the maintenance services, vehicle insurance
and vehicle rental services markets are assessed as the third best performing.
Across the individual services markets, again, almost all score higher compared to 2012. The
markets for electricity services, internet provision and cafés, bars and restaurants show the
highest increases compared to 2012 results. Other markets that show an improvement are the
TV-subscriptions, vehicle maintenance and repair, mobile telephone services, personal care
services, bank accounts, maintenance services, tram, local bus, metro, vehicle insurance, fixed
telephone services and airline services markets. The home insurance market is the only one
that shows a not statistically significant increase.
In comparison with the EU28 results, almost all services markets are assessed more positively
in Cyprus. A total of 19 out of the 29 services markets have a higher rating than the EU28
average. The three best performing markets are those for internet provision, TV-subscriptions
and cafés, bars and restaurants. The higher MPI of the internet provision market is driven by
better scores for trust and expectations and a lower proportion of problems. For the TV-

EN 116 Error! No document variable supplied. EN
subscriptions market, a higher comparability score and a lower proportion of problems are the
main differences between Cyprus and the EU28.
The markets for legal and accountancy services, electricity services and water supply are
assessed least positively in comparison to the EU28 average; however, none of these
differences are statistically significant, and the market for water supply still outperforms the
EU28.
MPIComparability
(Avg)Trust (Avg)
Expectations
(Avg)
Problems
(%)
Complaints
(%)Choice (Avg)
17 Fuel for vehicles 17.4* 1.7* 3* 1.6* -8.5* -26.8* 0.6*
46 Electricity services 13.8* 2* 1.6* 0.9* -13.2* 1.9*
34 Internet provision 12.8* 1.7* 1.7* 1.1* -8.3* 5* 2.1*
41 Cafés, bars and restaurants 12.5* 1.1* 1.9* 1.4* -9* 5.3 0.2
54 TV-subscriptions 12.4* 1.7* 1.6* 0.9* -9.7* -19.4* 0.9*
MPIComparability
(Avg)Trust (Avg)
Expectations
(Avg)
Problems
(%)
Complaints
(%)Choice (Avg)
29 Home insurance 2.2 0.6* 0.4* 0 1.5 -21.3* 0.1
55 Dairy products 3.4* 0.7* 0.6* 0.1 -0.3 -16.8* 0.3*
3 Bread, cereals, rice and pasta 3.7* 0.5* 0.7* 0.2 -0.3 -18.1* 0.1
57 Legal and accountancy services 3.9* 0.8* 0.7* 0.2 0.3 6.9 -0.4*
43 Culture and entertainment 3.9* 0.1 0.7* 0.5* -3.5* 28* 0.6*
Difference with 2012
Improved most since 2012
Deteriorated most since 2012
MPIComparability
(Avg)Trust (Avg)
Expectations
(Avg)
Problems
(%)
Complaints
(%)Choice (Avg)
7 Clothing and footwear 13.2* 1.5* 1.7* 0.9* -15.3* -44.9* 0.7*
34 Internet provision 13.1* 1.1* 1.8* 1* -18.3* 13.6* 0.8*
16 Second hand cars 12.3* 1.1* 2.1* 0.9* -10.5* 6.6* 0.2*
54 TV-subscriptions 12* 1.2* 1.5* 0.9* -14.7* -4.5 0.9*
41 Cafés, bars and restaurants 11.7* 1.1* 1.7* 1.1* -10.4* 3.3 0.5*
MPIComparability
(Avg)Trust (Avg)
Expectations
(Avg)
Problems
(%)
Complaints
(%)Choice (Avg)
57 Legal and accountancy services -1.3 0 -0.2 -0.4* -1.6 -3 0
46 Electricity services -1.3 -0.2 0 -1.1* -10.4* 26.4*
45 Water supply 1 0 0.3* -0.5* -8.3* 5.7*
43 Culture and entertainment 1.3 -0.2 0.5* 0.2 -1.5 26.8* 0.2
29 Home insurance 1.7 0 0.6* 0 -1.8 -18.1* -0.2*
5 Bottom markets
(compared to EU28 Average)
Difference with EU28
5Top markets
(compared to EU28 Average)

EN 117 Error! No document variable supplied. EN
Latvia
64,668,669,0
73,674,074,374,475,375,476,477,478,879,179,279,779,880,180,380,380,580,781,581,982,282,382,984,084,084,384,486,587,7
67,571,4
76,076,7
80,580,980,981,381,481,482,182,883,183,183,283,283,383,383,783,783,7
86,2
79,6
-2.40.80.5
3.6*
4.7*5.4*2.7*-2.23.1*
1.5*-1.81.6
2.5*-2.5*-1.41.6
4.8*2.4*-1.71.7
3.1*1.4
2.2*0.9
1.7*2.9*2.7*4*3*
3.4*
12.4*4.3*3.6*2.6*3.1*3.3*3.5*3.2*2.9*4.5*1.13*0.53*
4.3*-0.21.3
7.1*3.3*9.6*0.7
2.1*
-0.91.10.1
2.6*
-1.8-1.10.2
-3.6*3.4*
-0.11.1-1.30.61
-0.5-3.4*0.80
-0.40.90.91.5-1
-0.8-0.30.11.40.1
-2.8*0.1
0.8-0.2
-2.1*-0.51.4
-0.6*-0.5-1.6-0.61.1-1.50.5-0.71.20.3
-2.3*-0.20.4-1.40.9
-4.2*-2.5*
-0.3
2.2-6.5*3.1*
5.2*-0.8-0.90.7
0.7*3*4*
-1.34.1*2.9*0.5
-0.6
2.1*0.80.7
2.3*1.3
3.5*1.8
3.1*1.2
3.3*
-11.5
2.7*-0.52.9*1.7*
0.32.5*2.1*2.3*2.2*1.60.81.91.8
0.31.21.10.10.9
1.1*
-9.8*-3.4-1.72.9-0.8-0.80.7
5.8*0.22.40.9
2.7*2.80.6
5.8*5.3*0.81.8
6.6*6*
4.6*7*3.41.61.1-0.12.310*6.7*
10.3*2.7
8.3*
-8.2*0.40.7-0.5
11.1*-0.11.10
1.80.50.42.31.9
4.2*1.61
1.33.5*2.8
6.2*1.8
2.1*
Water supply
Electricity services
Real estate services
Mortgages
On-line gambling services
Vehicle maintenance and repair
Maintenance services
Investment products, private pensions and…
Gas services
TV-subscriptions
Off-line gambling services
All services markets
Tram, local bus, metro
Vehicle rental services
Loans, credit and credit cards
Train services
Packaged holidays & tours
Postal services
Internet provision
Legal and accountancy services
Fixed telephone services
Private life insurance
Cafés, bars and restaurants
Airline services
Holiday accommodation
Culture and entertainment
Commercial sport services
Bank accounts
Home insurance
Mobile telephone services
Personal care services
Vehicle insurance
Clothing and footwear
Second hand cars
Meat and meat products
Fruit and vegetables
Maintenance products
All goods markets
Dairy products
Furniture and furnishings
Alcoholic drinks
New cars
Entertainment goods
Non-alcoholic drinks
Personal care products
Large household appliances
ICT products
Small household appliances
Spectacles and lenses
Bread, cereals, rice and pasta
Non-prescription medicines
Electronic products
Fuel for vehicles
Books, magazines and newspapers
All markets
expectations problems&complaints trust comparability 2013 - 2012
2012 - 2011
2011 - 2010
Country-EU28
MPI per market
S
E
R
V
I
C
E
S
G
O
O
D
S
Overall Performance
On average, the market performance assessments of Latvian consumers have improved since
2012 – showing a rise of 2.1 percentage points. Furthermore, Latvian markets are rated more
positively than the overall EU28 markets average (+2.1 percentage points).
Assessments of all goods markets were also more positive than in 2012 with an increase of
3.1 percentage points year-on-year. Latvian goods markets are, in addition, assessed more
positively than the EU28 average. Overall assessments of the services markets show an
improvement compared to 2012 (+1.5), as well as being higher than the EU28 average (+2.7).

EN 118 Error! No document variable supplied. EN
Goods Markets
Overall, the top three goods markets in Latvia are the books, magazines and newspapers, fuel
for vehicles, and electronic products markets. The bottom three are the clothing and footwear,
second-hand cars and meat and meat products markets. The ICT products market is rated as
the second best performing across the EU28, while the electronic products market is assessed
as the third best performing.
Looking at the individual goods markets, the biggest increases in performance assessments
since 2012 are seen in the fuel for vehicles and the non-prescription medicines markets, with
another 13 markets showing an improvement. Both of these markets show a more positive
assessment than the EU28 average. In addition, the ICT products market is rated more
positively in Latvia than the EU28.
Only the spectacles and lenses market showed a decrease in score when compared to 2012,
although this was not statistically significant. The only goods market in Latvia that is assessed
significantly less positive than the EU28 average is clothing and footwear.
Services Markets
Overall, the top three services markets in Latvia are the vehicle insurance, personal care
services, and mobile telephone services markets. The bottom three are the water supply,
electricity services, and real estate services markets.
The vehicle insurance, home insurance and bank accounts markets are all rated as the best
performing across the EU28. The private life insurance and mobile telephone services markets
are both assessed as the second best performing, while the internet provision market is
assessed as the third best performing. However, the water supply market is ranked in 26th
position across the EU28.
Across individual services markets in Latvia, there were statistically significant improvements
in assessments compared to 2012 in 16 markets. The biggest increases were noted in respect
of maintenance services, internet provision, and vehicle maintenance and repair services. The
only statistically significant decrease in assessments was noted in the train services market.
Overall, Latvia’s services markets are assessed more positively than the EU28 as a whole.
Eleven services markets in Latvia are rated more positively than the EU28 average. The top
rated are the mobile telephone services, bank accounts and vehicle insurance markets.
Overall, only the water supply market is rated significantly less positive in Latvia than the EU
average. Other relatively poor performers are the electricity services and real estate services
markets.
MPIComparability
(Avg)Trust (Avg)
Expectations
(Avg)
Problems
(%)
Complaints
(%)Choice (Avg)
17 Fuel for vehicles 9.6* 0 2* 1.3* -6.9* -37.6* 0.3
48 Non-prescription medicines 7.1* 0.5* 1.5* 0.6* -3.5* -43.8* 0.5*
21 Maintenance services 5.4* 0 0.6* 0.6* -10.8* -27.8* 0.4*
34 Internet provision 4.8* 0.1 0.8* 0.4* -7.1* -24* 0.2
23 Vehicle maintenance and repair 4.7* 0 0.9* 0.3* -9.2* -23.5* 0.1
MPIComparability
(Avg)Trust (Avg)
Expectations
(Avg)
Problems
(%)
Complaints
(%)Choice (Avg)
36 Train services -2.5* -1.1* 0 0 -0.6 -62*
45 Water supply -2.4 -2.1* 0.7* -0.1 -6.6* -13.7*
47 Gas services -2.2 -1.7* 0.7* 0 -1.9 -31.6* -0.9*
35 Tram, local bus, metro -1.8 -0.8* 0.2 -0.1 0 -22.5*
32 Fixed telephone services -1.7 -1* 0.3* -0.3 -2.7 -16.7* -1.4*
Difference with 2012
Improved most since 2012
Deteriorated most since 2012
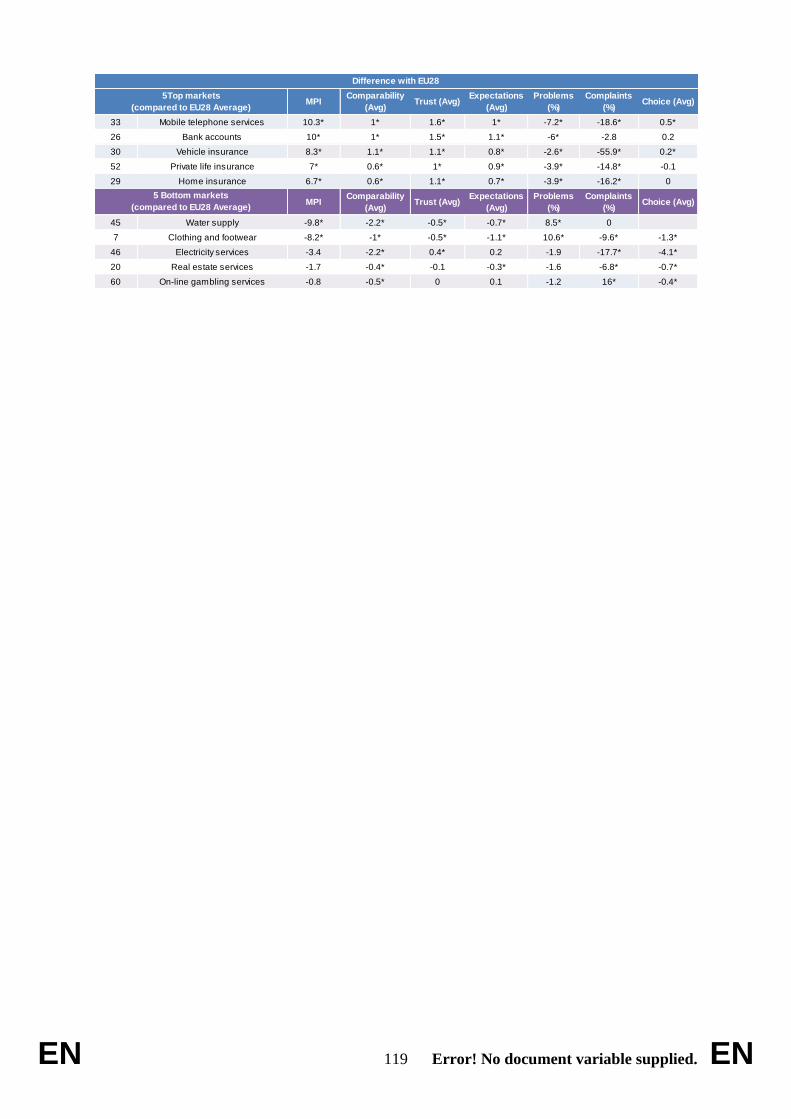
EN 119 Error! No document variable supplied. EN
MPIComparability
(Avg)Trust (Avg)
Expectations
(Avg)
Problems
(%)
Complaints
(%)Choice (Avg)
33 Mobile telephone services 10.3* 1* 1.6* 1* -7.2* -18.6* 0.5*
26 Bank accounts 10* 1* 1.5* 1.1* -6* -2.8 0.2
30 Vehicle insurance 8.3* 1.1* 1.1* 0.8* -2.6* -55.9* 0.2*
52 Private life insurance 7* 0.6* 1* 0.9* -3.9* -14.8* -0.1
29 Home insurance 6.7* 0.6* 1.1* 0.7* -3.9* -16.2* 0
MPIComparability
(Avg)Trust (Avg)
Expectations
(Avg)
Problems
(%)
Complaints
(%)Choice (Avg)
45 Water supply -9.8* -2.2* -0.5* -0.7* 8.5* 0
7 Clothing and footwear -8.2* -1* -0.5* -1.1* 10.6* -9.6* -1.3*
46 Electricity services -3.4 -2.2* 0.4* 0.2 -1.9 -17.7* -4.1*
20 Real estate services -1.7 -0.4* -0.1 -0.3* -1.6 -6.8* -0.7*
60 On-line gambling services -0.8 -0.5* 0 0.1 -1.2 16* -0.4*
5 Bottom markets
(compared to EU28 Average)
Difference with EU28
5Top markets
(compared to EU28 Average)

EN 120 Error! No document variable supplied. EN
Lithuania
68,368,4
71,072,372,572,973,674,976,177,077,077,778,278,479,780,280,681,081,682,983,583,583,683,884,284,485,085,186,287,488,789,7
63,471,3
74,174,8
78,078,479,479,779,779,880,080,780,881,281,381,582,082,583,283,283,2
88,9
79,6
0.32.21.1
-2.2
3.6*2.5*8.7*0.52.3
7.5*2.5*2.9*2.1*-0.42.2*1.21.6
2.2*3*
5.3*2.2*4.6*4.6*3.7*1.4
2.4*1.8*2.5*2.1*1.4
1.45.6*7.9*5.8*
-1-0.52.9*2.9*5.4*3.3*1.6
4.1*4.8*2.1
3.1*1.11.9
2.5*4.1*0.93*
1.9*
2.4*
1-1.61.7
3.1*
-0.93.7*1.50.5
4.1*1.7-1.5-0.4-0.11.4
-3.4*-0.9-0.8
-3.3*1
-2.5-0.8-0.4-1.10.91.5-0.5
-1.8*-2.5*-0.9-0.1
0.2-4.1*-6*
-2.5*-0.60.6
-2.2*-1.4
-2.8*-2.3*-1.7
-3.8*-4.4*-2.6*-0.81.3-2.1
-2.1*-5*-1.6-3*-0.9
-0.9*
-2.6*-1.8-0.2
-3.2*
0.5
-0.4
1.7-0.3-0.22.1*-0.7-0.21.2-1.11.51.35*0.4
-3.2*1.2-0.32.5*4.6*1.3-0.3
-1.4-0.7-0.7
-2.7*2*1.8
0.7*0.4-0.7
22.5*0.5
1.23.4*-0.60.4-1.4
0
0.90.1
0.1
-1.2-6.7*0.4
-4.2*-1.9-1.9-0.14.2*1.73.13
5.8*3.8*4.7*3.5*
12.17*2.9
6.5*2.3
7.5*6.1*9.8*9*
3.7*3.3*2.1
6.7*8.8*4.9*
15.2*
-7.6*-4.4*-1.2-2.4-1.5-1.8-0.3-0.42.30.4-1.6-0.1-0.22.2-0.30.60.80.51.81
0.84.5*
2*
Investment products, private pensions and…
Vehicle maintenance and repair
Real estate services
Off-line gambling services
Legal and accountancy services
On-line gambling services
Maintenance services
Mortgages
Water supply
Loans, credit and credit cards
TV-subscriptions
Electricity services
Private life insurance
Internet provision
All services markets
Packaged holidays & tours
Cafés, bars and restaurants
Bank accounts
Vehicle rental services
Tram, local bus, metro
Holiday accommodation
Fixed telephone services
Home insurance
Mobile telephone services
Gas services
Airline services
Commercial sport services
Culture and entertainment
Vehicle insurance
Postal services
Personal care services
Train services
Second hand cars
Clothing and footwear
Meat and meat products
Fruit and vegetables
New cars
Furniture and furnishings
All goods markets
Non-prescription medicines
Fuel for vehicles
Maintenance products
Small household appliances
Personal care products
Dairy products
ICT products
Entertainment goods
Electronic products
Large household appliances
Bread, cereals, rice and pasta
Alcoholic drinks
Spectacles and lenses
Non-alcoholic drinks
Books, magazines and newspapers
All markets
expectations problems&complaints trust comparability 2013 - 2012
2012 - 2011
2011 - 2010
Country-EU28
MPI per market
S
E
R
V
I
C
E
S
G
O
O
D
S
Overall Performance
On average, the markets' performance as assessed by Lithuanian consumers has improved
since 2012 – showing a rise of 2.4 percentage points. Furthermore, Lithuanian markets are
rated above what can be observed in the whole EU28 (+2 percentage points).
Assessments of all goods markets were also more positive than in 2012, with an increase of
2.9 points year-on-year. This puts the goods markets in Lithuania broadly in line with the
EU28 average. Overall, assessments of the services markets show an improvement compared
to 2012 (a difference of 2.1 percentage points), as well as being more positive than the EU28
as a whole (a difference of 3.5 percentage points).
EN 121 Error! No document variable supplied. EN
Goods Markets
Overall, the top three goods markets in Lithuania are the books, magazines and newspapers,
non-alcoholic drinks and spectacles and lenses markets. The bottom three are the second-hand
cars, clothing and footwear and meat and meat products markets.
Lithuania’s books, magazines and newspapers market is rated as the second best performing
across the EU28, while the second-hand cars market is assessed in 26th position.
On an individual level, 13 market scores increased from last year, while none decreased in a
statistically significant manner. The highest increase in performance assessments was seen in
the meat and meat products market (+7.9) and the fruit and vegetables market (+5.8). No
individual goods market’s assessment decreased significantly compared to 2012. However
there were non-statistically significant declines in the new cars (-1) (led by a lowering of the
trust component), and the furniture and furnishings (-0.5) markets.
Compared to the EU28 average, the books, magazines and newspapers market is the only
goods market in Lithuania scoring more positively than the EU28 average. The fuel for
vehicles market is also assessed comparatively positively. However, the second-hand cars and
the clothing and footwear markets are assessed more negatively than the EU28 average.
Services Markets124
Overall, the top three services markets in Lithuania are the train services, personal care
services and postal services markets. The bottom three are the investment products, private
pensions and securities, vehicle maintenance and repair, and real estate services markets.
Lithuania’s train services and postal services are both rated as the best performing across the
EU28. The following are all assessed as the second best performing across the EU28: personal
care services; commercial sport services; gas services; fixed telephone services; vehicle
insurance; and tram, local bus, metro markets The holiday accommodation, mobile telephone
services, home insurance markets and airline services markets are assessed as the third best
performing. However, the vehicle maintenance and repair market is ranked in 26th position
across the EU28.
The water supply, electricity services and fixed telephone services markets have showed the
biggest improvement since 2012, while another 15 services markets saw an improvement in
score. With regard to the increase in positive assessments of the electricity market in
Lithuania, it is to be noted that from 2015 there will be no monopoly of electricity supply in
Lithuania and consumers will be able to select their energy provider. The largest supplier of
electricity in Lithuania is currently preparing for this change and is working on its image:
promotional campaigns have been run in the media and more investment has been made in
educational programmes, such as efficient electricity usage among consumers.
No service market in Lithuania showed a deterioration year-on-year. However, there were
non-statistically significant decreases in regard to positive assessments of the legal and
accountancy services and packaged holidays & tours markets.
Over 10 services markets in Lithuania are rated more positively than the EU28 average. The
top rated are the train services, mobile telephone services and, gas services markets. Only two
services markets are rated less positively than the EU28 average, vehicle maintenance and
repair services, and offline gambling and lottery services.
124
Please note that in some Member States it may be illegal, in accordance with national law, to offer
online gambling services. It does not necessarily mean that the consumers do not gamble online.
Therefore, the results for this market should be interpreted with care.

EN 122 Error! No document variable supplied. EN
MPIComparability
(Avg)Trust (Avg)
Expectations
(Avg)
Problems
(%)
Complaints
(%)Choice (Avg)
45 Water supply 8.7* 1.6* 0.6* 0.6* -7.5* -22.7*
2 Meat and meat products 7.9* 0.9* 0.9* 0.5* -10.9* -23.8* 0.4*
46 Electricity services 7.5* 1.7* 0.8* 0.1 -4.5 -12.4*
1 Fruit and vegetables 5.8* 0.8* 0.7* 0.5* -3.4 -20.4* 0.2
7 Clothing and footwear 5.6* 0.5* 0.7* 0.4* -7* -17.9* 0.3*
MPIComparability
(Avg)Trust (Avg)
Expectations
(Avg)
Problems
(%)
Complaints
(%)Choice (Avg)
57 Legal and accountancy services -2.2 -0.2 -0.2 -0.5* 2.5 -29.9* -0.1
15 New cars -1 0 -0.6* -0.1 -1.6 -31* 0
9 Furniture and furnishings -0.5 0.1 -0.2 0.1 3.8 -12* 0.1
40 Packaged holidays & tours -0.4 0.1 -0.1 -0.1 1.5 -16.7* 0.3*
28Investment products, private
pensions and securities0.3 0.1 0 -0.1 -1.2 -14.6* 0.2
Difference with 2012
Improved most since 2012
Deteriorated most since 2012
MPIComparability
(Avg)Trust (Avg)
Expectations
(Avg)
Problems
(%)
Complaints
(%)Choice (Avg)
36 Train services 15.2* 2.1* 1.5* 1.7* -11.9* -11.2*
33 Mobile telephone services 9.8* 1.6* 1.2* 1.1* 1.8 -18.8* 1.2*
47 Gas services 9* 2* 0.6* 0.8* -2.5* -3.6
31 Postal services 8.8* 1.7* 0.8* 0.9* -1.5 -3.8 1.7*
32 Fixed telephone services 7.5* 1.6* 1* 0.7* 4.4* -13.3* 0.2
MPIComparability
(Avg)Trust (Avg)
Expectations
(Avg)
Problems
(%)
Complaints
(%)Choice (Avg)
16 Second hand cars -7.6* -0.5* -1.1* -0.6* 15.8* -17* -0.2
23 Vehicle maintenance and repair -6.7* -0.1 -0.7* -0.7* 17.9* -10.7* 0.1
7 Clothing and footwear -4.4* -0.2 -0.3* -0.4* 14.8* -5.8* -0.3*
59 Off-line gambling services -4.2* 0.4* -0.6* -1.4* 1.1 0.8 0.6*
1 Fruit and vegetables -2.4 0.2* -0.4* 0 12.7* -5.8* 0.1
5 Bottom markets
(compared to EU28 Average)
Difference with EU28
5Top markets
(compared to EU28 Average)

EN 123 Error! No document variable supplied. EN
Luxembourg
78,478,879,479,779,780,280,280,280,380,480,580,580,680,981,181,181,281,281,281,381,381,782,482,682,682,782,782,783,183,183,684,0
80,781,081,181,282,182,582,882,882,983,283,383,583,783,883,884,084,185,285,686,186,886,9
82,1
0.8-4*-0.7-1.60.1-0.41.4-1.7-1.41.6-0.3
-2.9*-2.4*1.8
0.2-0.3
1-0.1
-0.51.31
0.41.7
3.4*0.60.310
-0.3-1
-1.10.7-3*-1.9-0.2-3*1.90
-2.7*-0.8-2*-0.31.7-0.5
10.5-0.3-0.20.21.11.41.3
-0.2
2.75*2.61
-3.8*0.61.8
8.5*6.5*
-16.1*4.2*3.5*0.2
0.80.10
2*
0.91.4-0.23*0.5
6.6*0.41.20.41.5-0.11.5
0.3-0.64.2*
01.2
5.7*0.30.1
1.8*2
5.9*2.9*0.66*
2.9*2.1*1.2
8.3*2*
10.3*3.3*4.5*
2.4*
7.3*-1.23.1*0.9
2.4*
7.2*1
-2.6
-1.3
6.5*
-11.4
4.4*2*
1.60.5
2.9*1.1
3.5*1.8
4.1*2.6*3*1.60.7
5*6.2*0.9-0.43.2*0.63*
0.82.1
-2.8*2*
2.8*2
1.93.1*4*0.41.7-1.5
0.6
2*
7.7*4.8
5.7*4.42.2
9.5*10.7*6.2*8.3*6*
6.5*6.1*6.1*5.8*6.3*2.60
2.65.1*4.85*
7.2*8.4*
43.29*
6.6*2.13.81.4-0.1
1
1.210*0.93.72.51.83.90.6-1.5
22
3.8*2.8
8.5*3.62.52.58*3.2
10.4*5.9*5*
4.5*
Real estate services
Bank accounts
Maintenance services
Gas services
Home insurance
Mortgages
Investment products, private pensions and…
Mobile telephone services
Electricity services
Private life insurance
TV-subscriptions
Water supply
Legal and accountancy services
Vehicle maintenance and repair
On-line gambling services
Postal services
Holiday accommodation
Vehicle rental services
All services markets
Off-line gambling services
Tram, local bus, metro
Train services
Loans, credit and credit cards
Cafés, bars and restaurants
Vehicle insurance
Internet provision
Fixed telephone services
Airline services
Packaged holidays & tours
Commercial sport services
Personal care services
Culture and entertainment
Maintenance products
Second hand cars
Non-prescription medicines
Fuel for vehicles
New cars
Personal care products
ICT products
Spectacles and lenses
Books, magazines and newspapers
Large household appliances
Alcoholic drinks
All goods markets
Electronic products
Meat and meat products
Furniture and furnishings
Entertainment goods
Small household appliances
Fruit and vegetables
Non-alcoholic drinks
Clothing and footwear
Dairy products
Bread, cereals, rice and pasta
All markets
expectations problems&complaints trust comparability 2013 - 2012
2012 - 2011
2011 - 2010
Country-EU28
MPI per market
S
E
R
V
I
C
E
S
G
O
O
D
S
Overall Performance
On average, Luxembourg consumers’ market performance assessments were stable compared
to 2012, with a minor, non-significant decrease of 0.2 percentage points. However, market
performance assessments are more positive in Luxembourg than the EU28 average (an
increase of +4.5 percentage points).
Assessments of all goods markets were also largely stable in Luxembourg, with a non-
statistically significant decrease of 0.3 percentage points compared to 2012; in addition, they
are assessed more positively than the EU28 average (+3.8 points,). Overall assessments of the
services markets remained stable in comparison to 2012 (-0.1 percentage points). However,
Luxembourg’s services markets are rated more positively than the EU28 as a whole (+5.1
points).

EN 124 Error! No document variable supplied. EN
Goods Markets
Overall, the top three goods markets in Luxembourg are the bread, cereals, rice and pasta,
dairy products, and clothing and footwear markets. The bottom three are the maintenance
products, second-hand cars and non-prescription medicines markets.
The dairy products market is rated as the best performing across the EU28. The following
markets are all assessed as the second best performing: electronic products; bread, cereals,
rice and pasta; meat and meat products; furniture and furnishings; and fruit and vegetables.
Meanwhile the ICT products; non-alcoholic drinks; clothing and footwear; small household
appliances; and second-hand cars markets are assessed as the third best performing.
Looking across individual goods markets, there were some statistically significant changes in
assessments compared to 2012. The personal care services, alcoholic drinks and non-
prescription medicines markets showed a decrease.
In Luxembourg, the clothing and footwear market and the second-hand cars market are rated
more positively than the EU28 average. Only the books, magazines and newspapers market is
rated lower than the EU28 average.
Services Markets
Overall, the top three services markets in Luxembourg are the culture and entertainment,
personal care services and commercial sport services markets. The bottom three are the real
estate services, bank accounts and maintenance services markets.
The online gambling and betting services market is rated as the best performing across the
EU28. The internet provision and investment products, private pensions and securities
markets are both assessed as the second best performing across the EU28. The following
markets are assessed as third best performing across the EU28: gas services; fixed telephone
services; private life insurance; electricity services; cafés, bars and restaurants; packaged
holidays & tours; mortgages; loans, credit and credit cards; real estate services; legal and
accountancy services; and vehicle maintenance and repair.
Across individual services markets, there were some statistically significant changes in
assessments compared to 2012. An increase was noted in positive assessments of the internet
provision market. Some less positive assessments were noted in the bank accounts, water
supply, and legal and accountancy services markets.
A total of 17 services markets in Luxembourg are assessed more positively than the EU28
average. The top performing markets in this regard are the investment products private
pensions and securities, mortgages and internet provision markets. No service market in
Luxembourg is assessed more poorly than the EU28 average. The personal care services
market ranks lowest in this regard, but is still in line with the EU28 average.

EN 125 Error! No document variable supplied. EN
MPIComparability
(Avg)Trust (Avg)
Expectations
(Avg)
Problems
(%)
Complaints
(%)Choice (Avg)
34 Internet provision 3.4* 0.6* 0.6* 0 -2.2 14.2* 0.3
13 ICT products 1.9 0.3 0.1 0.1 -3.7 -10.7* -0.2
23 Vehicle maintenance and repair 1.8 0 0.2 0 -7.1* -17.9* -0.3*
10 Electronic products 1.7 0.3* 0.1 0 -3.3 -34.9* -0.1
30 Vehicle insurance 1.7 0.6* 0.3 -0.3* -2.1 14.6* -0.3
MPIComparability
(Avg)Trust (Avg)
Expectations
(Avg)
Problems
(%)
Complaints
(%)Choice (Avg)
26 Bank accounts -4* -0.6* -0.5* -0.4* 1.9 2.2 -0.5*
19 Personal care products -3* -0.4* -0.4* -0.5* -0.8 -28.6* -0.3*
48 Non-prescription medicines -3* -0.4* -0.5* -0.4* -0.5 -35.5* -0.3*
45 Water supply -2.9* -0.2 -0.6* -0.3* 1.2 -13*
18 Books, magazines and newspapers -2.7* -0.3* -0.3 -0.5* 0.5 -22* -0.5*
Difference with 2012
Improved most since 2012
Deteriorated most since 2012
MPIComparability
(Avg)Trust (Avg)
Expectations
(Avg)
Problems
(%)
Complaints
(%)Choice (Avg)
28Investment products, private
pensions and securities10.7* 1.2* 1.5* 1* -8.4* 28.5* 0.3*
7 Clothing and footwear 10.4* 1* 1.2* 0.9* -14.1* -62.3* 0.5*
16 Second hand cars 10* 0.7* 1.9* 0.6* -11* -15.8* -0.3*
51 Mortgages 9.5* 1.1* 1.4* 1* -2.6 -41.3* 0.3*
34 Internet provision 9* 0.7* 1.1* 0.4* -18.6* 13.6* 0.4*
MPIComparability
(Avg)Trust (Avg)
Expectations
(Avg)
Problems
(%)
Complaints
(%)Choice (Avg)
18 Books, magazines and newspapers -1.5 -0.2* 0 -0.3* 1.3 -42.3* -0.4*
22 Personal care services -0.1 0 0.1 -0.3* -1.5 9.9* -0.6*
39 Holiday accommodation 0 -0.2 0 -0.1 -2.9* -8.4* -0.4*
53 Spectacles and lenses 0.6 0.2* 0.1 -0.2* -2.3 9.2* -0.4*
48 Non-prescription medicines 0.9 0.4* 0.2 -0.1 1.2 -25.1* -0.2*
5 Bottom markets
(compared to EU28 Average)
Difference with EU28
5Top markets
(compared to EU28 Average)

EN 126 Error! No document variable supplied. EN
Hungary
52,761,5
64,665,967,368,769,470,070,570,871,071,571,772,072,172,473,374,475,276,576,576,977,577,877,978,279,279,680,381,283,384,4
63,970,873,0
75,576,377,077,577,777,877,978,378,878,878,979,179,379,579,580,480,880,9
86,6
75,0
-1.6-6.3*-0.1
-4.9*1.8-0.8-1.5
-2.6*-0.4
-5.1*0.11.1
-3.1*-3.8*-1.3
-2.9*-2.2*-1.1
-5.5*
-2.5*0.9
-4.7*-2.9*-1.8-0.8
-2.9*-2.6*-3.6*
-0.5-4.3*
-1.5-1.3
-3.1*-2
-2.5*-1.5
-3.4*-2.7*-4.7*-3.3*-3.7*-2.4*-3.5*-6.2*-3.9*-2.4*-2.9*-4.7*
-13.3*-2.9*-3*
-2.4*
4.6*6.4*4.9*1.81
-0.95.8*5.9*5.6*
19.2*5.9*-2.43.7*4.8*-0.64.2*3.7*6.9*4.6*
0.54.2*5.2*-1.62.6*0.83*
2.7*1.8
4.3*4*
3.2*4.6*-0.52.11.5
2.5*4.8*3.7*4.5*5.8*5.6*3.2*4.6*5.6*5.8*3.3*2.5*6.2*1.61.3
3.7*6.9*
3.7*
-3.6*4.6*2.6*4.4*
0.3-3.6*
6.4*0.7-2.25.1*-0.4
-0.7*-4.2*1.2
3.2*-2.4*0.1
3.8*3.6*
2-1.70.76*
-0.22.9*
-4.9*-3.7*3.3*0.8
0.7-1.90.8*3*
-0.50.4-0.40.6
3.4*-1.74.2*2.2*3.6*
21.10.2
0
-17.9*-12.4*-4.9*-9.3*-3.4
-5.3*-5.1*-4.5*-3.2-3.2-3.5-0.4
-4.7*-3.1-2.4-1.3
-2.9*-3.21.21.70.5-2.3-1.1-2.9-1.5-0.5-1.9-2.11.8
4.7*0.30.6
-7*-5*-2.2-2
-4.6*-0.2-1.5
-2.1*-3.7*-1.6-1.9-2.4-2.8-1.8-1.8-2.1-2.5-0.6-1.91.2-1.52.3
-2.6*
Mortgages
Loans, credit and credit cards
Investment products, private pensions and…
Gas services
Real estate services
Bank accounts
Private life insurance
Train services
Maintenance services
TV-subscriptions
Legal and accountancy services
Electricity services
Tram, local bus, metro
Vehicle maintenance and repair
Water supply
Internet provision
All services markets
Home insurance
Mobile telephone services
On-line gambling services
Fixed telephone services
Packaged holidays & tours
Cafés, bars and restaurants
Airline services
Vehicle insurance
Vehicle rental services
Holiday accommodation
Commercial sport services
Postal services
Off-line gambling services
Culture and entertainment
Personal care services
Second hand cars
Clothing and footwear
Meat and meat products
Fuel for vehicles
Dairy products
Fruit and vegetables
ICT products
All goods markets
Entertainment goods
Maintenance products
Furniture and furnishings
Large household appliances
Small household appliances
Personal care products
Electronic products
Alcoholic drinks
Bread, cereals, rice and pasta
Non-prescription medicines
Spectacles and lenses
New cars
Non-alcoholic drinks
Books, magazines and newspapers
All markets
expectations problems&complaints trust comparability 2013 - 2012
2012 - 2011
2011 - 2010
Country-EU28
MPI per market
S
E
R
V
I
C
E
S
G
O
O
D
S
Overall Performance
Overall, Hungarian consumers are less positive in assessing their markets' performance with a
decrease of 2.4 points compared to 2012 after the sharp increase which had been seen
between 2011 and 2012 (+3.7 percentage points). Their assessment of the markets'
performance also tends to be below what is measured in the EU28, with a gap equal to 2.6
percentage points.
Assessments of all goods markets in Hungary showed on average a decrease of 2.7 percentage
points compared to 2012, with a performance index falling below the levels of the EU28 (a
gap equal to 2.1 percentage points). Overall, in the services markets, assessments were lower
(-2.2 percentage points). The Hungarian services markets are assessed less positively than in
the EU28 as a whole (-2.9 percentage points).

EN 127 Error! No document variable supplied. EN
Goods Markets
Overall, the top three goods markets in Hungary are the books, magazines and newspapers,
non-alcoholic drinks and new cars markets. The bottom three are the second-hand cars,
clothing and footwear and meat and meat products markets.
Hungary’s books, magazines and newspapers market is rated as the third best performing
across the EU28. The entertainment goods market is ranked in 26th position across the EU28.
Looking at individual goods markets, 15 saw a decrease in score from last year. The largest
drop in performance assessments was seen in the personal care products market, which fell by
6.2 percentage points compared to 2012. This was followed by a decrease in the non-
prescription medicines market’s score (-4.7 points).
On the positive side, there was an improvement in assessments of the new cars market, as
regards the comparability, trust and expectations components.
When looking at Hungarian goods markets against the EU28, we see that the majority of
markets (19) are assessed less positively than the EU28 average. The most poorly assessed in
this regard are the second-hand cars; and the clothing and footwear markets. There are,
however, two markets (books, magazines and newspapers and new cars) which have
outperformed the EU28 average; although not significantly.
Services Markets
Overall, the top three services markets in Hungary are personal care services, culture and
entertainment, and offline gambling and lottery services. The bottom three services markets
are the mortgages, loans, credit and credit cards and investment products, private pensions
and securities markets. The loans, credit and credit cards market is rated in 26th position
across the EU28, while the mortgages market is ranked in 27th position.
A general decline in assessments can be noted in almost all services markets in comparison to
2012, with 15 statistically significant decreases in score. The biggest decreases were noted in
the loans, credit and credit cards; the mobile telephone services; and the TV-subscriptions
markets. On the positive side, we can see non-statistically significant improvements in the real
estate services, electricity services and packaged holidays & tours markets.
While not showing a decrease from 2012, the mortgages market – the worst performing of all
markets in Hungary – dropped by a further 1.6 percentage points, now making it -17.9 points
lower than the EU28 average for this market. The loans, credit and credit cards market is also
far below the EU28 average. Gas services is another Hungarian market that fares particularly
poorly in comparison to the EU28 average.
Focusing on the largest improvements and decreases across all markets, the new cars market
has improved the most year-on-year; while the loans, credit and credit cards market has
shown the greatest deterioration.
In comparison to the EU28, we see that the offline gambling services market is the only
market assessed significantly more positively than the average. The mortgages market
compares the most negatively against the EU28 average.

EN 128 Error! No document variable supplied. EN
MPIComparability
(Avg)Trust (Avg)
Expectations
(Avg)
Problems
(%)
Complaints
(%)Choice (Avg)
15 New cars 3.3* 0.4* 0.4* 0.3* -1.2 -11.3* -0.2*
20 Real estate services 1.8 0.1 0.2 0.1 -3.7 -16.7* -0.2
46 Electricity services 1.1 0.3 0 0 -1 -15.3* -0.5
40 Packaged holidays & tours 0.9 0.2 0.5* -0.1 3.9 -9.3* 0
57 Legal and accountancy services 0.1 -0.2 0.3 -0.1 -1.2 -2.5 0.1
MPIComparability
(Avg)Trust (Avg)
Expectations
(Avg)
Problems
(%)
Complaints
(%)Choice (Avg)
58 Loans, credit and credit cards -6.3* -1.1* -0.5* -0.7* 4.8 -13.2* -0.3*
19 Personal care products -6.2* -0.8* -0.7* -0.8* 4.4* -17.5* -0.1
33 Mobile telephone services -5.5* -0.6* -0.5* -0.5* 7.2* -0.3 -0.3
54 TV-subscriptions -5.1* -0.5* -0.5* -0.8* 3.4 -8.9* -0.6*
47 Gas services -4.9* -0.7* -0.2 -0.7* 5.5* -9.5* -1*
Difference with 2012
Improved most since 2012
Deteriorated most since 2012
MPIComparability
(Avg)Trust (Avg)
Expectations
(Avg)
Problems
(%)
Complaints
(%)Choice (Avg)
59 Off-line gambling services 4.7* 0.4* 0.7* 0.8* 0.8 6.7* 0.8*
18 Books, magazines and newspapers 2.3 0.2 0.5* 0.3* 0 -4.4* 0.4*
31 Postal services 1.8 0.4* 0.4* 0 1.9 -7.7* 0.9*
60 On-line gambling services 1.7 0 0.5* 0.1 -1.5 1.6 0.5*
15 New cars 1.2 0.1 0.3* 0 0.9 -11.1* 0.5*
MPIComparability
(Avg)Trust (Avg)
Expectations
(Avg)
Problems
(%)
Complaints
(%)Choice (Avg)
51 Mortgages -17.9* -1.7* -2.4* -1.7* 19.9* 0 0.4*
58 Loans, credit and credit cards -12.4* -1.5* -1.3* -1.1* 15.1* -7.8* 0.6*
47 Gas services -9.3* -0.9* -0.6* -1.4* 12.5* -6.4* -0.4*
16 Second hand cars -7* -0.7* -1* -0.7* 7.5* -12.6* 0.6*
26 Bank accounts -5.3* -0.8* -0.5* -0.3* 7.2* -6.4* 0.7*
5 Bottom markets
(compared to EU28 Average)
Difference with EU28
5Top markets
(compared to EU28 Average)

EN 129 Error! No document variable supplied. EN
Malta
71,476,176,7
80,181,281,481,581,781,881,982,282,382,382,582,683,083,183,183,583,683,783,883,884,284,384,384,785,185,485,8
79,980,280,880,981,281,381,481,681,882,382,482,682,782,983,183,383,483,583,583,883,984,0
82,3
7.8*0.8
5.9*1.2
2.8*7.2*-2.2*6.3*3.4*1.3
4.2*0.67*
7.3*4.4*0.3
6.3*4.1*2*1.6
5.4*4.9*4.3*3.2*5.5*5.4*
10.2*3.9*
-4.3*0.8
-3.7*-5.2*-2.5*-6.1*-5.5*-0.2
-4.5*0.3
-4.5*3*
2.7*4.6*6.4*5*0
-0.62.6*6.7*5.3*5.5*
2.5*
-1.18.5*
3.1*3.1*
10.1*9.7*6.2*2.51.43*
2.5*0.7-0.33.4*2.4
3.4*0.9
4.8*2
3.7*1.51.2
5.6*0.2-1.8-0.10.20.1
3*2.5*3.1*6*
5.4*5.3*4.8*3.9*5.1*1.6*5.5*-3.2*-1.82.6*0.9
-3.4*0.7-0.30.1
-2.7*-1.8-3*
2.1*
9*13.8*
-1.1-1.38.9*
2.1
1.8-0.31.3*0.61
-2.9*
1.1-4.4*
12.20.50.9
3.3*2.6*3*
5.7*1
0.2-2
0.40.9
2.6*2.3*
0.5-0.31.8*1.8
5.6*2.2-1
-0.71.9
5.4*1.52.4
6.6*2.4
1.6*
-54.11.9
6.4*2.6
6.9*7.5*7.7*7.3*5.9*8.2*6.1*-1.4
11.9*13.1*12.3*9.2*3.74.31.9
5.1*5.2*6.2*9.8*3.11.3
9.6*11.4*4.8*9.3*
-1.50.70
3.75.5*-0.70.44.2
6.5*2.6*
01
3.71.7
12.1*2.43.3-0.93.34.32.21.7
4.7*
Tram, local bus, metro
Electricity services
On-line gambling services
Internet provision
Vehicle rental services
Water supply
TV-subscriptions
Bank accounts
Legal and accountancy services
Fixed telephone services
Mobile telephone services
All services markets
Personal care services
Real estate services
Investment products, private pensions and…
Mortgages
Loans, credit and credit cards
Vehicle insurance
Packaged holidays & tours
Commercial sport services
Cafés, bars and restaurants
Postal services
Home insurance
Private life insurance
Holiday accommodation
Culture and entertainment
Vehicle maintenance and repair
Maintenance services
Airline services
Off-line gambling services
Alcoholic drinks
New cars
Personal care products
Fruit and vegetables
Clothing and footwear
Bread, cereals, rice and pasta
Dairy products
Fuel for vehicles
Meat and meat products
All goods markets
Non-alcoholic drinks
Entertainment goods
ICT products
Large household appliances
Second hand cars
Electronic products
Non-prescription medicines
Books, magazines and newspapers
Furniture and furnishings
Maintenance products
Small household appliances
Spectacles and lenses
All markets
expectations problems&complaints trust comparability 2013 - 2012
2012 - 2011
2011 - 2010
Country-EU28
MPI per market
S
E
R
V
I
C
E
S
G
O
O
D
S
Overall Performance
In Malta, the markets' performance, as assessed by consumers, has improved since 2012 –
showing a rise of 2.5 percentage points, on average. Furthermore, Maltese markets are rated
more positively than those of the EU28 as a whole (+4.7 percentage points).
The assessment of all goods markets, on average, remained stable compared to 2012 and well
above the levels seen in the EU28 as a whole (difference equal to 2.6 percentage points).
Overall assessments of the services markets show an improvement compared to 2012 (+4.2
percentage points); they are also rated more positively than the EU28 average (+6.1
percentage points).

EN 130 Error! No document variable supplied. EN
Goods Markets
Overall, the top three goods markets in Malta are the spectacles and lenses, small household
appliances and maintenance products markets. The bottom three are the alcoholic drinks, new
cars, and personal care products markets. Malta’s maintenance products market is rated as the
best performing across the EU28. The second-hand cars market is assessed as the second best
performing, while the furniture and furnishings market is the third best performing across the
EU28.
Several goods markets showed a change between 2012 and 2013. Nine markets improved
from last year. The biggest increases were in the maintenance products and second-hand cars
markets. On the negative side, eight markets worsened, including sizeable drops in
assessments of the bread, cereals, rice and pasta and the dairy products markets.
The second-hand cars, the meat and meat products, and the clothing and footwear markets are
the only Maltese goods markets that are assessed significantly more positively than the EU
average.
Services Markets
Overall, the top three services markets in Malta are the offline gambling and lottery services,
airline services, and maintenance services markets.
The bottom three are the tram, local bus, metro, electricity services and online gambling and
betting services markets.
The following markets are all rated as the best performing across the EU28: private life
insurance; legal and accountancy services; loans, credit and credit cards; investment products,
private pensions and securities; maintenance services; offline gambling and lottery services;
mortgages and real estate.
The home insurance; cafés, bars and restaurants; airline services; holiday accommodation;
packaged holidays & tours; and vehicle maintenance and repair markets are assessed as the
second best performing, while the bank accounts, postal services and water supply markets
are assessed as the third best in the EU28.
Assessments improved for 20 markets, with the largest increases in the maintenance services;
tram, local bus, metro and underground services; and investment products, private pensions
and securities markets.
Across all services markets in Malta, only the bank accounts market has declined in
comparison to 2012 (-2.2 percentage points).
Comparing individual services markets in Malta with the EU28 as a whole, we see that a total
of 19 markets are assessed more positively than average. The top performing services markets
in this regard are investment products, private pensions and securities, mortgages and real
estate services.
On the negative side, only the tram, local bus, metro and underground services and personal
care services markets are assessed more negatively than the EU28; however, again, neither of
these results are statistically significant125.
125
Please note these values are not displayed due to a very low base size of fewer than 5 people.

EN 131 Error! No document variable supplied. EN
MPIComparability
(Avg)Trust (Avg)
Expectations
(Avg)
Problems
(%)
Complaints
(%)Choice (Avg)
21 Maintenance services 10.2* 1.2* 0.9* 1.2* -10.2* 16* 0.4*
35 Tram, local bus, metro 7.8* 0.9* 0.3 0.5* -17.4* 8*
28Investment products, private
pensions and securities7.3* 1.1* 0.4* 0.5* -10.1* 7* 0
54 TV-subscriptions 7.2* 0.9* 0.1 0.6* -13.7* 1 0.8*
20 Real estate services 7* 0.9* 0.3 1.1* -6.4* 5.6* -0.3
MPIComparability
(Avg)Trust (Avg)
Expectations
(Avg)
Problems
(%)
Complaints
(%)Choice (Avg)
3 Bread, cereals, rice and pasta -6.1* -0.5* -1* -1* -1.2 -51.7* -1.1*
55 Dairy products -5.5* -0.4* -0.9* -0.8* 0.9 (note) -1.1*
1 Fruit and vegetables -5.2* -0.6* -0.8* -0.8* -2.6* 35.6* -0.9*
5 Non-alcoholic drinks -4.5* -0.5* -0.6* -0.7* -0.6 (note) -1*
2 Meat and meat products -4.5* -0.4* -0.9* -0.7* -2.8* 39.5* -1*
Difference with 2012
Improved most since 2012
Deteriorated most since 2012
MPIComparability
(Avg)Trust (Avg)
Expectations
(Avg)
Problems
(%)
Complaints
(%)Choice (Avg)
28Investment products, private
pensions and securities13.1* 1.4* 1.7* 1.5* -9.9* 28.5* -0.1
51 Mortgages 12.3* 1.2* 1.8* 1.3* -8.7* 28.7* 0.3*
16 Second hand cars 12.1* 0.8* 2.3* 0.7* -14.3* 31.2* 0.1
20 Real estate services 11.9* 1* 1.8* 1* -13* 27.6* -0.1
21 Maintenance services 11.4* 1* 1.7* 0.8* -13.7* 20.5* 0.7*
MPIComparability
(Avg)Trust (Avg)
Expectations
(Avg)
Problems
(%)
Complaints
(%)Choice (Avg)
35 Tram, local bus, metro -5 -0.2 -0.4* -0.5* 8.7* 28.8*
6 Alcoholic drinks -1.5 -0.6* 0.6* -0.8* -2.8* -60.5* -1*
22 Personal care services -1.4 -0.4* 0.2 -0.6* -3.4* 33.7* -0.6*
18 Books, magazines and newspapers -0.9 -0.3* 0.2 -0.3* -1.5* -76* -0.4*
3 Bread, cereals, rice and pasta -0.7 -0.5* 0.4* -0.5* -5.1* -62.7* -0.8*
5 Bottom markets
(compared to EU28 Average)
Difference with EU28
5Top markets
(compared to EU28 Average)

EN 132 Error! No document variable supplied. EN
Netherlands
64,666,868,969,369,470,471,271,271,872,672,872,873,473,774,574,875,175,876,176,377,177,477,477,778,178,379,279,580,182,182,182,8
74,576,277,578,679,980,280,380,881,081,081,181,281,381,882,482,782,883,083,184,084,184,3
77,3
1.5
-0.3-2.8*
-0.31.61.5-0.2
-3.4*1.60.4
-2.7*1.9-0.1
-0.6*-1.6-0.20.70.31
-3.6*-0.9-0.4-0.7-1.30.40.10.6
1.3*-0.5-0.1
-0.2-2.7*1.7*0.80.80.4-0.1-0.9-0.60.31.20.11
-0.1-0.1-0.21.7*0.70.20.80.80.3
-0.3
-0.1
-2.9*1.5
1.50.3-0.1
-2.8*3.2*2.1*-1.82.5*-2.4*-0.90.10.90.61.10.6-0.20.7-1.10.2-0.2-0.1-0.8
0-0.20.1-0.3
0
0-0.7
-2.5*0.6-1.2-0.21.4*-0.30.2-0.20.60.7-1.1-0.5-0.40.50.2-0.7-0.2
-1.1*-0.31*
0
1
-1.7*
-0.20.30
0.40.6-2*
1.6*-0.8*
1.50.60.20.3-1.3-0.10.30.7
1.5*1.3*0.7-0.30.50.80.6
0.9-0.11.10.6
1.8*1.10.70.7
1.9*1.1*0.82*
2*
2.3*-1.2*1.6*0.31*0.20.7
0
-4.9*-8*
-5.6*-1.4
-7.1*-4
-2.9-2.5
-4.6*-1.3-1.22.1-0.6
-4.9*-1.5
-1.3*0.70.52.4
4.3*2
2.9-1.20.1-1.2-1.20.7-1.1-1.60.9-0.9-1
3.50.91.8-0.42.60.60.10.61.5
1.3*0.2-0.1-1
0.11.41.2
5.4*2.21.11.5-0.3
3
-0.3
Investment products, private pensions and…
On-line gambling services
Train services
Mortgages
Off-line gambling services
Private life insurance
Mobile telephone services
Internet provision
Tram, local bus, metro
Loans, credit and credit cards
TV-subscriptions
Real estate services
Bank accounts
Postal services
Fixed telephone services
All services markets
Legal and accountancy services
Gas services
Maintenance services
Electricity services
Vehicle maintenance and repair
Water supply
Vehicle rental services
Home insurance
Packaged holidays & tours
Vehicle insurance
Cafés, bars and restaurants
Airline services
Commercial sport services
Holiday accommodation
Culture and entertainment
Personal care services
Second hand cars
Meat and meat products
Clothing and footwear
ICT products
Fruit and vegetables
New cars
Furniture and furnishings
Non-prescription medicines
Maintenance products
All goods markets
Electronic products
Large household appliances
Spectacles and lenses
Small household appliances
Dairy products
Entertainment goods
Fuel for vehicles
Personal care products
Bread, cereals, rice and pasta
Non-alcoholic drinks
Books, magazines and newspapers
Alcoholic drinks
All markets
expectations problems&complaints trust comparability 2013 - 2012
2012 - 2011
2011 - 2010
Country-EU28
MPI per market
S
E
R
V
I
C
E
S
G
O
O
D
S
Overall Performance
In the Netherlands, the performance of consumer markets in 2013 was, on average, stable
compared to 2012, with a minor decrease of 0.3 percentage points. This is broadly in line with
the stability observed in the same year, in the EU28 (-0.3 percentage points).
Assessments of all goods markets were also largely stable in the Netherlands, with a minor,
non-significant, increase of 0.3 percentage points compared to 2012. However, the goods
markets in the Netherlands are assessed more positively than the EU28 average (+1.3 points).
The services markets in the Netherlands have shown a year-on-year decline (-6 points).
Moreover, the services markets show a decrease of -1.3 when compared to the EU28.
Goods Markets

EN 133 Error! No document variable supplied. EN
Overall, the top three goods markets in the Netherlands are the alcoholic drinks, books,
magazines and newspapers and non-alcoholic drinks markets. The bottom three are the
second-hand cars, meat and meat products and clothing and footwear markets.
Looking at individual goods markets, there were some changes in assessments compared to
2012. The biggest improvements were observed in the clothing and footwear and fuel for
vehicles markets. Conversely, the meat and meat products market deteriorated somewhat was
assessed more negatively year-on-year, reflecting a decline in the trust component for this
market.
The fuel for vehicles market, which is assessed 5.4 percentage points higher in the
Netherlands than across the EU, is the goods market that shows a significant difference from
the EU28 average. The second-hand car market is also assessed very positively in comparison
with the EU28. On the other hand, the spectacles and lenses and ICT products markets are
assessed the least positively in comparison with the EU28 average.
Services Markets126
Overall, the top three services markets in the Netherlands are the personal care services,
culture and entertainment and holiday accommodation markets. The bottom three are the
investment products, private pensions and securities, online gambling and betting services and
train services markets. The offline gambling and lottery services and online gambling and
betting services markets are both rated in 27th position across the EU28.
Assessments of the services markets in the Netherlands remain broadly stable in comparison
to 2012. An improvement was noted in assessments of the holiday accommodation market.
The water supply, loans, credit and credit cards, mortgages, and bank accounts markets are
assessed more negatively compared to 2012.
Only the electricity services market in the Netherlands is assessed more positively than the
EU28 average. The water supply and maintenance services markets also score well in
comparison with the EU28 average; however, neither result is statistically significant. On the
other hand, online gambling (-8 points), offline gambling (-7.1) and train services (-5.6) show
the worst scores among services markets.
MPIComparability
(Avg)Trust (Avg)
Expectations
(Avg)
Problems
(%)
Complaints
(%)Choice (Avg)
31 Postal services 1.9* 0.3* 0 0.2 -2.7 -5.3 0.1
7 Clothing and footwear 1.7* 0.2 0 0.1 -3.7 -3.8 0.2
17 Fuel for vehicles 1.7* 0.3* 0.2 0.2* 0.8 -7.5* -0.1
54 TV-subscriptions 1.6 0.3 0.3* 0.1 0.2 2.3 0.5*
33 Mobile telephone services 1.6 0.1 0.2 0 -5.5* 8.2* 0.1
MPIComparability
(Avg)Trust (Avg)
Expectations
(Avg)
Problems
(%)
Complaints
(%)Choice (Avg)
45 Water supply -3.6* -1* -0.3* -0.2 -0.1 -26.9*
58 Loans, credit and credit cards -3.4* -0.5* -0.4* -0.3* 1.7 2.3 -0.2
51 Mortgages -2.8* -0.4* -0.3* -0.3* 1.3 -10.2* -0.2
2 Meat and meat products -2.7* -0.1 -1* -0.1 -0.8 -14.4* 0
26 Bank accounts -2.7* -0.4* -0.5* -0.3* 0.9 -21.4* -0.1
Difference with 2012
Improved most since 2012
Deteriorated most since 2012
126
Please note that in some Member States it may be illegal, in accordance with national law, to offer
online gambling services. It does not necessarily mean that the consumers do not gamble online.
Therefore, the results for this market should be interpreted with care.

EN 134 Error! No document variable supplied. EN
MPIComparability
(Avg)Trust (Avg)
Expectations
(Avg)
Problems
(%)
Complaints
(%)Choice (Avg)
17 Fuel for vehicles 5.4* 0.3* 0.6* 0.9* -5.7* 6* 0.1
46 Electricity services 4.3* 0.4* 0.4* 0.8* -2.1 10.3* 2.2*
16 Second hand cars 3.5 0.7* 0.6* 0.2* 0.1 5.5* 0.2*
6 Alcoholic drinks 3 0.1 0.5* 0.4* -2.3* 11.6* -0.2*
45 Water supply 2.9 -0.8* 0.6* 0.8* -7.4* -18.9*
MPIComparability
(Avg)Trust (Avg)
Expectations
(Avg)
Problems
(%)
Complaints
(%)Choice (Avg)
60 On-line gambling services -8* -1* -1.4* -0.8* -0.3 18.7* -0.6*
59 Off-line gambling services -7.1* -0.8* -1.1* -0.7* 4.2* 7.7* -0.1
36 Train services -5.6* -0.8* -0.4* -0.3* 9.5* 9.3*
28Investment products, private
pensions and securities-4.9* -0.4* -0.6* -0.7* 2.7 2 -0.4*
31 Postal services -4.9* -0.6* -0.7* -0.3* 5* 1.7 0
5 Bottom markets
(compared to EU28 Average)
Difference with EU28
5Top markets
(compared to EU28 Average)

EN 135 Error! No document variable supplied. EN
Austria
67,067,269,070,871,071,371,471,972,072,874,074,574,975,275,376,376,877,078,078,279,079,279,379,679,980,080,682,082,282,8
86,186,4
71,474,574,675,276,177,778,680,981,281,281,681,882,783,183,583,784,084,685,185,486,186,6
78,2
2.20.20.50.6-0.7-0.7
0.51.91.9
2.2*0.22
0.10.9*1.7
2.8*0.40.70.51.50.10.6
2.5*2.6*0.51.8
2.3*-0.51.7*0.9
-0.34.8*-2.2*-2.4*-1.70.1-0.3-0.1-1.3-0.7-0.30.5
-1.7*-0.3-1.11.20.70.40.8-0.81.30.3
0.4
2.22
0.52.3*-0.9
0
1.1-2.32.4*-0.41.80.6
0.90.7*-0.30.4
4.4*2
0.11.20
0.3-0.35*
-1.4-0.5-1.11.9*-0.7-0.1
1.7-0.81.7-0.3-0.1-0.40.1
0.5*0.31.30.50.50.80.11.21.50.8-0.10.7
2.1*-2*0.9
0.6*
1.24.2*-1.6
1.3
3.3*-2.3*
1.80.22.2
0.3-1.21.1-1.71.1
2.9*
0.23*
2.6*0.7
2.7*2*1.4-0.24.1*0.6
0.6-2.9*-2.2*1.41.51.31.5
1.4*1.5
2.9*1
0.73*1.3
0.8-0.43.7*0.90.50.6
0.9*
-3.7-2.2
-5.1*0.2-3
-3.1-3.4-1.8
-6.5*-1.2-1.20.8-1.1-1.20.80.2-1.85.1*2.90.70.4
5.2*4.9*0.40.5
5.5*-0.10.3
5.8*1.62.3
3.4*
0.5-3
-1.1-0.1-1.1-1.3-1.61.2*0.51.70.71.60.71.92.6
4.2*2.73
3.5*3
1.74.3*
0.6*
Real estate services
Investment products, private pensions and…
Mobile telephone services
Mortgages
Bank accounts
Private life insurance
On-line gambling services
Internet provision
Postal services
TV-subscriptions
Gas services
Maintenance services
Fixed telephone services
Off-line gambling services
Legal and accountancy services
All services markets
Vehicle rental services
Electricity services
Vehicle maintenance and repair
Home insurance
Cafés, bars and restaurants
Loans, credit and credit cards
Water supply
Packaged holidays & tours
Vehicle insurance
Train services
Airline services
Commercial sport services
Tram, local bus, metro
Holiday accommodation
Personal care services
Culture and entertainment
Second hand cars
Fuel for vehicles
Clothing and footwear
Meat and meat products
Fruit and vegetables
ICT products
Non-prescription medicines
All goods markets
Personal care products
Maintenance products
Electronic products
Furniture and furnishings
Bread, cereals, rice and pasta
Large household appliances
Dairy products
New cars
Alcoholic drinks
Entertainment goods
Small household appliances
Non-alcoholic drinks
Books, magazines and newspapers
Spectacles and lenses
All markets
expectations problems&complaints trust comparability 2013 - 2012
2012 - 2011
2011 - 2010
Country-EU28
MPI per market
S
E
R
V
I
C
E
S
G
O
O
D
S
Overall Performance
Overall, Austrian consumers are more positive in their average assessment of markets'
performance than those in the whole EU28. This difference of 0.6 percentage points can
mainly be attributed to the goods markets, which show a performance well above that of the
EU28 (+1.2). In contrast, the difference between Austria and EU28 for the services markets is
not statistically significant. Compared to 2012, the change in average for all markets was not
statistically significant – the same is true for the changes in goods markets. However, this is
contrasted by the improvements in assessments of the services markets.
EN 136 Error! No document variable supplied. EN
Goods Markets
Overall, the top three goods markets in Austria are the spectacles and lenses, books,
magazines and newspapers and non-alcoholic drinks markets. The bottom three are the
second-hand cars, fuel for vehicles and clothing and footwear markets.
Austria’s spectacles and lenses, new cars, and small household appliances markets are all
rated as the second best performing across the EU28. The entertainment goods market is
assessed as the third best performing across the EU28.
Statistically significant changes from 2012 were recorded in some of the individual goods
markets. The only statistically significant increase in market performance scores can be found
in the fuel for vehicles market. The increase in MPI score in the fuel for vehicles market is
driven by higher ratings in the comparability, trust and expectations components. This
improvement can, potentially, be linked to the introduction of a new law by the Austrian
Government which implements fixed price corridors in the vehicle fuel market during
holidays periods. Furthermore in 2011 an online ‘fuel calculator’ was introduced to enable
consumers to compare prices at different filling stations. Since then the prices for fuel can be
raised just once a day at noon, and afterwards filling stations can exclusively lower the prices.
As these improvements appear to be effective, the Austrian Government decided in December
2013 to extend these activities until 2016.
The markets with the greatest decrease in scores are the meat and meat products; breads,
cereals, rice and pasta; and clothing and footwear markets. In the market for meat, a drop in
the trust component is probably linked to the horsemeat scandal which was widely covered in
the media across Europe just prior to the fieldwork taking place. In the clothing and footwear
market, comparability and expectations have worsened considerably, with the decline in
comparability being statistically significant.
The goods markets are performing better than in the EU28 as a whole. The spectacles and
lenses and new cars markets are evaluated comparatively more positively in Austria than on
average in the EU28. For both markets, the difference with the EU28 score is statistically
significant. The difference in performance in the spectacles and lenses market is linked to a
higher score for comparability and a lower proportion of problems, in spite of a higher than
average proportion of complaints. In the new cars market, the difference is driven by an
improvement in comparability. In addition, the market for small household appliances has a
higher MPI score than the EU28 average.
The fuel for vehicles and non-prescription medicine markets receive the lowest scores in
comparison with the EU28 average. The fuel for vehicles market scores particularly poorly in
comparison with the EU28 average on the expectations and trust components. In the market
for non-prescription medicines, a difference can be found for comparability. Other sizeable
differences can be found for expectations and complaints, which are higher in Austria than in
EU28.
Services Markets
Overall, the top three services markets in Austria are the culture and entertainment, personal
care services, and holiday accommodation markets. The bottom three are the real estate
services, investment products, private pensions and securities and mobile telephone services
markets.
Austria’s culture and entertainment market is rated as the second best performing across the
EU28, while the tram, local bus, metro market is rated as third best. However, the Austrian
postal services market is ranked in 27th position across the EU28.

EN 137 Error! No document variable supplied. EN
The following services markets, show better results compared to 2012: electricity services;
train services; tram, local bus and metro; personal care services; gas services; and vehicle
insurance. Some improvements in the comparability component are observed for the train
services and vehicle insurance markets. In the market for electricity services, there has been a
decrease in the proportion of complaints; in addition, the score for trust in this market has
increased.
The only (although non-statistically significant) decreases can be found in the bank accounts,
private life insurance and holiday accommodation markets. For these three markets, changes
can be found in the complaints component. However, for the bank accounts market there is a
decrease in the proportion of complaints; whereas the private life insurance and holiday
accommodation markets have seen an increase in complaints. Other sizeable decreases can be
found in the expectations component of the markets for bank accounts and holiday
accommodation; and for trust in the private life insurance market.
In comparison with the EU28 average, the assessment of the tram, local bus, metro, train
services and loans, credit and credit cards markets are more positive. Compared to the EU
average, more positive evaluations are noted for the trust and expectations components in the
tram, local bus and metro market. However, the proportion of complaints has also increased.
In the train services market all components except for problems and including the proportion
of complaints, are higher compared to EU28.
The markets for postal services, mobile telephone services and real estate services are
assessed least positively compared with the EU28 average but the difference is only
statistically significant for the first two markets.
MPIComparability
(Avg)Trust (Avg)
Expectations
(Avg)
Problems
(%)
Complaints
(%)Choice (Avg)
17 Fuel for vehicles 4.8* 0.5* 0.9* 0.6* 0.9 -11.2* 0.2
46 Electricity services 2.8* 0.3 0.4* 0.2 -0.4 -28.9* 0.1
36 Train services 2.6* 0.7* 0.1 0.2 -2.2 0.2
30 Vehicle insurance 2.5* 0.5* 0.3 0.2 -0.2 2.9 0.2
35 Tram, local bus, metro 2.3* 0.2 0.2 0.3* -3.2 3.9
MPIComparability
(Avg)Trust (Avg)
Expectations
(Avg)
Problems
(%)
Complaints
(%)Choice (Avg)
2 Meat and meat products -2.4* -0.3 -0.7* -0.1 -1.4 9.8* 0
7 Clothing and footwear -2.2* -0.3* -0.2 -0.2 0.9 7.9* -0.2
1 Fruit and vegetables -1.7 -0.3* -0.4* -0.2 -2.5 -19.7* -0.3*
3 Bread, cereals, rice and pasta -1.7* 0 -0.3* -0.2 1.9 19.8* -0.1
19 Personal care products -1.3 -0.2 0 -0.1 3.1* 29.2* 0
Difference with 2012
Improved most since 2012
Deteriorated most since 2012
MPIComparability
(Avg)Trust (Avg)
Expectations
(Avg)
Problems
(%)
Complaints
(%)Choice (Avg)
35 Tram, local bus, metro 5.8* 0.2 1.2* 0.8* -2.7 11.7*
36 Train services 5.5* 0.8* 0.8* 0.7* -0.7 13.7*
58 Loans, credit and credit cards 5.2* 0.2 0.9* 0.9* -2.7* 18.4* 0.5*
46 Electricity services 5.1* -0.2 0.7* 1.1* -5.6* -16.4* 0.9*
45 Water supply 4.9* -0.7* 0.8* 1.4* -5.4* -0.1
MPIComparability
(Avg)Trust (Avg)
Expectations
(Avg)
Problems
(%)
Complaints
(%)Choice (Avg)
31 Postal services -6.5* -1.2* -0.5* -0.1 10.4* 7.8* -0.1
33 Mobile telephone services -5.1* -1.2* -0.5* 0 3.2 10.9* 0.4*
20 Real estate services -3.7 -0.8* -0.5* 0 1.4 15.1* 0.2
60 On-line gambling services -3.4 -0.6* -0.3* -0.3* 0.9 30.3* 0.8*
52 Private life insurance -3.1 -0.6* -0.2 -0.2* 2.8* 6.2* 0.7*
5 Bottom markets
(compared to EU28 Average)
Difference with EU28
5Top markets
(compared to EU28 Average)

EN 138 Error! No document variable supplied. EN
Poland
64,765,767,167,868,269,669,970,671,071,371,872,072,372,674,074,274,474,674,775,475,576,176,376,877,077,777,980,081,181,883,383,6
63,969,370,972,8
76,977,077,977,978,379,179,480,280,380,380,681,281,381,682,082,683,285,5
75,8
1.1-0.7
1.72.7*0.30.7
4.4*-3*
-4.5*-2.4*-1.5-0.12.6*0.21
-0.1
1.4-2.2*2.9*0.40.80.3
2.7*2.3*0.21.20
1.41.9*-0.4
-0.6-0.7-1
2.4*1.30-1
0.1-0.1
-2.2*0.4-1.5
1-1.4-1.20.6-0.72*0.10.6-0.20.2
0.1
4.2*0.7
-0.2-0.71.91.80.12.22
4.4*3.6*0.8-0.30.8*0.12.2
-0.91.2-0.5-1.3-0.1-0.2
0-0.11.7-0.90.8-1.21.1-0.5
-1.3-1.4-0.4-1.50.10.20.9-1.50.21.61
1.20
1.71.6-0.21.7-1.10.31.10.6-0.3
0.5*
-6.8*-1.4
0.7-1.9
-2.5*-3.4*
-2.7*
-2.2
-1.1-1.9*
-2.8*
-0.11.7-2.40.1
-3.3*-1.5-0.1-1.2-1.80.70.3
-2.1*-0.6
0
2.2*-0.2-1.4-2
-2.6*0.70.3
0.21
0.3-0.91.4-1.3
0-0.7-1.2-0.84.3*-0.3
-0.2
-1*
-9.7*-3.7
-7.7*-2.8-2.4
-5.5*-3.8-1.4-2.9
-4.8*-2.2-1.7-2.1-1.4
-2.1*-0.30.4-1.90.2
-3.9*0.2-2.5
0-0.7-1.5-0.9-1.6-1.10.5-1.21.6-0.2
-7.1*-6*
-4.8*-4.7*-0.4-2.6-1.1-3
-1.4*-1.1-0.1-2.20.2-1-1
-0.80.40.80.51.30.91.1
-1.8*
Train services
Investment products, private pensions and…
On-line gambling services
Mortgages
Real estate services
Vehicle maintenance and repair
Maintenance services
Electricity services
Loans, credit and credit cards
Fixed telephone services
TV-subscriptions
Internet provision
Private life insurance
Bank accounts
All services markets
Legal and accountancy services
Mobile telephone services
Off-line gambling services
Water supply
Packaged holidays & tours
Gas services
Cafés, bars and restaurants
Tram, local bus, metro
Home insurance
Postal services
Vehicle rental services
Vehicle insurance
Holiday accommodation
Airline services
Culture and entertainment
Commercial sport services
Personal care services
Second hand cars
Meat and meat products
Clothing and footwear
Fuel for vehicles
Fruit and vegetables
New cars
ICT products
Dairy products
All goods markets
Furniture and furnishings
Maintenance products
Non-alcoholic drinks
Non-prescription medicines
Alcoholic drinks
Small household appliances
Bread, cereals, rice and pasta
Electronic products
Personal care products
Entertainment goods
Large household appliances
Spectacles and lenses
Books, magazines and newspapers
All markets
expectations problems&complaints trust comparability 2013 - 2012
2012 - 2011
2011 - 2010
Country-EU28
MPI per market
S
E
R
V
I
C
E
S
G
O
O
D
S
Overall Performance
Compared to 2012, the overall MPI score for Poland has remained stable. While the goods
markets show a small decrease, the services markets show some improvement; neither change
is, however, statistically significant.
The average performance of consumer markets in Poland is below what can be seen in the
EU28 (-1.8% percentage points). The same applies to both the goods markets (-1.4 percentage
points) and the services markets (-2.1 percentage points).
Goods Markets
Overall, the top three goods markets in Poland are the books, magazines and newspapers,
spectacles and lenses and large household appliances markets. The bottom three are the
second-hand cars, meat and meat products, and clothing and footwear markets.

EN 139 Error! No document variable supplied. EN
Year-on-year increases in performance scores can be observed for the markets for fuel for
vehicles and personal care products. The only market showing a statistically significant
decrease is furniture and furnishings.
Comparing the individual goods markets with the EU28, the markets for large household
appliances and books, magazines and newspapers are assessed higher than average; although,
again these differences are not significant. The market for large household appliances scores
higher than the EU28 average on the comparability, and choice components. The market for
books, magazines and newspapers scores higher than average for the expectations and
complaints components.
In comparison with the EU28 average, the markets for meat and meat products and second-
hand cars are evaluated most negatively in Poland. Both those markets score lower for trust
and expectations. The proportion of problems is higher than the EU average for the meat and
meat products market . The deterioration in assessments of the meat and meat products market
could be linked to the horsemeat scandal which was reported widely in Europe prior to
fieldwork in January 2013.127
Services Markets128
Overall, the top three services markets in Poland are the personal care services, commercial
sport services, and culture and entertainment markets. The bottom three are the train services,
investment products, private pensions and securities, and online gambling and betting services
markets. The packaged holidays & tours and online gambling and betting services markets
are rated in 26th position across the EU28.
On an individual level, the electricity services, gas services and postal services markets show
the most improvement compared to 2012 results, with another four markets increasing their
score significantly from last year. For the electricity services market, scores have improved
for the comparability, trust, expectations, complaints and choice components. For the gas
services market, scores have increased for comparability and choice.
The services markets with the largest decrease in scores are those for TV-subscriptions; loans,
credit and credit cards; packaged holidays; and fixed telephone services. In the TV-
subscriptions market, expectations and choice have worsened considerably. For the market for
loans, credit and credit cards, comparability is found to be poorer. In the fixed telephone
services market, scores have decreased for comparability and trust, combined with an increase
in the proportion of problems.
In comparison with the EU28, the assessments of the commercial sport services, airline
services and mobile telephone services markets are the most positive; however, none of these
increases are statistically significant. In the commercial sport services market, assessments of
the expectations component have improved. In the mobile telephone services market,
assessments of comparability and choice show an improvement.
The vehicle maintenance and repair, online gambling and betting services, and train services
markets show a negative difference compared to the EU28 average. In the vehicle
maintenance and repair market, differences can be found for expectations (below average) and
for the proportion of problems (above average). For the market for online gambling and
betting services we see that scores are below average, with a difference in comparability,
127
http://ec.europa.eu/food/food/horsemeat/ 128
Please note that in some Member States it may be illegal, in accordance with national law, to offer
online gambling services. It does not necessarily mean that the consumers do not gamble online.
Therefore, the results for this market should be interpreted with care.

EN 140 Error! No document variable supplied. EN
trust, expectations and choice. For the market for train services all components are below
average.
MPIComparability
(Avg)Trust (Avg)
Expectations
(Avg)
Problems
(%)
Complaints
(%)Choice (Avg)
46 Electricity services 4.4* 0.5* 0.5* 0.6* -1.1 -6.4* 0.8*
47 Gas services 2.9* 0.5* 0.2 0.3 -2.5 -0.5 0.5*
31 Postal services 2.7* 0.2 0.3* 0.3* -2.8 -2.9 0
20 Real estate services 2.7* 0.2 0.3 0.3* -4.1* 14.7* 0.3
26 Bank accounts 2.6* 0.2 0.4* 0.3* -1.5 12.2* 0.2
MPIComparability
(Avg)Trust (Avg)
Expectations
(Avg)
Problems
(%)
Complaints
(%)Choice (Avg)
32 Fixed telephone services -4.5* -0.3* -0.7* -0.3 5.6* 10.9* 0
58 Loans, credit and credit cards -3* -0.6* -0.3 -0.1 2.8 1.7 -0.1
54 TV-subscriptions -2.4* 0 -0.3 -0.2 6.4* 0.2 -0.2
9 Furniture and furnishings -2.2* -0.2 -0.2 -0.1 3.7* 9.6* 0
40 Packaged holidays & tours -2.2* -0.2 -0.7* 0 -0.4 6.7* -0.5*
Difference with 2012
Improved most since 2012
Deteriorated most since 2012
MPIComparability
(Avg)Trust (Avg)
Expectations
(Avg)
Problems
(%)
Complaints
(%)Choice (Avg)
42 Commercial sport services 1.6 0.2 0.1 0.3* -1.9* 10.3* -0.3*
11 Large household appliances 1.3 0.6* -0.3* 0.2* -0.9 2 0.5*
18 Books, magazines and newspapers 1.1 0.3* -0.1 0.2* -0.8 -14.1* 0.2
53 Spectacles and lenses 0.9 0.4* -0.2 0.2* 1.1 -1 0.2*
19 Personal care products 0.8 0.5* -0.2* 0.1 0.1 20.4* 0.4*
MPIComparability
(Avg)Trust (Avg)
Expectations
(Avg)
Problems
(%)
Complaints
(%)Choice (Avg)
36 Train services -9.7* -0.7* -1.5* -1.1* 7.1* 17.3*
60 On-line gambling services -7.7* -0.8* -1.4* -0.8* 1 9.8* -0.9*
16 Second hand cars -7.1* -0.2 -1.5* -0.8* 3.3 13* 0.1
2 Meat and meat products -6* 0.1 -1.2* -0.7* 7.3* 16.1* 0.2
23 Vehicle maintenance and repair -5.5* 0 -1.1* -0.6* 6.3* 8.3* -0.4*
5 Bottom markets
(compared to EU28 Average)
Difference with EU28
5Top markets
(compared to EU28 Average)

EN 141 Error! No document variable supplied. EN
Portugal
61,966,366,967,667,968,269,169,369,469,670,472,172,573,073,173,273,673,774,074,775,977,177,378,078,578,779,179,380,081,382,684,0
65,770,7
76,778,079,079,479,879,980,080,080,680,680,881,081,282,082,783,283,484,184,384,4
76,2
-4*3.1*-4.8*-1.7-0.5-0.5-1.6-1.5-0.91.2
-4.6*0
1.1-0.1-1.61.8-1.3-0.31.2-0.2-1.9-0.2
2.1*3.3*-1.91.20.8
0.62.1*-0.6
-2.5*1.6-0.40.20.90.4
-2.1*0.2-1.1
-1.9*0.51.20.9-0.7-0.5-0.60.70.61.2
2.8*2.6*0.2
-0.2
10
1.35.8*1.32
2.8*1.42.2-0.4-1.61.41
2.30.80.9-1.11*
-0.81.8
2.8*-0.5
0.2-1.50.80.20.9
0.9-0.30.2
1.40.31.50.51.20.60.8
0.8*1.10.50.31.11.22*1
1.5-0.20.80.3-0.50.41.3
0.9*
-3*
1.82.7*1.10.9-0.32.1-2*
1.13.9*3.2*
-0.50.4-1.91.1
2.8*3.6*
1.20.6
3.5*2.9*3.3*
1.9*1.4
2.4*
2.7*-0.82.3*2.7*2.6*2.4*2.4*2.7*4*
5.2*2.8*3.5*-0.51.8
2.5*1.5
3.9*
2.3*
2.9*0.5
1.4*
-8.8*-5.6*-7*
-6.4*-6.1*-1.2
-4.5*-4.4*-5.1*-1.1
-4.1*-2.3-2.6-3
-4.5*-1.3-2.8
-2.5*-1.20.6-3.6-1.42.5-0.6
0-1.9-2.6
03.50.1-0.40.2
-5.3*-6.7*-2.92.73.3-0.1-1.50.11
-1.50.43.40.7-0.30.41.11.10.91
3.12.30
-1.4*
Mortgages
Electricity services
Loans, credit and credit cards
TV-subscriptions
Bank accounts
Investment products, private pensions and…
Internet provision
Maintenance services
Water supply
Real estate services
Train services
Private life insurance
Vehicle maintenance and repair
Fixed telephone services
Home insurance
Legal and accountancy services
Tram, local bus, metro
All services markets
Gas services
Mobile telephone services
Vehicle insurance
Cafés, bars and restaurants
On-line gambling services
Vehicle rental services
Postal services
Airline services
Commercial sport services
Packaged holidays & tours
Off-line gambling services
Holiday accommodation
Culture and entertainment
Personal care services
Second hand cars
Fuel for vehicles
New cars
Meat and meat products
Clothing and footwear
Maintenance products
Alcoholic drinks
All goods markets
ICT products
Entertainment goods
Furniture and furnishings
Fruit and vegetables
Non-prescription medicines
Large household appliances
Personal care products
Electronic products
Small household appliances
Spectacles and lenses
Non-alcoholic drinks
Dairy products
Bread, cereals, rice and pasta
Books, magazines and newspapers
All markets
expectations problems&complaints trust comparability 2013 - 2012
2012 - 2011
2011 - 2010
Country-EU28
MPI per market
S
E
R
V
I
C
E
S
G
O
O
D
S
Overall Performance
Portugal’s overall MPI score has remained stable, with a very slight, non-significant decrease
of 0.2 points compared to 2012. Indeed, both the goods markets (+0.2 percentage points) and
services markets (-0.3) in Portugal are broadly stable year-on-year. The socio-economic and
financial difficulties that Portugal has gone through do not seem to have affected negatively
the performance of the markets evaluated.
The average MPI on all the markets is in Portugal 1.4 percentage points below what is seen in
the EU28. The difference is mainly to be attributed to the services markets for which the
country shows a negative gap of 2.5 percentage points relative to the whole EU. Conversely,
the average MPI for Portugal’s goods markets is basically in line with what is measured in the
EU28.

EN 142 Error! No document variable supplied. EN
Goods Markets
Overall, the top three goods markets in Portugal are books, magazines and newspapers; bread,
cereals, rice and pasta; and dairy products. The bottom three are the second-hand cars, fuel for
vehicles, and new cars markets. Problems related to quality of after-sales service, as well as
compliance with legal guarantees or non-conformities related to repairs could lie behind this
low evaluation.
Across the individual goods markets, the largest increases in market performance scores are
found in the dairy products and bread, cereals, rice and pasta markets. The markets with the
biggest decrease in scores are those for alcoholic drinks, entertainment goods and second-
hand cars.
The markets for fruit and vegetables and clothing and footwear are the best evaluated in
Portugal in comparison with the EU average; however, these differences are not statistically
significant. However, differences between the country and the EU are recorded for some MPI
components: the market for fruit and vegetables has higher scores for comparability and
expectations, and a lower proportion of problems while the clothing and footwear market
scores higher than the EU28 average on expectations and choice. The second-hand cars and
fuel for vehicles markets have the lowest assessments in comparison with the EU28. These
markets score worse than the EU as a whole on trust and expectations.
Services Markets
Overall, the top three services markets in Portugal are the personal care services, culture and
entertainment, and holiday accommodation markets. The bottom three are the mortgages,
electricity services and loans, and credit and credit cards markets. The commercial sport
services market is rated in 26th position across the EU28. The poor performance of the
mortgages market could be related to the socio-economic conditions of the population and the
high unemployment rate. The electricity market, while still among the poorest performing
markets, has seen a considerable increase in score, which could be linked to the recent
liberalisation.
On an individual level, the postal services; electricity services; vehicle rental services; and
culture and entertainment markets show the most improvement compared to 2012 results. In
the postal services and electricity services markets, the scores have increased for
comparability and choice. For the vehicle rental services market an increase in trust is also
observed.
The markets with the biggest decrease in scores from 2012 are those for mortgages, train
services and loans, credit and credit cards. For these markets there has been a lowering of
trust and expectations. The markets for train services and loans, credit and credit cards also
have a greater proportion of problems. Furthermore, in the mortgages market a decrease is
noted for comparability.
Compared to the EU28, the assessments of the markets for offline gambling and lottery
services, online gambling and betting services, and mobile telephone services are more
positive; however, these differences in score are not statistically significant. In the offline
gambling and lottery services market, the assessment is above the average for all components,
except for the problems component. The online gambling and betting services markets are
rated higher than average for comparability and expectations. In the mobile telephone services
market, an increase is noted for comparability and expectations components, while a decrease
is seen in the score for complaints.
The TV-subscriptions, loans, credit and credit cards, and mortgages markets show the lowest
MPI scores in comparison with the EU28. In the loans, credit and credit cards and mortgages

EN 143 Error! No document variable supplied. EN
markets, the scores for trust and expectations are below average. Furthermore, the mortgages
market also shows lower comparability scores, while the TV-subscriptions market has a
higher proportion of problems.
MPIComparability
(Avg)Trust (Avg)
Expectations
(Avg)
Problems
(%)
Complaints
(%)Choice (Avg)
31 Postal services 3.3* 0.7* 0.3 0.1 -3.9 12* 1*
46 Electricity services 3.1* 0.7* 0.2 0.7* 3.7 1.4 2.7*
55 Dairy products 2.8* 0.4* 0.3 0.4* -1.5 -10.6* -0.2
3 Bread, cereals, rice and pasta 2.6* 0.2 0.4* 0.3* -1.3 0.4 0
38 Vehicle rental services 2.1* 0.3* 0.3* 0.1 -2.3 7.5* 0.3
MPIComparability
(Avg)Trust (Avg)
Expectations
(Avg)
Problems
(%)
Complaints
(%)Choice (Avg)
58 Loans, credit and credit cards -4.8* -0.3 -0.7* -0.5* 5.2* 12.2* -0.1
36 Train services -4.6* -0.2 -0.6* -0.4* 8.3* 17.6*
51 Mortgages -4* -0.4* -0.6* -0.3* 3.1 1.5 -0.2
16 Second hand cars -2.5* -0.3* -0.4* -0.3 0.5 2.6 0
6 Alcoholic drinks -2.1* -0.1 -0.3* -0.3* 0.1 31.7* -0.1
Difference with 2012
Improved most since 2012
Deteriorated most since 2012
MPIComparability
(Avg)Trust (Avg)
Expectations
(Avg)
Problems
(%)
Complaints
(%)Choice (Avg)
59 Off-line gambling services 3.5 0.4* 0.3* 0.6* -0.6 -7.6* -0.3*
1 Fruit and vegetables 3.4 0.6* -0.1 0.5* -6* 1.6 0.3*
7 Clothing and footwear 3.3 0.5* 0 0.4* -3.9* -14.5* 0.4*
55 Dairy products 3.1 0.5* 0.1 0.4* -4.1* -12.9* 0.1
2 Meat and meat products 2.7 0.6* -0.1 0.3* -4.2* -11.3* 0.3*
MPIComparability
(Avg)Trust (Avg)
Expectations
(Avg)
Problems
(%)
Complaints
(%)Choice (Avg)
51 Mortgages -8.8* -0.6* -1.7* -0.8* 5.1* 2.6 -0.3*
58 Loans, credit and credit cards -7* -0.2 -1.5* -0.6* 5.2* 7.8* -0.1
17 Fuel for vehicles -6.7* -0.5* -1.7* -0.5* -1.2 4.8* -0.4*
54 TV-subscriptions -6.4* 0 -1.3* -0.1 13.5* 1.7 0.2
26 Bank accounts -6.1* -0.2 -1.6* -0.3* 4.8* -3.1 0
5 Bottom markets
(compared to EU28 Average)
Difference with EU28
5Top markets
(compared to EU28 Average)
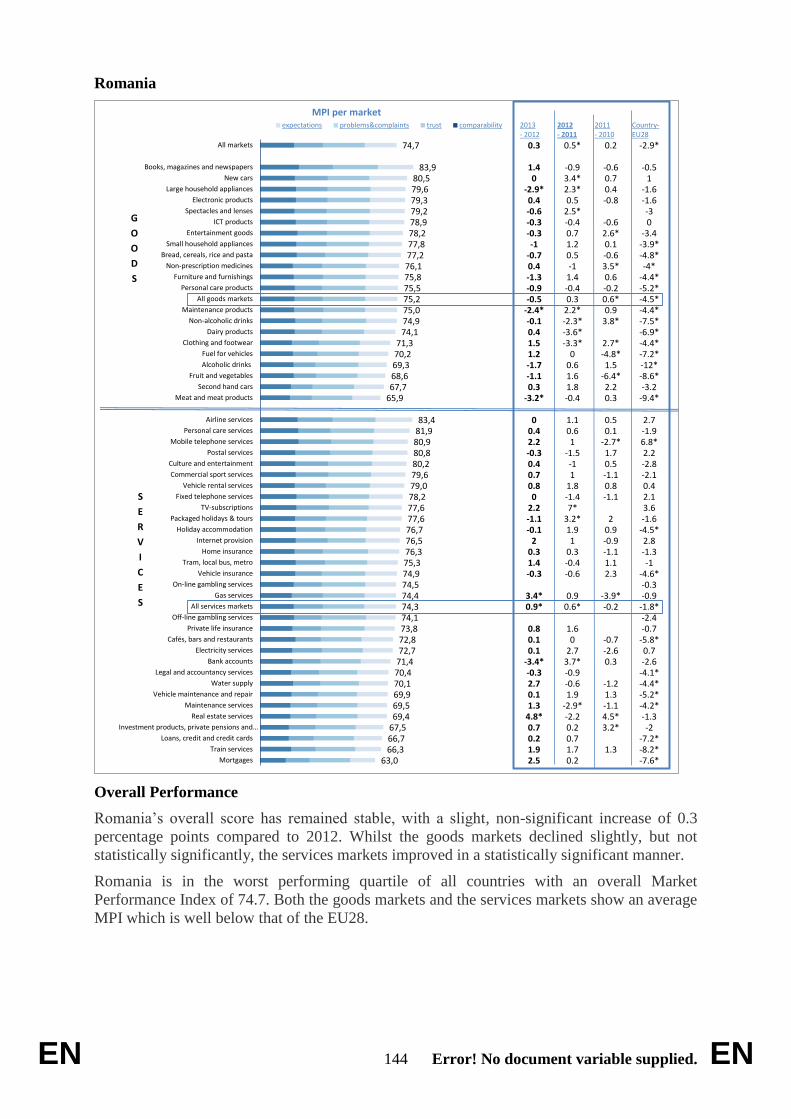
EN 144 Error! No document variable supplied. EN
Romania
63,066,366,767,569,469,569,970,170,471,472,772,873,874,174,374,474,574,975,376,376,576,777,677,678,279,079,680,280,880,981,983,4
65,967,768,669,370,271,3
74,174,975,075,275,575,876,177,277,878,278,979,279,379,680,5
83,9
74,7
2.51.90.20.7
4.8*1.30.12.7-0.3
-3.4*0.10.10.8
0.9*3.4*
-0.31.40.32
-0.1-1.12.20
0.80.70.4-0.32.20.40
-3.2*0.3-1.1-1.71.21.50.4-0.1
-2.4*-0.5-0.9-1.30.4-0.7-1
-0.3-0.3-0.60.4
-2.9*0
1.4
0.3
0.21.70.70.2-2.2
-2.9*1.9-0.6-0.93.7*2.70
1.6
0.6*0.9
-0.6-0.40.31
1.93.2*7*
-1.41.81-1
-1.51
0.61.1
-0.41.81.60.60
-3.3*-3.6*-2.3*2.2*0.3-0.41.4-1
0.51.20.7-0.42.5*0.5
2.3*3.4*-0.9
0.5*
1.3
3.2*4.5*-1.11.3-1.2
0.3-2.6-0.7
-0.2-3.9*
2.31.1-1.1-0.90.92
-1.10.8-1.10.51.7
-2.7*0.10.5
0.32.2
-6.4*1.5
-4.8*2.7*
3.8*0.9
0.6*-0.20.6
3.5*-0.60.1
2.6*-0.6
-0.80.40.7-0.6
0.2
-7.6*-8.2*-7.2*
-2-1.3
-4.2*-5.2*-4.4*-4.1*-2.60.7
-5.8*-0.7-2.4
-1.8*-0.9-0.3
-4.6*-1
-1.32.8
-4.5*-1.63.62.10.4-2.1-2.82.2
6.8*-1.92.7
-9.4*-3.2
-8.6*-12*-7.2*-4.4*-6.9*-7.5*-4.4*-4.5*-5.2*-4.4*-4*
-4.8*-3.9*-3.4
0-3
-1.6-1.6
1-0.5
-2.9*
Mortgages
Train services
Loans, credit and credit cards
Investment products, private pensions and…
Real estate services
Maintenance services
Vehicle maintenance and repair
Water supply
Legal and accountancy services
Bank accounts
Electricity services
Cafés, bars and restaurants
Private life insurance
Off-line gambling services
All services markets
Gas services
On-line gambling services
Vehicle insurance
Tram, local bus, metro
Home insurance
Internet provision
Holiday accommodation
Packaged holidays & tours
TV-subscriptions
Fixed telephone services
Vehicle rental services
Commercial sport services
Culture and entertainment
Postal services
Mobile telephone services
Personal care services
Airline services
Meat and meat products
Second hand cars
Fruit and vegetables
Alcoholic drinks
Fuel for vehicles
Clothing and footwear
Dairy products
Non-alcoholic drinks
Maintenance products
All goods markets
Personal care products
Furniture and furnishings
Non-prescription medicines
Bread, cereals, rice and pasta
Small household appliances
Entertainment goods
ICT products
Spectacles and lenses
Electronic products
Large household appliances
New cars
Books, magazines and newspapers
All markets
expectations problems&complaints trust comparability 2013 - 2012
2012 - 2011
2011 - 2010
Country-EU28
MPI per market
S
E
R
V
I
C
E
S
G
O
O
D
S
Overall Performance
Romania’s overall score has remained stable, with a slight, non-significant increase of 0.3
percentage points compared to 2012. Whilst the goods markets declined slightly, but not
statistically significantly, the services markets improved in a statistically significant manner.
Romania is in the worst performing quartile of all countries with an overall Market
Performance Index of 74.7. Both the goods markets and the services markets show an average
MPI which is well below that of the EU28.

EN 145 Error! No document variable supplied. EN
Goods Markets
Overall, the top three goods markets in Romania are the books, magazines and newspapers,
new cars and large household appliances markets. The bottom three goods markets are meat
and meat products, second-hand cars and fruit and vegetables.
The following markets are all rated in 26th position across the EU28: bread, cereals, rice and
pasta; dairy products; meat and meat products; small household appliances; spectacles and
lenses and maintenance products The fruit and vegetables; non-prescription; medicines; non-
alcoholic drinks; personal care products; furniture and furnishings; and alcoholic drinks
markets are all ranked in 27th position.
Across the individual goods markets, the largest increase in market performance scores can be
found in the clothing and footwear and books, magazines and newspapers markets, although
neither of these are statistically significant changes. The biggest decreases in scores are
observed in the large household appliances; meat and meat products; and maintenance
products markets.
The meat and meat products and alcoholic drinks markets show a difference in terms of MPI
relative to the EU28. For the meat and meat products market, a lower score is observed for
comparability, trust, expectations, complaints and choice. This market also shows a higher
proportion of problems encountered. In the alcoholic drinks market, a decrease in
comparability and trust is noted.
Services Markets
Overall, the top three services markets in Romania are the airline services, personal care
services and mobile telephone services markets. The bottom three are the mortgages, train
services and loans, credit and credit cards markets.
The holiday accommodation and vehicle insurance markets are both rated in 26th position
across the EU28. The cafés, bars and restaurants market is in 27th position.
On an individual level, real estate services and gas services markets show the most
improvement compared to 2012. For these markets the scores have showed differences for
trust. The real estate services market also shows increases in scores for comparability and
expectations, as well as a drop in the proportion of problems. In the gas services market, an
increased score is noted for comparability.
The services market with the biggest decrease in score compared to 2012 is the bank accounts
market. This market scores particularly poorly on trust and expectations with a decrease for
these components year-on-year.
In comparison with the EU28 results, the mobile telephone services, TV-subscriptions and
internet provision markets are assessed the best. The mobile telephone services market is,
indeed, rated higher than the EU28 average. For this market, more positive scores are
observed for all components, except for the expectations component.
The markets for loans, credit and credit cards, mortgages, and train services are assessed least
positively in comparison to the EU28 average. For these markets a lower score can be found
for the expectations component. The loans, credit and credit cards and mortgages markets are
also below average for the comparability component. Finally, in the train services market a
lowering of score is also noted for the trust component.

EN 146 Error! No document variable supplied. EN
MPIComparability
(Avg)Trust (Avg)
Expectations
(Avg)
Problems
(%)
Complaints
(%)Choice (Avg)
20 Real estate services 4.8* 0.3* 0.4* 0.6* -7.9* 2.6 0.2
47 Gas services 3.4* 0.5* 0.7* 0.2 0.1 2.5 -0.2
45 Water supply 2.7 0.2 0.4* 0.1 -3.6 -5.8
51 Mortgages 2.5 0.2 0.3 0.2 -4.7 4.6 0.1
33 Mobile telephone services 2.2 0.1 0.3 0.1 -6* 0.4 0
MPIComparability
(Avg)Trust (Avg)
Expectations
(Avg)
Problems
(%)
Complaints
(%)Choice (Avg)
26 Bank accounts -3.4* -0.2 -0.4* -0.4* 3.9 5.4 -0.2
2 Meat and meat products -3.2* -0.8* -0.5* -0.2 -2.8 -0.5 -0.2
11 Large household appliances -2.9* -0.4* -0.5* -0.3* 0.7 -30.5* -0.2
8 Maintenance products -2.4* -0.4* -0.3* -0.4* -3.4 9.8* -0.4*
6 Alcoholic drinks -1.7 -0.4* -0.2 -0.2 -2.7 5.2 0
Difference with 2012
Improved most since 2012
Deteriorated most since 2012
MPIComparability
(Avg)Trust (Avg)
Expectations
(Avg)
Problems
(%)
Complaints
(%)Choice (Avg)
33 Mobile telephone services 6.8* 1.4* 0.7* 0 -7.3* -21.5* 0.4*
54 TV-subscriptions 3.6 0.8* 0.4* 0 -1.7 -13.7* 0.4*
34 Internet provision 2.8 0.7* 0.4* 0.1 1.6 -14.2* -0.4*
37 Airline services 2.7 0.5* 0.4* 0.1 0 -20.2* 0
31 Postal services 2.2 0.6* 0.1 0 -1.3 -14.6* 0.4*
MPIComparability
(Avg)Trust (Avg)
Expectations
(Avg)
Problems
(%)
Complaints
(%)Choice (Avg)
6 Alcoholic drinks -12* -0.5* -2.1* -1.8* 4.8* -6.2* -0.2
2 Meat and meat products -9.4* -0.8* -1.5* -1.2* 5.2* -11.4* -0.3*
1 Fruit and vegetables -8.6* -0.3* -1.8* -1.3* 0.9 -9.3* -0.3*
36 Train services -8.2* -0.1 -1.5* -1.4* 5.4* -19.3*
51 Mortgages -7.6* -0.6* -0.8* -1.1* 6* 0.4 -0.3*
5 Bottom markets
(compared to EU28 Average)
Difference with EU28
5Top markets
(compared to EU28 Average)

EN 147 Error! No document variable supplied. EN
Slovenia
62,069,370,570,771,673,073,573,773,773,9
76,476,777,377,578,778,979,279,279,779,780,180,480,481,081,281,482,082,482,783,484,485,0
67,872,874,675,676,677,978,979,079,079,480,180,280,580,681,281,281,381,782,182,282,382,5
78,1
0.6-0.63.4*2.8*
-0.61.51.8-1.2-1.2
00.9
0.7*1
-0.21.7
2.5*2.3*0.9-0.84.1*
14*
-1.50.11.20.1-0.90.71.31.4
2-0.3-1
1.20.2-2*1.3
0.7*-0.31.70.50.60.40.31
-0.23.8*2.1*0.11.51.6-1
0.7*
-1.20.5
-5.9*-2.7*
6.3*-0.5-1.2
00.2-0.8-1.9-1*
-2.9*0.7
-2.3*-0.3-0.9
-2.1*-0.8
-4.2*-1.80.10.1
-1.9*-1.30.3
-2.6*-1.8*1.8-1.4
-4.1*-4.8*-4.5*-3.7*-3.5*0.7-1.5
-2.4*-3.4*-2.8*-3.5*0.2
-3.3*-1.9*
-1-1.9*-4.2*-3.2*-1.4
-2.3*-1
0.7
-1.6*
-2.4
5.5*
01
0.1-3.1*
-0.9*3*
-1.1-0.4
-3.4*0.62*
-1.80.4-1.3
-3.3*-2.9*2.4*-1.3-1.61.2
1.8*-2.8*
0
1.11.9
2.6*5*
4.4*3.5*0.7
2.5*3.5*1.2
-0.12.7*1.51.3
5.1*2*
2.6*0.8
2.2*-0.7
0.5*
-7.5*-5.1*-3.9
0-3.2-3.5-0.53.10
0.22.42.73.3
1.3*0.21.33.1
4.7*4.6*0.50.71.84*9*2.70.2
7.5*0.7-1
2.89.1*
2
-3.2-4.4*-0.6-0.1-3.5-1.6-1.3-0.7-3.4-1.4-0.81.2-0.4-0.7-0.1-0.31.70.1-2.20.2
4.8*0.2
0.5
Investment products, private pensions and…
Private life insurance
Legal and accountancy services
Real estate services
On-line gambling services
Off-line gambling services
TV-subscriptions
Mortgages
Maintenance services
Internet provision
Mobile telephone services
Bank accounts
Loans, credit and credit cards
All services markets
Cafés, bars and restaurants
Home insurance
Fixed telephone services
Water supply
Vehicle maintenance and repair
Packaged holidays & tours
Vehicle insurance
Vehicle rental services
Tram, local bus, metro
Electricity services
Postal services
Holiday accommodation
Train services
Commercial sport services
Personal care services
Airline services
Gas services
Culture and entertainment
Second hand cars
Fruit and vegetables
Meat and meat products
Clothing and footwear
Non-prescription medicines
Maintenance products
Furniture and furnishings
All goods markets
Non-alcoholic drinks
Personal care products
Dairy products
ICT products
Electronic products
Alcoholic drinks
Large household appliances
Entertainment goods
New cars
Small household appliances
Books, magazines and newspapers
Bread, cereals, rice and pasta
Fuel for vehicles
Spectacles and lenses
All markets
expectations problems&complaints trust comparability 2013 - 2012
2012 - 2011
2011 - 2010
Country-EU28
MPI per market
S
E
R
V
I
C
E
S
G
O
O
D
S
Overall Performance
Overall market performance is slightly, but not statistically significantly, higher in Slovenia
than the EU28 average. Slovenia’s overall score has increased by 0.7 points since 2012, to
some extent counteracting the 1.6 point decrease in score observed between 2011 and 2012.
At an overall group level, services markets in Slovenia score higher than the EU28 average,
whilst goods markets score slightly, but not statistically significantly, lower. In comparison to
2012, in Slovenia, both the goods and services markets showed year-on-year improvement.
Goods Markets
Overall, the top three goods markets in Slovenia are the spectacles and lenses, fuel for
vehicles and bread, cereals, rice and pasta markets. The bottom three are the second-hand cars
fruit and vegetables, and meat and meat products markets.

EN 148 Error! No document variable supplied. EN
In comparison to 2012, some of Slovenia’s goods markets have shown a change in their MPI.
The goods markets that have improved the most since 2012 are the markets for new cars and
small household appliances. Both markets have experienced a reduction in the number of
complaints; whilst the market for new cars also experienced an improvement scores for trust,
expectations and complaints. The market with the largest score decrease is the maintenance
products market. In comparison to 2012, maintenance products in Slovenia experienced a rise
in the percentage of problems and a lower comparability score.
When comparing Slovenia’s goods markets to the EU28 average, the only statistically
significant differences are observed for the fuel for vehicles market (positive) and for the fruit
and vegetables market (negative). The Slovenian market for fruit and vegetables scores worse
than average in terms of comparability, trust and expectations.
Services Markets
Overall, the top three services markets in Slovenia are culture and entertainment, gas services
and airline services. The bottom three are the investment products, private pensions and
securities, private life insurance and legal and accountancy services markets.
The gas services market is rated as the best performing across the EU28, while the electricity
services market is assessed as the second best, and the train services market the third best.
However, the private life insurance and the investment products, private pensions and
securities markets are ranked in 26th position across the EU28.
Some of Slovenia’s services markets have experienced changes in terms of market
performance since 2012. Improvements are seen in the markets for vehicle rental services;
electricity services; legal and accountancy services; real estate services; water supply; and
vehicle maintenance. The first three services markets have experienced increased competition
in the past year, which has led to lower prices and consumers switching service provider.
There are non-statistically significant declines in performance in the markets for postal
services, internet provision, and mobile telephone services. Looking at specific components,
the market for vehicle rental services improved in terms of comparability and expectations,
with a lower proportion of problems, and the market for electricity services increased its score
for comparability, trust and expectations.
In comparison to the EU28 average, Slovenia shows higher performance in the markets for
gas services, electricity services, train services, water supply, vehicle maintenance and repair,
and tram, local bus and metro services. At component level, all of these successfully
performing services markets score higher than the EU28 average for expectations and trust.
On the other hand, the markets for investment products and private life insurance perform
worse for Slovenia than in terms of the EU28 average. These two poorly performing services
markets have lower than average scores for comparability, trust and expectations, and a higher
proportion of problems.

EN 149 Error! No document variable supplied. EN
MPIComparability
(Avg)Trust (Avg)
Expectations
(Avg)
Problems
(%)
Complaints
(%)Choice (Avg)
38 Vehicle rental services 4.1* 0.5* 0.2 0.3* -8.7* -4.5 0.9*
46 Electricity services 4* 0.7* 0.4* 0.4* -1.5 5.2 0.2
15 New cars 3.8* 0.3 0.3* 0.5* -5.9* -5.6* 0.4*
57 Legal and accountancy services 3.4* 0.2 0.2 0.4* -7* -6.8* 0.4*
20 Real estate services 2.8* 0.4* 0.2 0.3 -3.4 -6.6* 0.5*
MPIComparability
(Avg)Trust (Avg)
Expectations
(Avg)
Problems
(%)
Complaints
(%)Choice (Avg)
8 Maintenance products -2* -0.4* -0.1 0 4.6* 0.2 -0.1
31 Postal services -1.5 -0.3 0 -0.2 2.5 -1.4 -0.1
34 Internet provision -1.2 0.1 -0.1 -0.1 4.9* -0.2 0.2
33 Mobile telephone services -1.2 -0.1 -0.1 0.1 4.2 10* 0.1
53 Spectacles and lenses -1 -0.4* 0.1 -0.2 -0.9 -15.3* 0
Difference with 2012
Improved most since 2012
Deteriorated most since 2012
MPIComparability
(Avg)Trust (Avg)
Expectations
(Avg)
Problems
(%)
Complaints
(%)Choice (Avg)
47 Gas services 9.1* 1.2* 1.1* 1.1* -2.5* -15* 1.6*
46 Electricity services 9* 1.2* 0.7* 1.3* -6.5* -7.7* 1.4*
36 Train services 7.5* 0.5* 0.9* 0.9* -10.6* -17.4*
17 Fuel for vehicles 4.8* 0.4* 0.7* 0.6* -2.1* -13.9* -0.2
45 Water supply 4.7* 0.7* 0.3* 0.7* -0.4 -13.7*
MPIComparability
(Avg)Trust (Avg)
Expectations
(Avg)
Problems
(%)
Complaints
(%)Choice (Avg)
28Investment products, private
pensions and securities-7.5* -0.6* -0.9* -1* 7.4* -1 0.4*
52 Private life insurance -5.1* -0.3* -0.7* -0.7* 5.6* -6.4* 0.6*
1 Fruit and vegetables -4.4* -0.5* -0.9* -0.4* -0.1 -3.5 0.2*
57 Legal and accountancy services -3.9 -0.4* -0.7* -0.3* 2.6 -0.3 0.5*
59 Off-line gambling services -3.5 -0.1 -0.2 -1.2* -1.7* -15.9* -0.1
5 Bottom markets
(compared to EU28 Average)
Difference with EU28
5Top markets
(compared to EU28 Average)

EN 150 Error! No document variable supplied. EN
Slovakia
65,067,0
70,170,471,272,172,274,474,574,775,275,575,775,875,876,076,376,377,978,178,378,979,279,780,080,281,081,281,382,082,682,9
65,565,868,0
71,176,276,977,478,178,278,378,478,979,279,379,479,780,881,181,381,582,4
84,9
76,7
0.4-0.30.61.71
-0.40.2-1.7
2.6*
-0.61.1-1.10.60.80.20
1.7-1.63.4*
10.70.40.40.3-20
-0.8-1.91.4-1.1
2.1-1.8
-3.8*-3.6*-2.6*
-1-1.1*
-23*0.3
2.5*-3.3*-2.5*-3.1*0.40.6
-2.5*-0.9
-2.9*0.20.5
-3.1*
-0.3
-2.1-0.80.6-2.2-1.6-0.8
-2.6*-0.6
-2.6*
2.3*-1.90.3-2*
-2.7*-1.1*0.6
-3.8*0.9-0.7-0.7
-2.6*-1.5-0.60.7-1.53.4*0.6-1
-2.7*-0.1
-1.9-2
-0.2-1.3-1.6-0.7
-1.2*-1.3
-2.5*-0.7
-3.9*0.6-1.1-1.20.3
-2.8*0.5-0.5-0.9-1.2-1.7-1.3
-1.1*
2.9*1.7-0.8
-1.6
1.9
3.6*2.6*3*
2.9*1.1*0.8
4.7*0.8
3.4*2.9*0.10.53*
-0.62.9*
11.3
3.6*1.5*
0
3.3*0.70.80.9
2.9*1.7
2.4*
3.7*1.7-0.70.3
3.8*1.9*2.5*1.7
2.6*3.3*3.8*5.1*
-0.1
1.7*
-4.5*-3.7-3.6-0.2-3.3-1.8-2.2
0-0.3-0.4-1.31.51.7-1.8-3.4-2.60.12.6-0.76.1*4.3*-0.54*3.4-0.6-1
2.56.7*-0.46*
-0.4-0.9
-5.4*-9.9*-7.3*-6.1*-3.9*-2.6
-2.3*-2.9-1.3-0.7
1-2
-2.2-2.7-0.8-1
-0.4-0.6-1.2-0.10.10.5
-0.9*
Investment products, private pensions and…
Real estate services
Maintenance services
Mortgages
Private life insurance
Loans, credit and credit cards
Legal and accountancy services
Train services
On-line gambling services
Vehicle maintenance and repair
Off-line gambling services
TV-subscriptions
Bank accounts
Home insurance
Packaged holidays & tours
Cafés, bars and restaurants
All services markets
Internet provision
Vehicle rental services
Electricity services
Mobile telephone services
Vehicle insurance
Gas services
Tram, local bus, metro
Airline services
Holiday accommodation
Postal services
Water supply
Commercial sport services
Fixed telephone services
Culture and entertainment
Personal care services
Second hand cars
Clothing and footwear
Meat and meat products
Fruit and vegetables
Non-prescription medicines
New cars
All goods markets
Dairy products
Maintenance products
ICT products
Fuel for vehicles
Electronic products
Alcoholic drinks
Bread, cereals, rice and pasta
Furniture and furnishings
Personal care products
Large household appliances
Small household appliances
Non-alcoholic drinks
Entertainment goods
Spectacles and lenses
Books, magazines and newspapers
All markets
expectations problems&complaints trust comparability 2013 - 2012
2012 - 2011
2011 - 2010
Country-EU28
MPI per market
S
E
R
V
I
C
E
S
G
O
O
D
S
Overall Performance
Overall market performance in Slovakia is below the EU28 average, with a difference of 0.9
points. There has been a slight, non-significant, decline by 0.3 points in terms of overall
Slovakian market performance since 2012, which continues a downward trend observed from
2011 to 2012. In terms of goods markets as a whole, Slovakia experienced a decline in
performance in comparison to 2012, so that Slovakian goods markets are currently 2.3 points
below the EU28 average and 1.1 points below 2012’s score. The average MPI on services
markets in Slovakia is relatively unchanged since 2012 and it is currently close to that
observed for the EU28.
Goods Markets

EN 151 Error! No document variable supplied. EN
Overall, the top three goods markets in Slovakia are the books, magazines and newspapers,
spectacles and lenses and entertainment goods markets. The bottom three are the second-hand
cars, clothing and footwear and meat and meat products markets. The non-prescription
medicines market is rated in 26th position across the EU28. The clothing and footwear market
is in 27th position.
In comparison to 2012, nine markets saw a decline in scores, while the Slovakian goods
markets for maintenance products, and fuel for vehicles improved. Both markets increased
their expectations scores and have a smaller proportion of problems compared to last year.
Conversely, the biggest decline in performance was recorded in the markets for meat and
meat products, fruit and vegetables, and electronic products. Component scores for trust and
expectations for all three of these markets have decreased since 2012.
When comparing goods markets to the EU28 average, Slovakia performs best in terms of fuel
for vehicles, and worst in the markets for clothing and footwear, meat and meat products, fruit
and vegetables, second-hand cars, and non-prescription medicines. All of these markets have
lower component scores for comparability, trust and expectations.
Services Markets
Overall, the top three services markets in Slovakia are the personal care services, culture and
entertainment, and fixed telephone services markets. The bottom three are the investment
products, private pensions and securities, real estate services, and maintenance services
markets.
Looking at Slovakia’s services markets since 2012, there has been an improvement in the
performance of mobile telephone services, and vehicle maintenance and repair. Conversely,
the markets for postal services, and fixed telephone services have declined, albeit non-
statistically significantly, in performance since 2012. At component level, the market for
mobile telephone services shows an increase in its trust score and has experienced a reduction
in the proportion of consumer problems.
In comparison to services markets at EU28 level, Slovakia shows a more positive evaluation
in the markets for water supply, electricity services, fixed telephone services, mobile
telephone services and gas services. These five services markets all perform better than the
EU28 average for comparability, trust and expectations. Conversely, Slovakia performs the
worst in comparison with the EU28 average for investment products, real estate services and
maintenance services, but the difference is statistically significant only for those first of the
three markets.
MPIComparability
(Avg)Trust (Avg)
Expectations
(Avg)
Problems
(%)
Complaints
(%)Choice (Avg)
33 Mobile telephone services 3.4* 0 0.5* 0.3 -7.1* 2.8 0.1
8 Maintenance products 3* 0.3* 0.3 0.3* -4.6* 14.1* 0.2
23 Vehicle maintenance and repair 2.6* 0.1 0.3 0.3 -3.9 -8.6* 0
17 Fuel for vehicles 2.5 0.2 0.2 0.4* -4.4* 19.1* -0.3*
16 Second hand cars 2.1 0.1 0.4* 0 -4.9 3 -0.1
MPIComparability
(Avg)Trust (Avg)
Expectations
(Avg)
Problems
(%)
Complaints
(%)Choice (Avg)
2 Meat and meat products -3.8* -0.4 -0.8* -0.4* -0.2 -2.7 -0.6*
1 Fruit and vegetables -3.6* -0.3 -0.4* -0.4* 4.5 4.2 -0.3
10 Electronic products -3.3* -0.2 -0.5* -0.4* 2.7 8.4* -0.1
3 Bread, cereals, rice and pasta -3.1* -0.2 -0.4* -0.4* 2.4 5.6 -0.3*
18 Books, magazines and newspapers -3.1* -0.4* -0.5* -0.3* 0 -4.3 -0.6*
Difference with 2012
Improved most since 2012
Deteriorated most since 2012

EN 152 Error! No document variable supplied. EN
MPIComparability
(Avg)Trust (Avg)
Expectations
(Avg)
Problems
(%)
Complaints
(%)Choice (Avg)
45 Water supply 6.7* 1.5* 0.5* 0.5* -2.6* 10.3*
46 Electricity services 6.1* 1* 0.7* 0.6* -2.7* 3.9* 0.8*
32 Fixed telephone services 6* 0.8* 0.7* 0.6* -4.2* 9.3* 0.3*
33 Mobile telephone services 4.3* 0.3* 0.6* 0.4* -4.9* 6.1* 0.2
47 Gas services 4* 0.7* 0.3* 0.5* -1.4 9.2* 0.6*
MPIComparability
(Avg)Trust (Avg)
Expectations
(Avg)
Problems
(%)
Complaints
(%)Choice (Avg)
7 Clothing and footwear -9.9* -0.6* -1.1* -1* 16.3* 10.6* -0.3*
2 Meat and meat products -7.3* -0.6* -0.9* -0.7* 9.9* 7.8* 0
1 Fruit and vegetables -6.1* -0.3* -0.8* -0.7* 10.4* 4.7 0.1
16 Second hand cars -5.4* -0.5* -1* -0.4* 2.2 3.7 0.3*
28Investment products, private
pensions and securities-4.5* -0.4* -0.7* -0.3* 4.5* 10.2* 0.4*
5 Bottom markets
(compared to EU28 Average)
Difference with EU28
5Top markets
(compared to EU28 Average)

EN 153 Error! No document variable supplied. EN
Finland
68.170.170.6
73.275.675.775.777.577.978.378.879.179.379.579.880.180.481.281.681.781.781.881.881.982.282.582.783.185.386.5
73.374.475.978.279.380.180.480.981.581.781.781.882.082.382.784.084.584.885.085.485.5
87.9
80.1
-1.11
1.61.52.80.61.72.82.71.8
0.6-2.60.1-0.20.6-0.31.2-0.7
00.6
-0.71
0.50.6-0.9-0.6-0.31.6
-0.3-1.5-0.1-3.10.4-0.90.8-0.2
01.30.8-0.4
10.91.1-1.20.5-0.90.31.5-0.80.6
0.4
0.7-1.50.91.3-2.5-0.80.61
-1.5-2.4
-0.61.2-3.30.6-2.40.51.40.9-0.70.1
-3.1-3.2-0.4-0.10.61.2-1.4-1.1
-1.1-2.50.80.30-2
-1.41.6-0.3-0.5-2.20.2-0.70.71
0.80.3-0.1-0.41.1-1.2-0.4
-0.5
-0.7-0.6-0.51.91.5-1
-1.3
1.8
-0.11
1.82.52.8-1.6
0.13.1
22
0.2
1.5-0.81.60.3
2.3-0.7-1.8-0.5
01.6-1.40.41.71.60.40.50.60.32.52.2-0.4-0.7-2.1
0.7
0.1
-5.9*-4-3
3.7-0.55*2
5.5*3.53.24*3*
5.3*0.92.20.6-0.26.8*-0.17.3*
11.1*5.3*5.4*3.42.9
8.6*4.1*1.91.5
3.5*
2.4-1.4-3
2.9-2.92.9-4*0
1.8*1.50.11
0.72.73.2
3.9*2.92.43.1
7.9*4.5*6.5*
2.5*
TV-subscriptions
Mobile telephone services
Internet provision
Investment products, private pensions and…
Fixed telephone services
Real estate services
Maintenance services
Electricity services
Private life insurance
Vehicle maintenance and repair
On-line gambling services
All services markets
Bank accounts
Cafés, bars and restaurants
Home insurance
Vehicle insurance
Airline services
Legal and accountancy services
Commercial sport services
Water supply
Mortgages
Off-line gambling services
Tram, local bus, metro
Postal services
Packaged holidays & tours
Loans, credit and credit cards
Vehicle rental services
Holiday accommodation
Personal care services
Culture and entertainment
Second hand cars
Clothing and footwear
ICT products
Meat and meat products
Spectacles and lenses
Fruit and vegetables
Books, magazines and newspapers
Electronic products
All goods markets
Furniture and furnishings
Small household appliances
Personal care products
Large household appliances
New cars
Maintenance products
Non-prescription medicines
Entertainment goods
Non-alcoholic drinks
Bread, cereals, rice and pasta
Fuel for vehicles
Dairy products
Alcoholic drinks
All markets
expectations problems&complaints trust comparability 2013 - 2012
2012 - 2011
2011 - 2010
Country-EU28
MPI per market
S
E
R
V
I
C
E
S
G
O
O
D
S
Overall Performance
The average MPI on all consumer markets in Finland is above that seen in the EU28 as a
whole (2.5 percentage points) and the same applies both to the goods markets (+1.8
percentage points) and to the services markets (+3 percentage points). Compared to 2012, the
goods markets remained stable while the services markets improved slightly, but not
statistically significantly.

EN 154 Error! No document variable supplied. EN
Goods Markets
Overall, the top three goods markets in Finland are the alcoholic drinks, dairy products and
fuel for vehicles markets. The bottom three are the second-hand cars, clothing and footwear,
and ICT products markets.
Finland’s alcoholic drinks market is rated as the best performing across the EU28, while the
fuel for vehicles market is assessed as the second best performing. Moreover, the dairy
products and non-prescription medicines markets are both assessed as the third best.
However, the books, magazines and newspapers market is rated in 27th position.
On an individual level, the fuel for vehicles, alcoholic drinks, dairy products and non-
prescription medicines markets all have higher scores than the EU28 average. The fuel for
vehicles market scores particularly highly for the trust and expectations components
combined with a relatively low proportion of problems. However, this market scores highly
for complaints compared to the EU28 average. The alcoholic drinks market also scores
relatively highly on trust, expectations and comparability.
In Finland the only goods market to score statistically below the EU28 average is that of
books, magazines and newspapers; this is driven by a relatively high level of problems and a
lower score for trust and expectations. The ICT products market is also one of the worst-
scoring in comparison with the EU28 average, but the difference is not statistically
significant.
Compared to 2012, across the goods markets, the most improvement is found in the fuel for
vehicles and furniture and furnishing markets; however, in neither case is this statistically
significant. The only statistically significant decrease in goods markets scores from 2012 is
seen in the meat and meat products market, driven by a higher proportion of problems and a
lower score for trust. This is likely to be a result of the horsemeat scandal which was widely
reported in Europe just prior to fieldwork in January 2013.
Services Markets
Overall, the top three services markets in Finland are culture and entertainment, personal care
services, and holiday accommodation. The bottom three are the TV-subscriptions, mobile
telephone services and internet provision markets.
Finland’s vehicle rental services and culture and entertainment markets are both rated as the
best performing across the EU28. The water supply, mortgages, legal and accountancy
services, and loans, credit and credit cards markets are all assessed as being the second best
performing across the EU28, while the offline gambling and lottery services market is
assessed as the third best.
On an individual level, a total of 12 markets show a positive difference with respect to the
values for EU28. The mortgages market, the loans, credit and credit cards market, and the
water supply market score highest compared to the EU average. The comparability, trust and
expectations components for all three markets scored better than the EU average, with lower
proportions of problems. Only one service market in Finland – the TV-subscriptions market –
scored lower than the EU28 average. Also scoring the lowest in comparison with the EU28
average, but without a statistically significant difference, are the mobile telephone services,
internet provision, fixed telephone services and airline services markets.
Compared to 2012, across the services markets, improvement are seen for the fixed telephone
services, electricity services; train services; culture and entertainment; ad private life

EN 155 Error! No document variable supplied. EN
insurance markets. Only the bank accounts market has worsened in a statistically significant
manner when compared to 2012.
MPIComparability
(Avg)Trust (Avg)
Expectations
(Avg)
Problems
(%)
Complaints
(%)Choice (Avg)
36 Train services 4.2* 0.2 0.7* 0.4* -7.3* 7.9* 0,0
32 Fixed telephone services 2.8* 0.5* 0.1 0.2 -3.5 -7.5* -0.5*
46 Electricity services 2.8* 0.2 0.3* 0.3* -4.7* 12.3*
52 Private life insurance 2.7* 0.2 0.2 0.2* -6.2* -3.8 0.2
23 Vehicle maintenance and repair 1.8 0.1 0.1 0.2 -3.4 2.2 0.2
MPIComparability
(Avg)Trust (Avg)
Expectations
(Avg)
Problems
(%)
Complaints
(%)Choice (Avg)
2 Meat and meat products -3.1 -0.2 -0.7* 0 4.3* 9.1* 0.1
26 Bank accounts -2.6 -0.2 -0.2 -0.3* 4* 5* -0.1
7 Clothing and footwear -1.5 -0.1 -0.2 -0.2 1.8 1.1 0.2
48 Non-prescription medicines -1.2 -0.1 -0.3* 0 0.5 0.9 -0.1
54 TV-subscriptions -1.1 -0.1 0 0.1 4 2.9 -0.1
Difference with 2012
Improved most since 2012
Deteriorated most since 2012
MPIComparability
(Avg)Trust (Avg)
Expectations
(Avg)
Problems
(%)
Complaints
(%)Choice (Avg)
51 Mortgages 11.1* 0.8* 1.6* 1.5* -6.8* 3.2 1.3*
58 Loans, credit and credit cards 8.6* 0.3* 1.4* 1.3* -6.7* 25.7* 0.8*
17 Fuel for vehicles 7.9* 0.6* 1.2* 1.2* -2.9* 36.2* 0.2*
45 Water supply 7.3* 0.5* 0.9* 1.3* -2.8* 23.8* 0,0
57 Legal and accountancy services 6.8* 0.4* 1.2* 1* -2.1 26.6* 0.6*
MPIComparability
(Avg)Trust (Avg)
Expectations
(Avg)
Problems
(%)
Complaints
(%)Choice (Avg)
54 TV-subscriptions -5.9* -0.9* -0.3* 0 12.7* 11.2* 1.1*
18 Books, magazines and newspapers -4* -0.4* -0.4* -0.2* 7.5* 18.6* 0.5*
33 Mobile telephone services -4 -1.2* -0.1 0.3* 6.5* 9.8* 0.6*
13 ICT products -3 -0.5* 0.1 -0.2 8.6* 11.7* 0.4*
34 Internet provision -3 -0.5* -0.1 0.1 9.2* 8* 0.3*
5 Bottom markets
(compared to EU28 Average)
Difference with EU28
5Top markets
(compared to EU28 Average)

EN 156 Error! No document variable supplied. EN
Sweden
63,6
64,565,565,8
68,869,770,070,170,470,872,573,573,573,574,374,775,075,175,475,576,576,877,078,178,378,679,980,080,582,2
68,770,572,973,875,176,376,777,178,578,778,879,179,980,280,480,981,181,882,882,983,1
86,3
75,5
3.5*-1.1
0.80
0.33.9*1.50.10.42.5*
1.6*7.4*
2.2*1.2
2.4*-0.42.2*4.6*4.7*-0.23*1.21.51.6-0.10.62*
1.9*
0.8-3.2*0.60.3-0.2-0.70.2
2.4*1.3*1.4
3.2*1.61.5
3.8*-0.40.2
1.9*2.8*2*0.2
3.7*4.6*
1.5*
3.1*2.4*
-1.5-0.5
1.5-1
-1.30.9
-2.5*-1.1
0.43.5*
1.9-0.4-0.1-0.2-0.3
-2.7*2.6*1.21.30.52*
-0.4-1
1.10.1-1
0.60.91.1-0.40.40.71.40
0.7*0.92*1.30.4-0.71.20.7-0.21.51.10.8-0.41.4
0.5*
-0.3
1.60.6
2.9*1.9
3.4*0.5
2.6*
0.5*0
0.6
1.7*1.9*
0.52.6*1.20.4-1.31.5
3.1*1.50.81
2.2*2.8*-1.23.1*2.4*2.5*
13.8*2.1*2.5*0.80.61.6
2.1*2.3*3.3*1.11.5
1.10.7
1.2*
-8.2*
-5.9*-9.2*-8.5*
-4.8*-6.3*
-5.1*-0.6-5.9*-3.6-4*
-2.7*1.5-1.3-0.10.81
-3.4-2.24.8*2.1-1.7-2.5-1.1-0.3-2
-3.9*-1.1-1.2-0.8
-2.2-4.7*-2.8
-5.1*-2.1-3.2
-4.2*-3.7
-1.3*-1.4-0.8-2.1-1.7-2
-1.6-1.5-0.51.6-1.51.9
5.7*4.9*
-2.1*
Investment products, private pensions and…
Internet provision
TV-subscriptions
Mobile telephone services
Maintenance services
Fixed telephone services
Vehicle maintenance and repair
Real estate services
Tram, local bus, metro
Private life insurance
Off-line gambling services
All services markets
Electricity services
On-line gambling services
Legal and accountancy services
Bank accounts
Loans, credit and credit cards
Cafés, bars and restaurants
Home insurance
Mortgages
Water supply
Postal services
Vehicle insurance
Packaged holidays & tours
Vehicle rental services
Airline services
Personal care services
Holiday accommodation
Commercial sport services
Culture and entertainment
Second hand cars
Meat and meat products
Clothing and footwear
ICT products
Fruit and vegetables
Maintenance products
Electronic products
Personal care products
All goods markets
Non-prescription medicines
New cars
Large household appliances
Small household appliances
Spectacles and lenses
Bread, cereals, rice and pasta
Non-alcoholic drinks
Entertainment goods
Furniture and furnishings
Books, magazines and newspapers
Dairy products
Fuel for vehicles
Alcoholic drinks
All markets
expectations problems&complaints trust comparability 2013 - 2012
2012 - 2011
2011 - 2010
Country-EU28
MPI per market
S
E
R
V
I
C
E
S
G
O
O
D
S
Overall Performance
Consumers in Sweden give a lower assessment of overall market performance than the EU28
average, with a difference of 2.1 points. This is despite a 1.5 point increase in overall market
performance in Sweden in 2013 compared to 2012. Considering the average MPI on goods
markets and services markets, both have increased in score since 2012 (goods markets, 1.3;
services markets, 1.6) but both are still below the EU28 average (goods markets, -1.3, services
markets, -2.7).
Goods Markets
Overall, the top three goods markets in Sweden are the alcoholic drinks, fuel for vehicles and
dairy products markets. The bottom three are the second-hand cars, meat and meat products,

EN 157 Error! No document variable supplied. EN
and clothing and footwear markets. The alcoholic drinks market is rated as the third best
performing across the EU28, while the electronic products market is ranked in 27th position.
Compared to 2012, seven goods markets improved, their performance in particular the
markets for alcoholic drinks; spectacles and lenses; and fuel for vehicles. On the other hand
the only statistically significant drop in performance was recorded for the meat and meat
products market. The markets for alcoholic drinks and fuel for vehicles have a higher score
for expectations than in 2012. The market for meat and meat products fared worse in terms of
its trust score since 2012, which may be as a result of the widely publicised horsemeat scandal
in Sweden and the rest of Europe.
In comparison to the EU28 average, the goods markets in Sweden which show a positive
difference are fuel for vehicles and alcoholic drinks, whilst the goods markets performing the
poorest are ICT products, meat and meat products, and electronic products. The markets for
fuel for vehicles and alcoholic drinks show higher scores than the EU28 average for all
components, except comparability. The markets for ICT products and electronic products
have a higher proportion of problems in Sweden than the EU28 average.
Services Markets
Overall, the top three services markets in Sweden are the culture and entertainment,
commercial sport services and holiday accommodation markets. The bottom three are the
investment products, private pensions and securities, internet provision and TV-subscriptions
markets. The internet provision; fixed telephone services; tram, local bus, metro; and
maintenance services markets are all rated in 26th position across the EU28. The TV-
subscriptions and personal care services markets are both rated in 27th position.
Twelve of Sweden’s services markets saw an improvement in score from last year, in
particular the electricity services; water supply; and mortgages markets. All three of these
markets posted increases in their scores for trust and expectations since 2012. No services
markets showed a statistically significant drop in terms of performance, though the market for
TV subscriptions did decrease by 1.1 points overall, having a lower comparability score and a
higher percentage of problems than in 2012.
Sweden’s services markets generally score lower than the EU28 average, with mortgages
being the only service market that is statistically above the average. In contrast the markets
for internet provision, TV subscriptions, mobile telephone services, train services, fixed
telephone services, tram, local bus and metro, investment products, vehicle maintenance and
repair, offline gambling and personal care services all show lower MPI scores in Sweden than
the EU28 average. All of these services markets score lower than the EU28 average in terms
of comparability, and almost all of them score lower for trust and have higher proportions of
problems and complaints.
MPIComparability
(Avg)Trust (Avg)
Expectations
(Avg)
Problems
(%)
Complaints
(%)Choice (Avg)
46 Electricity services 7.4* 0.3 0.8* 1.8* -2 0.4 0.5*
45 Water supply 4.7* 0.1 0.4* 1.3* -1 -2.2
51 Mortgages 4.6* -0.1 0.4* 1.5* 0 5.7* 0.3*
6 Alcoholic drinks 4.6* 0.1 0.2 1.5* -0.1 -0.7
32 Fixed telephone services 3.9* 0.1 0 1.7* 1.7 -0.1 0
MPIComparability
(Avg)Trust (Avg)
Expectations
(Avg)
Problems
(%)
Complaints
(%)Choice (Avg)
2 Meat and meat products -3.2* -0.5* -1.1* 0.2 -2.5 3.5 0
54 TV-subscriptions -1.1 -0.4* -0.1 0.5* 6.6* -5.3* 0.2
8 Maintenance products -0.7 -0.3 -0.2 0.5* 4.2* -1.6 0
3 Bread, cereals, rice and pasta -0.4 -0.4* -0.2 0.2* -2.5* -11.2* -0.1
41 Cafés, bars and restaurants -0.4 -0.2 -0.2 0.2* -0.1 -8.1* 0.6*
Difference with 2012
Improved most since 2012
Deteriorated most since 2012

EN 158 Error! No document variable supplied. EN
MPIComparability
(Avg)Trust (Avg)
Expectations
(Avg)
Problems
(%)
Complaints
(%)Choice (Avg)
17 Fuel for vehicles 5.7* 0.1 0.7* 1.3* -4.1* 12.9* 0.1
6 Alcoholic drinks 4.9* -0.1 1.4* 0.6* -1.4* 30.9*
51 Mortgages 4.8* 0.2 0.9* 0.7* -4* 25.4* 0.8*
45 Water supply 2.1 -0.5* 1* 0 -4.5* 5.2*
55 Dairy products 1.9 -0.3* 0.3* 0.6* -3.1* 10.1* 0.2
MPIComparability
(Avg)Trust (Avg)
Expectations
(Avg)
Problems
(%)
Complaints
(%)Choice (Avg)
34 Internet provision -9.2* -1.4* -1* -0.5* 11.6* 1.7 0.3*
54 TV-subscriptions -8.5* -1.6* -0.8* -0.2 9.9* 5.8* 0.7*
33 Mobile telephone services -8.2* -1.7* -0.8* -0.2* 6.3* 10.8* 0.7*
36 Train services -6.4* -0.6* -0.4* -0.1 18.9* 12.9*
32 Fixed telephone services -6.3* -1.3* -0.7* -0.1 5.3* 11.4* 0.6*
5 Bottom markets
(compared to EU28 Average)
Difference with EU28
5Top markets
(compared to EU28 Average)
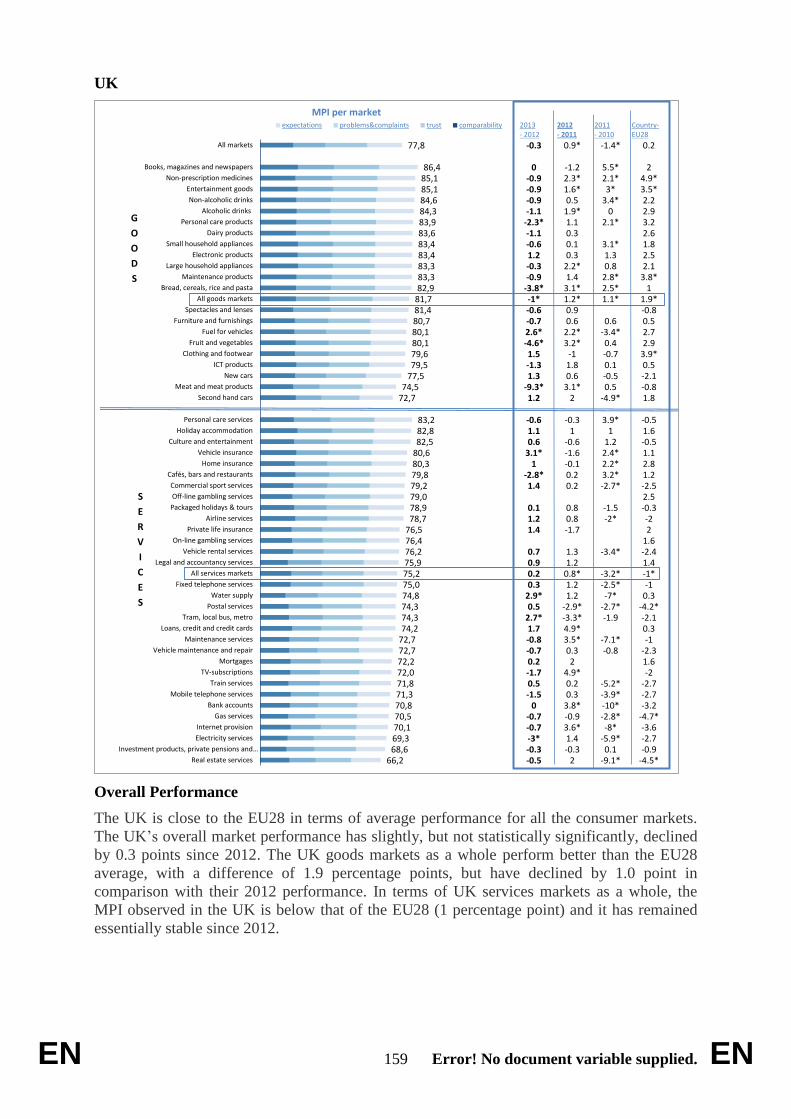
EN 159 Error! No document variable supplied. EN
UK
66,268,669,370,170,570,871,371,872,072,272,772,774,274,374,374,875,075,275,976,276,476,578,778,979,079,279,880,380,682,582,883,2
72,774,5
77,579,579,680,180,180,781,481,782,983,383,383,483,483,683,984,384,685,185,186,4
77,8
-0.5-0.3-3*-0.7-0.7
0-1.50.5-1.70.2-0.7-0.81.7
2.7*0.5
2.9*0.30.20.90.7
1.41.20.1
1.4-2.8*
13.1*0.61.1-0.6
1.2-9.3*1.3-1.31.5
-4.6*2.6*-0.7-0.6-1*
-3.8*-0.9-0.31.2-0.6-1.1
-2.3*-1.1-0.9-0.9-0.9
0
-0.3
2-0.31.4
3.6*-0.93.8*0.30.2
4.9*2
0.33.5*4.9*-3.3*-2.9*1.21.2
0.8*1.21.3
-1.70.80.8
0.20.2-0.1-1.6-0.6
1-0.3
23.1*0.61.8-1
3.2*2.2*0.60.9
1.2*3.1*1.4
2.2*0.30.10.31.1
1.9*0.5
1.6*2.3*-1.2
0.9*
-9.1*0.1
-5.9*-8*
-2.8*-10*-3.9*-5.2*
-0.8-7.1*
-1.9-2.7*-7*
-2.5*-3.2*
-3.4*
-2*-1.5
-2.7*3.2*2.2*2.4*1.21
3.9*
-4.9*0.5-0.50.1-0.70.4
-3.4*0.6
1.1*2.5*2.8*0.81.3
3.1*
2.1*0
3.4*3*
2.1*5.5*
-1.4*
-4.5*-0.9-2.7-3.6
-4.7*-3.2-2.7-2.7-2
1.6-2.3-1
0.3-2.1
-4.2*0.3-1
-1*1.4-2.41.62-2
-0.32.5-2.51.22.81.1-0.51.6-0.5
1.8-0.8-2.10.5
3.9*2.92.70.5-0.81.9*
13.8*2.12.51.82.63.22.92.2
3.5*4.9*
2
0.2
Real estate services
Investment products, private pensions and…
Electricity services
Internet provision
Gas services
Bank accounts
Mobile telephone services
Train services
TV-subscriptions
Mortgages
Vehicle maintenance and repair
Maintenance services
Loans, credit and credit cards
Tram, local bus, metro
Postal services
Water supply
Fixed telephone services
All services markets
Legal and accountancy services
Vehicle rental services
On-line gambling services
Private life insurance
Airline services
Packaged holidays & tours
Off-line gambling services
Commercial sport services
Cafés, bars and restaurants
Home insurance
Vehicle insurance
Culture and entertainment
Holiday accommodation
Personal care services
Second hand cars
Meat and meat products
New cars
ICT products
Clothing and footwear
Fruit and vegetables
Fuel for vehicles
Furniture and furnishings
Spectacles and lenses
All goods markets
Bread, cereals, rice and pasta
Maintenance products
Large household appliances
Electronic products
Small household appliances
Dairy products
Personal care products
Alcoholic drinks
Non-alcoholic drinks
Entertainment goods
Non-prescription medicines
Books, magazines and newspapers
All markets
expectations problems&complaints trust comparability 2013 - 2012
2012 - 2011
2011 - 2010
Country-EU28
MPI per market
S
E
R
V
I
C
E
S
G
O
O
D
S
Overall Performance
The UK is close to the EU28 in terms of average performance for all the consumer markets.
The UK’s overall market performance has slightly, but not statistically significantly, declined
by 0.3 points since 2012. The UK goods markets as a whole perform better than the EU28
average, with a difference of 1.9 percentage points, but have declined by 1.0 point in
comparison with their 2012 performance. In terms of UK services markets as a whole, the
MPI observed in the UK is below that of the EU28 (1 percentage point) and it has remained
essentially stable since 2012.

EN 160 Error! No document variable supplied. EN
Goods Markets
Overall, the top three goods markets in the UK are the books, magazines and newspapers;
non-prescription medicines; and entertainment goods markets. The bottom three are the
second-hand cars; meat and meat products; and new cars markets.
The entertainment goods and non-prescription medicines markets are both rated as the second
best performing across the EU28. The large household appliances, personal care products and
maintenance products markets are assessed as the third best performing across the EU28.
Looking at the UK goods markets in comparison with 2012 scores, there has been an
improvement in the performance of the market for fuel for vehicles. Conversely, the markets
for meat and meat products; fruit and vegetables; personal care products; and bread, cereals,
rice and pasta have performed worse. The meat and meat products and fruit and vegetables
markets have both experienced declines in terms of comparability, trust and expectations.
There has been a particularly steep decline in trust in the market for meat and meat products,
which can be attributed to the extensive media coverage of the horsemeat scandal in the past
year.
The UK goods markets that are outperforming the EU28 average are non-prescription
medicines, clothing and footwear, maintenance products, and entertainment goods. These
markets all perform better than average in terms of comparability, trust and expectations. On
the other hand, the market for new cars performs worse in the UK in comparison with the
EU28 average, although the difference is not statistically significant.
Services Markets
Overall, the top three services markets in the UK are the personal care services, holiday
accommodation and culture and entertainment markets. The bottom three are the real estate
services; investment products, private pensions and securities; and electricity services
markets.
There has been an improvement in performance since 2012 in the UK markets for vehicle
insurance, water supply, and tram, local bus and metro. These three markets are all rated more
highly on the consumer trust component. The largest drops in performance have been
recorded for electricity services, and cafés, bars and restaurants. The performance
deterioration in the market for electricity services may reflect consumer dissatisfaction that
prices are rising but electricity providers are still posting strong profits.
In comparison to the EU28 average, the UK services markets that are performing slightly
better are home insurance, offline gambling, and private life insurance. However, the UK is
performing worse than the EU28 average in the markets for gas services, real estate services
and postal services. These three services markets all experience a higher than average
proportion of problems and the gas services market also performs worse than average in terms
of comparability, trust and expectations.

EN 161 Error! No document variable supplied. EN
MPIComparability
(Avg)Trust (Avg)
Expectations
(Avg)
Problems
(%)
Complaints
(%)Choice (Avg)
30 Vehicle insurance 3.1* 0.3 0.4* 0.4* -1.8 -4.7 0.2*
45 Water supply 2.9* 0.4 0.4* 0.1 -3 -18.6*
35 Tram, local bus, metro 2.7* 0.2 0.3* 0.3* -3.1 0.6
17 Fuel for vehicles 2.6* 0.2 0.3 0.4* -2.9* 24.2* 0.3*
58 Loans, credit and credit cards 1.7 0.3 0.1 0.1 -1.9 -1.6 0.1
MPIComparability
(Avg)Trust (Avg)
Expectations
(Avg)
Problems
(%)
Complaints
(%)Choice (Avg)
2 Meat and meat products -9.3* -0.7* -1.9* -0.9* 2.6 7.3* -0.4*
1 Fruit and vegetables -4.6* -0.4* -0.6* -0.5* 2.9 12* -0.4*
3 Bread, cereals, rice and pasta -3.8* -0.3* -0.5* -0.6* 1.7 19.4* -0.2
46 Electricity services -3* -0.4 -0.6* -0.3 -1.5 18.7* -0.3
41 Cafés, bars and restaurants -2.8* -0.3* -0.2 -0.1 6.3* 1.4 -0.1
Difference with 2012
Improved most since 2012
Deteriorated most since 2012
MPIComparability
(Avg)Trust (Avg)
Expectations
(Avg)
Problems
(%)
Complaints
(%)Choice (Avg)
48 Non-prescription medicines 4.9* 0.6* 0.8* 0.4* -2.4* 43.8* 0.5*
7 Clothing and footwear 3.9* 0.4* 0.7* 0.3* -2.1 2 0.2
8 Maintenance products 3.8* 0.5* 0.6* 0.3* -1.6 -0.4 0
14 Entertainment goods 3.5* 0.5* 0.6* 0.2* -2.1* 7.8* -0.3*
19 Personal care products 3.2 0.3* 0.6* 0.3* -1.4 2.4 0.3*
MPIComparability
(Avg)Trust (Avg)
Expectations
(Avg)
Problems
(%)
Complaints
(%)Choice (Avg)
47 Gas services -4.7* -0.5* -0.7* -0.4* 3.7* 0.9 1.6*
20 Real estate services -4.5* -0.1 -0.3* -0.2 14.7* 6.9* 0.3*
31 Postal services -4.2* -0.8* -0.1 -0.4* 4.9* 1.8 -0.4*
34 Internet provision -3.6 -0.4* 0 -0.5* 6.3* 2.5 0.1
26 Bank accounts -3.2 -0.2 -0.3* -0.3* 5.7* 4.8* -0.2
5 Bottom markets
(compared to EU28 Average)
Difference with EU28
5Top markets
(compared to EU28 Average)

EN 162 Error! No document variable supplied. EN
Norway
66,467,768,369,570,470,770,870,971,271,371,672,373,573,874,274,374,574,775,676,476,777,377,577,878,278,379,179,680,380,4
69,369,670,771,0
73,673,9
76,676,776,877,077,177,477,477,577,878,078,680,180,781,382,183,5
75,2
-3*-1.91.41.9-1.40.4
2.6*0
-1.5-3.8*
-1.6-0.1-0.7
-0.6*
0.1-2.7*-2.7*-2.5*-0.1-1.2-0.1-0.91.4-0.91.5-1
-0.41.7*
0.1-0.3-1.3-1.20.8
2.2*-4.6*0.1-0.80.4-1.40.6-0.70.1-0.4
12*
-0.21.3
1.7*1.5
1.6*
-0,3
-7.3*-6.3*-1.1
-4.2*-8.1*-4.4*0.2-3.2-3.2
-7.2*-3.2-4*-2.61.9
-1.9*-2.2
00.8
-3.8*5.7*-1.9
-6.4*3
-3.9*0.6
4.3*-0.1-1
-2.7-0.8
-7.9*-1.3-5*
-4.3*-5.4*-6.8*-0.9
-3.1*-5.2*-3.9*-3.1
-4.2*-4.2*-3.7*-1.8-1.5-1.5-2.1-0.2-1.2-2.32.1
-2.4*
Maintenance services
TV-subscriptions
Investment products, private pensions and…
Internet provision
Cafés, bars and restaurants
Vehicle maintenance and repair
Real estate services
Mobile telephone services
Private life insurance
Postal services
On-line gambling services
Tram, local bus, metro
Fixed telephone services
Electricity services
All services markets
Off-line gambling services
Legal and accountancy services
Loans, credit and credit cards
Vehicle insurance
Mortgages
Vehicle rental services
Personal care services
Water supply
Commercial sport services
Home insurance
Bank accounts
Packaged holidays & tours
Airline services
Culture and entertainment
Holiday accommodation
Fruit and vegetables
Second hand cars
Clothing and footwear
Meat and meat products
ICT products
Personal care products
Fuel for vehicles
All goods markets
Bread, cereals, rice and pasta
Electronic products
Furniture and furnishings
Small household appliances
Entertainment goods
Large household appliances
New cars
Maintenance products
Non-prescription medicines
Spectacles and lenses
Dairy products
Non-alcoholic drinks
Books, magazines and newspapers
Alcoholic drinks
All markets
expectations problems&complaints trust comparability 2013 - 2012
Country-EU28
MPI per market
S
E
R
V
I
C
E
S
G
O
O
D
S
Overall Performance
Overall market performance in Norway is lower than the EU28 average, with a 2.4 point
difference. In comparison to 2012, overall market performance dropped in a non-statistically
significant manner by 0.3 points. In terms of goods markets as a whole, Norway has a market
performance score that is 3.1 points below the EU28 average, though it has not changed since
2012. Norway’s overall services markets score is 1.9 points below the EU28 average, and also
decreased in comparison to 2012.
Goods Markets
Overall, the top three goods markets in Norway are the alcoholic drinks, books, magazines
and newspapers, and non-alcoholic drinks markets. The bottom three are the fruit and
vegetables, second-hand cars and clothing and footwear markets.

EN 163 Error! No document variable supplied. EN
Compared to the EU28, the following Norwegian markets are all ranked as poorly
performing: books, magazines and newspapers; fruit and vegetables; furniture and
furnishings; ICT products; entertainment goods; large household appliances; electronic
products; small household appliances; bread, cereals, rice and pasta; personal care products.
Some goods markets in Norway performed better in comparison to 2012. in particular the
markets for personal care products; non-prescription medicines; alcoholic drinks; and non-
alcoholic drinks. Conversely, the fuel for vehicles market experienced a particularly large
decline in its consumer expectation score, which may be a reflection of the steep rise in fuel
prices in Norway.
In comparison to the EU28 average, the only Norwegian goods market performing slightly
better than average is the market for alcoholic drinks. Conversely, in Norway there are a large
number of goods markets showing a negative difference relative to the EU as a whole, notably
the markets for fruit and vegetables, personal care products, ICT products, bread, cereals, rice
and pasta, and clothing and footwear. All of these markets perform worse than average in
terms of comparability and trust, and have higher proportions of problems.
Services Markets
Overall, the top three services markets in Norway are the holiday accommodation, culture and
entertainment and airline services markets. The bottom three are the maintenance services,
TV-subscriptions and investment products, private pensions and securities markets. Compared
to the EU28, Norway’s commercial sport services; cafés, bars and restaurants; postal services;
personal care services; and maintenance services markets are all ranked as poorly performing.
Some services markets in Norway, have improved since 2012, in particular the real estate
services and holiday accommodation markets, and the biggest drops in performance are seen
in the postal services; maintenance services; mortgages; vehicle insurance; and loans, credit
and credit cards markets. The postal services’ lower score may be a reaction to Posten
Norge’s announcement in January 2013 that they plan to close 149 post offices.129
When comparing its services markets to the EU28 average, Norway performs the best in the
markets for mortgages and bank accounts. These two markets score highly in terms of trust,
and have a low proportion of consumer problems. However, Norway performs worse in
comparison with the EU28 average in ten services markets, most notably cafés, bars and
restaurants, maintenance services, and postal services. These services markets perform worse
than average in terms of comparability, and have a higher than average proportion of
complaints.
129
“Norway Post to shut down almost all post offices.” Retrieved from:
http://postandparcel.info/48297/news/companies/norway-post-to-shut-down-almost-all-post-offices/

EN 164 Error! No document variable supplied. EN
MPIComparability
(Avg)Trust (Avg)
Expectations
(Avg)
Problems
(%)
Complaints
(%)Choice (Avg)
20 Real estate services 2.6* 0.2 0.5* 0.1 -1.8 -24* 0.6*
19 Personal care products 2.2* 0.2 0.4* 0.3* 0.2 -9.8* -0.3*
48 Non-prescription medicines 2* 0 0.8* -0.1 -0.1 -24.7* 0
34 Internet provision 1.9 0 0 -0.5* -16* -12.9* -0.3
5 Non-alcoholic drinks 1.7* 0 0.8* -0.2* -3.6* 37.9* 0.4*
MPIComparability
(Avg)Trust (Avg)
Expectations
(Avg)
Problems
(%)
Complaints
(%)Choice (Avg)
17 Fuel for vehicles -4.6* 0.2 0.3* -2.3* 0.3 -11.4* -0.4*
31 Postal services -3.8* -0.6* -0.2 -0.6* 0.8 -5.1 0
21 Maintenance services -3* -0.3 -0.4* -0.1 5.7* -4.9* -0.1
58 Loans, credit and credit cards -2.7* -0.4* -0.3* -0.7* -3.5* -16.2* 0.3*
30 Vehicle insurance -2.7* -0.1 0.3 -1.1* 0.6 1 -0.1
Difference with 2012
Improved most since 2012
Deteriorated most since 2012
MPIComparability
(Avg)Trust (Avg)
Expectations
(Avg)
Problems
(%)
Complaints
(%)Choice (Avg)
51 Mortgages 5.7* 0.8* 1.1* 0.1 -3.6* -6.9* 0.8*
26 Bank accounts 4.3* -0.3* 1.1* 0.5* -6.2* -2 0.4*
45 Water supply 3 -0.9* 0.6* 1.3* -1 -26.7*
36 Train services 2.2 -0.1 0.7* 0 -1.4 -22.2*
6 Alcoholic drinks 2.1 -0.5* 1.5* 0.1 3.3* 4.9*
MPIComparability
(Avg)Trust (Avg)
Expectations
(Avg)
Problems
(%)
Complaints
(%)Choice (Avg)
41 Cafés, bars and restaurants -8.1* -1.3* -0.9* -0.1 12* 3.4 -0.7*
1 Fruit and vegetables -7.9* -0.5* 0.1 -0.4* 36.4* -5.8 0.2*
21 Maintenance services -7.3* -1* -0.9* -0.1 12.2* 6.3* -0.1
31 Postal services -7.2* -1.6* -0.2 -0.7* 6.4* 0 -0.5*
19 Personal care products -6.8* -1.2* -0.9* -0.4* 3.6* -3.2 0
5 Bottom markets
(compared to EU28 Average)
Difference with EU28
5Top markets
(compared to EU28 Average)

EN 165 Error! No document variable supplied. EN
Iceland
58,263,563,6
66,267,268,068,468,669,369,569,570,471,071,171,171,372,172,272,374,174,275,677,077,077,678,780,480,681,682,6
66,568,470,170,872,173,974,175,375,976,076,476,476,676,777,377,777,877,978,579,079,580,6
73,4
3-2.9-1
5.2*1.5-1.32.9
3.9*3.6*-1.31.1-0.70.4
3.2*-1
1.81*1
0.31.2
-0.60.41.2
2.6*1.10
-0.20.5
1.5-1.1-1.21.6
4.5*1.31.1
0.9*-0.60.5-1.31.92
-0.41.31.30.5-0.22.11.21.80.9
0.9*
-12.5*-7.1*
-10.1*-3.3
-6.8*-11.4*
-5.6-7.4*-4.7-5.6-4.9-3.3
-6.6*-2.8
-7.5*-0.7
-4.1*-2.3-2.2-2.3-0.6-2.9-3.7-2.31.10.1-0.7-3.2-0.1-0.4
-10.7*-6.9*-0.9-4.9-5.3
-6.2*-5.4
-4.4*-3
-6*-4.9-4.4-3
-3.5-4.3-3.3-4.6
-6.4*-2.8-1.9-2
-1.7
-4.2*
Mortgages
Real estate services
Internet provision
Investment products, private pensions and…
Bank accounts
Vehicle insurance
Mobile telephone services
Fixed telephone services
TV-subscriptions
Vehicle maintenance and repair
Private life insurance
Maintenance services
Home insurance
Loans, credit and credit cards
Cafés, bars and restaurants
Electricity services
All services markets
Water supply
Legal and accountancy services
Tram, local bus, metro
On-line gambling services
Postal services
Airline services
Packaged holidays & tours
Off-line gambling services
Vehicle rental services
Holiday accommodation
Personal care services
Commercial sport services
Culture and entertainment
Fruit and vegetables
Meat and meat products
Second hand cars
Clothing and footwear
Fuel for vehicles
Non-prescription medicines
Maintenance products
All goods markets
ICT products
Bread, cereals, rice and pasta
Large household appliances
Personal care products
New cars
Furniture and furnishings
Small household appliances
Dairy products
Non-alcoholic drinks
Books, magazines and newspapers
Alcoholic drinks
Electronic products
Entertainment goods
Spectacles and lenses
All markets
expectations problems&complaints trust comparability 2013 - 2012
Country-EU28
MPI per market
S
E
R
V
I
C
E
S
G
O
O
D
S
Overall Performance
Overall market performance in Iceland is 4.2 points below the EU28 average. However, year-
on-year, there has been an improvement in performance. This overall trend is reflected in both
of Iceland’s goods and services market groupings: they are more than 4 points below the
EU28 average score, yet both have also improved their performance score since 2012.
Goods Markets
Overall, the top three goods markets in Iceland are the spectacles and lenses, entertainment
goods, and electronic products markets. The bottom three are the fruit and vegetables, meat
and meat products, and second-hand cars markets.

EN 166 Error! No document variable supplied. EN
Compared to the EU28, the following Icelandic markets are all ranked as poorly performing:
alcoholic drinks; non-alcoholic drinks; new cars; furniture and furnishings; personal care
products; maintenance products; small household appliances; bread, cereals, rice and pasta;
non-prescription medicines; books, magazines and newspapers; fruit and vegetables; and large
household appliances.
In comparison to 2012, only one goods market in Iceland shows a statistically significant
difference in score: the market for fuel for vehicles has experienced an improvement in MPI
score and in the consumer trust component since 2012.
Iceland performs the worst in comparison with the EU28 average for all goods markets, and
this difference is statistically significant in the markets for fruit and vegetables, meat and meat
products, books, magazines and newspapers, non-prescription medicines, and bread, cereals,
rice and pasta. In terms of performance components, in almost all goods markets, Iceland
scores lower than the EU28 average for comparability and trust, and has a higher proportion
of complaints.
Services Markets130
Overall, the top three services markets in Iceland are the culture and entertainment,
commercial sport services and personal care services markets. The bottom three are the
mortgages, real estate services and internet provision markets.
Compared to the EU28, the following Icelandic markets are all ranked as poorly performing
mortgages; vehicle maintenance and repair; real estate services; home insurance; airline
services; fixed telephone services; internet provision; personal care services; vehicle
insurance; and cafés, bars and restaurants.
In comparison to 2012, several services markets in Iceland have improved, in particular
investment products; fixed telephone services; TV subscriptions; vehicle rental; and loans,
credit and credit cards. There are no statistically significant decreases in score from 2012. The
market for investment products may have improved in the past year as a result of the gradual
stock market recovery since Iceland’s previous financial crisis. In terms of performance of
components for the market for investment products, there is an increase in score for
expectations and trust, and a decrease in the proportions of problems. The performance
improvement for fixed telephone services and TV subscriptions could be potentially driven by
the rise of competitively priced ‘bundles’, selling home internet, fixed telephone and TV
subscription in a single package. Recent research has found that bundling products can help
strengthen and differentiate companies within the same market, bringing economic benefits to
consumers.131
The only services market where Iceland performs slightly better than the EU28 average is the
market for offline gambling services. However, Iceland performs worse than the EU28
average in the markets for mortgages, vehicle insurance, internet provision, cafés, bars and
restaurants, fixed telephone services, real estate services, bank accounts, and home insurance.
In terms of components, these markets all perform worse than the EU28 average for
comparability, trust and expectations, and have higher than average proportions of
complaints.
130
Please note that in some Member States it may be illegal, in accordance with national law, to offer
online gambling services. It does not necessarily mean that the consumers do not gamble online.
Therefore, the results for this market should be interpreted with care. 131
“Analysis of the retail market for access to the public telephone network provided at a fixed location for
residential and non-residential customers". Retrieved from:
http://www.pfs.is/upload/files/M1_ESA%20consultation_Appendix%20A_Public%20version.pdf

EN 167 Error! No document variable supplied. EN
MPIComparability
(Avg)Trust (Avg)
Expectations
(Avg)
Problems
(%)
Complaints
(%)Choice (Avg)
28 Investment products 5.2* 0,2 0,8 0,6 -5,3 -5,3 0,4
17 Fuel for vehicles 4.5* 0,4 0,9 0,4 -2,5 -2,5 0,0
32 Fixed telephone services 3.9* 0,1 0,4 0,5 -7,1 -7,1 0,2
54 TV-subscriptions 3.6* 0,6 0,3 0,4 -1,9 -1,9 0,3
58 Loans, credit and credit cards 3.2* 0,0 0,5 0,5 -3,5 -3,5 0,1
MPIComparability
(Avg)Trust (Avg)
Expectations
(Avg)
Problems
(%)
Complaints
(%)Choice (Avg)
20 Real estate services -2,9 -0,1 -0,2 -0,2 9,2 9,2 -0,1
23 Vehicle maintenance and repair -1,3 -0,2 0,0 -0,1 0,7 0,7 -0,3
11 Large household appliances -1,3 -0,2 0,1 -0,2 2,1 2,1 0,2
30 Vehicle insurance -1,3 -0,3 0,0 0,1 4,6 4,6 0,4
16 Second hand cars -1,2 -0,2 0,1 -0,1 3,3 3,3 0,1
Difference with 2012
Improved most since 2012
Deteriorated most since 2012
MPIComparability
(Avg)Trust (Avg)
Expectations
(Avg)
Problems
(%)
Complaints
(%)Choice (Avg)
59 Off-line gambling services 1.1 -0.6* 0.5* 0.5* -0.8 -20.6* -1*
38 Vehicle rental services 0.1 -0.5* 0 0.4* -2.2 16* -0.3*
42 Commercial sport services -0.1 0.2 -0.2 0 0.9 14.5* 0.1
43 Culture and entertainment -0.4 0.2 -0.3* 0.1 2.1 4.7 0.2
60 On-line gambling services -0.6 -0.8* -0.3 0.6* -5.6* 38* -1.5*
MPIComparability
(Avg)Trust (Avg)
Expectations
(Avg)
Problems
(%)
Complaints
(%)Choice (Avg)
51 Mortgages -12.5* -0.5* -1.7* -1.6* 14.4* 19.4* -2.2*
30 Vehicle insurance -11.4* -1.9* -1.2* -1* 6.8* 21.1* -2*
1 Fruit and vegetables -10.7* -1.8* -0.9* -0.7* 13.3* -3.4 -1.8*
34 Internet provision -10.1* -1.2* -0.9* -0.6* 17.2* 9.6* -1.6*
41 Cafés, bars and restaurants -7.5* -1.6* -0.8* -0.3* 2 12.1* -0.2
5 Bottom markets
(compared to EU28 Average)
Difference with EU28
5Top markets
(compared to EU28 Average)

EN 168 Error! No document variable supplied. EN
Annex III – Market names
Market name Definition
Airline Services Airlines
Alcoholic Beverages * Spirits, wine, beer (excluding drinks in cafés, bars and restaurants).
Books, Magazines and
Newspapers Books, magazines, newspapers, stationary, periodicals (excluding postal delivery).
Bread, Cereals, Rice and Pasta Food — bread and cereals, rice flour, bakery products, pizzas, pasta.
Cafés, Bars and Restaurants Restaurants and bars, cafés, brasseries, caterers, takeaways, pubs, mobile food vendors, night
clubs, discotheques, other.
Clothing and Footwear Clothing (including tailor-made goods) and footwear, children’s clothing, women’s clothing,
men’s clothing, sportswear, hats, clothing material, furs, protective clothing, handbags and accessories, children’s footwear, women’s footwear, men’s footwear, sports footwear, other.
Cultural & Entertainment
Services Theatres, cinemas, museums, zoos, amusement parks, ticket-selling services, other.
Current Bank Accounts * Current accounts, debit cards.
Dairy Products ** Milk, cheese, yoghurt, cream, etc.
Electricity Services Electricity.
Fixed Telephone Services Fixed telephone services, telecom provision, other.
Fruit and Vegetables Food — fruit and vegetables.
Fuels * Fuels for vehicles, petrol and diesel.
Furniture and Furnishings
Upholstered furniture, non-upholstered furniture, beds and mattresses, kitchen furniture, fitted
furniture, bathroom fittings, antiques, leather furniture, cots, high chairs, other nursery furniture, garden furniture, other, floor coverings (carpets, mats and rugs, laminates, ceramics,
wood, linoleum, underlay, other), household textiles (bedding, cushions, curtains and blinds, furniture fabrics, other), glassware, tableware and household utensils (crockery, cooking and
dining utensils, glassware, other).
Gas Services Gas
Glasses and Lenses ** Glasses, lenses, sunglasses, etc.
Holiday Accommodation Hotels and other holiday accommodation (e.g. bed & breakfast, youth hostel), caravan sites,
camp sites.
Home Insurance Dwelling insurance.
House & Garden Upkeep
Products
House maintenance and improvement goods, DIY materials (excluding paint and wall
coverings), paint, wall coverings, fencing, sheds, power tools (e.g. drills, chainsaws), non-
electrical tools, gardening equipment/tools (non-electrical), lawn mowers, others.
House & Garden Upkeep
Services
House maintenance and improvement services, roofing, decorator services, plumbers and
plumbing, floor covering/fitting, central heating (installation and service), electrical services
and installations, bricklayers, carpenters, painters, glaziers, iron-mongers, gardeners, tree-
surgeons, tarmacking and paving, fitted kitchens, insulation, burglar alarms, wall coating, damp proofing, solar heating, guttering, chimney sweeps, replacing doors, fitting bathrooms,
swimming pools, other.

EN 169 Error! No document variable supplied. EN
Market name Definition
ICT Products
Information Communication Technology (ICT) goods, personal computers, self-built computers, computer accessories, printers and scanners, games consoles, portable games
players, computer software, computer software upgrades, laptops, notebooks and tablet PCs,
PDAs and smart phones, mobile phone devices, fixed phone devices, modems, decoders, other.
Internet Provision Internet provision.
Investments, Pensions, Securities Banking investments, private pensions and securities, packaged investments, portfolio and
fund management, private personal pensions, stock broking and derivatives.
Large Household Appliances Large domestic appliances, electronic cookers, fridges and freezers, washing machines, tumble
dryers, washer-dryers (combined), dishwashers, space heaters, fixed heaters, vacuum cleaners, microwave ovens, sewing machines, portable heating appliances, other.
Legal and Accountancy Services
** Lawyers, legal advice, accountants, tax advisors, auditors, other.
Leisure Goods * Musical instruments, toys, games (non-digital), CDs, DVDs, audio and video tapes, computer
and video games, hobby goods (e.g. stamps, model cars, etc.), not including players for CDs, DVDs, game-consoles, etc.
Life Insurance ** Private life-insurance that provides financial benefits to a designated person upon the death of
the insured, including endowment insurance and annuities.
Loans and Credit Cards Loans, banking-credit, credit cards, store cards, consumer credit, revolving credit.
Meat and Meat Products Lamb, veal, pork, beef, poultry, goats’ meat, mutton, other.
Mobile Telephone Services Mobile telephony services, telephone provision, text messages, other.
Mortgages ** Banking — mortgages.
New Cars New cars.
Non-Prescription Medicines Over-the-counter medication.
Non-Alcoholic Beverages* Coffee, tea, cocoa, mineral waters, soft drinks, fruit and vegetable juices (excluding drinks in
cafés, bars and restaurants).
Offline gambling and lottery
services*** Gambling and betting involving monetary value provided at a physical location – lotteries,
casino games, poker games, bingo, sports betting (including horse and dog racing).
Online gambling and betting
services***
Gambling and betting involving monetary value provided by electronic means or any other technology such as mobile phones, digital TV – lotteries, casino games, poker games, bingo,
sports betting (including horse and dog racing).
Other Electronic Products Electronic goods (non-ICT/recreational) DVD players-recorders, VCRs, TVs, CDs, hi-fi media
players, non-portable CD, portable radios, cameras, video cameras. Photographic equipment, CDs (blank), DVDs (blank), audio and video tapes (blank), other.
Package Holidays & Tours Package travel and tours, other.
Personal Care Products Toiletries and electrical appliances, cosmetics, toiletries (including nappies), wigs, hair-care
products, perfumes, electric razors and hair trimmers, hair dryers, curling tongs and styling combs, other.
Personal Care Services * Hairdressers, diet clubs/centres, beauty treatments, hair therapy, cosmetic therapy, nail-care
services, spas, saunas, hammams.
Postal Services Correspondence packages, express mail, periodical publications, issuance and sale of postage stamps.

EN 170 Error! No document variable supplied. EN
Market name Definition
Real Estate Services * Real estate agents and letting agents.
Second-Hand Cars Second-hand cars.
Small Household Appliances Small domestic household appliances, food-processing appliances, coffee machines, irons, toasters, grills, other.
Sport and Leisure Services Health clubs and gyms, sports facilities, sports instructors (not including ‘not-for profit’, sports
clubs or activities run on a non-profit basis by volunteers and such).
Train Services Railways.
Tram, Local Bus & Metro
Services Tram, local bus, metro and underground.
TV Provision **
TV subscriptions (not TV licence fees), cable TV network subscriptions, satellite TV
subscriptions, Digital Terrestrial Television subscriptions, telephone
network/modem/internet/TV subscriptions and other such services with an ongoing contract (subscription), not including licence fees for public service channels.
Vehicle Insurance Insurance - transport,(car, other road vehicles boat, aircraft)
Vehicle Rental Services Car rental, motorcycle rental, van rental, caravan rental, boat rental, other rental.
Vehicle Upkeep & Repair
Services Maintenance and repair of vehicles and other transport, franchise garage or dealer, independent
garage, road assistance, other.
Water Provision Water provision.
(*) The definition of these markets was amended slightly in 2011.
(**) These markets are either new or not comparable with 2010.
(***) These markets are not comparable with 2012.