16.400 / 16.453j / 2.181j human factors...
TRANSCRIPT
16.400 / 16.453J / 2.181J
Human Factors EngineeringFall, 2002
Signal Detection Theory and Vigilance
Jim Kuchar
Two In-Class Experiments Today
1. Hot / Cold decision-making (signal detection theory)
2. VigilanceThroughout today’s lecture:Quietly keep a count of each time you see a sudden “x” or “+”Keep separate counts for “x” and “+”
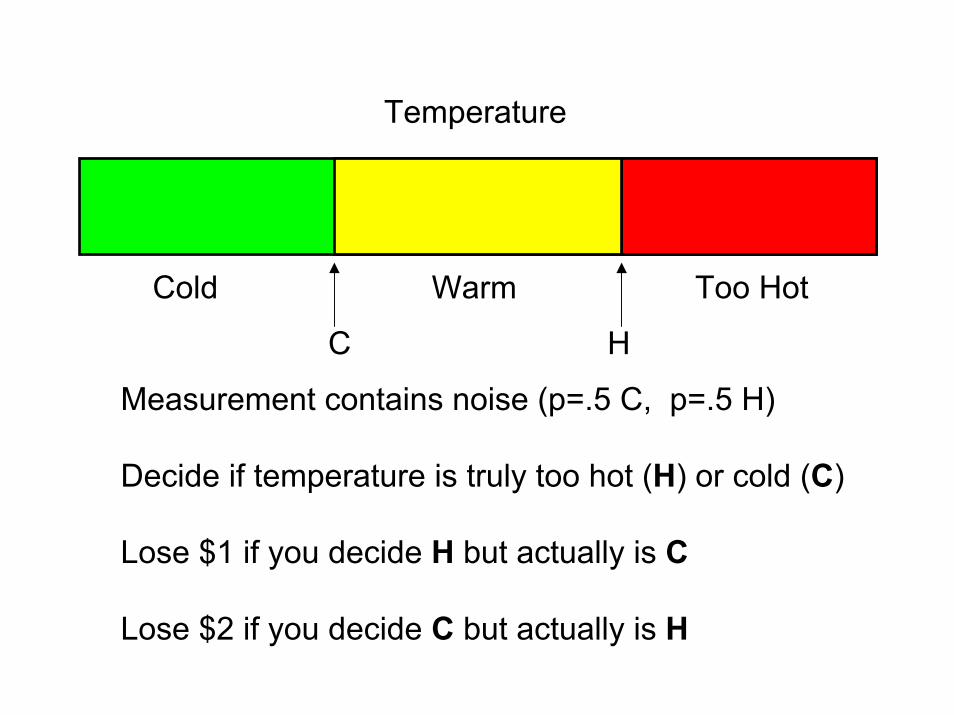
Temperature
Cold Warm Too Hot
C H
Measurement contains noise (p=.5 C, p=.5 H)
Decide if temperature is truly too hot (H) or cold (C)
Lose $1 if you decide H but actually is C
Lose $2 if you decide C but actually is H

Signal Detection Theory (SDT)
• Formal model of information and decision-making criteria
• Allows for optimal decision-making under certain conditions
• Provides model of factors affecting human decision-making behavior
• History– Originally developed in late 1940s for radar detection problems– Extended to human perception and decision-making in 1960s– 1990s extended to complex human/automation alerting problems
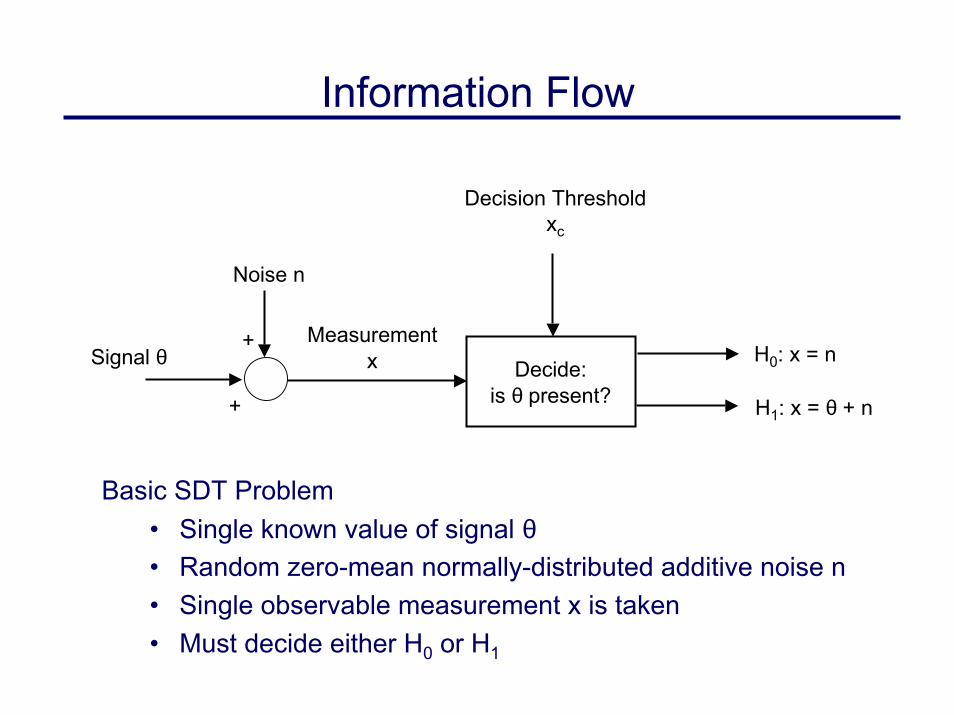
Information Flow
Decision Thresholdxc
Noise n
Measurementx
+ H0: x = nSignal θ Decide:is θ present?+ H1: x = θ + n
Basic SDT Problem• Single known value of signal θ• Random zero-mean normally-distributed additive noise n• Single observable measurement x is taken• Must decide either H0 or H1
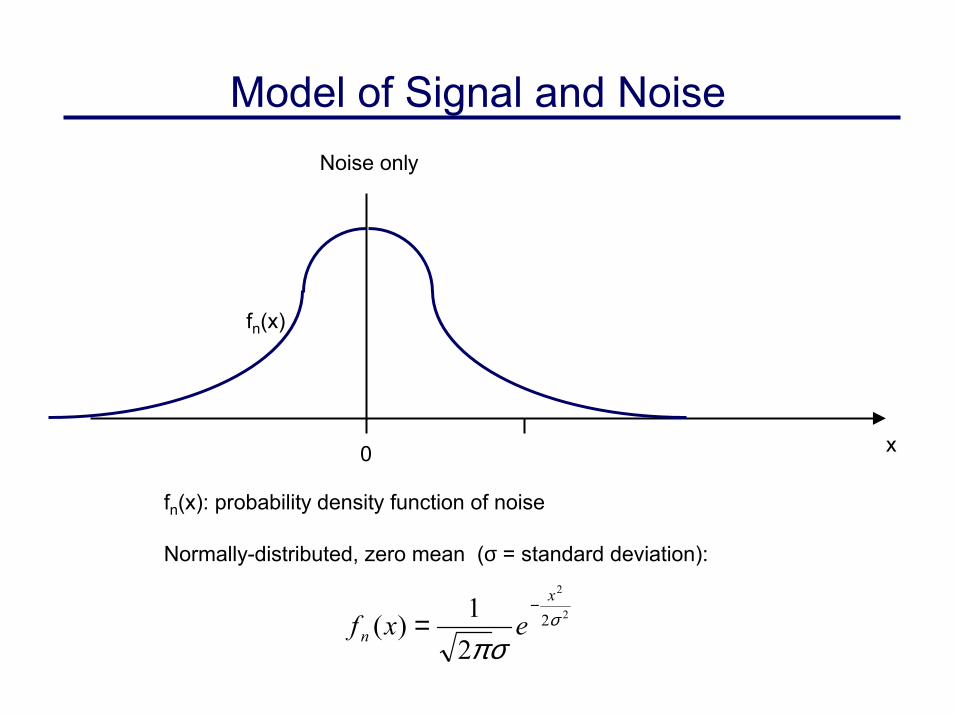
Model of Signal and NoiseNoise only
fn(x)
x0
fn(x): probability density function of noise
Normally-distributed, zero mean (σ = standard deviation):
2
2
2
21)( σ
σπ
x
n exf−
=
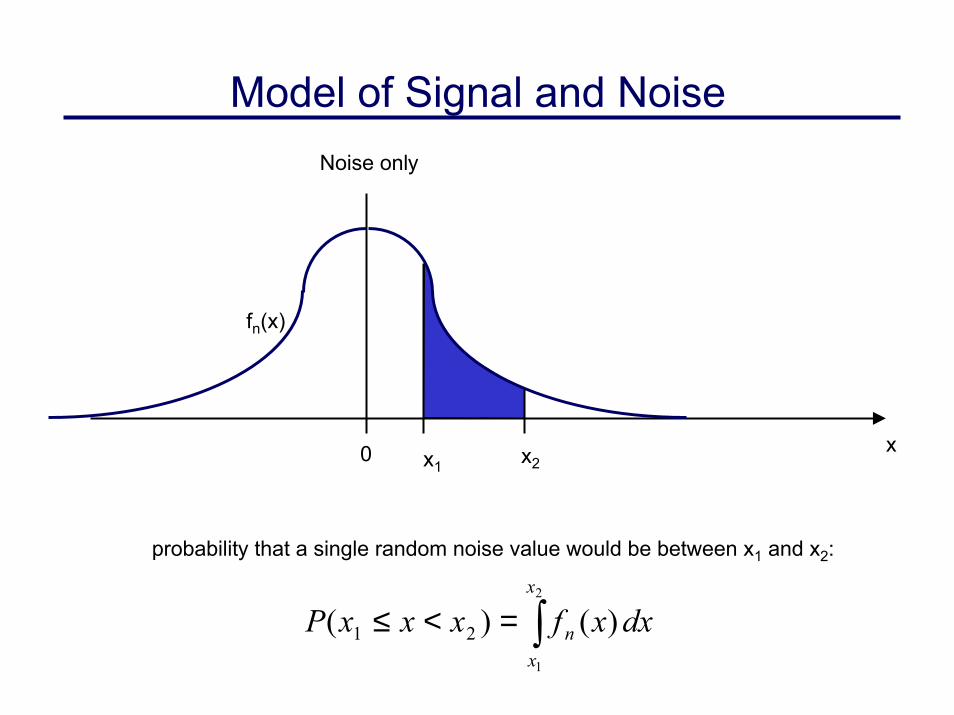
Model of Signal and NoiseNoise only
fn(x)
x0 x2x1
probability that a single random noise value would be between x1 and x2:
∫=<≤2
1
)()( 21
x
xn dxxfxxxP

Model of Signal and NoiseNoise only
fn(x)
fs(x)
Signal + Noise
x0 θ
fs(x): probability density function of noise + signal
Normally-distributed, mean θ (σ = standard deviation):
2
2
2)(
21)( σ
σπ
θ−−=
x
s exf
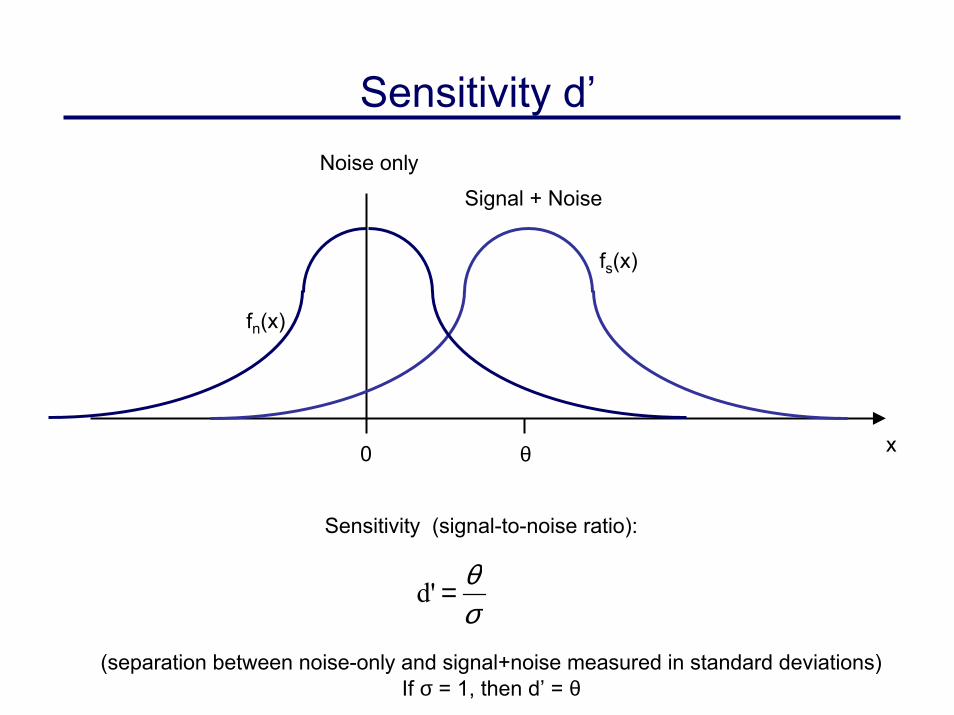
Sensitivity d’Noise only
fn(x)
fs(x)
Signal + Noise
x0 θ
Sensitivity (signal-to-noise ratio):
σθ=d'
(separation between noise-only and signal+noise measured in standard deviations)If σ = 1, then d’ = θ
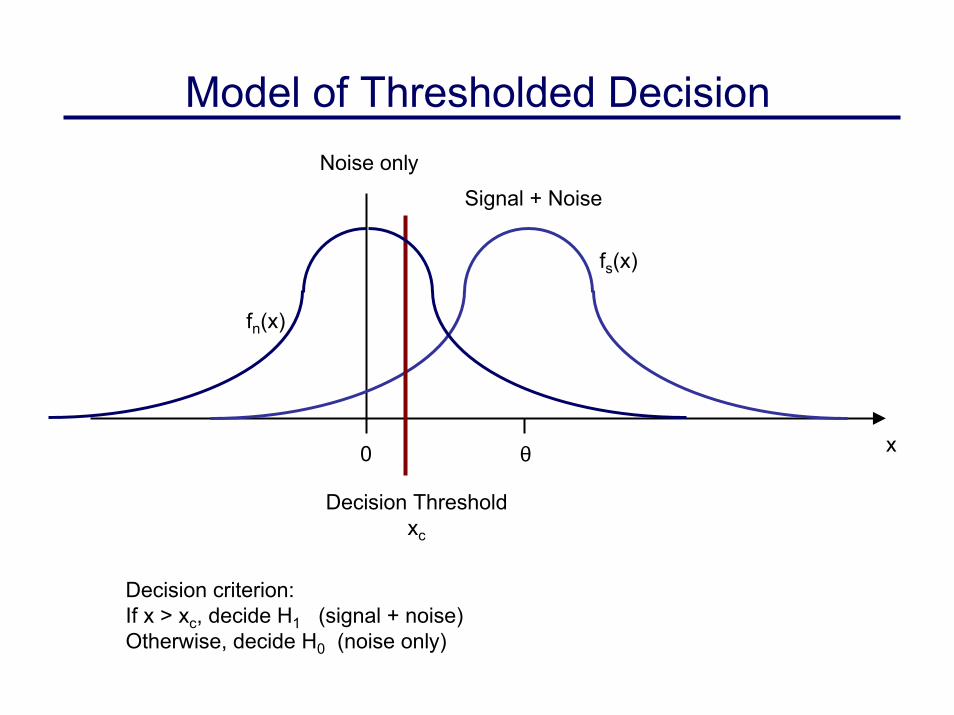
Model of Thresholded DecisionNoise only
fn(x)
fs(x)
Signal + Noise
x0 θ
Decision Thresholdxc
Decision criterion:If x > xc, decide H1 (signal + noise)Otherwise, decide H0 (noise only)

Model of Thresholded DecisionNoise only
fn(x)
fs(x)
Signal + Noise
x0 θx
Decision Thresholdxc
Decide Noise onlyDecision criterion:If x > xc, decide H1 (signal + noise)Otherwise, decide H0 (noise only)

Model of Thresholded DecisionNoise only
fn(x)
fs(x)
Signal + Noise
x0 θxDecision Threshold
xc
Decide Signal + NoiseDecision criterion:If x > xc, decide H1 (signal + noise)Otherwise, decide H0 (noise only)
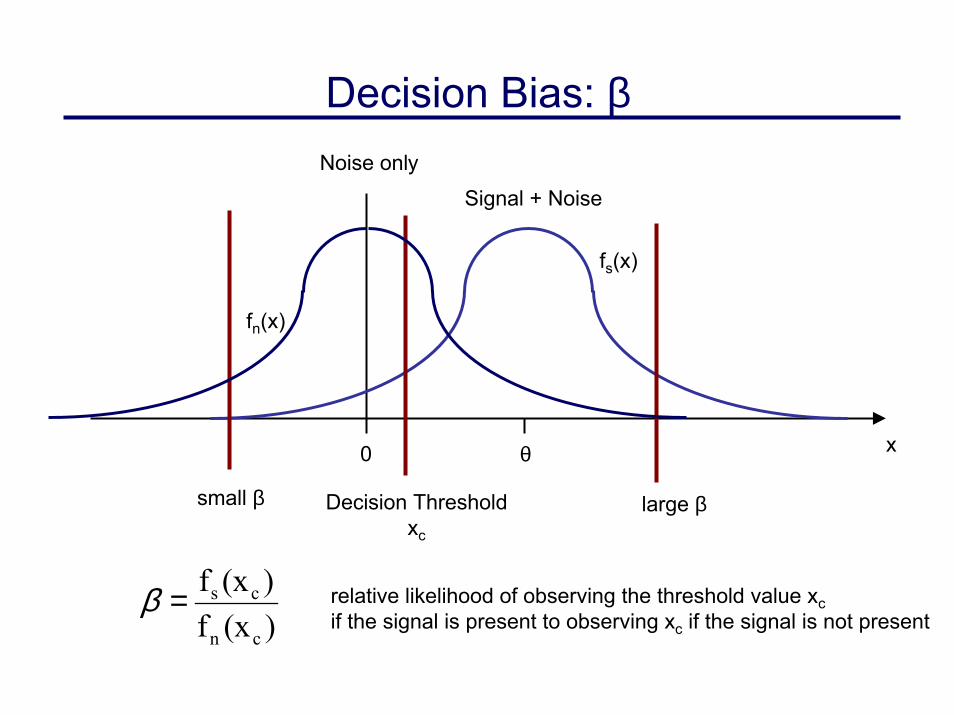
Decision Bias: βNoise only
fn(x)
fs(x)
Signal + Noise
x0 θ
small β Decision Thresholdxc
large β
)(xf)(xf
cn
cs=β relative likelihood of observing the threshold value xcif the signal is present to observing xc if the signal is not present
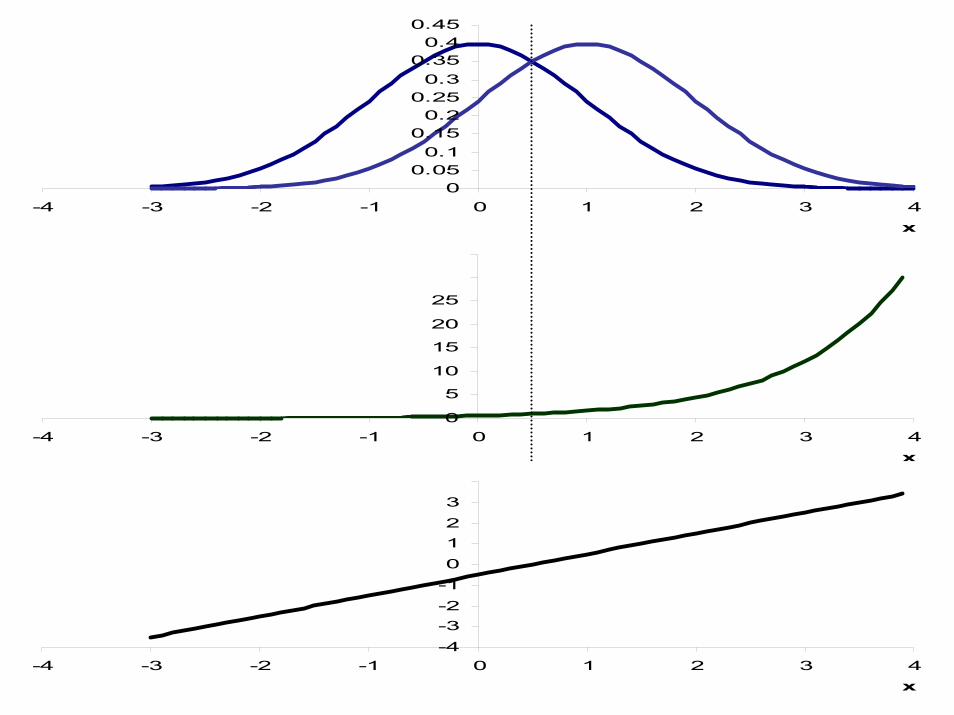
00.050.1
0.150.2
0.250.3
0.350.4
0.45
-4 -3 -2 -1 0 1 2 3 4x
30
35 β
0
5
10
15
20
25
-4 -3 -2 -1 0 1 2 3 4x
4 ln(β)
-4-3-2-10123
-4 -3 -2 -1 0 1 2 3 4x
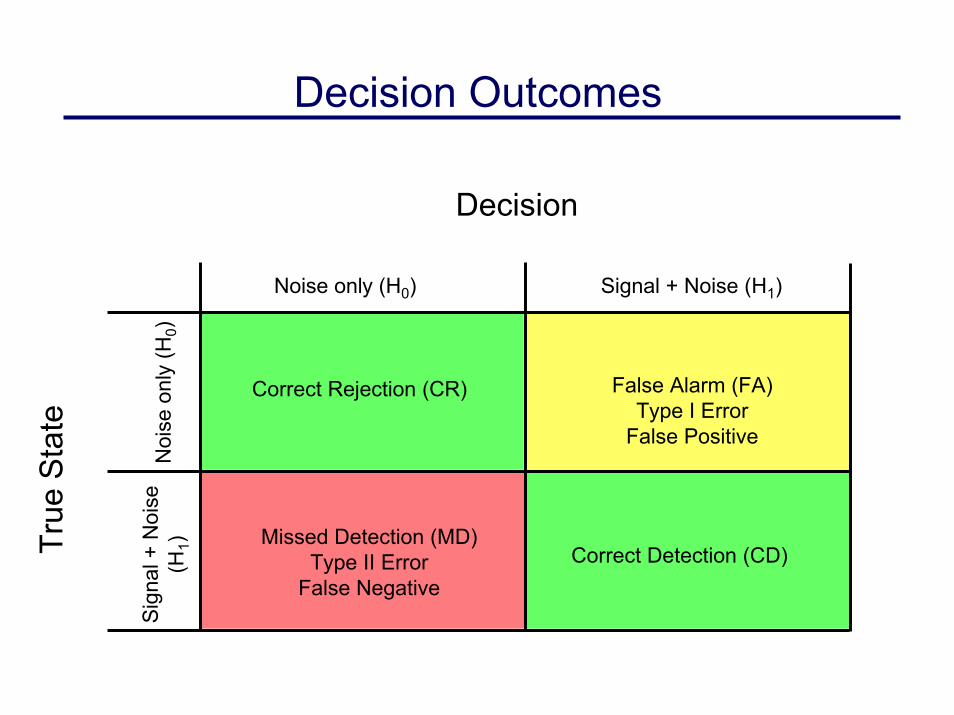
Decision Outcomes
Decision
True
Sta
te
Noi
se o
nly
(H0)
Sign
al +
Noi
se(H
1)
Correct Rejection (CR) False Alarm (FA)Type I Error
False Positive
Missed Detection (MD)Type II Error
False NegativeCorrect Detection (CD)
Noise only (H0) Signal + Noise (H1)
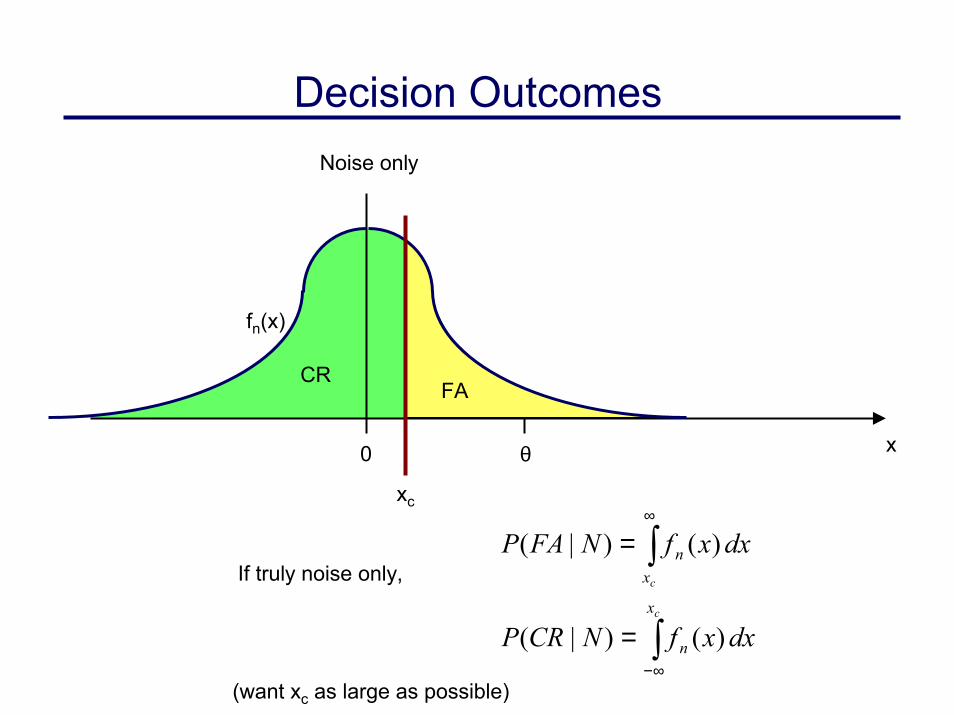
Decision OutcomesNoise only
fn(x)
CRFA
x0 θ
xc
If truly noise only,
(want xc as large as possible)
∫
∫
∞−
∞
=
=
c
c
x
n
xn
dxxfNCRP
dxxfNFAP
)()|(
)()|(

Decision Outcomes
CDMD
Signal + Noise
fs(x)
x0 θ
xc
If signal is truly present,
∫
∫
∞−
∞
=
=
c
c
x
s
xs
dxxfSMDP
dxxfSCDP
)()|(
)()|(
(want xc as small as possible)

Receiver Operating Characteristic (ROC)
xc small, β small
xc large, β large
increasing β
operating point
1
P(CD|S)
010 P(FA|N)

Receiver Operating Characteristic (ROC)
increasing d’
d’ = 0
A given value of d’ traces outa unique ROC curve as β varies
1
P(CD|S)
010 P(FA|N)
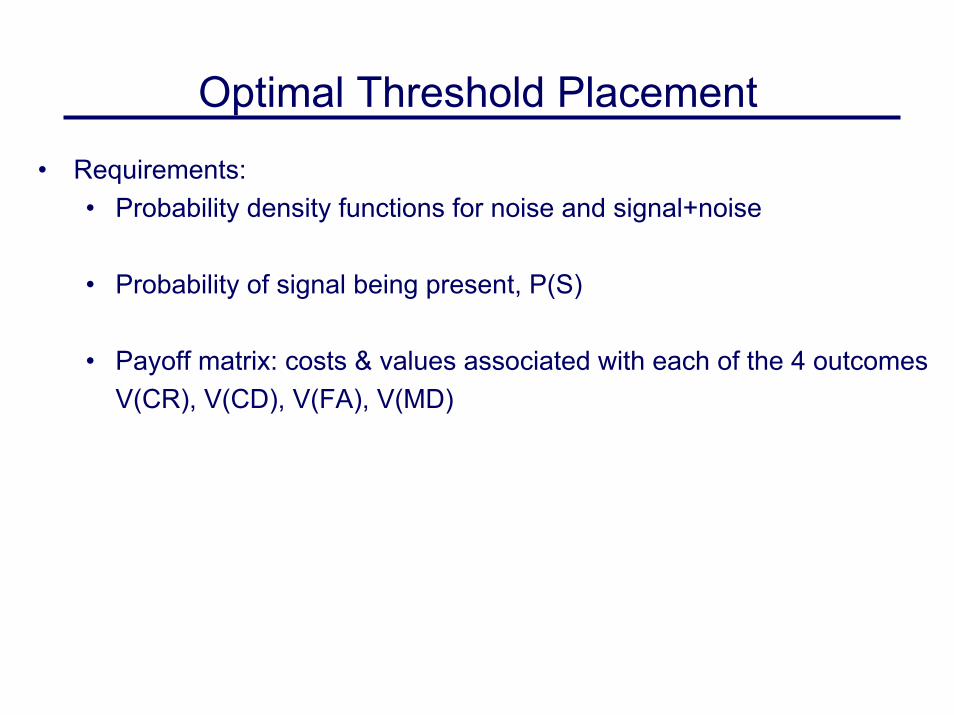
Optimal Threshold Placement• Requirements:
• Probability density functions for noise and signal+noise
• Probability of signal being present, P(S)
• Payoff matrix: costs & values associated with each of the 4 outcomesV(CR), V(CD), V(FA), V(MD)
Probabilities of OutcomesOur earlier definitions of P(FA|N), P(MD|S), P(CR|N), P(CD|S) are
conditional probabilities
That is, P(FA|N) is the probability of a false alarm occurringif we are given the fact that no signal is present
P(FA|N) is NOT the unconditional probability (or expected frequency) of a false alarm occurring when we don’t know whether the signal is present
Example: say β is very small, so P(FA|N) ≈ 1 but the signal is almost always present. Then we would expect very few false alarms to actually occur even though P(FA|N) = 1.

Unconditional Probabilities of Outcomes
P(FA) = P(FA | N) P(N) = P(FA | N) (1-P(S))
P(CR) = P(CR | N) P(N) = P(CR | N) (1-P(S))
P(MD) = P(MD | S) P(S)
P(CD) = P(CD | S) P(S)

Expected Value of Decision-MakingJ = (Probability of outcome) x (Value of outcome)
summed over all outcomes
J = P(FA | N) (1-P(S)) V(FA) + P(CR | N) (1-P(S)) V(CR) +P(MD | S) P(S) V(MD) + P(CD | S) P(S) V(CD)
Maximize value / minimize cost:
0)()()|()()()|(
)())(1()|()())(1()|(
=∂
∂+∂
∂
+−∂
∂+−∂
∂=∂∂
CDVSPxSCDPMDVSP
xSMDP
CRVSPxNCRPFAVSP
xNFAP
xJ
cc
ccc
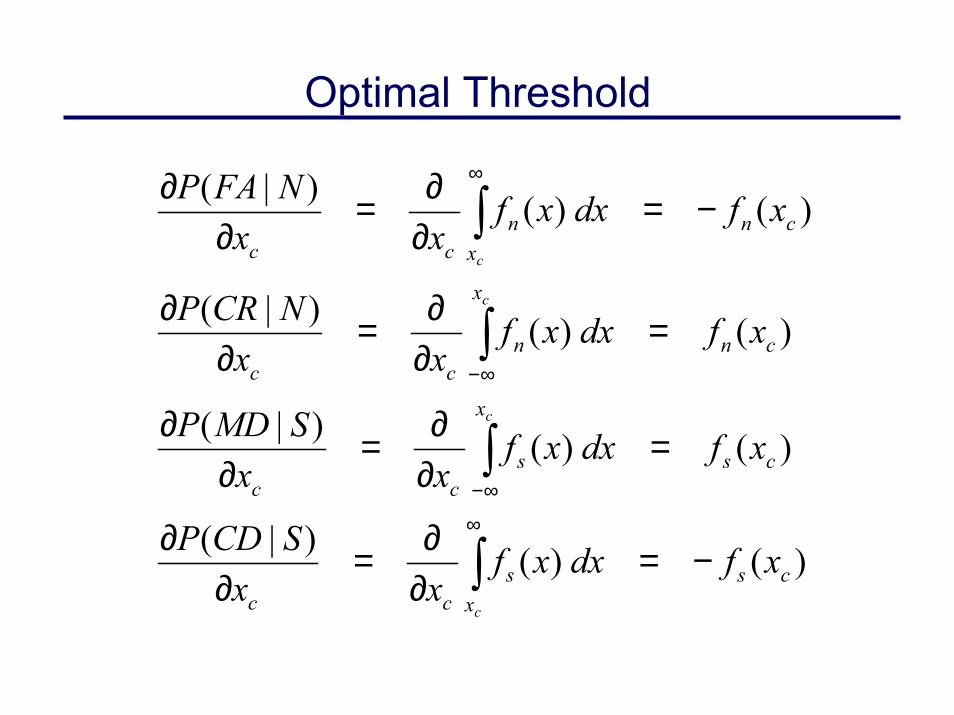
Optimal Threshold
)()()|(
)()()|(
)()()|(
)()()|(
csx
scc
cs
x
scc
cn
x
ncc
cnx
ncc
xfdxxfxx
SCDP
xfdxxfxx
SMDP
xfdxxfxx
NCRP
xfdxxfxx
NFAP
c
c
c
c
−=∂∂=
∂∂
=∂∂=
∂∂
=∂∂=
∂∂
−=∂∂=
∂∂
∫
∫
∫
∫
∞∞−
∞−
∞
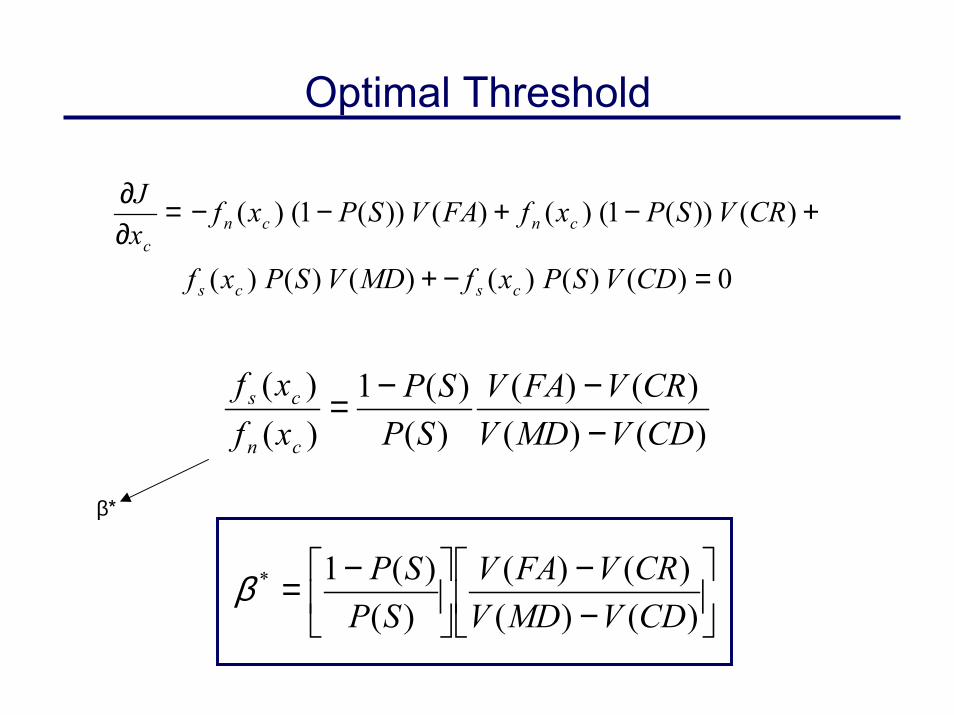
Optimal Threshold
0)()()()()()(
)())(1()()())(1()(
=−+
+−+−−=∂∂
CDVSPxfMDVSPxf
CRVSPxfFAVSPxfxJ
cscs
cncnc
)()()()(
)()(1
)()(
CDVMDVCRVFAV
SPSP
xfxf
cn
cs
−−−=
β*
−−
−=)()()()(
)()(1*
CDVMDVCRVFAV
SPSPβ

Optimal Threshold
−−
−=)()()()(
)()(1*
CDVMDVCRVFAV
SPSPβ
or, in terms of the threshold setting xc
2ln *
* θθβ +=cx
when σ = 1
00.050.1
0.150.2
0.250.3
0.350.4
0.45
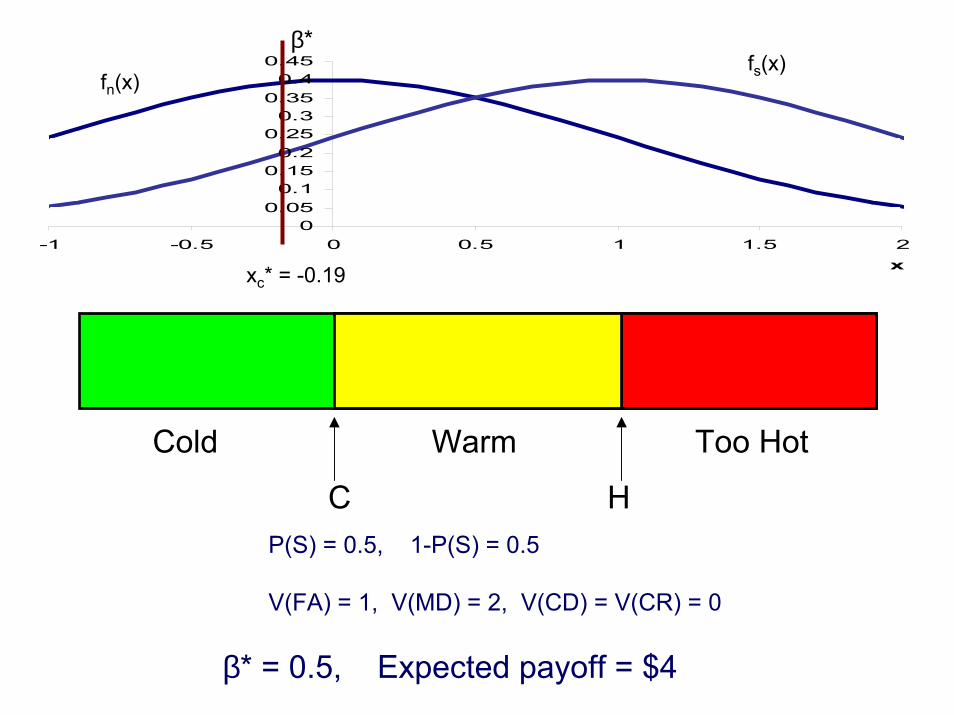
-1 -0.5 0 0.5 1 1.5 2x
fn(x)fs(x)
β*
xc* = -0.19
Cold Warm Too Hot
C HP(S) = 0.5, 1-P(S) = 0.5
V(FA) = 1, V(MD) = 2, V(CD) = V(CR) = 0
β* = 0.5, Expected payoff = $4
00.050.1
0.150.2
0.250.3
0.350.4
0.45
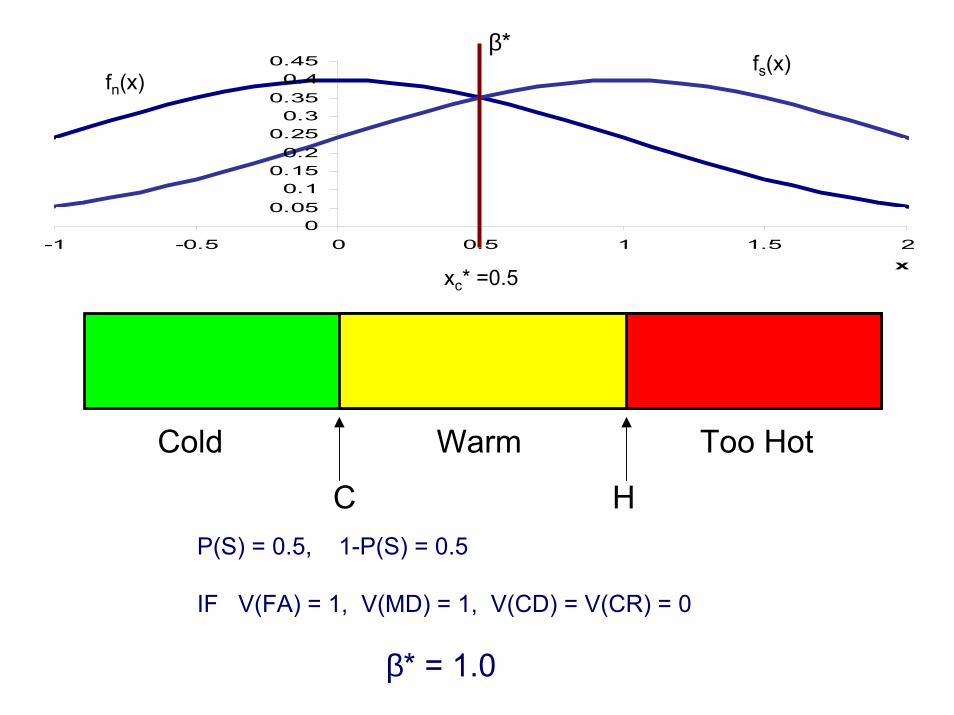
-1 -0.5 0 0.5 1 1.5 2x
fn(x)fs(x)
β*
xc* =0.5
Cold Warm Too Hot
C HP(S) = 0.5, 1-P(S) = 0.5
IF V(FA) = 1, V(MD) = 1, V(CD) = V(CR) = 0
β* = 1.0
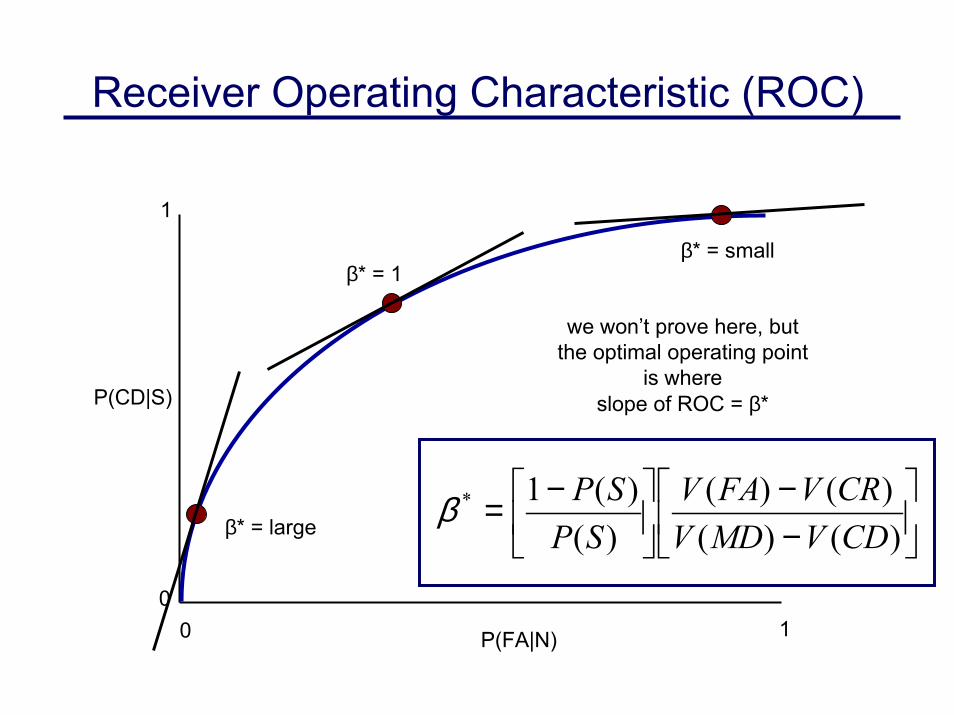
Receiver Operating Characteristic (ROC)
we won’t prove here, butthe optimal operating point
is whereslope of ROC = β*
−−
−=)()()()(
)()(1*
CDVMDVCRVFAV
SPSPβ
β* = 1
β* = large
β* = small
1
P(CD|S)
010 P(FA|N)

Human Performance From SDT Point of ViewHumans tend to set β closer to 1 than is optimal: “sluggish beta”
.1 1 10.1
1
Hum
an’s
β
Optimal Beha
Typical Behavior
vior10
Optimal β

Application of SDT: VigilanceHuman observer must detect periodic (but random) rare event
Vigilance decreases over time: “vigilance decrement”
Sensitivity decrement (d’ decreases)Beta increment (CD rate reduces)
P(FA|N)0 1
1
P(CD|S)
0

Sensitivity DecrementIn a sustained attention task,
Fatigue increases
Subject looks away more often, misses signals
Mental workload increases, which may result in reduced sensitivity

SDT Explanation of β Increment in Vigilance
−−
−=)()()()(
)()(1*
CDVMDVCRVFAV
SPSPβ
Human misses a signal
Estimate of P(S) decreases
Results in increase in β*
Human less likely to have CD or FAmore likely to miss another signal, leads to vicious circle
“expectancy theory”

Mitigating Losses in Vigilance
• Sensitivity loss– Refresh with examples of the target
• reduces memory load remembering what the target is– Increase target salience
• blinking, audio cues, etc.• may distract or otherwise interfere with other activities• automation may not be entirely accurate
– Reduce event rate or allow subjects to vary event rate• e.g., assembly line
– Training• automaticity reduces workload (but don’t overdo it!)

Mitigating Losses in Vigilance
• Response bias shift– Consistent instructions– Feedback on success / failure at the task– Introduce false signals– Allow use of confidence level in decision

16.400 / 16.453J / 2.181J
Human Factors EngineeringFall, 2002
Alerting and Warning Systems
Jim Kuchar
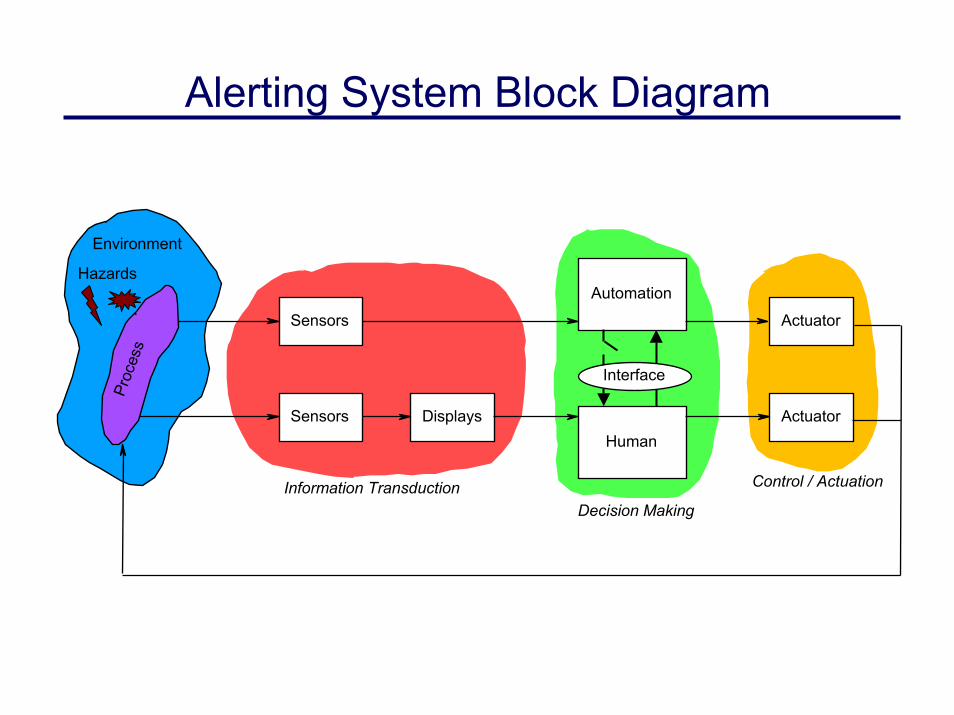
Alerting System Block Diagram
Sensors DisplaysHuman
Actuator
Sensors
Automation
Actuator
Environment
Proc
ess
Information Transduction Control / Actuation
Interface
Hazards
Decision Making

Why Have an Alerting System?
• Human can’t observe a threat– seeing mountains through clouds
• Human isn’t observing a threat– physically not attending to information
(looking down instead of out the window)– limited / no spare attention (sensory or mental load)
• Human may not understand level of risk– deliberate low-level flight
• Human may be taking the wrong action– turning left instead of right

Alerting System Functions
• Detect event or condition that warrants awareness or action
• Attract attention of the human
• Convey the nature of the situation
• Convey the urgency of the situation
• Provide information to help in correcting the situation
• Have a means for inhibiting or acknowledging alerts
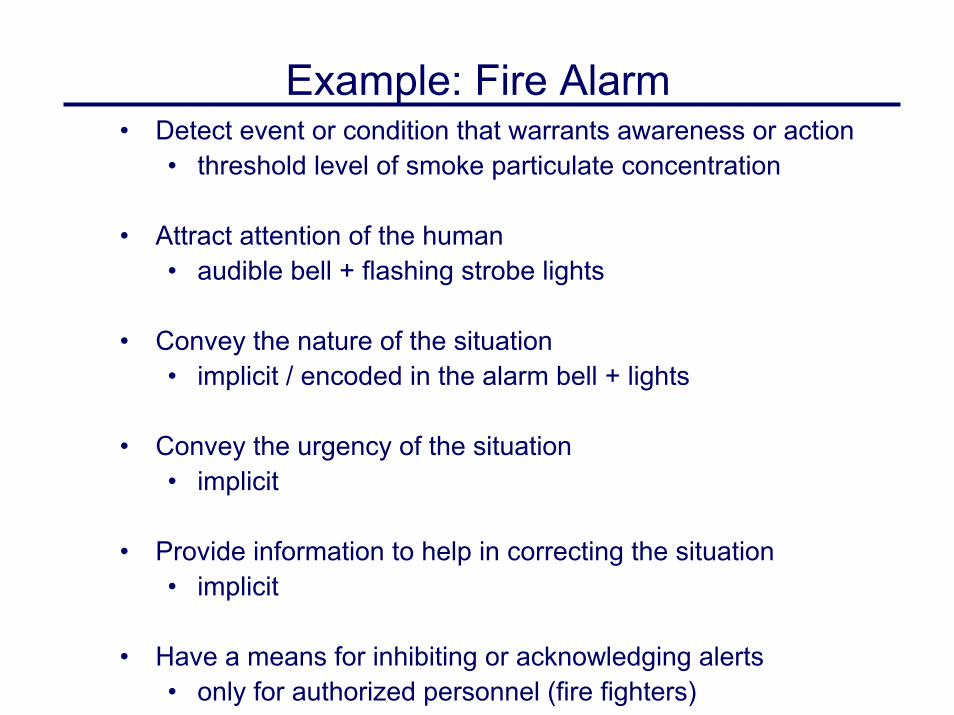
Example: Fire Alarm• Detect event or condition that warrants awareness or action
• threshold level of smoke particulate concentration
• Attract attention of the human• audible bell + flashing strobe lights
• Convey the nature of the situation• implicit / encoded in the alarm bell + lights
• Convey the urgency of the situation• implicit
• Provide information to help in correcting the situation• implicit
• Have a means for inhibiting or acknowledging alerts• only for authorized personnel (fire fighters)
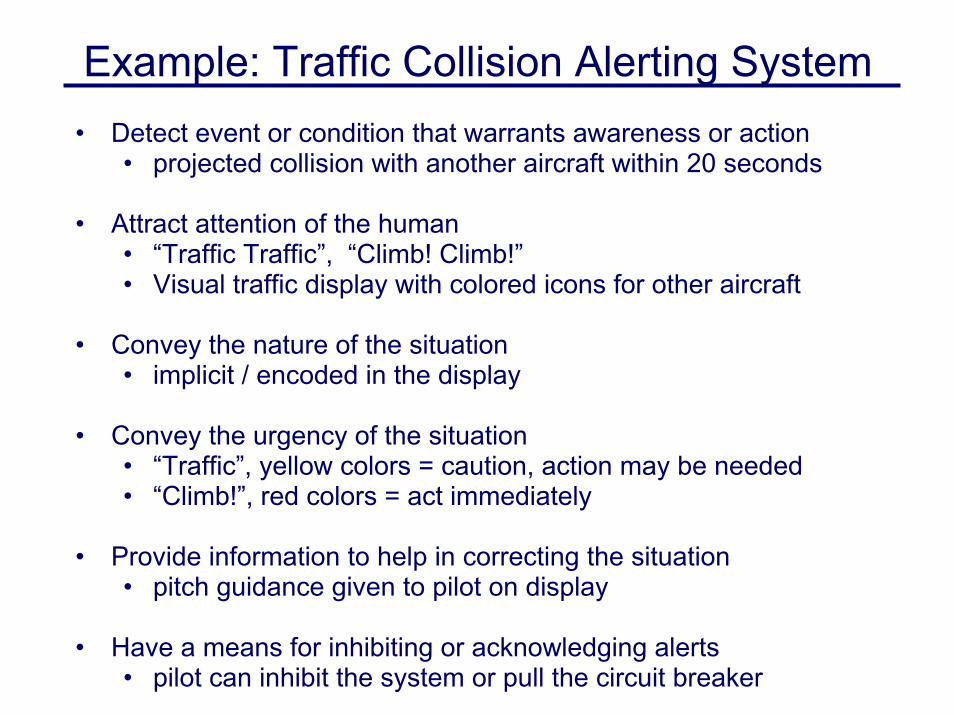
Example: Traffic Collision Alerting System• Detect event or condition that warrants awareness or action
• projected collision with another aircraft within 20 seconds
• Attract attention of the human• “Traffic Traffic”, “Climb! Climb!”• Visual traffic display with colored icons for other aircraft
• Convey the nature of the situation• implicit / encoded in the display
• Convey the urgency of the situation• “Traffic”, yellow colors = caution, action may be needed• “Climb!”, red colors = act immediately
• Provide information to help in correcting the situation• pitch guidance given to pilot on display
• Have a means for inhibiting or acknowledging alerts• pilot can inhibit the system or pull the circuit breaker

Engineering Design Issues
• Tension between who knows best: human or automation?– is the human already aware of the threat?– does the human need assistance in resolving the threat?– what can’t the automation observe that the human can?– varying levels of personal risk acceptance or judgment of risk
• How to most efficiently transmit information?– Time-critical– Safety / life-critical– High stress, high workload– False alarms have large negative effect

6 Alerting Outcomes
Hazard
Alert SpaceAlert Thresholdcrossing this line triggers the alert
Correct Rejection(CR)
No Alert(NA)
Late Alert(LA)
Unnecessary Alert(UA)
Correct Detection(CD)
Induced Collision(IC)

Attracting Attention• Modes
– Visual– Auditory– Tactile– Olfactory
• To be more effective at attracting attention– Increase signal level– Use multiple modalities
• BUT: Tradeoff between being really good at attracting attentionvs. being too distracting– False alarms - disturb other tasks, reduce confidence– Multiple / concurrent alarms - information overload

Levels of Urgency• Supplemental
– system status
• Advisory– require crew awareness, may require action
• Caution– require immediate awareness and prompt action. If uncorrected, a
warning will occur
• Warning– require immediate corrective action, but secondary to maintaining
flight
• Time-Critical Warning– require unconditionally immediate corrective action– insufficient time for use of other information than that needed to
successfully correct the problem

Typical Threat Categorization• Advisory
– Brake overheat– Cabin call– Electrical bus off in galley
• Caution– Low oil pressure– Landing gear disagree– Open door
• Warning– Gear not down at low altitude– Collision avoidance– Ground proximity– Overspeed
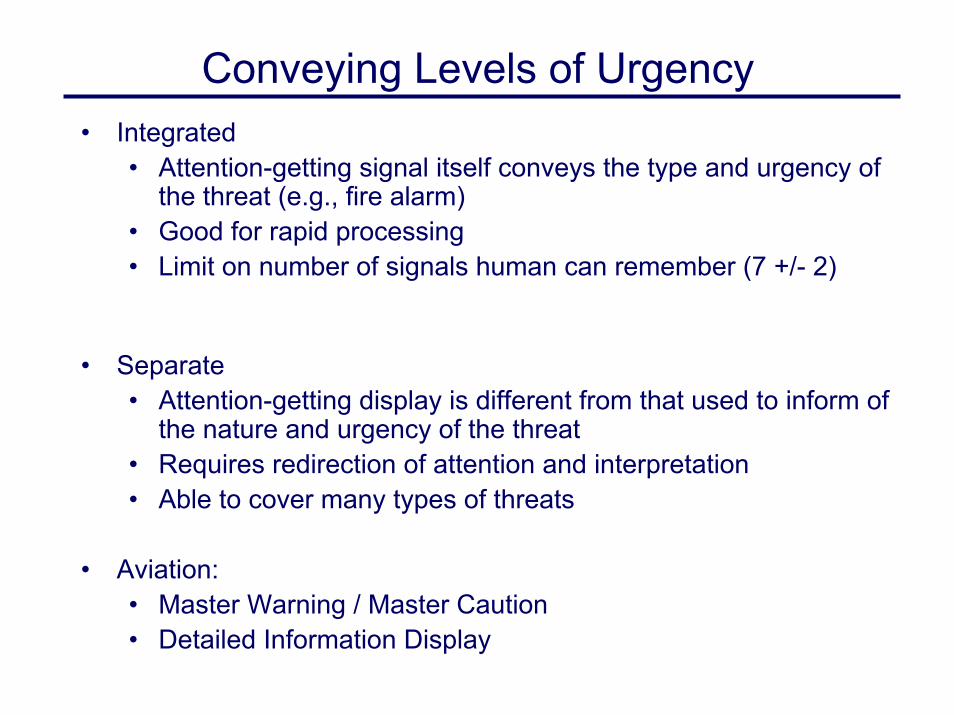
Conveying Levels of Urgency• Integrated
• Attention-getting signal itself conveys the type and urgency of the threat (e.g., fire alarm)
• Good for rapid processing• Limit on number of signals human can remember (7 +/- 2)
• Separate• Attention-getting display is different from that used to inform of
the nature and urgency of the threat• Requires redirection of attention and interpretation• Able to cover many types of threats
• Aviation:• Master Warning / Master Caution• Detailed Information Display
Providing Information to Aid in Resolution
• Implicit– Trained response to stimulus (e.g., fire alarm)
• Explicit– Command is provided (e.g., “Climb!”)
• Guidance– Give safe target state and feedback on progress

Multiple Alert StagesNoise only
Signal + Noise
x0 θ
WarningAdvisory Caution
Increasing certainty that action is requiredIncreasing annoyance to false alarmsProgressing through stages also helps human get ready to take action

Dark Cockpit Philosophy• If all is well, cockpit should be dark and quiet
– Reduces nominal sensory and cognitive load– Aids in responding to new information rapidly
• Information must earn its way into the cockpit
• Operator should only have necessary information– Ability to obtain other information if desired– Requires determining functional requirements for all tasks
• Information that is presented should adhere to strict conventions– Color (Yellow = Caution; Red = Warning)– Brightness– Size– Sound level and waveforms– Phraseology

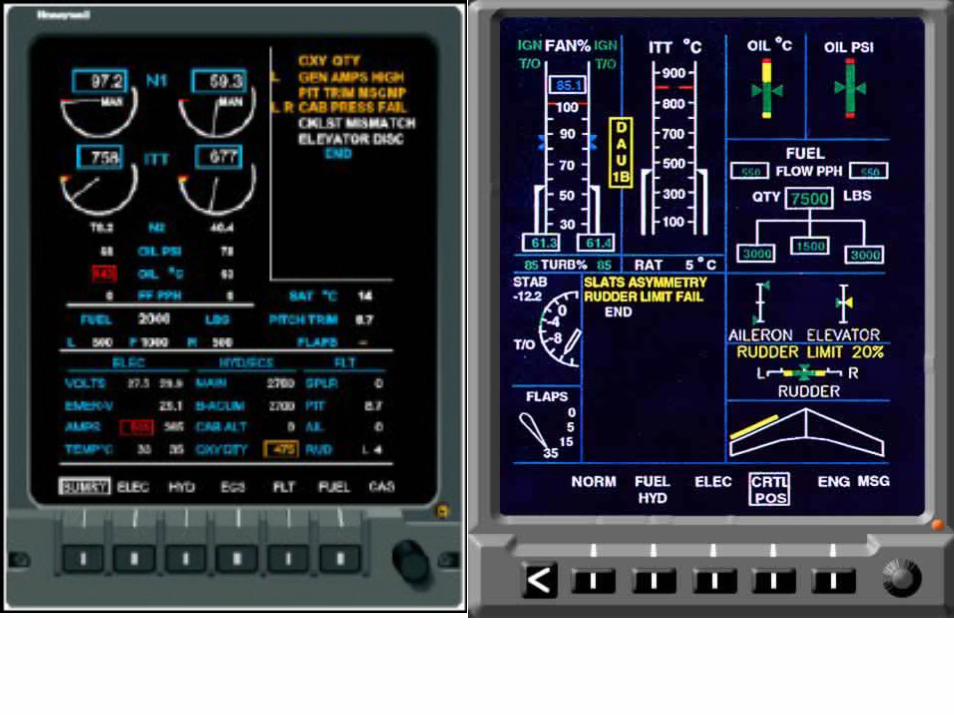
Aviation Warning System Architecture
Visual InformationDisplay
Master VisualDisplay
Verbal Messages
Master AuralDisplay
Time-CriticalDisplay


Master Visual Display Guidelines
• Function: attract attention and convey urgency level
• Locate within 15 degrees of normal line of sight
• Subtend at least 1 degree of visual angle
• Remain on until cancelled or resolved
• Flashing better if many competing background lights, otherwise keep steady (less distracting)
• Faster responses to black text on colored background than vice versa
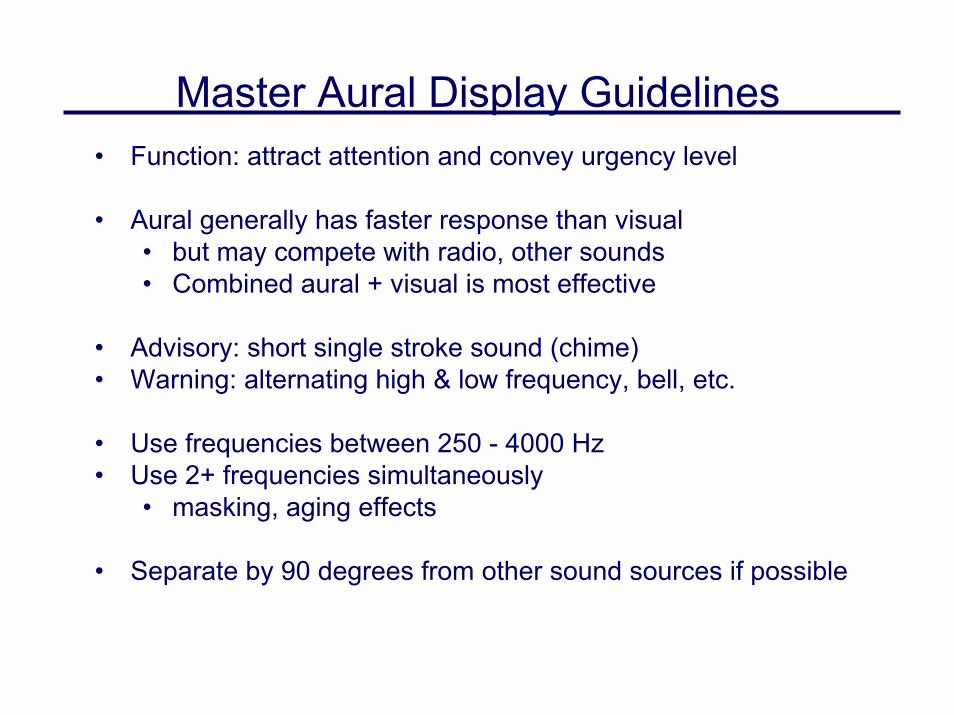
Master Aural Display Guidelines• Function: attract attention and convey urgency level
• Aural generally has faster response than visual• but may compete with radio, other sounds• Combined aural + visual is most effective
• Advisory: short single stroke sound (chime)• Warning: alternating high & low frequency, bell, etc.
• Use frequencies between 250 - 4000 Hz• Use 2+ frequencies simultaneously
• masking, aging effects
• Separate by 90 degrees from other sound sources if possible

Visual Information Display Guidelines• Function:
• Convey type and urgency of threat• Provide assistance in resolving threat• Provide feedback when faults are corrected
• Best if located within 30 degrees of line of sight
• Text or graphics
• Group by urgency level and chronology
• Cue new information (flashing, box outline)

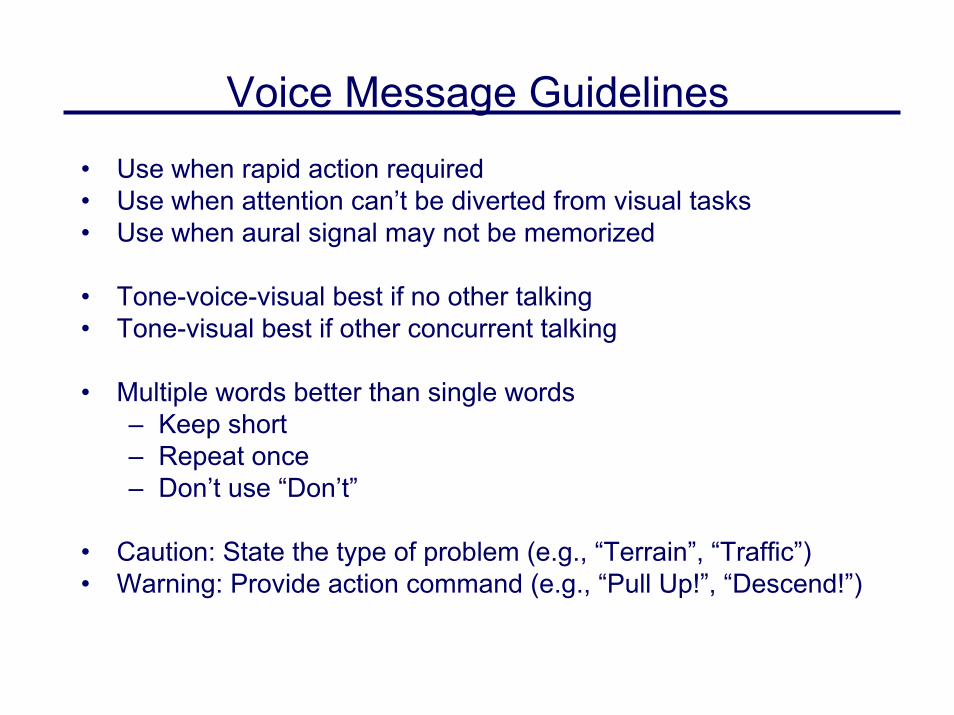
Voice Message Guidelines• Use when rapid action required• Use when attention can’t be diverted from visual tasks• Use when aural signal may not be memorized
• Tone-voice-visual best if no other talking• Tone-visual best if other concurrent talking
• Multiple words better than single words– Keep short– Repeat once– Don’t use “Don’t”
• Caution: State the type of problem (e.g., “Terrain”, “Traffic”)• Warning: Provide action command (e.g., “Pull Up!”, “Descend!”)

Time Critical Display Guidelines• Function: time-critical warnings
• Operator needs to get warning guidance and feedback from same display as used to correct the problem
• Locate within 15 degrees of primary field of view
• Subtend at least 2 degrees of visual angle
• Separate displays for each pilot
• Provide guidance rather than status (e.g., “Climb” vs. “too low”)
• Graphics preferred to text

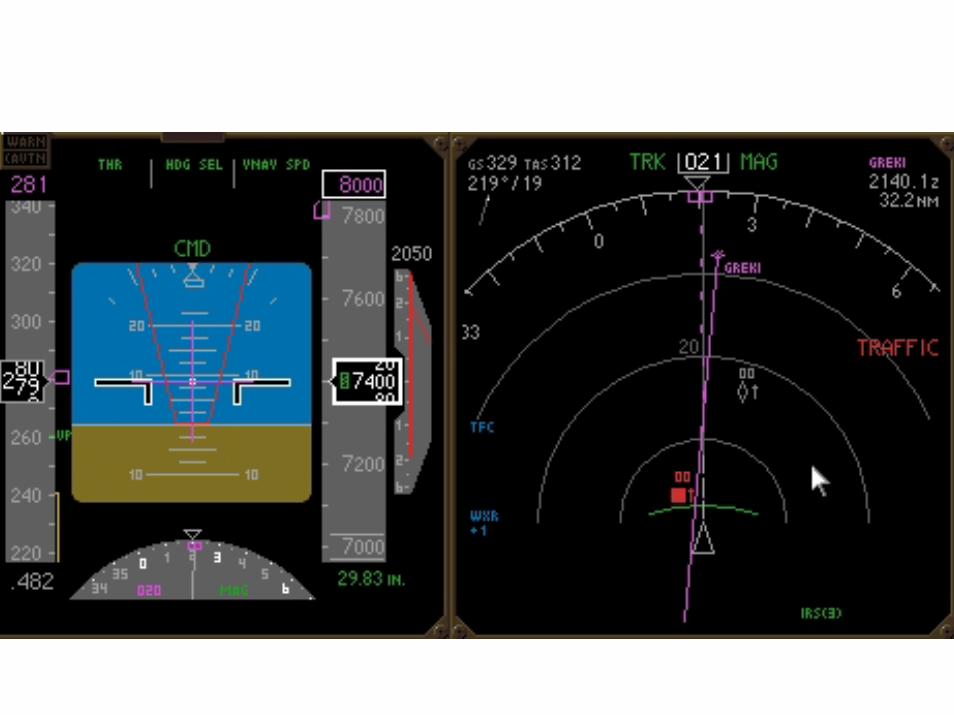

NASA Ames Basic CDTI Cockpit Display
•4D intent and traffic information- 3D Flight Plans- Individual aircraft ID blocks- Static and dynamic predictors- Three levels of relative altitude color
coding (co-altitude, above, and below)
•Situational awareness information- Multistage strategic conflict alerts- Traffic relevance coding (i.e.
temporal proximity, “free flight” status) using intensity levels and symbol shape (nose)
•Anti-clutter features:- Full and partial data blocks (Tail tags)- Individually controllable data blocks- Smart Tags- Global ID and Route Declutter
•Captain/First Officer display sharing
•Touchpad and panel-mounted controls

Effect of Display on Response• Terrain display induced turning rate
– Plan view: 80%– Profile / side view: 5%– Perspective view: 30%

Undesirable Behavioral Impacts
• Risk homeostasis• People adjust their behavior to maintain constant risk• e.g., introduce automatic braking system (ABS), people drive
faster in wet weather
• Non-conformance to alerts• Pritchett: 40% nonconformance rate to collision warning• Mismatch of human’s internal mental model vs. automation• Disregard alerts• Take action contrary to alert command
• Viscious cycle of false alarm effects
• Need improved feedback on justification for alerts

Viscious Cycle of False Alarms and Accidents
Accidents
Delayed ResponsesNon-conformance Enlarge Alert Space
More False Alarms

Alert Inhibition and Prioritization• Inhibit alerts when they would distract from primary task
• 767: fire bell and master warning inhibited from nose gear extension until 20 seconds elapsed or reaching 400 ft
• When does human need to know information?
• Is it ok for automation to withhold safety-related information?
• Simplified prioritization scheme• Windshear• Ground proximity• Engine failure• Gear / flaps• Traffic collision

Multiple Alerting Dissonance
Proliferation of decision support functions
Formally identifying types of dissonance, impact, solutions
Alerting Systems Alerting Stages
A
BClimb!
Descend!Environment
Sensors
Sensors
No Alert
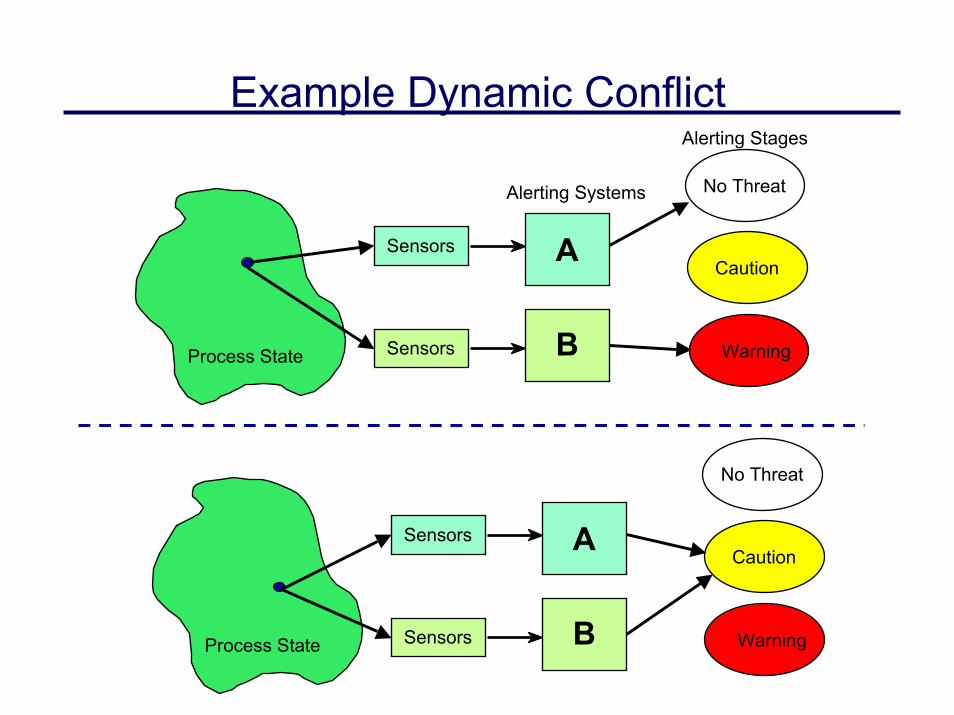
Example Dynamic Conflict
A
B
No Threat
Caution
WarningProcess State
Alerting Systems
Alerting Stages
Sensors
Sensors
A
B
Caution
WarningProcess State
Sensors
Sensors
No Threat

Alerting as a Tandem SDT Problem
Human
measurement
decisionProcess Alerting System
binaryalert
signal
measurement
SDT

Alerting System in SDT
• Alerting system has decision threshold
P(FA | N)P(CD | N)
Can set threshold using SDT principles
P(Warning) = P(FA | N)(1-P(S)) + P(CD | S)P(S)
P(No Warning) = 1 - P(Warning)

Human + Alerting System in SDT
• Human also has decision threshold
• Binary alert signal changes estimate of P(S) for human
• If there is a warning• P(S | Warning) = P(CD | S) P(S) / P(Warning)
• If there is no warning• P(S | No Warning) = (1-P(CD | S))P(S) / P(No Warning)

Example• Reactor temperature experiment:
• P(S) = 0.5, V(FA) = 1, V(MD) = 2• Human alone: β* = 0.5
• Add warning system which has xc = 0.5P(FA | N) = 0.31P(CD | S) = 0.69
P(Warning) = P(FA | N)(1-P(S)) + P(CD | S)P(S) = 0.5P(No Warning) = 1 - P(Warning) = 0.5
• If there is a warningP(S | Warning) = P(CD | S) P(S) / P(Warning) = 0.69
• If there is no warningP(S | No Warning) = (1-P(CD|S))P(S) / P(No Warning) = 0.31

Example (cont’d)• Human alone, β* = 0.50
• So, if there is a warning, P(S) = 0.69, and nowβ* = (0.31/0.69)*(1/2) = 0.23, xc = -1
• If there is no warning, P(S) = 0.31, and nowβ* = (0.69/0.31)*(1/2) = 1.11, xc = 0.61
00.050.1
0.150.2
0.250.3
0.350.4
0.45
-1 -0.5 0 0.5 1 1.5 2x
fn(x)fs(x)
β*
xc* = -0.19human alone
xc* = 0.61if no warning
xc* = -1if warning

Limiting Cases• Perfect warning system, P(FA | N) = 0, P(CD | S) = 1
• If signal is present, there is always a warning• P(S | Warning) = 1• P(S | No Warning) = 0• For human, if warning, β* = 0, xc = -∞
if no warning, β* = ∞, xc = +∞• Human should just agree to whatever the warning system says
• Useless warning system, P(FA | N) = .5, P(CD | S) = .5• P(S | Warning) = 0.5• P(S | No Warning) = 0.5• For human, if warning, β* = 0.5, xc = -0.19
if no warning, β* = 0.5, xc = -0.19• Human should ignore warning, keep original threshold

Summary• Adding a warning system improves the estimate of P(S)
– Moves closer to 1 if there is a warning– Moves closer to 0 if there is no warning
• Optimal threshold for human should move in response– If warning, move threshold left (smaller β)
• need less evidence to decide signal is present
– If no warning, move threshold right (larger β)• need even more evidence to decide signal is present
• Sluggish beta effect means that human will probably not shift the threshold as much as he/she should
• Can extend to multiple decision-making systems in series or parallel