160525 kempen real estate seminar - home - nsi · kempen real estate seminar ... - junctions...
TRANSCRIPT

Kempen Real Estate Seminar-25 May 2016-

Company profile
• Dutch REIT, founded in 1993 and listed in Amsterdam in 1998
• NSI acquired VastNed Offices (VNOI) in 2011
• NSI launched its full service and flexible office concept HNK in 2012
• Successful recapitalisation in November 2013
• Refinancing of €550 mln with group of banks and institutionals completed in 2015
• NSI divested its interest in IOW in 2015/2016*
• Industrials portfolio divested in 2016
1
Company description
Segment breakdown on asset value Breakdown on gross rental income
Key financials
FY 2015* FY 2014
Portfolio value (€m) * 1,203.5 1.668.1 Gross rental income (€m) 113.8 133.6 Net rental income (€m) 91.3 109.2 Direct investment result (€m) 50.6 48.2 Loan-to-Value (%) 43.2 48.9 Occupancy (%) 77.3 77.1 Interest cover ratio (x) 3.2 2.6
* IOW i s no longer consolidated in the income statement from Q3 2015 onwards and in the balance sheet as per 30 June 2015.
Offices (121 properties)
HNK (11 properties)
Retail (35 properties)
LSR (6 properties)
51%
11%
31%
6%
Offices
HNK
Retail
LSR
52%
6%
52%
10%
32%

Dutch economy in a nutshell
2
Macro economic parameters are turning positive
economic growth
decreasing unemployment rate
increasing consumer confidence & spending
strong recovery residentual market
Economic growth
Unemployment rate Consumer confidence
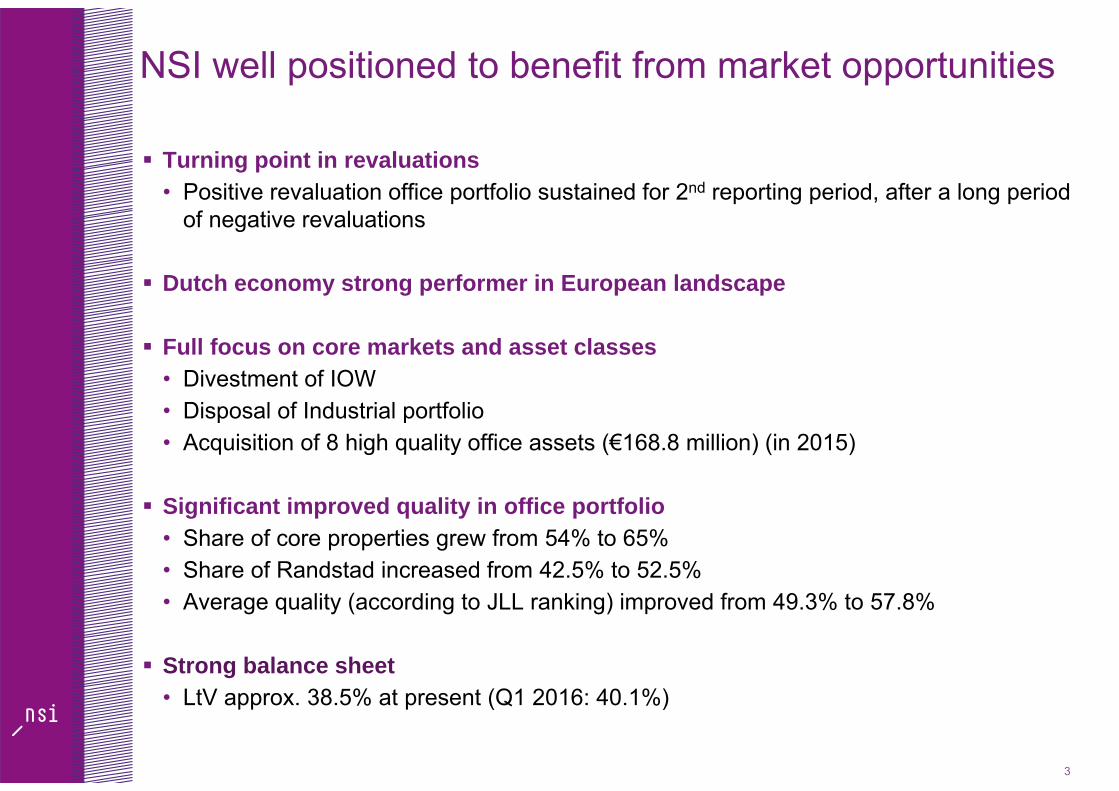
Turning point in revaluations• Positive revaluation office portfolio sustained for 2nd reporting period, after a long period
of negative revaluations
Dutch economy strong performer in European landscape
Full focus on core markets and asset classes• Divestment of IOW• Disposal of Industrial portfolio• Acquisition of 8 high quality office assets (€168.8 million) (in 2015)
Significant improved quality in office portfolio • Share of core properties grew from 54% to 65%• Share of Randstad increased from 42.5% to 52.5%• Average quality (according to JLL ranking) improved from 49.3% to 57.8%
Strong balance sheet • LtV approx. 38.5% at present (Q1 2016: 40.1%)
3
NSI well positioned to benefit from market opportunities

Strategy: portfolio focus further increased Sale of almost entire industrial portfolio (€48.1 million) Sale of the remaining interest (15.2%) in IOW Agreement to release securities related to bank funding (€450 million) as per
1 September 2016 LtV, after asset sales and dividend distribution, to approx. 38.5% at present
Operational Occupancy rate of total portfolio increases to 78.1% (31 December: 77.3%)
Occupancy rate total office portfolio increased to 74.3% (Q1 2015: 71.4%, Q4 2015: 73.6%) Rental income Dutch office portfolio grew slightly compared with Q4 2015−Quality improvement and focus on HNK start to pay off−HNK continues to perform strongly
Retail remains challenging; occupancy level increased over stable development of rent levels 4
Highlights Q1 2016

ASSET ROTATION UPDATE2

6
Conglomerates in European perspective

Combined strenght of the Netherlands, Belgian Flemish Diamond and German Rhein/Ruhr area

GATEWAY TO EUROPE
EUROPEAN CAPITAL
BRUSSELS TECH ZONE
MANUFACT
URIN
G
RHEIN
/RUH
R
RAND
STAD
GATEWAYTO EUROPE
EU-CAPITALBRUSSELS
RHEIN/RUHRBRABANT
EINDHOVENBRAINPORT
The Netherlands is fundamentally strong positioned
30 million inhabitants € 150 billion internal Trade
European manufacturing industry Gateway to Europe Largest port of Europe Best airport of Western-Europe European political and governing centre Strong universities

NSI is focusing on 18 cities- Junctions determine the economic dynamics -
52% 28 %
20 %
Geographical distrbution office portfolio (in value)

Asset rotation in € millions 2008 - 2016
0
50
100
150
200
250
300
2008 2009 2010 2011 2012 2013 2014 2015 2016
AcquiredDivested
Portfolio Philips Pensioenfonds and
Swiss assets
Excluding acquisition VNOI
(€971m)
8 high quality office assets (€169 m)
Disposal industrial portfolio
10
Divesting non-core assets and assets of which the value potential under NSI’s management has been optimised is part of NSI’s strategy to create value in its portfolio
Investment focus on Dutch office market, migrating to a higher quality
Cumulative divestment volume 2008-2016: €465 million, excluding divestment IOW shares (€165 million) Cumulative acquisition volume (2008-2016): € 1,618 million (including Vastned)
Excluding divestmentIOW shares (€165 m)

Vivaldi 1Location: Amsterdam South-Axis
Total size: 9,592 sq m
Passing rent: € 2.4 mio
WAULT (yrs) 14.4
Occupancy: 100%
Tenure Multi tenant (leased to operator)
1 Vivaldi 2Location: Amsterdam South-Axis
Total size: 8,687 sq m
Passing rent: € 2.3 mio
WAULT (yrs) 7.1
Occupancy: 100%
Tenure Multi tenant, leased to operator
2
Centerpoint 1Location: Amsterdam South-East
Total size: 9,011 sq m
Passing rent: € 1.9 mio
WAULT (yrs) 4.8
Occupancy: 98.9%
Tenure Multi tenant
3 Centerpoint 2Location: Amsterdam South-East
Total size: 6,249 sq m
Passing rent: € 1.3 mio
WAULT (yrs) 6.0
Occupancy: 100%
Tenure Single tenant
4
AlexanderpoortLocation: Rotterdam Alexander
Total size: 9,408 sq m
Passing rent: € 1.5 mio
WAULT (yrs) 3.1
Occupancy: 88.5%
Tenure Multi tenant
5 AlexanderhofLocation: Rotterdam Alexander
Total size: 3,120 sq m
Passing rent: € 0.5 mio
WAULT (yrs) 3.0
Occupancy: 94%
Tenure Multi tenant
6
het BinnenhofLocation: Den Bosch, Paleiskwartier
Total size: 10,442 sq m
Passing rent: € 1.5 mio
WAULT (yrs) 5.9
Occupancy: 90.6%
Tenure Multi tenant
7 YpsilonLocation: Leiden, Bio Science Park
Total size: 9,418 sq m
Passing rent: € 1.6 mio
WAULT (yrs) 4.5 (break-date)
Occupancy: 100%
Tenure Single tenant
8

Transformations Office Portfolio
5. 7. 9.6.
Total realized ca. 50,000 m² Total in pipeline ca. 48,000 m²
City m² (ca.) Potential type of useEindhoven 22,650 Residential/ Hotel Amsterdam 1,250 ResidentialDen Haag 3,000 ResidentialUtrecht 3,300 Residential/ SocialBreda 5,000 ResidentialGouda 10,000 IndustrialZoetermeer 3,000 Residential
City Address m² Type of use1. Amsterdam Koningen Wilhelminaplein 5,019 Residential2. Amsterdam Arlandaweg 4,257 School3. Utrecht Reactorweg/Kobaltweg* 10,009 Industrial4. Zeist Montaubanstraat* 1,539 Residential5. Amsterdam Karel du Jardinstraat* 6,107 Residential6. Amersfoort Hardwareweg* 5,858 School7. Nieuwegein Villawal* 5,783 Residential8. Amsterdam Delflandlaan* 7,440 Hotel9. Den Haag Ln Copes v Cattenburgh* 1,705 Residential10. Velp Arnhemsestraatweg* 2,155 Residential
REALIZED (2014-2016) IN PROGRESS (2016)
* = sold assets

After big step up in 2014-2015; asset rotation is continuous part of strategy− Focus on improving performance− Full focus on Dutch high quality multi tenant offices in selected regions and
neighbourhood shopping centers− Non strategic: Large Scale Retail, 2 remaining Industrial assets
NSI leasing platform allows for further growth in offices− More focused portfolio and organisation− Leveraging gross to net
Roll out HNK from 11 at present to 20 HNKs by year end 2016− Currently under construction:
• HNK Rotterdam Blaak (2nd HNK in Rotterdam)• HNK Amsterdam Arena (2nd HNK in Amsterdam)
− Selective acquisitions to optimise nation-wide network
13
Next phase in offices – focus on performance

OPERATIONAL PERFORMANCE - OFFICES3
14

‘
15
Co working & members space Cafe
Tailored offices
Meeting rooms
Higher take up Higher effective rent Quicker re-lettings Higher retention Additional income
stream Customer satisfaction
Managed Offices
‘social heart’+ =
HNK - a place to be: inspiring meeting place to work, connect and meet
Connected

Operational highlights offices
16
Offices (Excluding HNK) Q1 2016 Q4 2015 Q1 2015 2015 2014
Gross Rental income (€ million) 11.5 12.1 10.6 43.1 54.7
Occupancy rate in % 79.7 76.7 74.4 76.7 77.4
Take up 2,925 4,615 4,840 28.006 18.910
Take up / supply ratio (12 months rolling in %) 17.4 18.5 18.5% 10.5%
Effective rent level new leases (12 months rolling) per sqm €106 €107 €107 €107 €113
Effective rent level per sqm total portfolio €153 €157 €146 €157 €143
Like-for-like growth gross rental income in % -9,1 -11.5 -8.7 - 11.5 - 4.0
WAULT 5.1 5.1 3.8 5.1 3.5
Occupancy rate positively impacted by reclassifications; underlying stable development Q4 vs Q1
Negative l-f-l growth largely due to expired contracts in last 12 months; Q1/16 vs Q4/15 shows improving trend
Stable development effective rent level new leases
7% of office contracts expire in 2016

OPERATIONAL PERFORMANCE HNK 4
17


Operational highlights HNK
19
Q1 2016 Q4 2015 Q1 2015 2015 2014
Gross rental income( € million) 2.6 2.1 1.7 8.0 5.4
Occupancy rate in % 57.0 59.6 57.5 59.6 56.6
Take up 3,414 6,167 4,250 21,139 4,855
Take up supply ratio in % 39 45 36 45 26
Effective rent level new leases (12 months rolling) per sqm €166 €165 €167 €165 €169
Effective rent level per sqm total portfolio €180 €188 €167 €188 €160
Like-for-like growth gross rental income in % 12.8 18.6 29.7 18.6 25.5
WAULT 3.2 3.1 2.8 3.1 2.4
All product categories show positive trend
GRI HNK as % of GRI total offices rose to18.6% in Q1 2016 from 14.7% in Q4 2016
Gross Net should evolve to 75-80% when fully leased up (occupancy 85-90%)
Occupancy rate continously impacted by inflow of new HNK’s All other individual HNKs showed increasing occupancy rates, except for HNK Rotterdam due to
legacy tenant that left in Q4 2015
L-f-l growth in HNK expected to largely compensate negative l-f-l growth in traditional offices
HNK won award “Best office landlord 2016”

Operational highlights total offices
20
Offices ((Including HNK) Q1 2016 Q4 2015 Q1 2015 2015 2014
Gross Rental income (€ million) 14.2 14.1 12.4 51.1 60.1
Occupancy rate in % 74.3 73.6 71.4 73.6 71.5
Effective rent level new leases (12 months rolling) per sqm €138 €138 €133 €135 €129
Effective rent level per sqm total portfolio €157 €161 €146 €161 €149
Like-for-like growth gross rental income in % -5.0 -6.9 -8.7 -6.9 -4.0
Occupancy rate total offices increased, in combination with stable rental levels of new leases
GRI total office portfolio shows slightly improving trend

OPERATIONAL PERFORMANCE - RETAIL5
21

The changing retail market- enforces to make choices -
“Fun shopping”: Shopping for leisure
“Daily needs”: efficient shopping + meet (locally)
Experience
Services

23
Easyshopping adds extra dimension to dailyshopping centre:
Connect: • Creating communities• Offering (online) services• Intensify relationship retailer - consumer
Enlarge reach through active (online) marketing
Increase dynamics: through activities in shopping centre
Launched in shopping centre Zevenkamp (Rotterdam) Roll out to shopping centres in region Rotterdam
AddedValue

24
Retail Local Convenience
Q1 2016 Q4 2015 Q1 2015 2015 2014 2015
Gross Rental Income € million) 6.4 6.9 7.1 27.9 32.1
Occupancy rate in % 85.3 84.4 88.2 84.4 88.4 89
Effective rent level per sqm total portfolio per sqm €199 €215 €159 €215 €135
Effective rent level per sqm total portfolio per sqm €179 €178 €178 €178 € 183 € 173
Valuation development in % -2.5 1.0
Like-for-like growth gross rental income in % -8.0 4.3 3.1 4.3 - 11.0 1.0
WAULT 4.4 4.6 4.6 4.6 4.5
Retail market remains challenging despite improving consumer confidence & spending
Negative l-f-l growth largely explained by one-off gains in 2015
5% of retail contracts expire in 2016
Operational highlights retail

FINANCIAL6
25
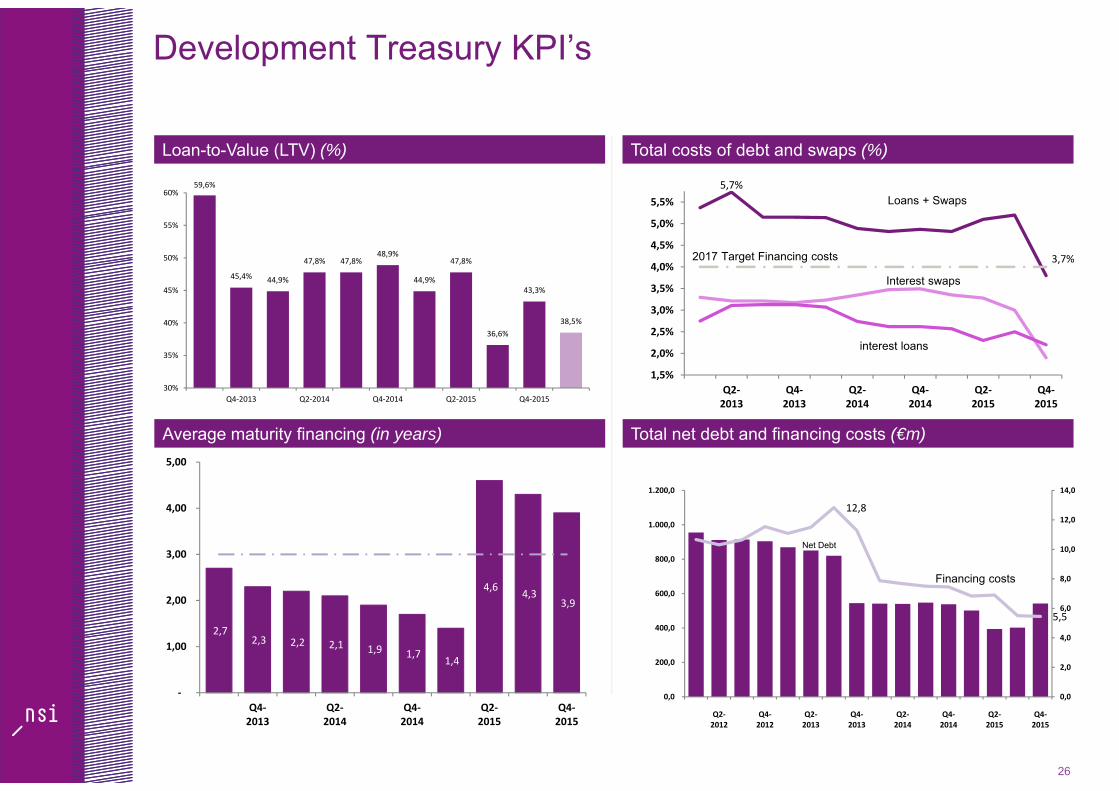
Development Treasury KPI’s
26
Loan-to-Value (LTV) (%) Total costs of debt and swaps (%)
Average maturity financing (in years) Total net debt and financing costs (€m)
5,7%
3,7%
1,5%
2,0%
2,5%
3,0%
3,5%
4,0%
4,5%
5,0%
5,5%
Q2‐2013
Q4‐2013
Q2‐2014
Q4‐2014
Q2‐2015
Q4‐2015
Interest swaps
interest loans
2017 Target Financing costs
Loans + Swaps
2,7 2,3 2,2 2,1 1,9 1,7 1,4
4,6 4,3 3,9
‐
1,00
2,00
3,00
4,00
5,00
Q4‐2013
Q2‐2014
Q4‐2014
Q2‐2015
Q4‐2015
12,8
5,5
0,0
2,0
4,0
6,0
8,0
10,0
12,0
14,0
0,0
200,0
400,0
600,0
800,0
1.000,0
1.200,0
Q2‐2012
Q4‐2012
Q2‐2013
Q4‐2013
Q2‐2014
Q4‐2014
Q2‐2015
Q4‐2015
Net Debt
Financing costs
59,6%
45,4% 44,9%
47,8% 47,8%48,9%
44,9%
47,8%
36,6%
43,3%
38,5%
30%
35%
40%
45%
50%
55%
60%
Q4‐2013 Q2‐2014 Q4‐2014 Q2‐2015 Q4‐2015
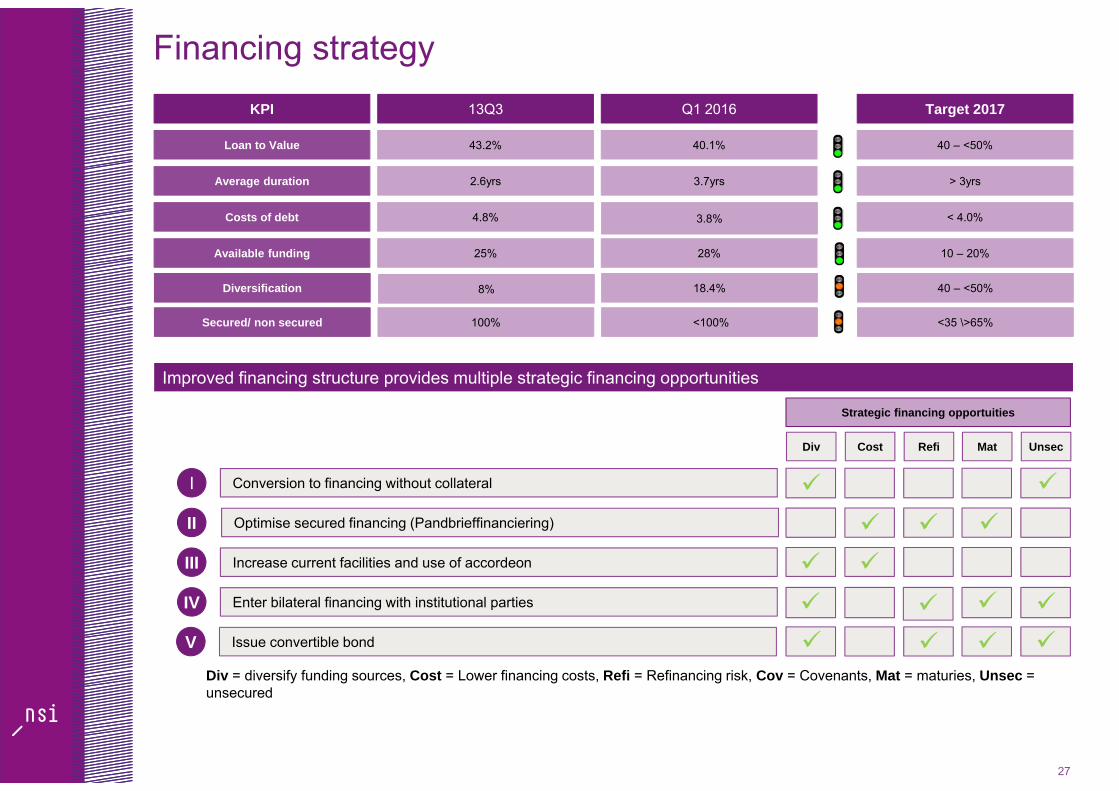
Financing strategy
27
Conversion to financing without collateral
Optimise secured financing (Pandbrieffinanciering)
Increase current facilities and use of accordeon
Enter bilateral financing with institutional parties
I
II
III
IV
Issue convertible bondV
KPI 13Q3 Q1 2016 Target 2017
Loan to Value
Average duration
43.2%
2.6yrs
40.1%
3.7yrs
40 – <50%
> 3yrs
Available funding 25% 28% 10 – 20%
Costs of debt 4.8% 3.8% < 4.0%
Improved financing structure provides multiple strategic financing opportunities
Div Cost Refi Mat Unsec
Div = diversify funding sources, Cost = Lower financing costs, Refi = Refinancing risk, Cov = Covenants, Mat = maturies, Unsec = unsecured
Strategic financing opportuities
Diversification 8% 18.4% 40 – <50%
Secured/ non secured 100% <100% <35 \>65%

Financial highlights
28
x€1,000 FY 2015 FY 2014 HY2 2015 HY1 2015
Gross rental income 113,835 133,599 45,703 68,132
Service costs not recharged to tenants -5,796 -5,828 -2,453 -3,343
Operating costs -16,715 -18,611 -8,660 -8,055
Net rental income 91,324 109,160 34,590 56,734
Administrative costs -6,914 -7,711 -3,075 -3,839
Financing income 2,541 176 2,494 47
Financing costs -30,777 -42,391 -10,913 -19,864
Result minority interests 2,377 - 2,377 -
Direct investment result before tax 58,511 59,234 25,433 33,078
Corporate income tax -125 -111 -7 -118
Direct result att. to minorities -7,811 -10,672 - -7,811
Direct investment result 50,575 48,451 25,426 25,149
Indirect investment result 13,219 -185,348 -4,032 17,251
Total result 63,794 -136,897 21,394 42,400
€ 200 mln improvement year on year
Deconsolidation IOW, asset rotation and negative L-f-l of -€ 2,6mln,
Divestment non-core and cost control
Enlargement portfolio, + € 2.5 mln one-off in BE Letting costs (Deloitte) in HY1
€ 2.5 mln one-off from settlement withholding tax Belgian Authority
IOW, Lower debt, improved conditions in refinancing agreement, changes in swap portfolioIOW result after deconsolidation
Minority share before sale to minority
Significant improvement on all elements: valuations, asset sales, IOW sale, value of derivatives
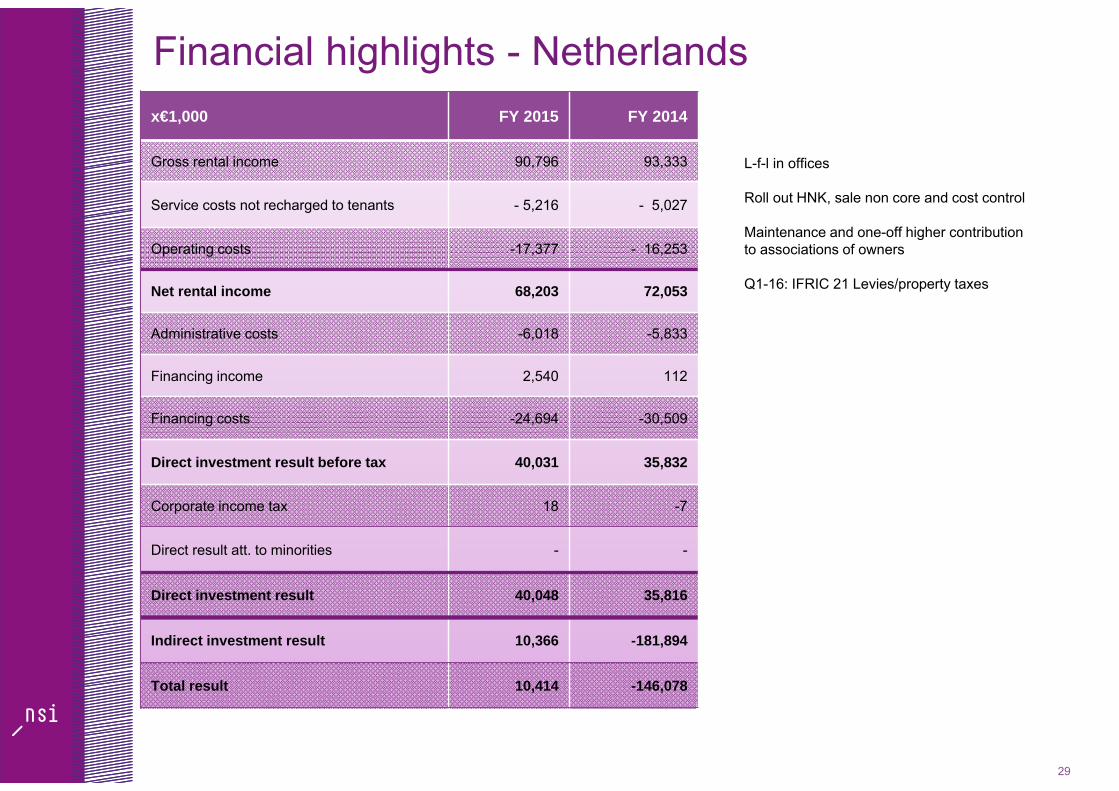
Financial highlights - Netherlands
29
x€1,000 FY 2015 FY 2014
Gross rental income 90,796 93,333
Service costs not recharged to tenants - 5,216 - 5,027
Operating costs -17,377 - 16,253
Net rental income 68,203 72,053
Administrative costs -6,018 -5,833
Financing income 2,540 112
Financing costs -24,694 -30,509
Direct investment result before tax 40,031 35,832
Corporate income tax 18 -7
Direct result att. to minorities - -
Direct investment result 40,048 35,816
Indirect investment result 10,366 -181,894
Total result 10,414 -146,078
L-f-l in offices
Roll out HNK, sale non core and cost control
Maintenance and one-off higher contribution to associations of owners
Q1-16: IFRIC 21 Levies/property taxes

Balance sheet highlights
30
x€1,000 31/12/15 30/6/15 31/12/14
Real estate investments 1,203,465 1,048,940 1,668,176
Total shareholders equity 660,748 657,951 788,302
Shareholders equity of NSI 660,720 657,979 632.112
Debt to credit institutions (excl. derivatives) 542,332 385,479 815,483
Average cost of debt (%) 3.7 5.1 4.6
Net loan to value (%) 43.2 35.1 48.9
Average debt maturity (years) 3.9 4.6 2.0
Fixed interest debt (%) 80.4 94.2 89,7
Interest coverage ratio 3.2 2.9 2.6
NAV (€/share) 4.61 4.59 4.41
EPRA NAV (€/share) 4.79 4.78 4.69
Deconsolidation of IOW (€ 636 mln), asset sales (€ 43,3mln), acquisitions (€ 169 mln),investments (€ 16,8 mln) and revaluations (€1,4 mln). Industrial portfolio (€ 61,2 mln) classified as held for sale
Minority stake - € 156 mln
Positive result (€ 63,8 mln) - dividend payments (€ 35.8 mln), value 15.2% stake IOW (€ 51.4 million)
Deconsolidation of net Belgian debt and net investment
As result of improved conditions in refinancing agreement, changes in derivative portfolio
LtV, after asset sales and dividend distribution, 38.5% at present
Minimum coverage policy = 70%
Minimum ICR is 2
First increase in NAV since 2011

CONCLUSION7
31

Outlook
NSI expects to improve the overall occupancy rate of the total portfolio; Improvement of the occupancy rate of office portfolio Relatively stable development of the occupancy rate in retail portfolio.
GRI of Dutch portfolio (excluding sold industrial portfolio) will show a slightly improving trend HNK expected to largely compensate for negative l-f-l growth in traditional office
portfolio
Impact divestment IOW in 2016 vs 2015 amounts to approx. €23.0 mln in GRI and approx. €8.5 mln in direct result
Impact divestment industrial portfolio in 2016 vs 2015 amounts to approx. €3.7 mln in GRI and approx. €2.5 mln in direct result
Impact IFRIC 21 directive on operating costs in HY1
32

APPENDIX

34
− Recognition of NSI’s remaining 15,2% share in IOW• Significant influence in IOW
• Equity method to be used going forward
• Pro-rate share in net income to be recognized in NSI results on a quarterly basis
• Financial Fixed Asset, value based upon NAV + Future results to be added - future dividends to be deducted results in future NAV in NSI books
− Impact on Balance sheet as per 31 December 2015:• Decrease in value of real estate investments of € 635.7 million
• Balance sheet total decreased by € 656.1 million
• Debt to credit institutions decreased by € 320.4 million
• 15.2% share classified as “minority interest” at € 51.4 million: € 20,75/share
− Impact on P&L• Total DR HY1-15: 7,8 Million (incl one-off)
• Total DR HY2-15: 2,3 Million + reduction Interest costs @1,5-2%
• DR 2015:10,2 million (2014: 12,6 million)
• Reinvestment after 1 quarter
Recognition of IOW stake in 2015

2015: Turning point in Dutch revaluations
2008 2009 2010 2011 2012 2013 2014 HY1 15 HY2 15 2015
Industrial
LSR
Retail
Offices
35
Positive revaluation of the office portfolio sustained for second reporting period, after a long period of negative revaluations (€630 million since 2008, of which 75% in offices)
- to €9.1 million in total in 2015- driven by slight decrease in market yields and market rents- Includes transaction costs of acquisitions (cobra portfolio) of approx. €9 million
Offset by negative revaluations in the retail portfolio- to €9.4 million in total in 2015- driven by increasing market yields
The value of the large scale retail portfolio saw an increase of €4.3 million in total in 2015, the industrial portfolio decreased by €2.6 million in total in 2015
In millions € 2015 Bookvalue31/121/15
Offices €9.1 717.1
Retail - €9.4 356.9
LSR €4.3 68.2
Industrial - €2.6 61.2
Total €1.4 1,203.5