16. technologies, tools and methodologies for … 16. technologies, tools and methodologies for...
TRANSCRIPT

165
16. Technologies, tools and methodologies for forage evaluation in grasslands and rangelandsJay P. AngererTexas A&M University System, Blackland Research and Extension Center, 720 E. Blackland Road,
Temple, TX 76502-9622, USA
Email: [email protected]
16.1 INTrOdUCTIONWith changing climate, increasing human population and changes in land cover/land use, a comprehensive quantification of livestock feeds is needed at national level in order for countries to develop policies for maintaining or increasing livestock production. This infor-mation can also be used for feed and livestock management in the case of drought or other disasters. For many developing countries, grassland and rangeland vegetation comprise a large component of the feed that is potentially available for livestock use. Worldwide, rangelands occupy almost 50 percent of the terrestrial land cover, and provide almost 75 percent of the forage used by domestic livestock (Brown and Thorpe, 2008). Moreover, livestock production from grasslands and rangelands can be a significant contribution to the overall gross domestic product (GDP) in developing countries. However, because of the generally large land areas occupied by grasslands and rangelands, their remote locations and the diverse mix of livestock species that graze these lands, quantification of vegetation biomass for feed inventories can be challenging.
For grasslands and rangelands, the amount or quantity of forage biomass is not the only important factor influencing livestock production. An assessment of forage quality is also needed because this influences the forage intake of grazing animals and ultimately animal performance. Forages that are in large quantity but have low quality can reduce animal performance or not be utilized because the forage is not palatable to the grazing animals. Forage quality can vary seasonally with topography and with changing plant communities across the landscape (Wofford et al., 1985). Measuring forage quality poses challenges because of selective grazing by livestock (i.e. in a mix of plant species, the animal selects the plants it prefers to eat) and the ability of animals to graze across large distances, thus potentially encountering multiple plant species/communities and topographic positions along the way.
For both forage quantity and quality assessments, an array of methods has been devel-oped for measurement that vary in level of accuracy, time spent in the field and logistical implementation. For forage quantity measurements, methods include direct measurements
Conducting national feed assessments166
of vegetation, estimation with proxy variables, simulation modelling, or various combi-nations of these methods. For forage quality measurement, direct and indirect methods are available in addition to nutritional balancing and least-cost ration software for use in devising supplemental feeding strategies.
Logistics, costs, timing of data collection and available personnel each influence the choice of method. The purpose of this review is to provide an overview of the technologies, tools and methodologies that are currently available for forage quantity and quality evalua-tion in grasslands and rangelands that can be used for national feed inventories. Methods using field-based techniques, remote sensing, simulation models and decision-support tools for assessments of forage quality and quantity are reviewed, and advantages and disadvantages as they relate to national feed inventories are discussed. Factors such as distance to water and terrain that influence forage availability are reviewed and examples given on how this information can be used in assessing forage usability and in calculating stocking rates. In order for a national feed inventory programme to be able to deliver time-ly and geographically relevant data to stakeholders, data management, storage, quality control and integration need to be considered. A general overview of these requirements is also be provided.
16.2 OvErvIEw16.2.1 field techniques for assessing and monitoring forage quantity and quality Field techniques are the most accurate methods for assessing forage quality and quantity on rangelands. However, field techniques generally require a large amount of time and resources for data collection, especially if data are needed on a yearly basis. Logistics, costs, timing of data collection, available personnel, type of grazing animal and plant community each influence the choice of method. An overview of some of the more widely used tech-niques for forage quantity and forage quality assessments is presented below.
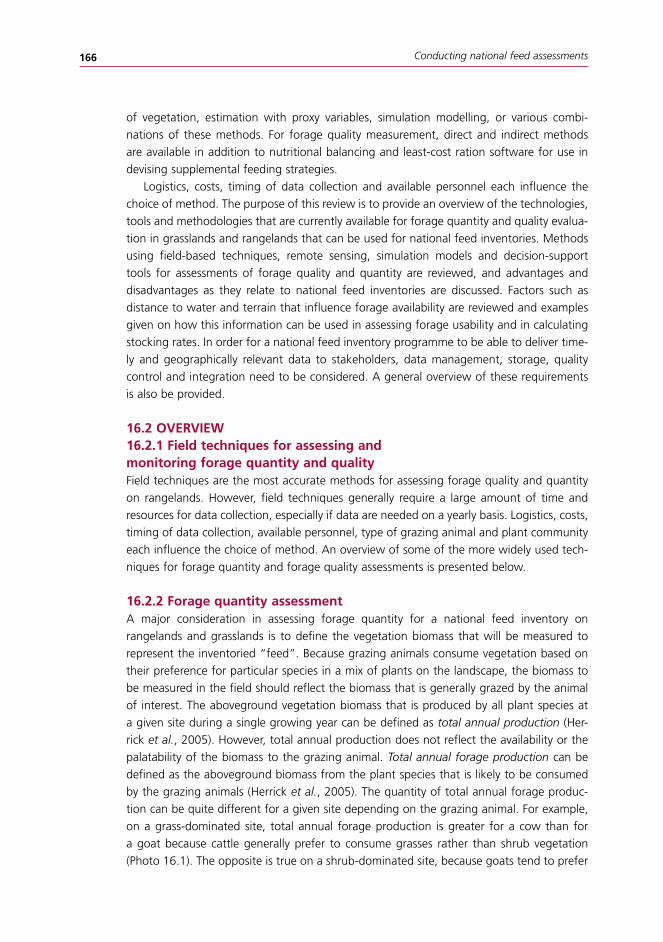
16.2.2 forage quantity assessmentA major consideration in assessing forage quantity for a national feed inventory on rangelands and grasslands is to define the vegetation biomass that will be measured to represent the inventoried “feed”. Because grazing animals consume vegetation based on their preference for particular species in a mix of plants on the landscape, the biomass to be measured in the field should reflect the biomass that is generally grazed by the animal of interest. The aboveground vegetation biomass that is produced by all plant species at a given site during a single growing year can be defined as total annual production (Her-rick et al., 2005). However, total annual production does not reflect the availability or the palatability of the biomass to the grazing animal. Total annual forage production can be defined as the aboveground biomass from the plant species that is likely to be consumed by the grazing animals (Herrick et al., 2005). The quantity of total annual forage produc-tion can be quite different for a given site depending on the grazing animal. For example, on a grass-dominated site, total annual forage production is greater for a cow than for a goat because cattle generally prefer to consume grasses rather than shrub vegetation (Photo 16.1). The opposite is true on a shrub-dominated site, because goats tend to prefer
167Technologies, tools and methodologies for forage evaluation in grasslands and rangelands
to browse trees and shrubs compared with herbaceous vegetation (Photo 16.1). In addi-tion, availability of forage to the grazing animal must be considered. Plants that are too tall or inaccessible to the grazing animal should not be included in the inventory. There-fore, prior to field data collection for a forage quantity assessment, the grazing animals of concern must be identified in order to develop a sampling protocol that considers the plant species that are consumed by the livestock and the availability of those plants to the grazing animal (USDA, 2003).
Time of year for the forage quantity assessment is another major consideration. The productivity of plants at a given site or across regions can vary throughout the year due to variations in plant species growth cycles and due to climatic variability (Herrick et al., 2005). Generally, the inventory should be conducted when the majority of plant species under consideration are at peak biomass. At the time of sampling, the measured biomass may require adjustments to reflect biomass that has already been removed by grazing animals or that has not yet been produced (USDA, 2003).
Methods for biomass measurement include direct measurement techniques where bio-mass is sampled and weighed, estimation techniques where the weights are estimated by the observer, or a combination of these methods.
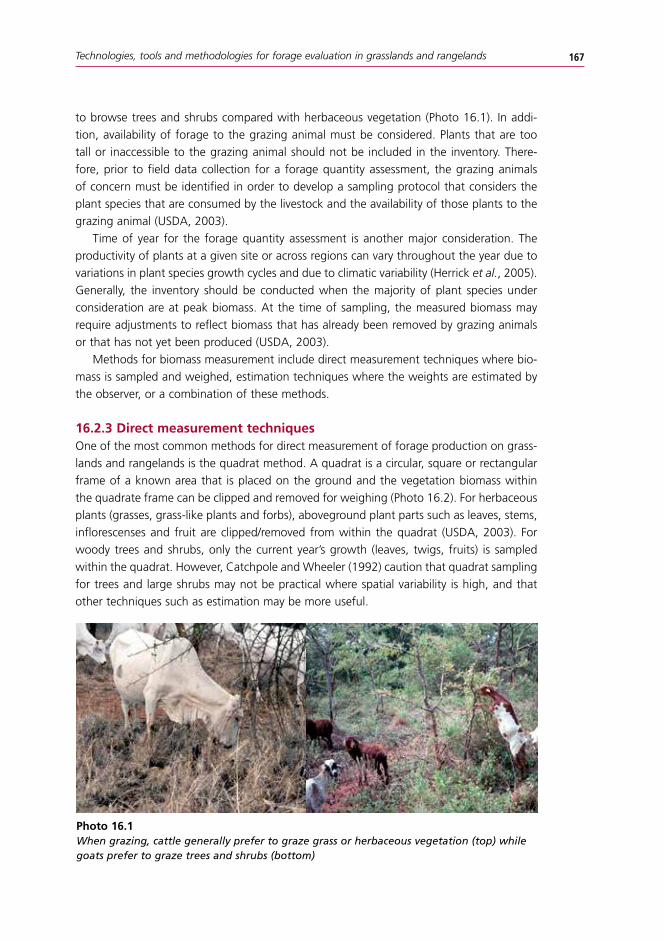
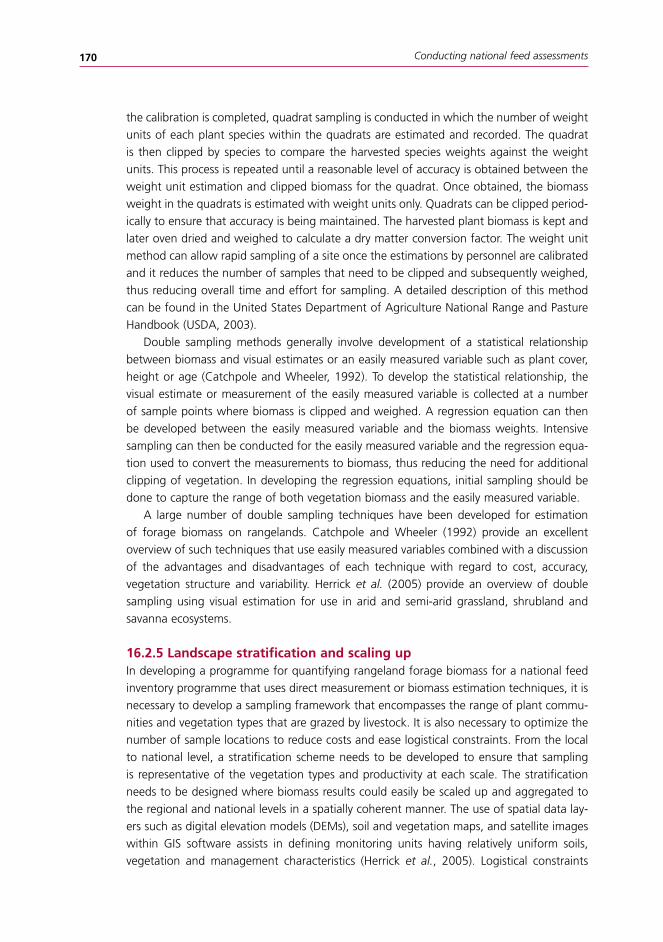
16.2.3 direct measurement techniquesOne of the most common methods for direct measurement of forage production on grass-lands and rangelands is the quadrat method. A quadrat is a circular, square or rectangular frame of a known area that is placed on the ground and the vegetation biomass within the quadrate frame can be clipped and removed for weighing (Photo 16.2). For herbaceous plants (grasses, grass-like plants and forbs), aboveground plant parts such as leaves, stems, inflorescenses and fruit are clipped/removed from within the quadrat (USDA, 2003). For woody trees and shrubs, only the current year’s growth (leaves, twigs, fruits) is sampled within the quadrat. However, Catchpole and Wheeler (1992) caution that quadrat sampling for trees and large shrubs may not be practical where spatial variability is high, and that other techniques such as estimation may be more useful.
Photo 16.1When grazing, cattle generally prefer to graze grass or herbaceous vegetation (top) while goats prefer to graze trees and shrubs (bottom)
Conducting national feed assessments168
After clipping, samples are usually oven-dried to remove water so that biomass can be expressed on a dry matter basis. Since the area of the quadrat is known (e.g. 0.5 m2), the dry weight (e.g. kg) of the biomass can then be extrapolated to a larger areas (e.g. kg of biomass/ha) to obtain an estimate of vegetation biomass for the site of interest. Prior to clipping, the vegetation within the quadrat may also be evaluated for other important vegetation characteristics such as plant species composition, cover, frequency and litter biomass.
Transect lines can be used to assist in establishing a baseline from which quadrat sam-pling can occur (Photo 16.3). The transect start and end points can be georeferenced with a Global Positioning System (GPS) so that the transect can be located again in subsequent visits to the site for long-term monitoring and for assessing vegetation and productivity changes.
The length of the transect, size and shape of the quadrat used, and the number of tran-sects and quadrat samples collected for measuring vegetation biomass at a site of interest depends on several factors. These include the lifeform of the vegetation (e.g. tree, shrub, forb or grass), the spatial distribution of the vegetation on the landscape (e.g. sparse or dense) and the logistics of collecting data at the site. For example, smaller quadrats (0.1 to 1.0 m2) can be used to sample herbaceous vegetation like grasses and forbs. Larger quadrats (2.0 to 500 m2) can be used to sample shrubs and trees. For clumped or patchy vegetation, a long rectangular quadrat is recommended to reduce bias in sampling clumps versus bare ground. The number of quadrats required to sample a specific site is related to the size of the quadrat, but also depends on the vegetation type, spatial variability and, ultimately, the logistics and costs of sampling the area of interest. The greater the
Photo 16.2A 0.5m2 quadrat used for measuring vegetation biomass on rangeland vegetationNOTE: VEGETATION WIThIN ThE quADrAT IS CLIPPED AND PLACED IN A PAPEr SACk ThAT IS MArkED WITh SAMPLE PLOT INFOrMATION; AFTEr CLIPPING, ThE BAG IS TAkEN TO ThE LABOrATOry, DrIED AND WEIGhED TO OBTAIN Dry MATTEr WEIGhT.

169Technologies, tools and methodologies for forage evaluation in grasslands and rangelands
spatial variability of the vegetation, the greater the number of quadrats samples needed to increase precision of the biomass measurements (Catchpole and Wheeler, 1992). Statistical techniques for calculating sample size can be used to assist with determining the optimum number of samples. Bonham (1989) provides a description of techniques and procedures that can be employed to determine optimal quadrat size and number of quadrat samples needed for various vegetation types.
16.2.4 Estimation techniquesThe time required for clipping a larger number of quadrats and the large number of samples that require drying and weighing makes direct measurement of forage biomass cost-prohibitive for a national feed inventory programme. Estimation techniques are employed to reduce the number of clipped samples and to reduce the amount of time needed to sample each location. Two popular methods that have been developed for esti-mation of forage biomass in rangeland vegetation include the weight unit method and the double sampling method.
For the weight unit method (USDA, 2003), a weight unit is established for each of the plant species occurring in the area of interest. The weight unit can be a whole plant, a plant part or a group of plants, and the size and the weight will vary with the size of the plant (e.g. grasses and forbs can be of smaller size and weight than a weight unit for a shrub species). Once the weight units are established, field personnel calibrate their estimation by visually selecting a plant or plant part that has weight equivalent to the weight unit. The plant biomass is then harvested, weighed and compared with the weight of the weight unit. This process is repeated until personnel can accurately estimate the weight unit. Once
Photo 16.3A quadrat clipped at a placement along a line transectNOTE: AN ExTENDED FIBErGLASS TAPE MEASurE, AS DEPICTED hErE, CAN BE uSED AS ThE rEFErENCE FOr ThE TrANSECT LINE IN GrASSLAND VEGETATION
Conducting national feed assessments170
the calibration is completed, quadrat sampling is conducted in which the number of weight units of each plant species within the quadrats are estimated and recorded. The quadrat is then clipped by species to compare the harvested species weights against the weight units. This process is repeated until a reasonable level of accuracy is obtained between the weight unit estimation and clipped biomass for the quadrat. Once obtained, the biomass weight in the quadrats is estimated with weight units only. Quadrats can be clipped period-ically to ensure that accuracy is being maintained. The harvested plant biomass is kept and later oven dried and weighed to calculate a dry matter conversion factor. The weight unit method can allow rapid sampling of a site once the estimations by personnel are calibrated and it reduces the number of samples that need to be clipped and subsequently weighed, thus reducing overall time and effort for sampling. A detailed description of this method can be found in the United States Department of Agriculture National Range and Pasture Handbook (USDA, 2003).
Double sampling methods generally involve development of a statistical relationship between biomass and visual estimates or an easily measured variable such as plant cover, height or age (Catchpole and Wheeler, 1992). To develop the statistical relationship, the visual estimate or measurement of the easily measured variable is collected at a number of sample points where biomass is clipped and weighed. A regression equation can then be developed between the easily measured variable and the biomass weights. Intensive sampling can then be conducted for the easily measured variable and the regression equa-tion used to convert the measurements to biomass, thus reducing the need for additional clipping of vegetation. In developing the regression equations, initial sampling should be done to capture the range of both vegetation biomass and the easily measured variable.
A large number of double sampling techniques have been developed for estimation of forage biomass on rangelands. Catchpole and Wheeler (1992) provide an excellent overview of such techniques that use easily measured variables combined with a discussion of the advantages and disadvantages of each technique with regard to cost, accuracy, vegetation structure and variability. Herrick et al. (2005) provide an overview of double sampling using visual estimation for use in arid and semi-arid grassland, shrubland and savanna ecosystems.
16.2.5 landscape stratification and scaling upIn developing a programme for quantifying rangeland forage biomass for a national feed inventory programme that uses direct measurement or biomass estimation techniques, it is necessary to develop a sampling framework that encompasses the range of plant commu-nities and vegetation types that are grazed by livestock. It is also necessary to optimize the number of sample locations to reduce costs and ease logistical constraints. From the local to national level, a stratification scheme needs to be developed to ensure that sampling is representative of the vegetation types and productivity at each scale. The stratification needs to be designed where biomass results could easily be scaled up and aggregated to the regional and national levels in a spatially coherent manner. The use of spatial data lay-ers such as digital elevation models (DEMs), soil and vegetation maps, and satellite images within GIS software assists in defining monitoring units having relatively uniform soils, vegetation and management characteristics (Herrick et al., 2005). Logistical constraints
171Technologies, tools and methodologies for forage evaluation in grasslands and rangelands
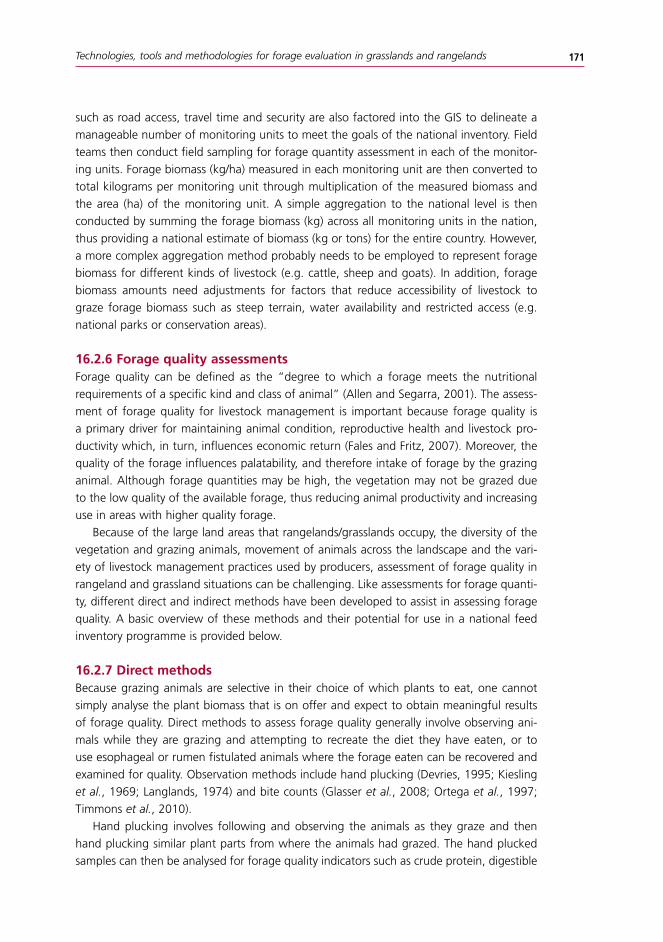
such as road access, travel time and security are also factored into the GIS to delineate a manageable number of monitoring units to meet the goals of the national inventory. Field teams then conduct field sampling for forage quantity assessment in each of the monitor-ing units. Forage biomass (kg/ha) measured in each monitoring unit are then converted to total kilograms per monitoring unit through multiplication of the measured biomass and the area (ha) of the monitoring unit. A simple aggregation to the national level is then conducted by summing the forage biomass (kg) across all monitoring units in the nation, thus providing a national estimate of biomass (kg or tons) for the entire country. However, a more complex aggregation method probably needs to be employed to represent forage biomass for different kinds of livestock (e.g. cattle, sheep and goats). In addition, forage biomass amounts need adjustments for factors that reduce accessibility of livestock to graze forage biomass such as steep terrain, water availability and restricted access (e.g. national parks or conservation areas).
16.2.6 forage quality assessmentsForage quality can be defined as the “degree to which a forage meets the nutritional requirements of a specific kind and class of animal” (Allen and Segarra, 2001). The assess-ment of forage quality for livestock management is important because forage quality is a primary driver for maintaining animal condition, reproductive health and livestock pro-ductivity which, in turn, influences economic return (Fales and Fritz, 2007). Moreover, the quality of the forage influences palatability, and therefore intake of forage by the grazing animal. Although forage quantities may be high, the vegetation may not be grazed due to the low quality of the available forage, thus reducing animal productivity and increasing use in areas with higher quality forage.
Because of the large land areas that rangelands/grasslands occupy, the diversity of the vegetation and grazing animals, movement of animals across the landscape and the vari-ety of livestock management practices used by producers, assessment of forage quality in rangeland and grassland situations can be challenging. Like assessments for forage quanti-ty, different direct and indirect methods have been developed to assist in assessing forage quality. A basic overview of these methods and their potential for use in a national feed inventory programme is provided below.
16.2.7 direct methodsBecause grazing animals are selective in their choice of which plants to eat, one cannot simply analyse the plant biomass that is on offer and expect to obtain meaningful results of forage quality. Direct methods to assess forage quality generally involve observing ani-mals while they are grazing and attempting to recreate the diet they have eaten, or to use esophageal or rumen fistulated animals where the forage eaten can be recovered and examined for quality. Observation methods include hand plucking (Devries, 1995; Kiesling et al., 1969; Langlands, 1974) and bite counts (Glasser et al., 2008; Ortega et al., 1997; Timmons et al., 2010).
Hand plucking involves following and observing the animals as they graze and then hand plucking similar plant parts from where the animals had grazed. The hand plucked samples can then be analysed for forage quality indicators such as crude protein, digestible
Conducting national feed assessments172
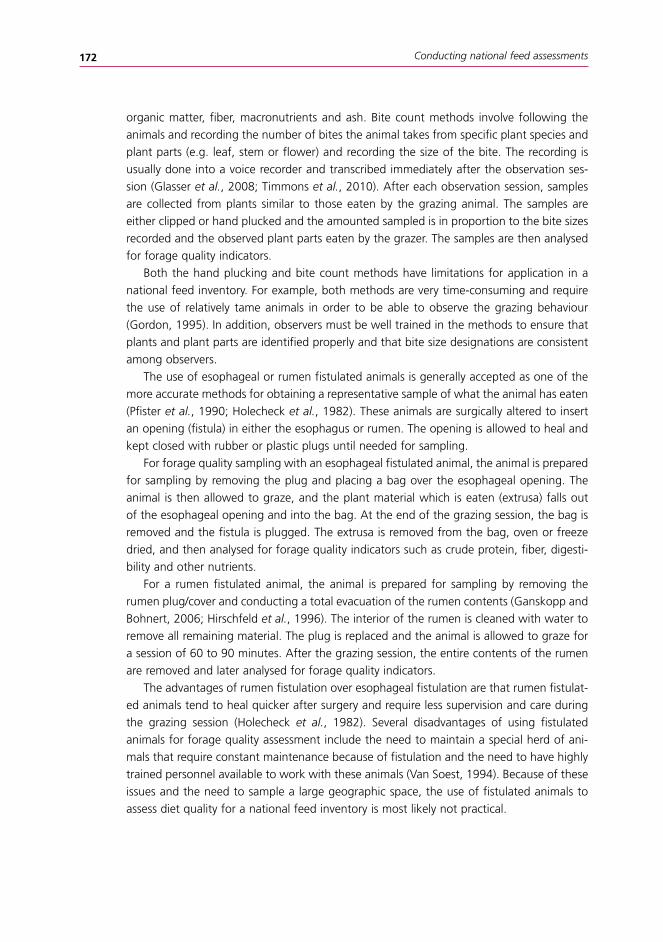
organic matter, fiber, macronutrients and ash. Bite count methods involve following the animals and recording the number of bites the animal takes from specific plant species and plant parts (e.g. leaf, stem or flower) and recording the size of the bite. The recording is usually done into a voice recorder and transcribed immediately after the observation ses-sion (Glasser et al., 2008; Timmons et al., 2010). After each observation session, samples are collected from plants similar to those eaten by the grazing animal. The samples are either clipped or hand plucked and the amounted sampled is in proportion to the bite sizes recorded and the observed plant parts eaten by the grazer. The samples are then analysed for forage quality indicators.
Both the hand plucking and bite count methods have limitations for application in a national feed inventory. For example, both methods are very time-consuming and require the use of relatively tame animals in order to be able to observe the grazing behaviour (Gordon, 1995). In addition, observers must be well trained in the methods to ensure that plants and plant parts are identified properly and that bite size designations are consistent among observers.
The use of esophageal or rumen fistulated animals is generally accepted as one of the more accurate methods for obtaining a representative sample of what the animal has eaten (Pfister et al., 1990; Holecheck et al., 1982). These animals are surgically altered to insert an opening (fistula) in either the esophagus or rumen. The opening is allowed to heal and kept closed with rubber or plastic plugs until needed for sampling.
For forage quality sampling with an esophageal fistulated animal, the animal is prepared for sampling by removing the plug and placing a bag over the esophageal opening. The animal is then allowed to graze, and the plant material which is eaten (extrusa) falls out of the esophageal opening and into the bag. At the end of the grazing session, the bag is removed and the fistula is plugged. The extrusa is removed from the bag, oven or freeze dried, and then analysed for forage quality indicators such as crude protein, fiber, digesti-bility and other nutrients.
For a rumen fistulated animal, the animal is prepared for sampling by removing the rumen plug/cover and conducting a total evacuation of the rumen contents (Ganskopp and Bohnert, 2006; Hirschfeld et al., 1996). The interior of the rumen is cleaned with water to remove all remaining material. The plug is replaced and the animal is allowed to graze for a session of 60 to 90 minutes. After the grazing session, the entire contents of the rumen are removed and later analysed for forage quality indicators.
The advantages of rumen fistulation over esophageal fistulation are that rumen fistulat-ed animals tend to heal quicker after surgery and require less supervision and care during the grazing session (Holecheck et al., 1982). Several disadvantages of using fistulated animals for forage quality assessment include the need to maintain a special herd of ani-mals that require constant maintenance because of fistulation and the need to have highly trained personnel available to work with these animals (Van Soest, 1994). Because of these issues and the need to sample a large geographic space, the use of fistulated animals to assess diet quality for a national feed inventory is most likely not practical.
173Technologies, tools and methodologies for forage evaluation in grasslands and rangelands
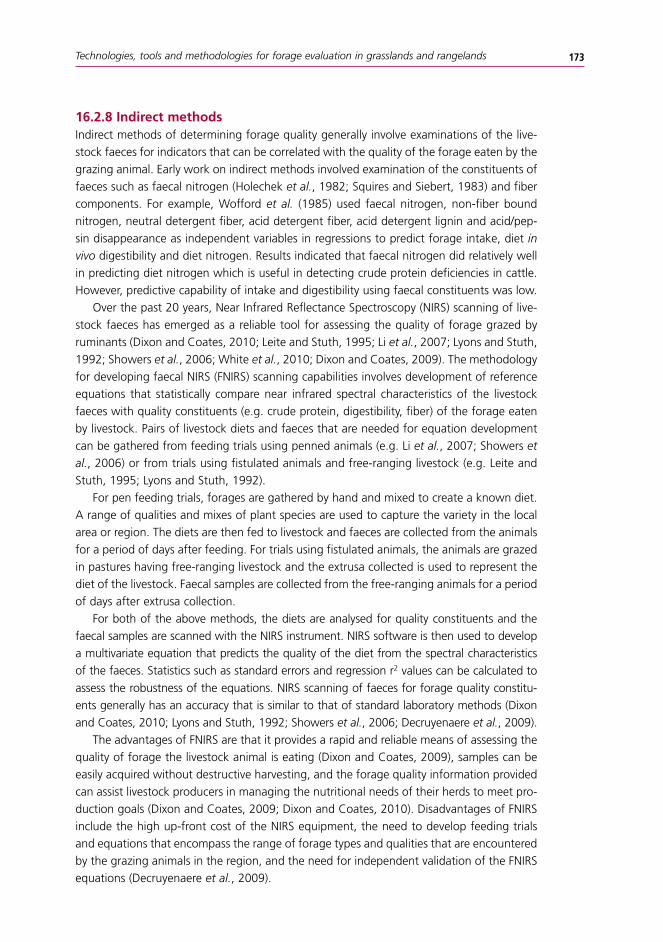
16.2.8 Indirect methodsIndirect methods of determining forage quality generally involve examinations of the live-stock faeces for indicators that can be correlated with the quality of the forage eaten by the grazing animal. Early work on indirect methods involved examination of the constituents of faeces such as faecal nitrogen (Holechek et al., 1982; Squires and Siebert, 1983) and fiber components. For example, Wofford et al. (1985) used faecal nitrogen, non-fiber bound nitrogen, neutral detergent fiber, acid detergent fiber, acid detergent lignin and acid/pep-sin disappearance as independent variables in regressions to predict forage intake, diet in vivo digestibility and diet nitrogen. Results indicated that faecal nitrogen did relatively well in predicting diet nitrogen which is useful in detecting crude protein deficiencies in cattle. However, predictive capability of intake and digestibility using faecal constituents was low.
Over the past 20 years, Near Infrared Reflectance Spectroscopy (NIRS) scanning of live-stock faeces has emerged as a reliable tool for assessing the quality of forage grazed by ruminants (Dixon and Coates, 2010; Leite and Stuth, 1995; Li et al., 2007; Lyons and Stuth, 1992; Showers et al., 2006; White et al., 2010; Dixon and Coates, 2009). The methodology for developing faecal NIRS (FNIRS) scanning capabilities involves development of reference equations that statistically compare near infrared spectral characteristics of the livestock faeces with quality constituents (e.g. crude protein, digestibility, fiber) of the forage eaten by livestock. Pairs of livestock diets and faeces that are needed for equation development can be gathered from feeding trials using penned animals (e.g. Li et al., 2007; Showers et al., 2006) or from trials using fistulated animals and free-ranging livestock (e.g. Leite and Stuth, 1995; Lyons and Stuth, 1992).
For pen feeding trials, forages are gathered by hand and mixed to create a known diet. A range of qualities and mixes of plant species are used to capture the variety in the local area or region. The diets are then fed to livestock and faeces are collected from the animals for a period of days after feeding. For trials using fistulated animals, the animals are grazed in pastures having free-ranging livestock and the extrusa collected is used to represent the diet of the livestock. Faecal samples are collected from the free-ranging animals for a period of days after extrusa collection.
For both of the above methods, the diets are analysed for quality constituents and the faecal samples are scanned with the NIRS instrument. NIRS software is then used to develop a multivariate equation that predicts the quality of the diet from the spectral characteristics of the faeces. Statistics such as standard errors and regression r2 values can be calculated to assess the robustness of the equations. NIRS scanning of faeces for forage quality constitu-ents generally has an accuracy that is similar to that of standard laboratory methods (Dixon and Coates, 2010; Lyons and Stuth, 1992; Showers et al., 2006; Decruyenaere et al., 2009).
The advantages of FNIRS are that it provides a rapid and reliable means of assessing the quality of forage the livestock animal is eating (Dixon and Coates, 2009), samples can be easily acquired without destructive harvesting, and the forage quality information provided can assist livestock producers in managing the nutritional needs of their herds to meet pro-duction goals (Dixon and Coates, 2009; Dixon and Coates, 2010). Disadvantages of FNIRS include the high up-front cost of the NIRS equipment, the need to develop feeding trials and equations that encompass the range of forage types and qualities that are encountered by the grazing animals in the region, and the need for independent validation of the FNIRS equations (Decruyenaere et al., 2009).
Conducting national feed assessments174
For a national feed inventory, FNIRS may be the most practical choice to assess diet quality across a nation. A research centre or project can be assigned to develop equations using livestock research herds and feeding trials to develop the equations needed for forage quality evaluation. However, the costs of equipment, training of personnel and logistics of gathering a large number of faecal samples to represent a region may be prohibitive.
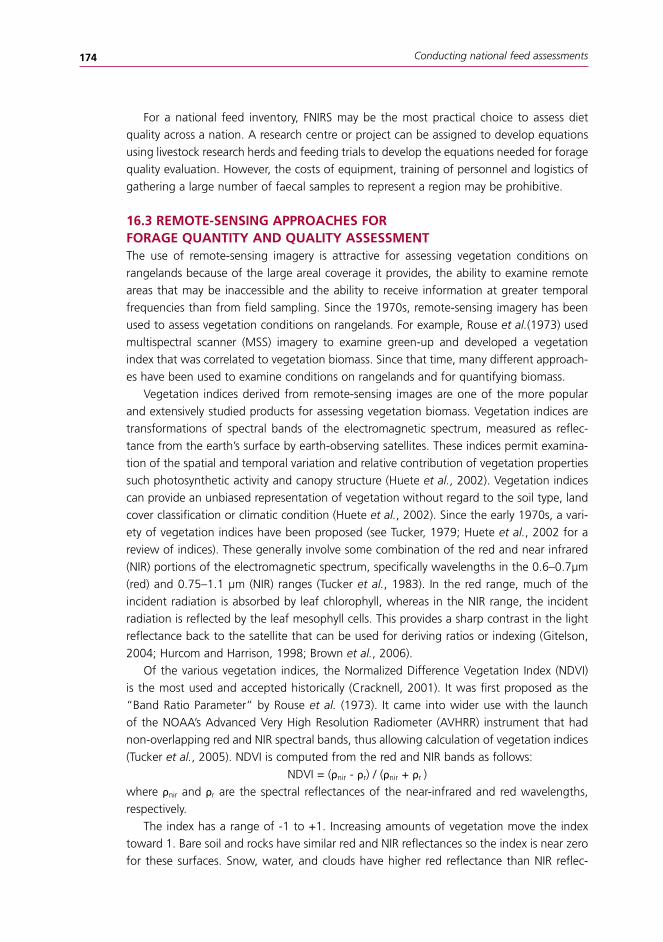
16.3 rEMOTE-SENSINg APPrOAChES fOr fOrAgE qUANTITy ANd qUAlITy ASSESSMENTThe use of remote-sensing imagery is attractive for assessing vegetation conditions on rangelands because of the large areal coverage it provides, the ability to examine remote areas that may be inaccessible and the ability to receive information at greater temporal frequencies than from field sampling. Since the 1970s, remote-sensing imagery has been used to assess vegetation conditions on rangelands. For example, Rouse et al.(1973) used multispectral scanner (MSS) imagery to examine green-up and developed a vegetation index that was correlated to vegetation biomass. Since that time, many different approach-es have been used to examine conditions on rangelands and for quantifying biomass.
Vegetation indices derived from remote-sensing images are one of the more popular and extensively studied products for assessing vegetation biomass. Vegetation indices are transformations of spectral bands of the electromagnetic spectrum, measured as reflec-tance from the earth’s surface by earth-observing satellites. These indices permit examina-tion of the spatial and temporal variation and relative contribution of vegetation properties such photosynthetic activity and canopy structure (Huete et al., 2002). Vegetation indices can provide an unbiased representation of vegetation without regard to the soil type, land cover classification or climatic condition (Huete et al., 2002). Since the early 1970s, a vari-ety of vegetation indices have been proposed (see Tucker, 1979; Huete et al., 2002 for a review of indices). These generally involve some combination of the red and near infrared (NIR) portions of the electromagnetic spectrum, specifically wavelengths in the 0.6–0.7μm (red) and 0.75–1.1 μm (NIR) ranges (Tucker et al., 1983). In the red range, much of the incident radiation is absorbed by leaf chlorophyll, whereas in the NIR range, the incident radiation is reflected by the leaf mesophyll cells. This provides a sharp contrast in the light reflectance back to the satellite that can be used for deriving ratios or indexing (Gitelson, 2004; Hurcom and Harrison, 1998; Brown et al., 2006).
Of the various vegetation indices, the Normalized Difference Vegetation Index (NDVI) is the most used and accepted historically (Cracknell, 2001). It was first proposed as the “Band Ratio Parameter” by Rouse et al. (1973). It came into wider use with the launch of the NOAA’s Advanced Very High Resolution Radiometer (AVHRR) instrument that had non-overlapping red and NIR spectral bands, thus allowing calculation of vegetation indices (Tucker et al., 2005). NDVI is computed from the red and NIR bands as follows:
NDVI = (ρnir - ρr) / (ρnir + ρr )where ρnir and ρr are the spectral reflectances of the near-infrared and red wavelengths, respectively.
The index has a range of -1 to +1. Increasing amounts of vegetation move the index toward 1. Bare soil and rocks have similar red and NIR reflectances so the index is near zero for these surfaces. Snow, water, and clouds have higher red reflectance than NIR reflec-
175Technologies, tools and methodologies for forage evaluation in grasslands and rangelands
tance, so NDVI values for these surfaces are negative (Hurcom and Harrison, 1998). NDVI has been used as a surrogate to estimate leaf area index, vegetation biomass and fraction of absorbed photosynthetically active radiation (FAPAR) (Asrar et al., 1984; Sellers, 1985; Tucker, 1979).
Currently, multiple satellite platforms exist that are producing remote-sensing imagery and many of the products are freely available. The increased availability and generally low cost have made remote-sensing imagery an attractive tool for monitoring landscape con-ditions. The low cost and dense dataset that it provides make it an appealing product for use in a national feed inventory. Below is an overview of remote-sensing applications for forage quantity and quality assessments with a discussion of empirical and remote-sensing input model approaches.
16.3.1 forage quantityTwo approaches have generally been used for assessment of biomass using remote-sensing imagery. These are: 1) empirical models that predict the forage biomass based on a statis-tical relationship between the spectral bands (or some combination of bands) in the image and vegetation biomass, and 2) process models that use remote-sensing data as inputs for predicting vegetation biomass.
16.3.2 Empirical approachesEmpirical approaches for assessing biomass using remote-sensing products generally involve using a regression relationship between the remote-sensing product variable and field-collected data on biomass (Dungan, 1998). For example, Tucker et al. (1983) used both a linear and logarithmic regression between the NDVI and ground collected biomass data to predict biomass on a regional scale in the Sahel region of Senegal. In the Xilingol Steppe of Inner Mongolia, Kawamura et al. (2005) found that the Enhanced Vegetation Index (EVI) derived from the Moderate Resolution Imaging Spectroradiometer (MODIS) satellite was useful in predicting live biomass and total biomass. In New Zealand, forage in dairy pastures was predicted within a 10 percent error using a regression model that related NDVI and time of year to forage biomass (Mata et al., 2007). For rangelands in Jordan, Al-Bakri and Taylor (2003) used a linear regression model to predict shrub biomass produc-tion. They stated that this approach has the potential for estimating carrying capacity for rangelands in Jordan. In Mongolia, rangeland biomass was estimated using a relationship between a vegetation health index and field-collected biomass data (Kogan et al., 2004). The vegetation health index was calculated using NDVI and brightness temperatures from the AVHRR satellite. The index provides an indication of anomalous vegetation conditions. In the northern Great Plains of the United States, Frank and Karn (2003) found a non linear response between biomass and NDVI, but this relationship was highly correlated (r2=0.83). In an examination of real-time mapping of biomass for fire risk assessment at Etosha National Park in Namibia, Sannier et al. (2002) used rapid field measurement techniques for grass and shrub vegetation and developed regression relationships between these and NDVI. They found good correlations between green biomass and NDVI, although the strength of these relationships was related to vegetation type. They concluded that the ability to predict biomass via these methods allows near real-time mapping of fire risk to be feasible for Etosha National Park.
Conducting national feed assessments176
16.3.3 remote-sensing input modelsOne problem that has been noted for empirical models that use remote sensing data to pre-dict biomass amounts is that they violate the regression assumption of no autocorrelation in the predictor variable(s) (Dungan, 1998; Foody, 2003). Given that most remote-sensing data is inherently autocorrelated (similarity in pixels as a function of distance), this assump-tion should not be ignored. One way of overcoming this is to use plant growth models that are driven by remotely-sensed input variables on a pixel-by-pixel basis. Reeves et al. (2001) describe such an approach for predicting rangeland biomass using remote-sensing products from the MODIS system and a light use efficiency model for plant growth. Their approach uses the MODIS imagery to estimate FAPAR, which is then fed into a light use effi-ciency model (Montieth, 1972, 1977) that estimates aboveground net primary productivity (ANPP). Regional maps of biomass are then produced at 1 km2 resolution. Hunt and Miyake (2006) used a similar light use efficiency model to predict stocking rates within 1 km2 cells for the entire state of Wyoming in the United States. Their model differed from Reeves et al. (2001) in that they used the NOAA Advanced Very High Resolution Radiometer (AVHRR) to estimate FAPAR and they converted aboveground net primary production to available forage to remove biomass not usable by livestock.
Although much evidence exists that the application of biomass prediction on rangelands using remote-sensing variables is feasible, the extrapolation of these relationships to new areas is not always feasible or recommended. Generally, field data need to be collected for new areas or regions to develop the prediction equations. Another issue is that many of these models predict vegetation biomass, but do not address forage availability to specific grazers. If forage deficits or surpluses for specific kinds of livestock are to be addressed in a national feed inventory, grazer specific equations or models need to be developed to address available forage. In a study examining the use of remote-sensing data for esti-mating forage biomass for carrying capacity assessments in Namibia, Espach et al. (2009) addressed issues of quantifying available forage by developing corrections for shrub bio-mass that was unpalatable or not available to grazers.
16.3.4 forage qualityResearch on using remote-sensing to estimate forage quality is not as extensive as that for the estimation of biomass. This is probably related to the difficulties involved in acquiring forage quality information to use in empirical and modelling approaches. Another issue is that as remote-sensing data becomes coarser in resolution, the pixel becomes an integrat-ed representation of the vegetation, therefore making it more difficult to separate out the vegetation components that are eaten by the grazing animal. It also makes it difficult to determine an appropriate sampling scheme to measure forage quality, especially when vege-tation becomes more heterogeneous and when multiple grazing animals are using the area.
16.3.5 Empirical approachesEmpirical approaches for estimating forage quality generally involve examining statistical relationships between forage quality variables and spectral information from remote-sens-ing imagery. Thoma et al. (2002) used simple linear regression with NDVI as the inde-pendent variable to predict forage quality and quantity on rangelands in Montana, United
177Technologies, tools and methodologies for forage evaluation in grasslands and rangelands
States. They reported reasonable relationships between NDVI and live biomass (r2 = 0.68), total biomass (r2 = 0.68), and nitrogen in standing biomass (r2 = 0.66), but found poor relationships with biomass (r2 = 0.18) and nitrogen concentration (r2 = 0.01) in standing dead biomass. In China, regression equations using the Enhanced Vegetation Index (EVI) derived from the MODIS sensor were used to predict live and dead biomass and crude pro-tein in standing biomass (Kawamura et al., 2005). They found good predictability between standing live biomass and total biomass (green + dead) (r2 = 0.77 to 0.80), but found poor correlations with crude protein (r2 = 0.11).
Using faecal NIRS techniques to determine diet quality for white tail deer in Texas, Unit-ed States, Showers et al. (2006) examined the ability of NDVI to predict deer diet quality. They found strong statistical relationships between NDVI and diet quality variables (crude protein, digestible organic matter and phosphorus) for all seasons (r2 >0.70), with the exception of phosphorus in the winter.
16.3.6 geostatistical interpolationFor a national feed inventory programme, the ability to map forage quality for a region or entire country is very useful. Because of the logistics and costs, it is likely be impractical to collect enough data to map forage quality based only on data collected from the field using direct or indirect methods. However, interpolation techniques such as co-kriging can be useful in mapping expensive, hard-to-collect variables given the availability of a second correlated variable that is easier and less costly to collect. Co-kriging is a geostatistical interpolation technique that calculates estimates for unknown points by using the weight-ed linear average of the available samples of the primary and secondary variables. The secondary variable (covariate) is cross-correlated with the primary variable of interest and is usually sampled more frequently and regularly (Isaaks and Srivastava, 1989), thus allow-ing estimation of unknown points using both variables. Remote-sensing imagery provides a dense and exhaustive data set that can serve as a secondary variable for geostatistical interpolation, given that a correlation (both direct and spatially) exists between the primary and secondary variable (Dungan, 1998). Co-kriging of forage quality was tested for cattle in Ghana using FNIRS-estimated diet quality attributes as the primary variable and NDVI as the secondary variable (Awuma et al., 2007). Diet quality attributes (crude protein and digestible organic matter) were collected from cattle at selected households throughout Ghana during 2000. The diet quality variables were paired with NDVI extracted for the pixels at the location and date of the faecal collection. The diet quality and NDVI data were subject to co-kriging analysis and maps were produced for the diet quality variables. Validation results indicated that co-kriging did a reasonable job of predicting crude protein during the dry season (r2 = 0.687) but not quite as well in the wet season (r2 = 0.513). For digestible organic matter, the co-kriging prediction was poor for the dry season (r2 = 0.13), but did reasonably better for the wet season (r2 = 0.548). It was speculated that this was related to the amount of shrub cover in some of the sampling areas that did not contrib-ute to the available forage for cattle, but increased the greenness signal in the NDVI. The results of this study do indicate that the technique of mapping forage quality is feasible but additional study and validation will be needed to improve the results for use in national programmes.
Conducting national feed assessments178
16.4 USE Of SIMUlATION MOdElS fOr ESTIMATINg fOrAgE qUANTITySimulation modelling offers unique capabilities for estimating forage quantity for a national feed inventory programme. Although the initial efforts required to parameterize, calibrate and validate a simulation model can be time-consuming and expensive, especially for a national effort, the capabilities that simulation modelling provides, such as near real-time monitoring, forecasting and exploration of alternatives, make it an attractive choice for a national feed inventory programme. The use of simulation models for rangeland and grassland analysis has increased in the past 30 years due to increased computing capacity, accessibility of program-ming languages and availability of data to parameterize the models. Rangeland/grassland simulation models have differing levels of complexity and many are designed to not only sim-ulate biomass production but also examine other aspects such as hydrology, erosion, livestock production, ecosystem services and/or economics in an integrated, interacting framework. This framework allows users to examine ecosystem processes and management alternatives, and to predict response to differing alternatives (Wight and Skiles, 1987; Bouraoui and Wolfe, 1990; Carlson and Thurow, 1992). An overview of models that have been used for predicting biomass on rangelands is provided below along with examples of using simulation modelling in an integrated framework for risk management and decision-making.
16.4.1 rangeland modelsOne of the first comprehensive rangeland simulation models was Simulation of Production and Utilization of Rangelands (SPUR) (Wight and Skiles, 1987). SPUR simulates rangeland ecosystem function and allows evaluation of changing management practices. The model is physically-based and has integrated climate, hydrology, plant, animal and economic mod-ules (Carlson and Thurow, 1992; Hanson et al., 1992; Foy et al., 1999; Pierson et al., 2001). The SPUR model has been exercised in several different geographic locations to ascertain its ability to predict biomass production. For example, in a field study in north-central Texas, United States, Teague and Foy (2002) found a good agreement between the model output and measured aboveground biomass for warm season grasses and poor agreement with total aboveground biomass for cool season grasses. In southwestern Idaho, United States, SPUR model output was compared with peak standing biomass for shrubs (sagebrush), grasses and miscellaneous forbs (Pierson et al., 2001). Bottlebrush squirreltail grass (Elymus elymoides) biomass had the best correspondence with model output during the eight year time period examined, whereas sagebrush (Artemisia tridentata ssp. wyomingensis) and Sandberg bluegrass (Poa sandbergii) biomass corresponded to the model in four out of eight years and three out of eight years, respectively.
Other simulation models capable of predicting rangeland biomass include the Water Erosion Prediction Project (WEPP) (Flanagan and Nearing 1995), the Agricultural Land Management Alternatives with Numerical Assessment Criteria (ALMANAC) (Kiniry et al., 2002), and the Ecological Dynamics Simulation Model (EDYS) (Childress et al., 2002). The WEPP model was primarily developed as a replacement to the Universal Soil Loss Equation (USLE) with its primary focus on water erosion and sediment loss, but forage growth and grazing can be simulated to complement the erosion information (Flanagan and Nearing, 1995). The ALMANAC model is a multi-species model that predicts biomass and also simulates water and nutrient balance (Kiniry et al., 2002). It was developed to perform
179Technologies, tools and methodologies for forage evaluation in grasslands and rangelands
across a wide variety of soils and climatic conditions and is currently being used as the sim-ulation model for rangeland biomass assessment for the Rangeland Conservation Effects Assessment Program for the United States Department of Agriculture. The EDYS model is a general rangeland process model capable of modelling changes in biomass as well as relevant ecological processes such as physical disturbance, plant uptake and growth, fire, herbivory, and management activities (Childress et al., 2002). It can model these dynamics at the plot scale, but can also be run in a gridded environment to capture spatial variability and to allow scaling. The model has been used to examine impacts of military training on vegetation and soil erosion, the impacts of expanding wild elk herds on winter pasture and endangered species habitat, and impacts of woody plant invasions.
Another comprehensive rangeland biophysical model is the Phytomass Growth Simu-lator Model (PHYGROW) (Stuth et al., 2003b). PHYGROW is a multi-species plant growth model capable of simulating biomass production, soil water dynamics, runoff, selective grazing by livestock and stocking rates of multiple livestock species. The plant growth sub-model in PHYGROW is a light use efficiency model (Montieth, 1972 1977) that simu-lates plant growth optimal conditions (water non-limiting). The model then discounts plant growth based on the amount of water stress, temperature stress and livestock grazing demand based on the input climate variables and grazer herd composition and plant prefer-ences. The grazing and stocking rate sub-model allows biomass to be selectively grazed by multiple kinds/classes of livestock having differing forage demands and forage preferences (Stuth et al., 2003b; Quirk and Stuth, 1995), thus allowing accounting of available forage by grazer. The model is the foundation of the regional livestock early warning system (LEWS) in East Africa (Ryan, 2005; Stuth et al., 2003a; Stuth et al., 2005) and Mongolia (Angerer, 2008; Bolor-Erdene et al., 2008). LEWS was developed for assessing near-real time forage conditions for managing drought and livestock movement.
The Agriculture Policy/Environmental Extender Model (APEX) (Williams et al., 2008) has been used in a variety of pasture systems in the United States and elsewhere for con-servation effect assessments and examination of best management practices. One of the unique aspects of APEX is that the model provides the ability to simulate management on whole farms, pasture systems or small watersheds in order to examine practices in relation to ecosystem services (e.g. water quality, soil quality, carbon sequestration, etc.). The model also allows evaluation of various management practices such as terracing, grass waterways, buffer strips, crop/pasture rotations, irrigation, drainage systems and manure management. The model is currently being updated to improve the grazing algorithm for simulating selective grazing in order to extend the capabilities of the model for rangelands (J. Williams, personal communication).
16.4.2 Integrated approachesField-collected data, simulation model output and remote-sensing data can be integrated into a GIS to produce comprehensive outputs that can enhance the products produced for a national feed inventory programme. In addition, an integrated GIS framework can allow the use of geostatistical tools that can provide capabilities for interpolating forage quantity and quality point data or improve interpolation by taking advantage of cross-correlations between the forage data and remote-sensing variables.
Conducting national feed assessments180
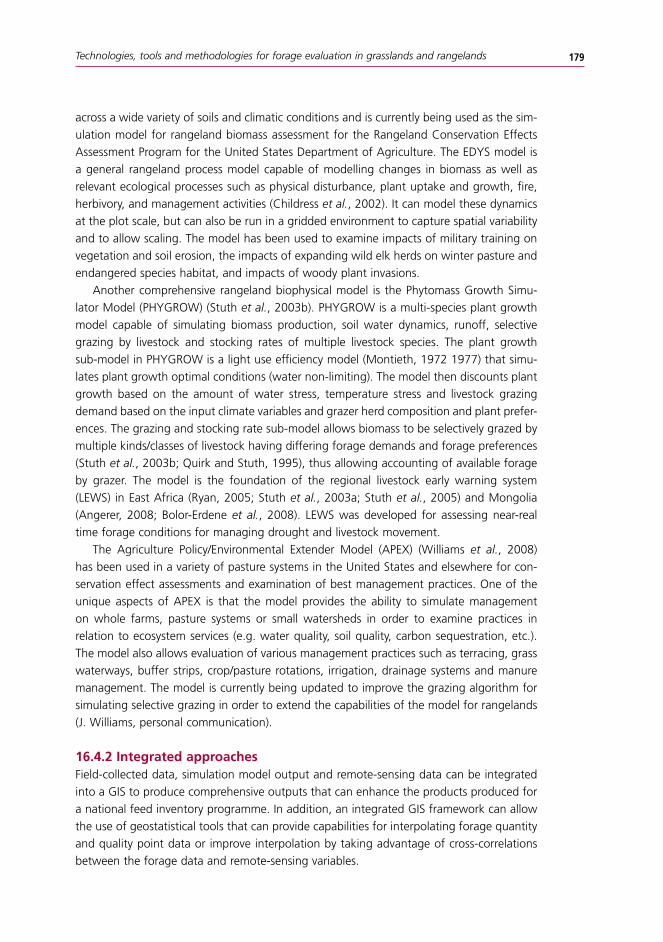
An example of an integrated approach to forage quantity assessment on a regional level is the Livestock Early Warning System (LEWS) in East Africa (Stuth et al., 2003a; Stuth et al., 2005) and Mongolia (Angerer, 2008; Bolor-Erdene et al., 2008). LEWS was developed to provide near real-time estimates of forage biomass and deviation from average conditions (anomalies) to provide pastoralists, policy-makers and other stakeholders with information on emerging forage conditions to improve risk management decision-making. The system combines field data collection from a series of monitoring sites, simulation model outputs, statistical forecasting and GIS to produce regional maps of current and forecast forage conditions (Figure 16.1). The system uses the PHYGROW simulation model as the primary tool for estimating forage conditions. Data on plants, soils, and grazers are collected from monitoring sites in the field and the data are stored in the PHYGROW model database. Climate data are acquired from national data sources and also stored in the database. The data are used to parameterize and calibrate the model. The simulation model runs for each monitoring site are every 15 days and the outputs are made available via the GIS web portal. To produce maps of forage conditions, the total forage available to livestock is output for each monitoring site and is merged with NDVI data for the region. Co-krig-ing interpolation is then conducted to create regional maps of available forage. Anomaly maps (deviation from long-term average) of forage conditions are also produced to provide regional and local stakeholders with the ability to compare current conditions with those in the past and to identify areas of drought or poor forage conditions.
The LEWS system also incorporates a statistical forecasting system that provides a projection of available forage conditions for 60 days into the future. Using GIS, the total
FIguRe 16.1Integrated framework for the livestock Early warning System modelling system
for East Africa and Mongolia
Monitoring Site Characterization
Long-termClimate
Data
Climate Imagery
PHYGROWModel
Database
Soils Plants Grazing
Regional GISPortal
Monitoring Site
Web Portal
AutomatedPHYGROW
Model Runs
Near Real-TimeSite Conditions
Projectionsand Forecasts
NDVI Imagery
Near-Real Time Forage Maps
Regional ForageAmount, Anomalyand Forecast Maps
Base Maps
181Technologies, tools and methodologies for forage evaluation in grasslands and rangelands
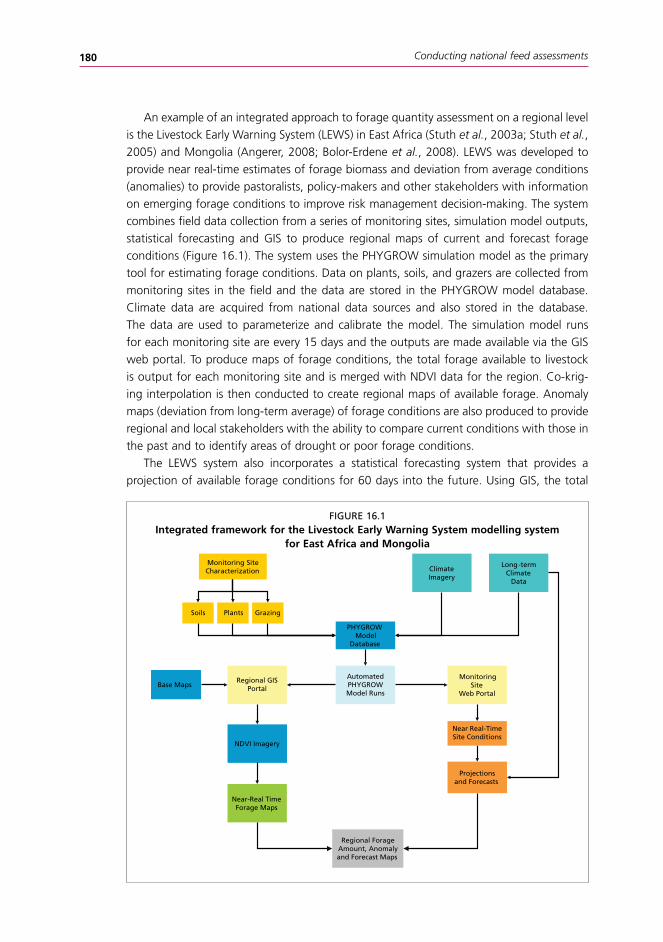
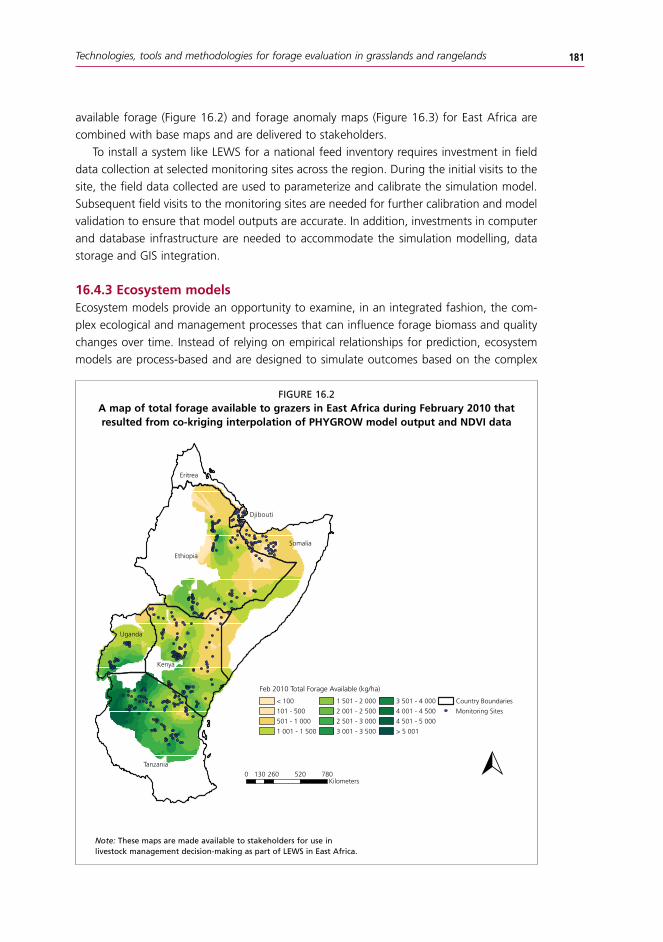
available forage (Figure 16.2) and forage anomaly maps (Figure 16.3) for East Africa are combined with base maps and are delivered to stakeholders.
To install a system like LEWS for a national feed inventory requires investment in field data collection at selected monitoring sites across the region. During the initial visits to the site, the field data collected are used to parameterize and calibrate the simulation model. Subsequent field visits to the monitoring sites are needed for further calibration and model validation to ensure that model outputs are accurate. In addition, investments in computer and database infrastructure are needed to accommodate the simulation modelling, data storage and GIS integration.
16.4.3 Ecosystem modelsEcosystem models provide an opportunity to examine, in an integrated fashion, the com-plex ecological and management processes that can influence forage biomass and quality changes over time. Instead of relying on empirical relationships for prediction, ecosystem models are process-based and are designed to simulate outcomes based on the complex
FIguRe 16.2A map of total forage available to grazers in East Africa during february 2010 that resulted from co-kriging interpolation of PhygrOw model output and NdvI data
Ethiopia
Tanzania
Kenya
Somalia
Uganda
Eritrea
Djibouti
0 260 520 780130Kilometers
Feb 2010 Total Forage Available (kg/ha)
< 100
101 - 500
501 - 1 000
1 001 - 1 500
1 501 - 2 000
2 001 - 2 500
2 501 - 3 000
3 001 - 3 500
3 501 - 4 000
4 001 - 4 500
4 501 - 5 000
> 5 001
Country Boundaries
Monitoring Sites
Note: These maps are made available to stakeholders for use in livestock management decision-making as part of leWS in east africa.
Conducting national feed assessments182
interactions among biotic, abiotic and human management processes. For a national feed inventory system, the use of ecosystem models provides the ability to holistically examine the processes of forage production and use by livestock and other herbivores. Specific caus-es for feed deficits or surpluses are also explored to assist in determining where mitigating measures are needed or where improvements can be made to the system.
The SAVANNA model (Coughenour, 1993; Chapter 15 of this Manual) is an ecosystem model that has been used extensively on rangelands in East Africa, Asia and the United States (Thornton et al., 2006, Wiesberg et al., 2006). It is a process-based, spatially explicit model that can simulate changes in forage quantity and quality in relation to climate, landscape position, plant community, selective herbivory and land management. The model is integrated with GIS to allow remote-sensing and spatial data layers to be easily incor-porated into the model framework. The model contains modules for site hydrology, plant population dynamics, plant biomass production, herbivory, herbivore energy balance and grazing herbivore population dynamics. It is unique in its ability to simulate grazing animal movement in response to changing forage quantity and quality conditions, water distribu-
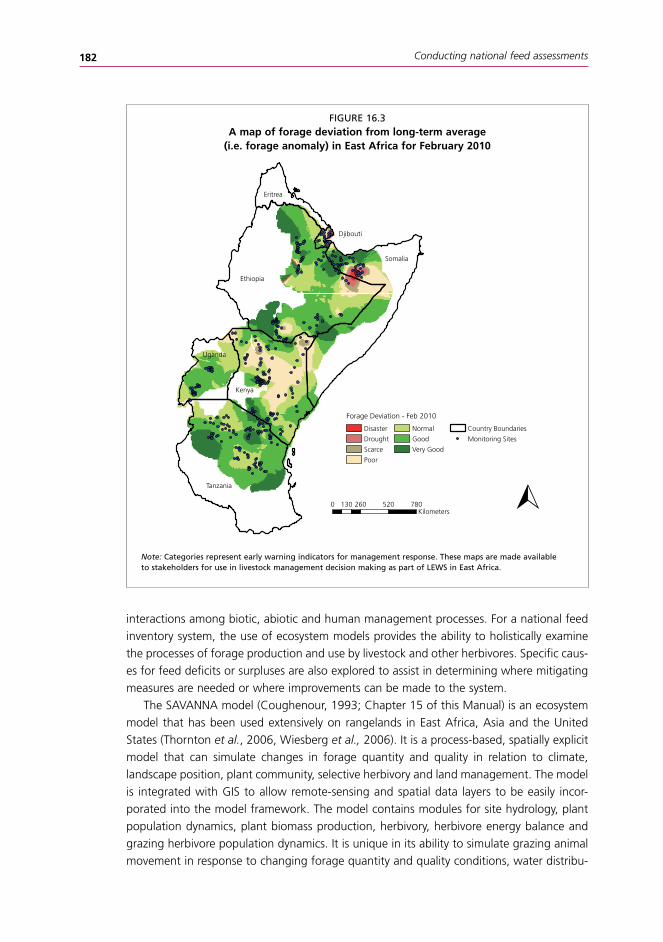
FIguRe 16.3A map of forage deviation from long-term average
(i.e. forage anomaly) in East Africa for february 2010
Ethiopia
Tanzania
Kenya
Somalia
Uganda
Eritrea
Djibouti
0 260 520 780130Kilometers
Forage Deviation - Feb 2010
Disaster
Drought
Scarce
Poor
Normal
Good
Very Good
Country Boundaries
Monitoring Sites
Note: Categories represent early warning indicators for management response. These maps are made available to stakeholders for use in livestock management decision making as part of leWS in east africa.

183Technologies, tools and methodologies for forage evaluation in grasslands and rangelands
tions and topography, in addition to changes in population structure and herd productivity due to changes in vegetation quantity and quality (Ellis and Coughenour, 1998).
The SAVANNA model was originally developed to examine the ecosystem dynamics and coping strategies of pastoralists in the Turkana region of Kenya and has since been adapted to many other regions and grazing systems (Boone and Wang, 2007; Ellis and Coughe-nour, 1998). It has been used to assess forage-limited large herbivore dynamics in a wide variety of ecosystems worldwide (Coughenour 1999, 2002, 2005; www.nrel.colostate.edu/projects/savanna). Equal attention is given to animal and vegetation responses in terms of forage intake, energy balance, spatial distribution and population dynamics. A comparison of this modelling approach with others is provided by Weisberg et al. (2006). Christensen et al. (2003) used the model to examine productivity differences and livestock grazing dynam-ics under a range of stocking rates to provide insights into the sustainability of grasslands in Inner Mongolia in face of increasing grazing pressure. They identified thresholds where increased grazing pressure leads to changes in vegetation composition from herbaceous to shrub-dominated communities. Boone and Wang (2007) used the SAVANNA model to assess population dynamics of cattle under varying climatic regimes in Africa and found that precipitation amounts and variability were not always linked to changes in cattle pop-ulations over time. Plumb et al. (2009) used the model to examine carrying capacities for bison in Yellowstone National Park, United States, and were able to recommend a general number of bison that could be supported by the park over time.
In using an ecosystem model such as SAVANNA for a national feed inventory pro-gramme on rangelands, a significant amount of time and effort needs to be spent on acquiring the GIS data layers and collecting plant and animal data to parameterize the model. However, once the model is parameterized and calibrated, not only can estimates of forage biomass and quality be examined and mapped, but a whole range of other outputs can also be provided to assist decision-makers in understanding the underlying causes of feed deficits/surpluses.
16.5 INflUENCES Of TErrAIN, wATEr dISTrIbUTION ANd OThEr fACTOrS ON fOrAgE AvAIlAbIlITyIn previous sections, the concept of available forage was presented and the need to define available forage as being specific to the grazer(s) of interest was discussed. Other factors that can influence the availability of forage include terrain, distance to water and pene-trability of shrubs and trees. The kind of grazing animal is also an important consideration because different kinds and classes of grazing animals differ in their ability to navigate these factors.
16.5.1 TerrainFeatures of the landscape terrain can influence how livestock utilize vegetation. Slope of the terrain can be a primary factor that influences the accessibility of forage to grazers. For cattle, steep slopes are hard to navigate; therefore, utilization of forage by cattle on slopes greater than 60 percent is generally very low. Holechek et al. (2001) provide guidelines to account for the reduced grazing capacity for cattle based on percentage of slope. For slopes of 0 to 10 percent, no reduction in grazing capacity is needed. For slopes of 11 to
Conducting national feed assessments184
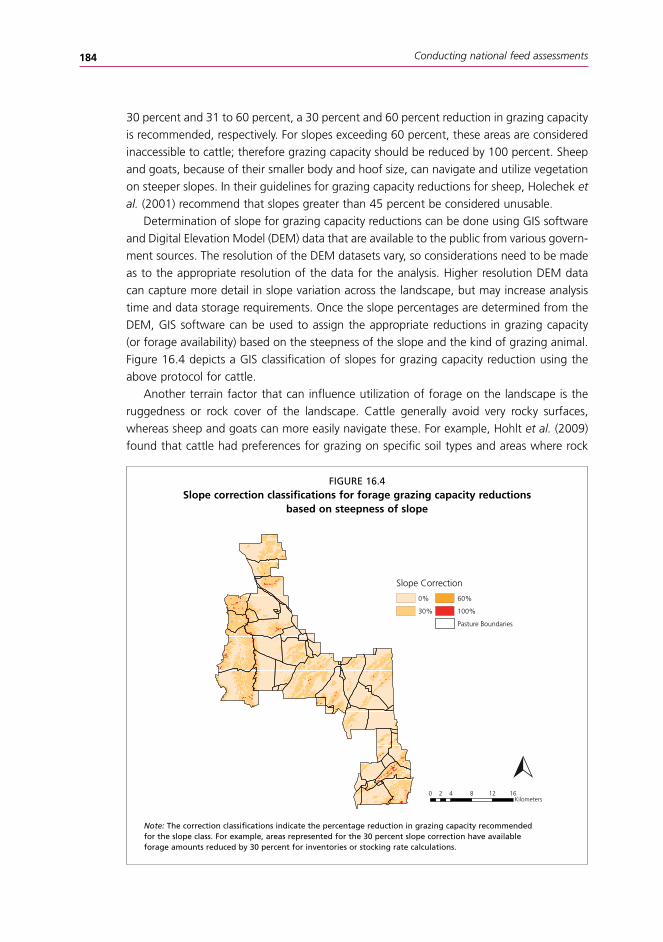
30 percent and 31 to 60 percent, a 30 percent and 60 percent reduction in grazing capacity is recommended, respectively. For slopes exceeding 60 percent, these areas are considered inaccessible to cattle; therefore grazing capacity should be reduced by 100 percent. Sheep and goats, because of their smaller body and hoof size, can navigate and utilize vegetation on steeper slopes. In their guidelines for grazing capacity reductions for sheep, Holechek et al. (2001) recommend that slopes greater than 45 percent be considered unusable.
Determination of slope for grazing capacity reductions can be done using GIS software and Digital Elevation Model (DEM) data that are available to the public from various govern-ment sources. The resolution of the DEM datasets vary, so considerations need to be made as to the appropriate resolution of the data for the analysis. Higher resolution DEM data can capture more detail in slope variation across the landscape, but may increase analysis time and data storage requirements. Once the slope percentages are determined from the DEM, GIS software can be used to assign the appropriate reductions in grazing capacity (or forage availability) based on the steepness of the slope and the kind of grazing animal. Figure 16.4 depicts a GIS classification of slopes for grazing capacity reduction using the above protocol for cattle.
Another terrain factor that can influence utilization of forage on the landscape is the ruggedness or rock cover of the landscape. Cattle generally avoid very rocky surfaces, whereas sheep and goats can more easily navigate these. For example, Hohlt et al. (2009) found that cattle had preferences for grazing on specific soil types and areas where rock
FIguRe 16.4Slope correction classifications for forage grazing capacity reductions
based on steepness of slope
Note: The correction classifications indicate the percentage reduction in grazing capacity recommended for the slope class. For example, areas represented for the 30 percent slope correction have available forage amounts reduced by 30 percent for inventories or stocking rate calculations.
Slope Correction
0%
30%
60%
100%
Pasture Boundaries
0 4 8 12 162Kilometers
185Technologies, tools and methodologies for forage evaluation in grasslands and rangelands
cover was below 30 percent. Assessing the degree of ruggedness and rock cover for terrain is difficult without field measurements or visual appraisals. High resolution aerial photogra-phy can provide information on these factors, but may not be practical for a national and regional programme due to cost and availability.
Spatial arrangement and density of vegetation, especially trees and shrubs, can influ-ence use of forage on the landscape by grazing livestock. Thick, dense patches of shrubs and trees may be impenetrable for some kinds of livestock and therefore may impede foraging and reduce accessibility to forage beyond the boundary of the patch. On mixed-shrub/grass rangeland in the Edwards Plateau region of Texas, United States, Owens et al. (1991), found that as shrub abundance increased, utilization of the grasses by cattle decreased. They attributed this decrease to the physical barrier created by dense shrubs. In studies using GPS receivers on cattle, Hohlt et al. (2009) found that cattle in both the Edwards Plateau and southern regions of Texas, United States, avoided areas of thick, dense shrub cover. To assess density and impenetrability of shrubs so that forage availability reductions can be made, field data collection and classification of shrub/tree cover using remote-sensing imagery, or aerial photography can be used to map areas of shrub and tree cover. However, for a regional and national feed inventory programme, the costs and logistics for collecting this data may be prohibitive.
16.5.2 distance to waterAnother major factor influencing availability of livestock forage is distance to water. Like terrain, the degree to which this factor affects accessibility of forage is dependent on the kind of grazing animals. Cattle need water every day for efficient growth, therefore they generally will not utilize forage that is greater than 3.2 km from a water source (Holechek et al., 2001). Sheep and goats can traverse greater distances for forage because they do not require water each day (McDaniel and Tiedeman, 1981). Desert cattle breeds also require less water. Camels, with their unique adaptations to go without water for long periods, are able to range extremely far from water.
Holechek et al. (2001) provide guidelines for reductions in cattle grazing capacity with increasing distance from water. For distances of 0 to 1.6 km, no reduction in grazing capac-ity is needed. For distances of 1.6 to 3.2 km, a 50 percent reduction is recommended. For distances greater than 3.2 km, a 100 percent reduction is recommended (ungrazeable).
Developing a map of grazing capacity reductions can easily be constructed using GIS software given that the locations of the water sources are known. Buffers of the distance classes can be built around each water point and merged to form a coverage of grazing capacity reductions. Figure 16.5 depicts a grazing capacity reduction map for water points within a pasture grazing system.
To incorporate grazing capacity reductions due to distance to water in a regional or national feed inventory programme, a comprehensive geodatabase of water locations needs to be developed. This database must be updated periodically to add new locations and provide status updates for those water points already included in the system.

Conducting national feed assessments186
16.6 ASSESSINg ANIMAl PrOdUCTION rESPONSES TO fOrAgE qUANTITy ANd qUAlITyBecause livestock production from grasslands and rangelands is a significant contribution to the overall GDP in many countries and is a component of the wealth and well-being of many people, especially pastoralists, the assessment of animal production as it is related to forage quantity and quality is important for monitoring at the national or regional level. Many countries conduct inventories of livestock, but rarely have the numbers of livestock been compared with the forage base to assess production capacity and/or sustainability of the forage resources. In the following sections, considerations for carrying capacity, stock-ing rate and nutritional balancing are discussed, as well as ways in which a national feed inventory programme can be used to gather information for sustainable livestock produc-tion and improved feed management.
16.6.1 Carrying capacity and stocking rate considerationsOnce a national or regional inventory of forage biomass is conducted through direct meas-urements, remote-sensing methods, simulation modelling or combinations of these, then the forage biomass will need to be translated into numbers of animals that the forage base can support. Stocking rate can be defined as the number of animals allocated to a given land area for a specified time period. Grazing or carrying capacity can be defined as the
FIguRe 16.5Correction classifications for forage grazing capacity reductions
based on distance to water
Note: The correction classifications indicate the percentage reduction in grazing capacity recommended for distance away from the watering point. For example, areas represented for the 50 percent distance to water correction have available forage amounts reduced by 50 percent for inventories or stocking rate calculations.
Distance to Water Reduction
0%
10%
20%
30%
40%
50%
100%
Pasture Boundaries
0 4 8 12 162Kilometers
187Technologies, tools and methodologies for forage evaluation in grasslands and rangelands
maximum stocking rate for a given land area that can be used year after year without dam-aging the vegetation or other associated resources (e.g. soil, water quality, etc.) (Holechek et al., 2001). Using the information on forage biomass, the characteristics of the grazing animal(s) and other data layers such as slope and distance to water, a stocking rate for the animals of interest can be calculated.
Calculation of stocking rate is conducted in four steps: 1) determination of available forage; 2) adjustments for slope and distance to water; 3) calculation of forage demand; and 4) calculation of stocking rate. For the first step, the amount of available forage for the animal(s) of interest can be assessed using the tools and methodologies described in the previous sections. As discussed above, the amount of forage that is available to a particular grazer on a landscape is dependent on the plant species present and the dietary preferenc-es of the grazing animal. Therefore, the forage biomass estimates determined through the national feed inventory needs to be partitioned into available forage for each grazer so that stocking rates can be calculated. Because of dietary overlap among grazing animals, care needs to be taken in partitioning the forage biomass to each grazer so that the portion of biomass where the diets overlap is separated properly; otherwise, too many animals will be allocated to the given land area.
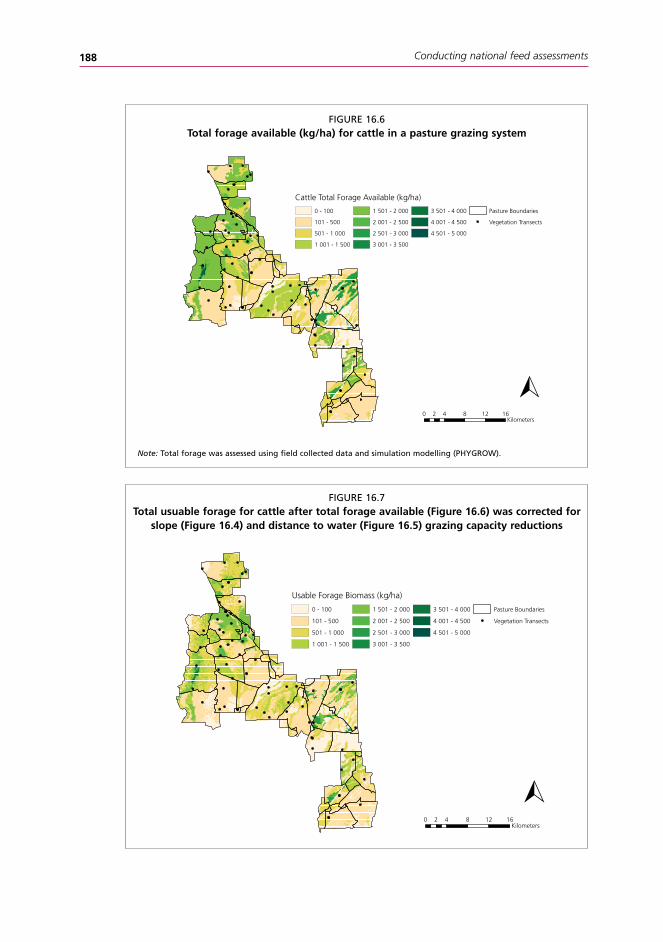
Once the available forage is determined, then the adjustments to available forage for slope and distance to water can be calculated. This can be done in a GIS where the avail-able forage biomass data layer (Figure 16.6) is multiplied by the slope adjustment (Figure 16.4) and distance to water adjustment (Figure 16.5), resulting in a map of usable forage (Figure 16.7). The usable forage can then be aggregated up to a boundary (e.g. pasture, administrative boundary, etc.) resulting in the total kilograms of usable forage for the area of interest.
Once the usable forage is determined, then the forage demand for the grazer of interest needs to be determined. The dry matter intake of most ruminants is 2 percent of their body weight (Holechek et al., 2001). Therefore, the average weight of the grazer can be multiplied by 2 percent to determine daily intake of forage. This is then multiplied by the number of days of grazing resulting in the forage demand per grazing animal for the grazing period (kg/head/period).
For the stocking rate calculation, the total usable forage (from step 2) needs to be partitioned into forage that should be sustainably utilized for grazing by the animal (i.e. percent allowable use) and forage residue that will be left on the site to protect the soil and regenerate the plants. The percent of allowable use varies by vegetation type and climate, generally by from 25 to 50 percent. Holechek et al. (2001) provide guidelines on allowable use values for different vegetation types and rainfall regimes. After the total usable forage is multiplied by the percent of allowable use, the product provides the total kilograms of forage that is available for grazing. This amount is then divided by the forage demand (step 3) resulting in the total number of animals that can graze the area of interest.
The steps for calculating stocking rate (adapted from Holechek et al., 2001) are sum-marized below:
1. Determination of available forage (kg/ha of dry matter) for a given land area. Assessed through direct field measurement, remote-sensing methods, simulation modelling or combinations of these.
Conducting national feed assessments188
FIguRe 16.6Total forage available (kg/ha) for cattle in a pasture grazing system
Note: Total forage was assessed using field collected data and simulation modelling (PHYgROW).
FIguRe 16.7Total usuable forage for cattle after total forage available (figure 16.6) was corrected for
slope (figure 16.4) and distance to water (figure 16.5) grazing capacity reductions
Cattle Total Forage Available (kg/ha)
0 - 100
101 - 500
501 - 1 000
1 001 - 1 500
1 501 - 2 000
2 001 - 2 500
2 501 - 3 000
3 001 - 3 500
3 501 - 4 000
4 001 - 4 500
4 501 - 5 000
Pasture Boundaries
Vegetation Transects
0 4 8 12 162Kilometers
Usable Forage Biomass (kg/ha)
0 - 100
101 - 500
501 - 1 000
1 001 - 1 500
1 501 - 2 000
2 001 - 2 500
2 501 - 3 000
3 001 - 3 500
3 501 - 4 000
4 001 - 4 500
4 501 - 5 000
Pasture Boundaries
Vegetation Transects
0 4 8 12 162Kilometers

189Technologies, tools and methodologies for forage evaluation in grasslands and rangelands
2. Calculation of usable forage (total kg dry matter) for area of interest. Available forage (kg/ha) x slope correction x distance to water correction x area (ha) = total usable forage available for grazing (kg)
3. Calculation of forage demand. Weight of grazer (kg) x daily dry matter intake (2 percent of body weight) x length of time area will be grazed (days) = forage demand per grazer for grazing period (kg)
4. Calculation of stocking rate. Total usable forage (kg) x allowable use (percent) ÷ forage demand per grazer (kg) = number of grazing animals (hd)
An important consideration in developing the stocking rates is to account for wildlife use of forage, and events that may reduce the amount of forage such as fire. In areas such as Africa where livestock and wildlife share grazing areas, accounting for forage use by wildlife is extremely important otherwise stocking rate calculations result in allocating more animals than an area can sustainably support. Also, for national inventories, it is important to have good base maps of national parks boundaries, reserves and other non-grazeable areas so that these land areas are not included in the forage inventory or stocking rate analysis.
16.6.2 Nutritional balancingFor forage quality assessments, nutritional balancing decision tools can be useful in assess-ing supplemental feed requirements for enhancing/maintaining production and optimal strategies for supplemental feeding during rangeland forage shortages. Nutritional balance software is available that allows users to input information on the quality of the forage the animals are grazing and receive information on what supplemental feed is needed for maintaining performance goals. One such software package is NUTBAL (http://cnrit.tamu.edu/), which models the crude protein and net energy status of cattle, sheep and goats. This computerized decision aide allows the user to enter the kind, class and breed of animal to be monitored, current body condition, current climate conditions, weight performance targets and forage quality information (crude protein and digestible organic matter). A nutritional balance is calculated and a report is provided describing the protein and net energy conditions for the animal. If a protein or energy deficiency exists, a least cost ration is calculated from a list of feeds or fodders available to the user.
Additional decision support tools for nutritional balancing include the Small Ruminant Nutrition System (http://nutritionmodels.tamu.edu/srns.htm) and the Langston University Nutrition Requirements for Goats calculator (http://www.luresext.edu/goats/research/ nutreqgoats.html). Both have been designed to address nutritional balances for sheep and goat nutrition.

Conducting national feed assessments190
16.7 dATA MANAgEMENT fOr A NATIONAl fEEd INvENTOry PrOgrAMMEFor a national feed inventory programme to be successfully implemented, data manage-ment and quality control infrastructure will be needed. The large amount of data that are generated as part of the inventory need to be stored in relational databases to ease data summary and availability. If remote sensing and/or simulation modelling are used, comput-ing systems capable of handling and storing this type of data, as well as possessing the capability to run the software efficiently, will be required. Since much of the data will be spatial in nature, a GIS that is integrated with the inventory database will ease analysis, reporting and map production. Finally, qualified personnel will be needed to maintain, enhance and troubleshoot the system in order for the system to be sustainable. The data management, GIS and personnel requirements that need to be considered for implement-ing a national feed inventory are described below.
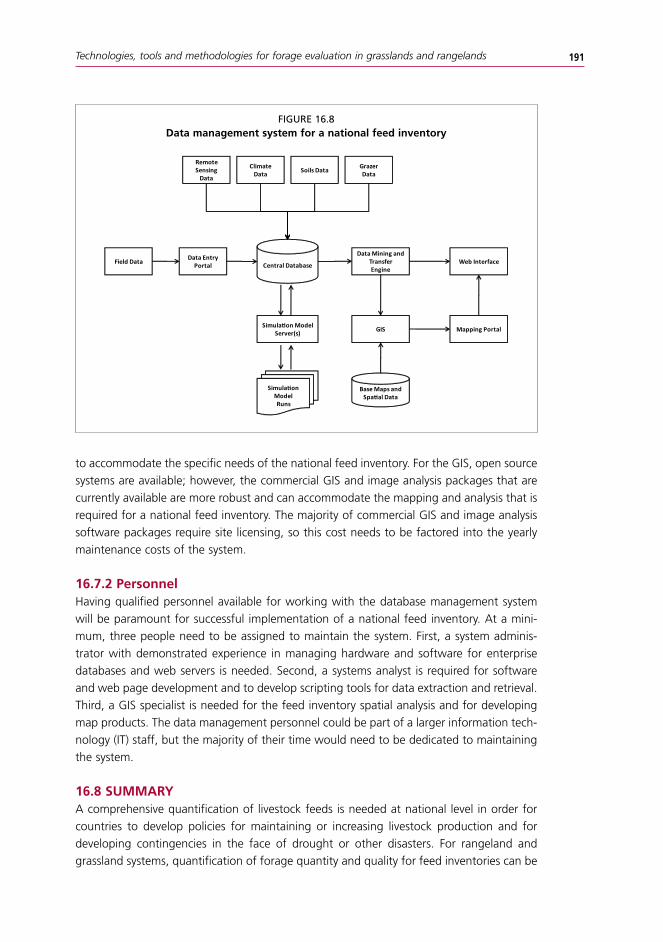
16.7.1 data management and infrastructureRegardless of methodology used to gather data on forage quantity and quality, a tremen-dous amount of data will need to be acquired and managed for a national feed inventory programme. Prior to implementation of the feed inventory, a data management plan will need to be developed that outlines how data will be collected, how and where it will be stored, and methods for data access. Once the data management plan is agreed on, the necessary infrastructure to support the data storage and analysis will need to be purchased and installed. Figure 16.8 provides a generalized structure of a data management system for a national feed inventory. The core of the system is a centralized database that stores data and allows easy retrieval. Field data are collected and entered into a data entry por-tal which ensures that all the required information is input into the central database in a standardized format. Remote-sensing, climate, soils and grazer information can be gath-ered from other sources and stored in the database. In the case of remote-sensing and climate data, these may be links to remote systems for near real-time data acquisition. If simulation modelling is used for the inventory, the centralized database can integrate the field data and data from other sources to provide inputs to the simulation model, and act as storage for the simulation model output. A data transfer and mining engine extracts data and transfers it to a web portal or a GIS. The web portal acts as the user interface for extracting reports or data from the feed inventory system. Linkages to the GIS allow map-ping and spatial analysis of data that can be displayed via a mapping portal or integrated into the web portal.
Equipment needed for this data management system includes disk arrays for the cen-tralized data storage and backup, web servers for the data entry and web portals, worksta-tions or server(s) for the GIS, server(s) for simulation modelling, and backup power supplies. Infrastructure includes a secure space to house the equipment that has adequate power and cooling. A high-speed internet connection is needed for efficient data download and web presence.
To reduce software costs, open source software such as PostgreSQL (http://www.post-gresql.org/) could be acquired for database management. For data entry, data transfer and mining engine, and web portal, software and web pages need to be designed and coded
191Technologies, tools and methodologies for forage evaluation in grasslands and rangelands
to accommodate the specific needs of the national feed inventory. For the GIS, open source systems are available; however, the commercial GIS and image analysis packages that are currently available are more robust and can accommodate the mapping and analysis that is required for a national feed inventory. The majority of commercial GIS and image analysis software packages require site licensing, so this cost needs to be factored into the yearly maintenance costs of the system.
16.7.2 Personnel Having qualified personnel available for working with the database management system will be paramount for successful implementation of a national feed inventory. At a mini-mum, three people need to be assigned to maintain the system. First, a system adminis-trator with demonstrated experience in managing hardware and software for enterprise databases and web servers is needed. Second, a systems analyst is required for software and web page development and to develop scripting tools for data extraction and retrieval. Third, a GIS specialist is needed for the feed inventory spatial analysis and for developing map products. The data management personnel could be part of a larger information tech-nology (IT) staff, but the majority of their time would need to be dedicated to maintaining the system.
16.8 SUMMAryA comprehensive quantification of livestock feeds is needed at national level in order for countries to develop policies for maintaining or increasing livestock production and for developing contingencies in the face of drought or other disasters. For rangeland and grassland systems, quantification of forage quantity and quality for feed inventories can be
Base Maps and Spa�al Data
Simula�on ModelServer(s)
GrazerDataSoils DataClimate
Data
Simula�onModelRuns
Data Mining and TransferEngine
Data Entry Portal Web Interface
GIS
Central Database
Mapping Portal
Remote Sensing
Data
Field Data
FIguRe 16.8data management system for a national feed inventory
Conducting national feed assessments192
a challenge because of the large land areas that grasslands/rangelands occupy, their remote locations and the diverse mix of livestock species that graze these lands.
For both forage quantity and quality assessment, a number of methods have been developed for measurement of these variables that vary in levels of accuracy, time spent in the field and logistical implementation. For forage quantity measurements, methods include direct measurements of vegetation, estimation with proxy variables, simulation modelling or combinations of these. For forage quality measurement, direct, indirect and estimation with proxy variable methods are available. Logistics, costs, timing of data col-lection and availability of qualified personnel all influence the choice of method for both forage quantity and quality assessment.
Direct field measurement techniques are the most accurate methods for assessing forage quality on rangelands. However, field techniques generally require a large amount of time and resources for data collection, especially if data collection is required for an entire country on a yearly basis. Field measurement methods for forage biomass include direct measure-ment techniques where biomass is sampled and weighed, estimation techniques where the biomass weight is estimated by the observer, or combinations of these methods. The most common direct measurement method for measuring forage biomass is the quadrat method where a series of quadrats of known area are clipped, later weighed, and the weights aver-aged to produce an estimate of forage biomass. Because of the time required for clipping a large number of quadrats, estimation techniques can be used to reduce the number of clipped samples and to reduce sampling time. Two popular methods are the weight unit method and the double sampling method. The weight unit method allows field personnel to visually estimate the majority of the quadrats based on predetermined weight units. The double sampling method combines quadrat clipping with an easily measured variable such as plant cover to develop a statistical equation to predict biomass in unclipped quadrats.
For a national feed inventory that relies on direct measurements or measurements using estimation techniques, a sampling plan needs to be developed that would allow the productivity of the region to be properly represented and provide a means for scaling the results to regional or national levels. GIS software and data layers such as soils, vegetation and roads can assist in stratifying regional and national land areas into representative sam-pling units. These areas can be delineated in the GIS and provide the means for aggregating to national levels.
Remote-sensing techniques for assessing forage biomass include empirical prediction models and process models that use remote-sensing inputs to predict biomass. Empirical models predict biomass amounts based on a statistical relationship between the biomass and the spectral bands (or combinations of these) from the remote-sensing imagery. Pro-cess models based on remote-sensing data generally involve using variables derived from remote-sensing imagery to drive a light use efficiency or similar process model to predict biomass. Regardless of whether empirical or process models are used with remote-sensing information to derive biomass, direct measurement data are generally needed to develop the statistical relationship or to validate the model outputs. Disadvantages of using remote-sens-ing techniques to predict forage quantity include problems with extrapolating the data to new areas and the inability of the models to predict biomass for specific grazing animals.
Simulation modelling offers unique capabilities for an assessment of forage quantity
193Technologies, tools and methodologies for forage evaluation in grasslands and rangelands
needed for a national feed inventory programme. Initially, simulation modelling can be time-consuming and expensive for efforts in parameterizing, calibrating and validating the simulation model. However, the capabilities that simulation modelling provides, such as near real-time monitoring, forecasting and exploration of alternatives, makes it an attrac-tive choice for a national feed inventory programme. Several different simulation models are available for estimation of forage biomass on rangelands and grasslands. The choice of model should be driven by the needs of the national feed inventory programme. The mod-els can be integrated with GIS software and other data for improving the spatial relevance of the data and/or extending the simulation model outputs. For a comprehensive analysis of forage biomass production in relation to other ecosystem processes and variables, ecosystem models can be used. The use of ecosystem models in a national feed inventory system provides the ability to holistically examine the processes of forage production and use by livestock and explore specific causes for feed deficits or surpluses. This information can then be used to assist in determining interventions or deciding where improvements can be made in forage production.
For assessments of forage quality, direct measurements generally involve animal obser-vation or the use of research animals that have esophageal or rumen fistulas. Animal obser-vation methods include hand plucking vegetation or bite counting. Both methods can be time-consuming and require the use of relatively tame animals for the field observations. The use of esophageal or rumen fistulated animals is generally accepted as one of the more accurate methods for obtaining forage quality estimates. For this method, research animals are surgically altered by cutting a hole in the esophagus or rumen. A plug is placed in the hole and removed when used for forage quality sampling. Vegetation that falls out of the esophagus or accumulates in the rumen is collected and sampled for quality. Disadvantages of using fistulated animals for forage quality assessment include the need to maintain a special herd of animals that require constant maintenance because of fistulation and the need for highly trained personnel to work with these animals. Because of these issues and the need to sample a large geographic space, the use of fistulated animals to conduct assessments of diet quality for a national feed inventory is generally not practical.
Indirect methods of determining forage quality generally involve examinations of live-stock faeces for indicators that can be correlated with the quality of the forage eaten by the grazing animal. Early work on indirect methods involved examination of the constituents of faeces such as faecal nitrogen and fiber components. More recently, the use of Near Infra-red Reflectance Spectroscopy (NIRS) scanning of livestock faeces has emerged as a reliable tool for assessing the quality of forage grazed by ruminants. The methodology for devel-oping faecal NIRS (FNIRS) scanning capabilities involves development of reference equations that statistically compare near infrared spectral characteristics of the livestock faeces with quality constituents (e.g. crude protein, digestibility, fiber) of the forage eaten by the live-stock. The diet quality information needed for equation development can be gathered from feeding trials using penned animals or from trials using fistulated animals and free-ranging livestock. Advantages of FNIRS are that it provides a rapid and reliable means of assessing the quality of forage the livestock animal is eating, and samples can be easily acquired without destructive harvesting. Disadvantages of FNIRS include the high up-front cost of the NIRS equipment, the need to develop feeding trials and equations that encompass the
Conducting national feed assessments194
range of forage types and qualities, and the need for independent validation of the FNIRS equations. For a national feed inventory, FNIRS may be the most practical choice to assess diet quality across a nation. However, the costs of equipment, training of personnel and logistics of gathering faecal samples to represent the region may be prohibitive.
Approaches for using remote-sensing data to estimate forage quality generally involve the development of statistical relationships between remote-sensing spectral band data and forage quality variables such as crude protein and forage digestibility. Several studies have examined these in relation to NDVI derived from remote-sensing imagery to represent vegetation greenness. Other methods include the use of interpolation techniques such as co-kriging that allow mapping of forage quality based on spatial correlations between for-age quality variables and remote-sensing data such as NDVI. The forage quality data are col-lected at representative locations throughout a region and co-kriging with NDVI data allows interpolation of the quality data so that landscape maps of forage quality can be produced.
Terrain factors such as slope and shrub/tree density along with distance to water can influence the availability of biomass for livestock grazing, but the degree to which these factors influence availability is dependent on the kind of livestock. Slopes greater than 45 percent are hard to access by most livestock so considerations should be made about the usability of vegetation in areas of steep slopes. Very rocky areas or areas of dense shrubs and trees can also limit the ability of cattle to graze the vegetation in these areas. However, sheep and goats can generally navigate these areas because of smaller body and hoof sizes.
Distance to water also influences the availability or usability of forage in a region. Cattle need water every day for efficient growth so they generally do not travel more than 3.2 km from water unless they are herded. Sheep and goats can graze at much longer distances from water sources because they do not need to water each day. For a feed inventory in areas with large distance between water sources, corrections may be needed to reduce forage allocations for some grazing livestock.
Since livestock production on grasslands and rangelands is a significant contribution to the overall GDP in many countries and is a component of the wealth and well-being of many people, especially pastoralists, the assessment of animal production as it is related to forage quantity and quality is important for monitoring at the national or regional level. The development of a national feed inventory for assessing forage biomass provides the opportunity to assess production capacity through an assessment of stocking rates. The inventory of forage quality information can be used improve livestock production and feed management through nutritional balancing. It can also be used to assess supplemental feed requirements for enhancing/maintaining production and optimal strategies for supplemen-tal feeding during rangeland forage shortages.
For a national feed inventory programme to be successfully implemented, data man-agement and quality control system infrastructure will be needed. A tremendous amount of data will need to be acquired, and therefore a data management plan will need to be developed at the inception of the programme that outlines how data will be collected, how and where it will be stored, and methods for data access. A centralized database system with a portal for entering field data and a web portal for data extraction and visualization provides usability and flexibility in the system. Linking the database to a GIS allows mapping and spatial analysis of data that can be displayed via a mapping portal or integrated into

195Technologies, tools and methodologies for forage evaluation in grasslands and rangelands
the web portal. Qualified IT personnel are needed to support the database management system and ensure that quality control is maintained.
16.9 rEfErENCESAl-bakri, J. T. & Taylor, J. C. 2003. Application of NOAA AVHRR for monitoring vegetation
conditions and biomass in Jordan. J. Arid Environ., 54(3): 579–593.
Allen, v. g. & Segarra, E. 2001. Anti-quality components in forage: Overview, significance, and
economic impact. J. Range Manag., 54(4): 409–412.
Angerer, J. P. 2008. Examination of high resolution rainfall products and satellite greenness
indices for estimating patch and landscape forage biomass. Texas A&M University, College
Station, Texas. USA.129 pp (PhD Thesis).
Asrar, g., fuchs, M., kanemasu, E. T. & hatfield, J. l. 1984. Estimating absorbed
photosynthetic radiation and leaf area index from spectral reflectance in wheat. Agron. J.,
76: 300–306.
Awuma, k. S., Stuth, J. w., kaitho, r. & Angerer, J. 2007. Application of normalized
differential Vegetation Index and geostatistical techniques in cattle diet quality mapping in
Ghana. Outlook Agric., 36(3): 205–213.
bolor-Erdene, l., Angerer J., granville-ross S., Urgamal M., Narangarel d., Tsogoo d.,
Stewart T. & Sheehy, d. 2008. Gobi Forage: An early warning system for livestock in the
Gobi region of Mongolia. In: Joint Meeting of the 21st International Grassland Congress and
the 8th International Rangeland Congress. Hohhot, China.
bonhan, C.d. 1989. Measurements for terrestrial vegetation. Wiley, New York, 338pboone, r.b. & wang, g. 2007. Cattle dynamics in African grazing systems under variable
climates. J. Arid Environ., 70(3): 495–513.
brown, J. r. & Thorpe, J. 2008. Climate change and rangelands: Responding rationally to
uncertainty. Rangelands, 30(3): 3–6.
bouraoui, f., wolfe, M.l., 1990. Application of hydrologic models to rangelands. J. Hydrol.
121, 173-191.
brown, M.E., Pinzon, J. E., didan, k., Morisette, J.T. & Tucker, C.J. 2006. Evaluation of the
consistency of long-term NDVI time series derived from AVHRR, SPOT-Vegetation, SeaWiFS,
MODIS, and Landsat ETM+ sensors. IEEE Trans. Geosci. Remote Sens., 44(7): 1787–1793.
Carlson d.h. &Thurow T.l. 1992. SPUR-91: Workbook and User Guide. Texas A&M University,
Department of Rangeland Ecology and Management in cooperation with USDA Soil
Conservation Service. College Station, TX Pub. No. MP-1743. pp. 259.
Catchpole, w.r. & wheeler, C.J. 1992. Estimating plant biomass: A review of techniques.
Australian J. Ecol., 17(2): 121–131.
Childress, w.M., Coldren, C. l. & Mclendon, T. 2002. Applying a complex, general ecosystem
model (EDYS) in large-scale land management. Ecol. Model., 153: 97–108.
Christensen, l., Coughenour, M. b., Ellis, J.E. & Chen, z.z. 2003. Sustainability of inner
Mongolian grasslands: Application of the Savanna model. J. Range Manag., 56(4): 319–327.
Coughenour, M.b. 1993. SAVANNA – A Spatial ecosystem model. Model description and user
guide. Natural Resources Ecology Laboratory, Colorado State University,Fort Collins, Colorado,
USA 64 pp. Available at www.nrel.colostate.edu/projects/savanna/.
Conducting national feed assessments196
Coughenour, M.b. 1999. Ecosystem modelling of the Pryor Mountain Wild Horse Range.
Report to USGS. Biological Resources Division, National Park Service, and Bureau of Land
Management. 55 pp. & 100 Figs. Available at www.nrel.colostate.edu/projects/savanna/.
Coughenour, M.b. 2002. Elk in the Rocky Mountain National Park Ecosystem – A model-based
assessment. Final report to USGS Biological Resources Division, Ft. Collins, Colorado and U.S.
National Park Service, Rocky Mountain National Park. 125 pp. 116 Figs. Available at www.
nrel.colostate.edu/projects/savanna/.
Coughenour, M.b. 2005. Spatial modelling of Yellowstone Bison and their environments. Final
Report to U.S. Geological Survey, Biological Resources Division, Bozeman, MT, USA. (Three-
part report. 93 pp. 100 figures & 73 tables. Available at www.nrel.colostate.edu/projects/
savanna/.
Cracknell, A.P. 2001. The exciting and totally unanticipated success of the AVHRR in applications
for which it was never intended. Adv. Space Res., 28(1): 233–240.
decruyenaere, v., buldgen, A. & Stilmant, d. 2009. Factors affecting intake by grazing
ruminants and related quantification methods: a review. Biotechnol. Agron. Soc. et Environ.,
13(4): 559–573.
devries, M.f.w. 1995. Estimating forage intake and quality in grazing cattle - a reconsideration
of the hand-plucking method. J.Range Manag., 48(4): 370–375.
dixon, r. & Coates, d. 2009. Review: Near infrared spectroscopy of faeces to evaluate the
nutrition and physiology of herbivores. J.Near Infrared Spectros., 17(1): 1–31.
dixon, r.M. & Coates, d.b. 2010. Diet quality estimated with faecal near infrared reflectance
spectroscopy and responses to N supplementation by cattle grazing buffel grass pastures.
Anim. Feed Sci. Technol., 158(3–4): 115–125.
dungan, J. 1998. Spatial prediction of vegetation quantities using ground and image data.
International J. Remote Sens., 19(2): 267–285.
Ellis, J.E. & Coughenour, M.b. 1998. The SAVANNA integrated modelling system: an
integrated remote sensing, GIS and spatial simulation modelling approach. In V. R. Squires &
A. E. Sidahmed, eds. Drylands: Sustainable use of rangelands into the twenty-first centurys.
IFAD Series Technical Report. pp. 97–106.
Espach, C., lubbe, l.g. & ganzin, N. 2009. Determining grazing capacity in Namibia with the
aid of remote sensing. African J. Range Forage Sci., 26(3): 133–138.
fales, S.l. & fritz, J.O. 2007. Factors affecting forage quality. In R. F. Barnes, D. A. Miller & C.
J. Nelson, eds. pp. 569–580. Forages, Volume 2: The Science of Grassland Agriculture. Ames,
Iowa. Blackwell Publishers, USA.
flanagan, d.C. & Nearing, M.A. 1995. WEPP technical documentation. National Soil Erosion
Research Lab, West Lafayette, Indiana, USA.
foody, g. M. 2003. Geographical weighting as a further refinement to regression modelling:
An example focused on the NDVI–rainfall relationship. Remote Sens. Environ., 88: 283–293.
foy, J.k., Teague, w.r. & hanson, J.d. 1999. Evaluation of the upgraded SPUR model
(SPUR2.4). Ecol. Modelling, 118(2–3): 149–165.
frank, A.b. & karn, J.f. 2003. Vegetation indices, CO2 flux, and biomass for Northern Plains
grasslands. J. Range Manag., 56(4): 382–387.
ganskopp, d. & bohnert, d. 2006. Do pasture-scale nutritional patterns affect cattle
distribution on rangelands? Rangeland Ecol. Manag., 59(2): 189–196.
197Technologies, tools and methodologies for forage evaluation in grasslands and rangelands
gitelson, A.A. 2004. Wide dynamic range vegetation index for remote quantification of
biophysical characteristics of vegetation. J. Plant Physiol., 161(2): 165–173.
glasser, T., landau, S., Ungar, E.d., Perevolotsky, A., dvash, l., Muklada, h., kababya,
d. & walker, J. w. 2008. A fecal near-infrared reflectance spectroscopy-aided methodology
to determine goat dietary composition in a Mediterranean shrubland. J. Anim. Sci., 86(6):
1345–1356.
gordon, I.J. 1995. Animal-based techniques for grazing ecology research. Small Rumin.,
Res.,16(3): 203–214.
hanson J.d., baker b.b. & bourdon r.M. 1992. SPUR2 documentation and user guide. GPSR
technical report No. 1. pp. 24. US Dept. of Agric. USA.
herrick, J., van zee, J., havstad, k., burkett, l. & whitford, w. 2005. Monitoring manual
for grassland, shrubland, and Savanna ecosystems, Vol II. Design, supplementary methods
and interpretation. USDA Jornada Experimental Range. University of Arizona Press, Tuscon
AZ, USA. pp. 236.
hirschfeld, d.J., kirby, d.r., Caton, J.S., Silcox, S.S. & Olson, k.C. 1996. Influence of grazing
management on intake and composition of cattle diets. J. Range Manag., 49(3): 257–263.
hohlt, J.C., lyons, r.k., hanselka, C.w. & Mckown, d. 2009. Estimating grazeable acreage
for cattle. Texas AgriLife Extension Service, College Station, TX. Texas AgriLife Extension
Publication B-6222, USA.
holecheck, J.l., vavra, M. & Pieper, r.d. 1982. Methods for determining the nutritive quality
of range ruminant diets: A review. J. Anim. Sci., 54(2): 363–376.
holechek, J., Pieper, r.d. & herbel, C.h. 2001. Range Management: Principles and Practices.
Prentice Hall, Upper Saddle River, N.J., USA.
holechek, J.l., vavra, M. & Arthun, d. 1982. Relationships between performance, intake,
diet nutritive quality and fecal nutritive quality of cattle on mountain range. J. Range Manag.,
35(6): 741–744.
huete, A., didan, k., Miura, T., rodriguez, E.P., gao, x. & ferreira, l.g. 2002. Overview of
the radiometric and biophysical performance of the MODIS vegetation indices. Remote Sens.
Environ., 83(1–2): 195–213.
hunt, E.r. & Miyake, b.A. 2006. Comparison of stocking rates from remote sensing and
geospatial data. Rangeland Ecol. Manag., 59(1): 11–18.
hurcom, S.J. & harrison, A.r. 1998. The NDVI and spectral decomposition for semi-arid
vegetation abundance estimation. Int. J. Remote Sens., 19(16): 3109–3125.
Isaaks, E.h. & Srivastava, r.M. 1989. Applied geostatistics. Oxford University Press, New York,
USA.
kawamura, k., Akiyama, T., yokota, h., Tsutsumi, M., yasuda, T., watanabe, O., wang,
g. & wang, S. 2005. Monitoring of forage conditions with MODIS imagery in the Xilingol
steppe, Inner Mongolia. Int. J. Remote Sens., 26(7): 1423–1436.
kiesling, h.E., Nelson, A.b. & herbel, C.h. 1969. Chemical composition of tobosa grass
collected by hand-plucking and esophageal-fistulated steers. J. Range Manag., 22(3):
155–159.
kiniry, J.r., Sanchez, h., greenwade, J., Seidensticker, E., bell, J.r., Pringle, f., Peacock,
g. & rives, J. 2002. Simulating grass productivity on diverse range sites in Texas. J. Soil Water
Conser., 57(3): 144–150.
Conducting national feed assessments198
kogan, f., Stark, r., gitleson, A., Jargalsaikhan, C., dugrajav, C. & Tsooj, S. 2004.
Derivation of pasture biomass in Mongolia from AVHRR-based vegetation health indices. Int.
J. Remote Sens., 25(14): 2889–2896.
langlands, J.P. 1974. Studies on the nutritive value of the diet selected by grazing sheep VII. A
note on hand plucking as a technique for estimating dietary composition. Anim. Sci., 19(02):
249–252.
leite, E.r. & Stuth, J.w. 1995. Fecal NIRS equations to assess diet quality of free-ranging goats.
Small Rumin. Res., 15(3): 223–230.
li, h., Tolleson, d., Stuth, J., bai, k., Mo, f. & kronberg, S. 2007. Faecal near infrared
reflectance spectroscopy to predict diet quality for sheep. Small Rumin. Res., 68(3): 263–268.
lyons, r.k. & Stuth, J.w. 1992. Fecal NIRS equations for predicting diet quality of free-ranging
cattle. J. Range Manag., 45(3): 238–244.
Mata, M., Clark, d. A., Edirisinghe, A., waugh, d., Minneé, E. & gherardi, S.g. 2007.
Predicting accurate paddock average pasture cover in Waikato dairy farms using satellite
images. Proc. 69th Annual NZ Grassland Assoc. Conf., 69: 23–28.
Mcdaniel, k.C. & Tiedeman, J.A. 1981. Sheep use on mountain winter range in New Mexico.
J. Range Manag., 34(2): 102–104.
Montieth, J.l. 1972. Solar radiation and productivity in tropical ecosystems. Appl. Ecol., 9:
747–766.
Montieth, J.l. 1977. Climate and efficiency of crop production in Britian. Philosophical Trans.
Royal Soc.London, Series B, 281: 277–294.
Ortega, I.M., Solterogardea, S., drawe, d. l. & bryant, f. C. 1997. Evaluating grazing
strategies for cattle: Nutrition of cattle and deer. J. Range Manag., 50(6): 631–637.
Owens, M.k., launchbaugh, k.l. & holloway, J.w. 1991. Pasture characteristics affecting
spatial distribution of utilization by cattle in mixed brush communities. J. Range Manag.,
44(2): 118–123.
Pfister, J.A., hansen, d. & Malechek, J.C. 1990. Surgical establishment and maintenance of
esophageal fistulae in small ruminants. Small Rumin. Res., 3(1): 47–56.
Pierson, f.b., Carlson, d. h. & Spaeth, k.E. 2001. A process-based hydrology submodel
dynamically linked to the plant component of the simulation of production and utilization on
rangelands SPUR model. Ecol. Modelling, 141(1–3): 241–260.
Plumb, g.E., white, P. J., Coughenour, M.b. & wallen, r.l. 2009. Carrying capacity,
migration, and dispersal in Yellowstone bison. Biol. Cons., 142(11): 2377–2387.
quirk, M.f. & Stuth, J.w. 1995. Preference-based algorithms for predicting herbivore diet
composition. Ann. Zootech., 44: 110.
reeves, M.C., winslow, J.C. & running, S.w. 2001. Mapping weekly rangeland vegetation
productivity using MODIS algorithms. J. Range Manag., 54: A90–A105.
rouse, J.w., haas, r. h., Schell, J.A. & deering, d.w. 1973. Monitoring vegetation systems in
the Great Plains with ERTS. In Proceedings of the third ERTS Symposium, Vol. 1, pp. 309–317
Washington DC, USA.
ryan, z. 2005. Establishment and evaluation of a livestock early warning system for Laikipia,
Kenya. Texas A&M University: College Station, Texas, USA (PhD Thesis).
Sannier, C.A.d., Taylor, J.C. & du Plessis, w. 2002. Real-time monitoring of vegetation
biomass with NOAA-AVHRR in Etosha National Park, Namibia, for fire risk assessment. Int. J.
Remote Sens., 23(1): 71–89.
199Technologies, tools and methodologies for forage evaluation in grasslands and rangelands
Sellers, P.J. 1985. Canopy reflectance, photosynthesis and transpiration. International J. Remote
Sens., 6: 1335–1372.
Showers, S.E., Tolleson, d.r., Stuth, J.w., kroll, J.C. & koerth, b.h. 2006. Predicting diet
quality of white-tailed deer via NIRS fecal profiling. Rangeland Ecol. Manag., 59(3): 300–307.
Squires, v. & Siebert, b. 1983. Botanical and chemical components of the diet and liveweight
change in cattle on semi-desert rangeland in central Australia. The Rangeland J., 5(1): 28–34.
Stuth, J.w., Angerer, J., kaitho, r., zander, k., Jama, A., heath C., bucher, J., hamilton,
w., Conner, r., & Inbody, d. 2003a. The Livestock Early Warning System (LEWS): Blending
technology and the human dimension to support grazing decisions. Arid Lands Newsletter,
University of Arizona, USA. Available at http://cals.arizona.edu/OALS/ALN/aln53/stuth.html.
Stuth, J.w., Angerer, J., kaitho, r., Jama, A. & Marambii, r. 2005. Livestock early warning
system for Africa rangelands. In V. K. Boken, A. P. Cracknell & R. L. Heathcote, eds. Monitoring
and predicting agricultural drought: A global study. Oxford University Press. New York, USA.
pp. 472.
Stuth, J.w., Schmitt, d., rowan, r.C., Angerer, J.P., & zander, k. 2003b. PHYGROW users
guide and technical documentation. Texas A&M University, USA.
Teague, w.r. & foy, J.k. 2002. Validation of SPUR2.4 rangeland simulation model using a cow-
calf field experiment. Agric. Syst., 74(2): 287–302.
Thoma, d.P., bailey, d.w., long, d.S., Nielsen, g.A., henry, M.P., breneman, M.C. &
Montagne, C. 2002. Short-term monitoring of rangeland forage conditions with AVHRR
imagery. J. Range Manag., 55(4): 383–389.
Thornton, P.k., burnSilver, S.b., boone, r.b. & galvin, k.A. 2006. Modelling the impacts of
group ranch subdivision on agro-pastoral households in Kajiado, Kenya. Agric. Syst., 87(3):
331–356.
Timmons, g.r., hewitt, d. g., deyoung, C. A., fulbright, T.E. & draeger, d.A. 2010. Does
supplemental feed increase selective foraging in a browsing ungulate? J. Wildlife Manag.,
74(5): 995–1002.
Tucker, C.J. 1979. Red and photographic infrared linear combinations for monitoring vegetation.
Remote Sens. Environ., 8(2): 127–150.
Tucker, C.J., Pinzon, J.E., brown, M.E., Slayback, d.A., Pak, E.w., Mahoney, r., vermote,
E. f. & El Saleous, N. 2005. An extended AVHRR 8-km NDVI dataset compatible with MODIS
and SPOT vegetation NDVI data. Int. J. Remote Sens., 26(20): 4485–4498.
Tucker, C.J., vanpraet, C., boerwinkel, E. & gaston, A. 1983. Satellite remote-sensing of
total dry-matter production in the Senegalese Sahel. Remote Sens. Environ., 13(6): 461–474.
USdA (United States department of Agriculture, Natural resources Conservation
Service). 2003. National Range and Pasture Handbook. U.S. Dept. of Agriculture, Natural
Resources Conservation Service, Grazing Lands Technology Institute. Fort Worth, Texas, USA.
van Soest, P.J. 1994. Nutritional Ecology of the Ruminant. Comstock Publication. Ithaca, New
York, USA.
weisberg, P.J., M.b. Coughenour, M.Nb. & bugmann, h. 2006. Modelling of large herbivore-
vegetation interactions in a landscape context. Chapter 12 In K. Danell, R. Bergstrom, P.
Duncan & J. Pastor, eds. Large Herbivore Ecology, Ecosystem Dynamics and Conservation.
Cambridge Univ. Press, Cambridge, UK.
Conducting national feed assessments200
white, I.A., hunt, l.P., Poppi, d.P. & Petty, S.r. 2010. Sampling requirements for predicting
cattle diet quality using faecal near-infrared reflectance spectroscopy (F.NIRS) in heterogeneous
tropical rangeland pastures. Rangeland J., 32(4): 435–441.
wight, J.r. & Skiles, J.w. 1987. SPUR: Simulation and production and utilization of rangelands.
Documentation and user’s guide. United States Department of Agriculture, Agricultural
Research Service, USA. pp. 372.
williams, J.r., Izaurralde, r.C. & Steglich, E.M. 2008. Agricultural policy/environmental
extender model: Theoretical documentation, Version 0604. Blackland Research and Extension
Center, Texas AgriLife Research, Texas A& M University Temple, Texas, USA.
wofford, h., holechek, J. l., galyean, M.l., wallace, J.d. & Cardenas, M. 1985. Evaluation
of fecal indices to predict cattle diet quality. J. Range Manag., 8(5): 450–454.
fAO ANIMAl PrOdUCTION ANd hEAlTh MANUAlS1. Small-scale poultry production, 2004 (e, F)2. good practices for the meat industry, 2006 (e, F, S, ar)3. Preparing for highly pathogenic avian influenza, 2006 (e, ar, Se, Fe, Me)3. Revised version, 2009 (e)4. Wild bird HPaI surveillance – a manual for sample collection from healthy,
sick and dead birds, 2006 (e, F, R, Id, ar, ba, Se, Ce,)5. Wild birds and avian influenza – an introduction to applied field research
and disease sampling techniques, 2007 (e, F, R, ar, Id, ba, S**)6. Compensation programs for the sanitary emergence of HPaI-H5N1 in latin american
and the Caribbean, 2008 (ee, Se)7. The aVe systems of geographic information for the assistance in the
epidemiological surveillance of the avian influenza, based on risk, 2009 (ee, Se)8. Preparation of african swine fever contingency plans, 2009 (e, F, R, Hy, Ka, Se)9. good practices for the feed industry – implementing the Codex alimentarius Code of
Practice on good animal feeding, 2009 (e, ar, C**, F**, S**, P**)10. epidemiología Participativa − Métodos para la recolección de acciones y datos orientados a la
inteligencia epidemiológica, 2011 (Se)11. good emergency Management Practices: The essentials, 2011 (e)12. Investigating the role of bats in emerging zoonosese – balancing ecology, conservation and public
health interests, 2011 (e)13. Rearing young ruminants on milk replacers and starter feeds, 2011 (e)14. Quality assurance for animal feed analysis laboratories, 2011 (e)15. Conducting national feed assessments, 2012 (e)
availability: September 2012
ar – arabic Multil – Multilingual C – Chinese * Out of printe – english ** In preparationF – French e e-publicationP – PortugueseR – RussianS – Spanish ba – banglaM – Mongolian Hy – armenianId – bahasa Ka – georgian
The FAO Animal Production and health Manuals are available through the authorized FaO Sales agents or directly from Sales and Marketing group, FaO, Viale delle Terme di Caracalla, 00153 Rome, Italy.
fAO ANIMAl hEAlTh MANUAlS1. Manual on the diagnosis of rinderpest, 1996 (e)2. Manual on bovine spongifom encephalophaty, 1998 (e)3. epidemiology, diagnosis and control of helminth parasites of swine, 1998 4. epidemiology, diagnosis and control of poultry parasites, 19985. Recognizing peste des petits ruminant – a field manual, 1999 (e, F)6. Manual on the preparation of national animal disease emergency preparedness plans, 1999 (e)7. Manual on the preparation of rinderpest contingency plans, 1999 (e)8. Manual on livestock disease surveillance and information systems, 1999 (e)9. Recognizing african swine fever – a field manual, 2000 (e, F)10. Manual on participatory epidemiology – method for the collection of action-oriented
epidemiological intelligence, 2000 (e)
Find more publications athttp://www.fao.org/ag/againfo/resources/en/publications.html
11. Manual on the preparation of african swine fever contigency plans, 2001 (e)12. Manual on procedures for disease eradication by stamping out, 2001 (e)13. Recognizing contagious bovine pleuropneumonia, 2001 (e, F)14. Preparation of contagious bovine pleuropneumonia contingency plans, 2002 (e, F)15. Preparation of Rift Valley fever contingency plans, 2002 (e, F)16. Preparation of foot-and-mouth disease contingency plans, 2002 (e)17. Recognizing Rift Valley fever, 2003 (e)