16 david sutton pictures phlebography
TRANSCRIPT

16PHLEBOGRAPHY
DAVID SUTTON

DAVID SUTTON PICTURES
DR. Muhammad Bin Zulfiqar PGR-FCPS III SIMS/SHL

• Fig. 16.1 Diagram of the deep and superficial veins of the lower limb. (Copyright Eastman Kodak Co. Reprinted by courtesy of the Health Sciences Division, Eastman Kodak Co.)

• Fig. 16.1 Diagram of the deep and superficial veins of the lower limb. (Copyright Eastman Kodak Co. Reprinted by courtesy of the Health Sciences Division, Eastman Kodak Co.)

• Fig. 16.2 (A,B) Normal ascending phlebogram of the deep veins.

• Fig. 16.3 Incompetent perforating veins in the calf (arrows).

• Fig. 16.4 Incompetent perforating veins in the thigh.

• Fig. 16.5 Descending phlebogram showing incompetent valves and reflux down to the popliteal vein.


• Fig. 16.8 (A,B) Extensive clot in the femoral vein adherent in part.

• Fig. 16.9 (A,B) Extensive clot in the femoral vein.

• Fig. 16.10 The four types of recurrence in the thigh are shown diagrammatically. More than one type may apply in a given patient. (Reproduced from Starnes et al (1984), with permission.)

• Fig. 16.11 DSA. (A) Normal left iliac veins, shown by catheter from right iliac both sides shown by injection from right side. (B) Venous drainage and connections of the IVC. A = superior vena cava; B = inferior vena cava; C = hepatic veins; D = renal veins; E = iliac veins; F = ascending lumbar veins; G = vertebral venous plexus; H = hemiazygos vein; I = ascending hemiazygos vein; J = azygos vein.

• Fig. 16.12 (A) Left-sided IVC as a chance finding in a patient undergoing renal vein catheterisation. (B). The catheter has passed over to the right renal vein through the left IVC where it joins the left renal vein; the upper part of the IVC is normally sited. (C) Double inferior vena cava. A Mobin-Uddin umbrella (arrows) has been inserted in the normal right-sided IVC. The postoperative phlebogram shows an unsuspected double IVC with the right side now occluded. which

• Fig. 16.12 (A) Left-sided IVC as a chance finding in a patient undergoing renal vein catheterisation. (B). The catheter has passed over to the right renal vein through the left IVC where it joins the left renal vein; the upper part of the IVC is normally sited. (C) Double inferior vena cava. A Mobin-Uddin umbrella (arrows) has been inserted in the normal right-sided IVC. The postoperative phlebogram shows an unsuspected double IVC with the right side now occluded. which

• Fig. 16.13 Two-phase MRA. Normal iliac veins with duplication of IVC.

• Fig. 16.14 (A) Recent clot obstructing the left common iliac and partially obstructing the lower IVC. (B) Thrombosis of the IVC and common iliacs with collateral circulation. There is some irregular recanalisation of the common iliacs.

• Fig. 16.15 (A,B) Thrombosis of the IVC and common iliacs. Collateral drainage from the right leg via internal iliacs and haemorrhoidal plexus e- inferior mesenteric vein ~- portal vein. (C) Same patient. Collateral drainage from the left leg mainly via ascending lumbar veins and vertebral venous plexus

• Fig. 16.15 (A,B) Thrombosis of the IVC and common iliacs. Collateral drainage from the right leg via internal iliacs and haemorrhoidal plexus e- inferior mesenteric vein ~- portal vein. (C) Same patient. Collateral drainage from the left leg mainly via ascending lumbar veins and vertebral venous plexus

• Fig. 16.16 (A) Thrombosis of left iliac veins with partial recanalisation and drainage of the left leg mainly by collaterals to the right iliacs via pubic veins. (B) Thrombosis of the IVC with recanalisation and collateral circulation.

• Fig. 16.17 (A) Obstruction of the left common iliac vein by pressure from the right common iliac artery (arrow). Note collateral circulation via the ascending lumbar vein. (B) Iliac vein obstruction by a glandular mass. (C) Obstruction of the left iliac veins in a patient with carcinoma of the cervix treated by radiotherapy.

• Fig. 16.17 (A) Obstruction of the left common iliac vein by pressure from the right common iliac artery (arrow). Note collateral circulation via the ascending lumbar vein. (B) Iliac vein obstruction by a glandular mass. (C) Obstruction of the left iliac veins in a patient with carcinoma of the cervix treated by radiotherapy.

• Fig. 16.18 (A) Invasion of the IVC by hypernephroma spreading up the right renal vein. (B) Tumour envasion (arrow) of right common iliac vein from giant cell tumour of the sacrum. (C,D) CT scans of lesion.

• Fig. 16.18 (A) Invasion of the IVC by hypernephroma spreading up the right renal vein. (B) Tumour envasion (arrow) of right common iliac vein from giant cell tumour of the sacrum. (C,D) CT scans of lesion.

• Fig. 16.19 (A) DSA. Normal suprarenal IVC. (B) Obstruction of hepatic veins with compression and distortion of the upper IVC by liver neoplasm resulting in Budd-Chiari syndrome. The patient was performing the Valsalva manoeuvre. Note reflux filling of the renal veins, but not the hepatic veins. (C) Another patient with Budd-Chiari syndrome and thrombosed hepatic veins.

• Fig. 16.19 (A) DSA. Normal suprarenal IVC. (B) Obstruction of hepatic veins with compression and distortion of the upper IVC by liver neoplasm resulting in Budd-Chiari syndrome. The patient was performing the Valsalva manoeuvre. Note reflux filling of the renal veins, but not the hepatic veins. (C) Another patient with Budd-Chiari syndrome and thrombosed hepatic veins.

• Fig. 16.20 DSA. (A) Normal right hepatic vein catheterized from femoral vein. (B) Occluded right hepatic vein with typical spider's web appearance. (C) Thrombosis in left hepatic vein. B and C are from same patient as in Fig. 16.19C.

• Fig. 16.21 Selective right renal (A) and left renal (B) vein phlebograms. (C) Circumaortic ring formed by renal veins. A = aorta; IVC = inferior vena cava.
• PHLEBOGRAPHY

• Fig. 16.22 Venous drainage of the arm. A = median basilar vein; B = median cephalic vein; C = cephalic vein; D = basilic vein; E = axillary vein; F = subdavian vein; G = superior vena cava; H = azygos vein; L = internal jugular vein; J = external jugular vein; K = innominate vein; L = hemiazygos vein.
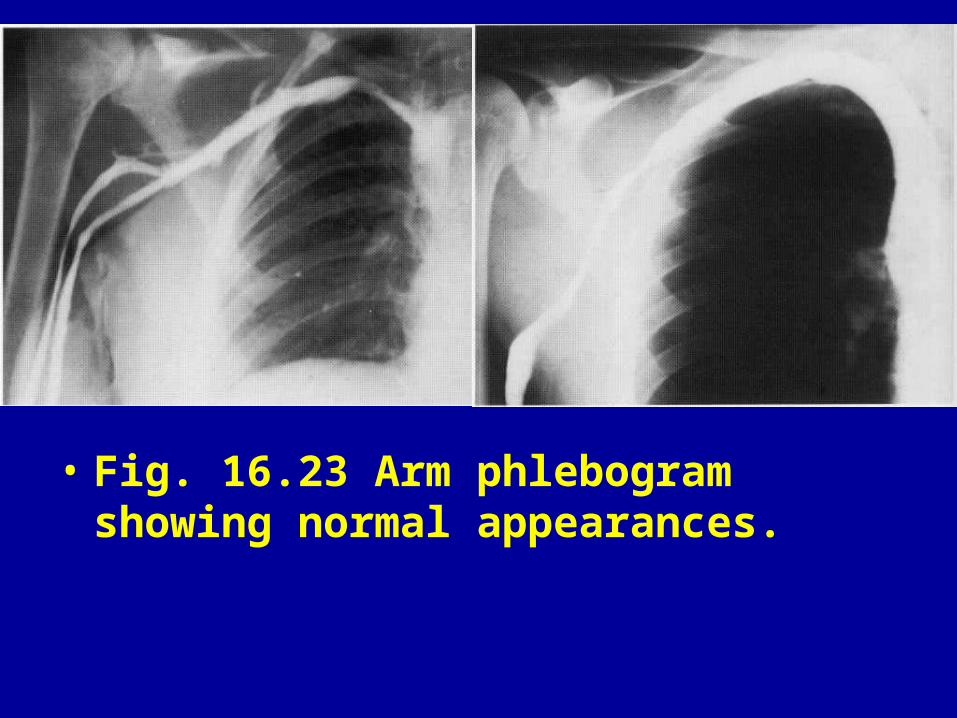
• Fig. 16.23 Arm phlebogram showing normal appearances.

• Fig. 16.24 Double SVC. A catheter has been passed from the right arm for pulmonary angiography. Instead of entering the ventricle it has passed through the dilated coronary sinus and into the left SVC draining into it, as evident on contrast injection. Note the widened mediastinum.

• Fig. 16.25 (A) Right arm phlebogram confirms malignant occlusion of the innominate and SVC with reflux up the right internal jugular, and vertebral collaterals. (B) Occlusion of the SVC and innominate, and termination of the right subdavian vein. Collaterals are seen to the vertebral plexus.

• Fig. 16.25 (A) Right arm phlebogram confirms malignant occlusion of the innominate and SVC with reflux up the right internal jugular, and vertebral collaterals. (B) Occlusion of the SVC and innominate, and termination of the right subdavian vein. Collaterals are seen to the vertebral plexus.
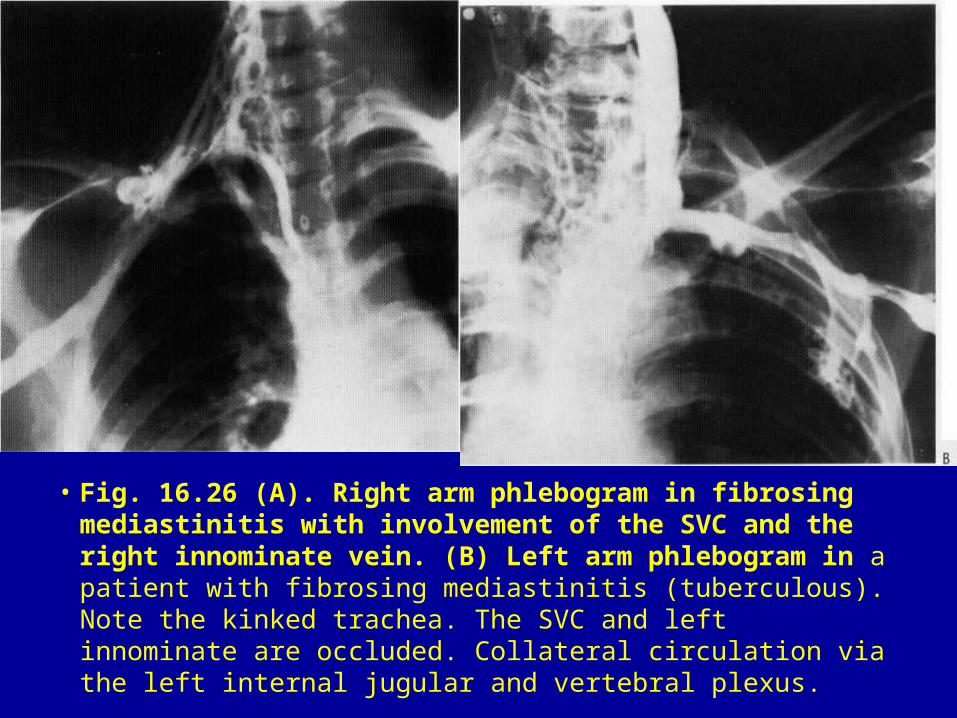
• Fig. 16.26 (A). Right arm phlebogram in fibrosing mediastinitis with involvement of the SVC and the right innominate vein. (B) Left arm phlebogram in a patient with fibrosing mediastinitis (tuberculous). Note the kinked trachea. The SVC and left innominate are occluded. Collateral circulation via the left internal jugular and vertebral plexus.

• Fig. 16.27 (A,B) Klippel-Trenaunay syndrome involving the left arm. Drainage is via a single medial vein which appears valveless with very sluggish flow.

• Fig. 16.28 (A) Portal circulation. A = portal vein;, B = splenic vein; C=superior mesenteric vein; D = inferior mesenteric vein; E = left gastric vein; F = gastroepiploic vein; G = oesophageal vein. (B) Spiral CT reconstruction showing a patent portal vein. (Courtesy of Dr A. AI-Kutoubi.)


• Fig. 16.30 Arterioportography subtraction film. Venous phase of selective splenic angiogram. The portal vein is compressed by a mass of malignant glands. The spleen is grossly enlarged. SV = splenic vein; L = liver; S = spleen. (Courtesy of Dr Janet Murfitt.)

• Fig. 16.31 DSA. (A) Gastro-oesophageal varices and patent left umbilical vein containing some thrombus filling from left portal vein. (B) Gastric varices and patent inferior mesenteric vein filling from splenic vein.

• Fig. 16.32 * (A) Transhepatic portal phlebogram showing the main portal vein and mesenteric tributaries. (Courtesy of Dr Janet Murfitt.) (B) Gastric and oesophageal varices demonstrated by transhepatic portal vein catheterisation.

• Fig. 16.33 Normal compression of the left common femoral vein. The vein is seen in the left image on the left side of the artery. On compression the vein lumen disappears and only the vein walls are visible.

• Fig. 16.34 (A) Predominantly hypoechoic thrombus expanding the common femoral vein. (B) A transverse view showing the thrombus occupying most of the vein lumen, with only a small amount of flow around the periphery.

• Fig. 16.35 (A) A tail of fresh thrombus extending up a superficial femoral vein. (B) The same thrombus on power Doppler.

• Fig. 16.36 Moderately echogenic thrombus in a superficial femoral vein. A small amount of blood flow is seen posteriorly.

• Fig. 16.37 Longitudinal view of the popliteal vein with a popliteal cyst immediately deep to the vessel.

• Fig. 16.38 Echogenic thrombus in a long saphenous vein.

• Fig. 16.39 Transverse view of the superficial femoral vessels. The artery is seen in the middle with a patent vein on the left but a thrombosed vein lying inferiorly.

• Fig. 16.40 (A) The left saphenofemoral junction in a patient with recurrent varicose veins. The upper long saphenous vein is replaced by multiple irregular channels, compatible with recanalisation after surgery. The colour Doppler image (B) shows abnormal flow patterns.

• Fig. 16.41 (A) The saphenofemoral junction on colour Doppler showing flow upwards (orange), followed by (B) reflux downwards (blue).

• Fig. 16.42 Colour and spectral Doppler trace showing significant reflux of approximately 3 second.

• Fig. 16.43 Acute thrombosis (arrow) within the IVC and left iliac veins on (A) coronal and (B) transverse T,-weighted spin-echo images (SE 560/25).

• Fig. 16.44 Thrombotic obstruction of the IVC and common iliac veins in a 64-year-old woman with contrast outlining a collateral venous circulation, on a 3D CE-PIRA study using the left pedal vein as the injection site. Note the normal hepatic vein (arrow) draining into a patent portion of the IVC adjacent to the right atrium. Contrast is seen in the abdominal aorta.

• Fig. 16.45 Coronal plane maximum intensity projection (MIP) of a 2D phase-contrast MRA showing normal hepatic veins (short arrows). P = portal vein; s = splenic vein; a = aorta; arrowhead = superior mesenteric artery.
