16 15 17 13 london borough of harrow 12
TRANSCRIPT

35
1716
2728
15
12
9
5
8
17
27
31
19
7
13
6 6
3
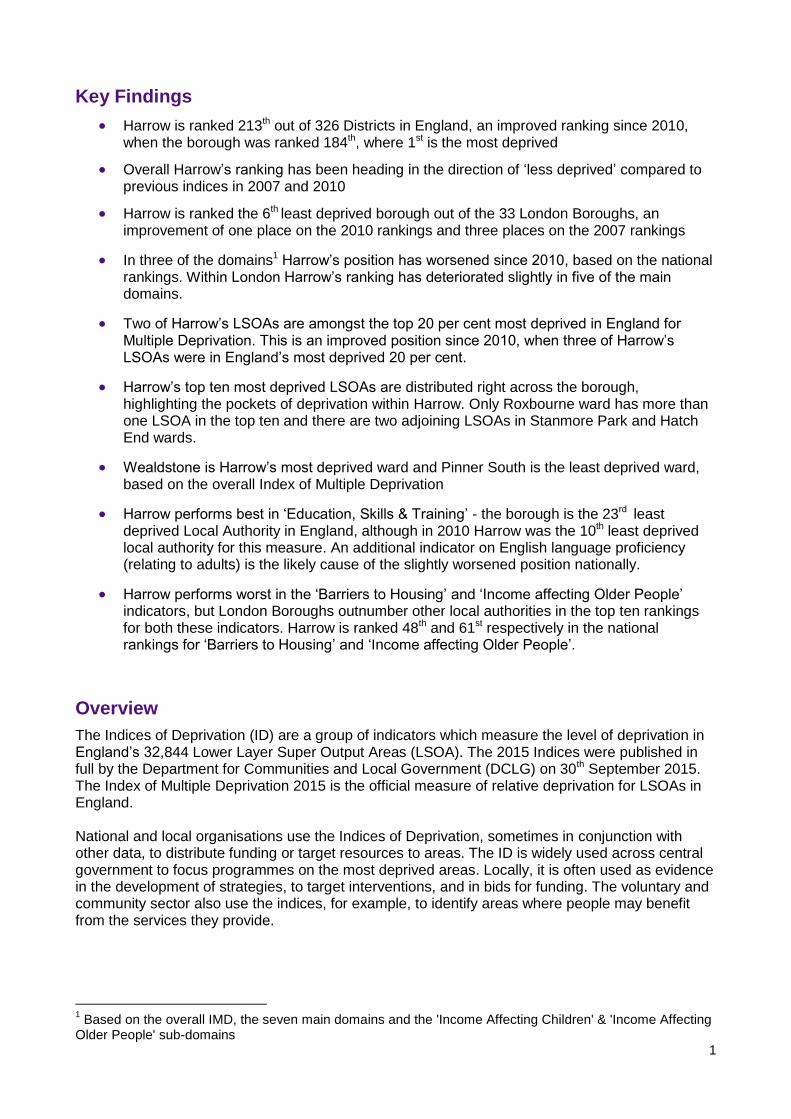
1 2 3 4 5 6 7 8 9 10
DecileMore deprived Less deprivedMore deprived Less deprived
London Borough of Harrow
2015 Indices of Deprivation
Harrow Summary
December 2015
1
Key Findings
Harrow is ranked 213th out of 326 Districts in England, an improved ranking since 2010, when the borough was ranked 184th, where 1st is the most deprived
Overall Harrow’s ranking has been heading in the direction of ‘less deprived’ compared to previous indices in 2007 and 2010
Harrow is ranked the 6th
least deprived borough out of the 33 London Boroughs, an improvement of one place on the 2010 rankings and three places on the 2007 rankings
In three of the domains1 Harrow’s position has worsened since 2010, based on the national rankings. Within London Harrow’s ranking has deteriorated slightly in five of the main domains.
Two of Harrow’s LSOAs are amongst the top 20 per cent most deprived in England for Multiple Deprivation. This is an improved position since 2010, when three of Harrow’s LSOAs were in England’s most deprived 20 per cent.
Harrow’s top ten most deprived LSOAs are distributed right across the borough, highlighting the pockets of deprivation within Harrow. Only Roxbourne ward has more than one LSOA in the top ten and there are two adjoining LSOAs in Stanmore Park and Hatch End wards.
Wealdstone is Harrow’s most deprived ward and Pinner South is the least deprived ward, based on the overall Index of Multiple Deprivation
Harrow performs best in ‘Education, Skills & Training’ - the borough is the 23rd
least deprived Local Authority in England, although in 2010 Harrow was the 10th least deprived local authority for this measure. An additional indicator on English language proficiency (relating to adults) is the likely cause of the slightly worsened position nationally.
Harrow performs worst in the ‘Barriers to Housing’ and ‘Income affecting Older People’ indicators, but London Boroughs outnumber other local authorities in the top ten rankings for both these indicators. Harrow is ranked 48th and 61st respectively in the national rankings for ‘Barriers to Housing’ and ‘Income affecting Older People’.
Overview
The Indices of Deprivation (ID) are a group of indicators which measure the level of deprivation in England’s 32,844 Lower Layer Super Output Areas (LSOA). The 2015 Indices were published in full by the Department for Communities and Local Government (DCLG) on 30th September 2015. The Index of Multiple Deprivation 2015 is the official measure of relative deprivation for LSOAs in England. National and local organisations use the Indices of Deprivation, sometimes in conjunction with other data, to distribute funding or target resources to areas. The ID is widely used across central government to focus programmes on the most deprived areas. Locally, it is often used as evidence in the development of strategies, to target interventions, and in bids for funding. The voluntary and community sector also use the indices, for example, to identify areas where people may benefit from the services they provide.
1 Based on the overall IMD, the seven main domains and the 'Income Affecting Children' & 'Income Affecting
Older People' sub-domains

2
Contents
Key Findings ......................................................................................................... 1
Overview ............................................................................................................... 1
Contents ............................................................................................................... 2
Introduction ........................................................................................................... 3
Indices of Deprivation .............................................................................. 3 District Level Summaries ......................................................................... 3 Data Sources ........................................................................................... 4 Lower Layer Super Output Areas ............................................................. 5 Wards ....................................................................................................... 5 Comparisons with the 2010 Indices of Deprivation .................................. 5 About the Data ......................................................................................... 6
Deprivation in Harrow: Maps, Charts and Analysis Multiple Deprivation ................................................................................. 7 Income .................................................................................................... 11 Income Affecting Children (IDACI) Sub-Domain ................................. 14 Income Affecting Older People (IDAOPI) Sub-Domain ....................... 17 Employment ............................................................................................ 20 Health and Disability ............................................................................... 23 Education, Skills and Training ................................................................. 26 Adult Skills Sub-Domain ...................................................................... 29 Children & Young People Sub-Domain ............................................... 32 Living Environment .................................................................................. 35 ‘Indoors’ Living Sub-Domain ............................................................... 39 ‘Outdoors’ Living Sub-Domain ............................................................. 42 Barriers to Housing and Services ............................................................. 45 Geographical Barriers Sub-Domain .................................................... 48 Wider Barriers Sub-Domain ................................................................ 51 Crime ...................................................................................................... 54
National Deprivation Rankings ............................................................................. 57
London Deprivation Rankings ............................................................................... 58
Outer London Deprivation Rankings ..................................................................... 60
Summary .............................................................................................................. 61
Further Information ............................................................................................... 63
Appendix A: 2015 ID Data Sources ...................................................................... 64
Appendix B: Higher Area Summary Measures ..................................................... 65
Appendix C: Ward & LSOA Map ........................................................................... 66
3
Introduction
Introduction
Indices of Deprivation
The 2015 English Indices of Deprivation, released by the Department for Communities and Local Government (DCLG) on 30th September 2015, update the 2010 Indices of Deprivation. Most of the indicators used in the 2015 Indices relate to the tax year 2012/13. The Deprivation Indices measure relative levels of deprivation at the Lower Super Output Area (LSOA) level.
The Indices of Deprivation 2015 are comprised of: the Index of Multiple Deprivation; seven main domain indices; supplementary indices; together with higher level Local Authority District summaries. The seven main domains each measure a different aspect of deprivation. Each of these domains is comprised of a basket of indicators, with 37 indicators in total (detailed in Appendix A). The Index of Multiple Deprivation (IMD) is a weighted average of the seven domains2 and provides an overall picture of deprivation. The IMD is regarded as the official measure of relative deprivation for small areas in England. Deprivation is assessed at Lower Super Output Area (LSOA) level. Each LSOA has a deprivation score and is ranked nationally based on that score, with 1 being the most deprived area and 32,844 being the least deprived area. An area has a lower ranking and lower deprivation score than another if the proportion of people living there who are classed as deprived is higher. An area itself is not deprived: it is the circumstances and lifestyles of the people living there that affect its deprivation score. It is important to remember that not everyone living in a deprived area is deprived – and that not all deprived people live in deprived areas. The ID does not measure affluence, so an area ranked amongst the least deprived may not necessarily be the most affluent. The seven main domains are:
Income Deprivation (22.5%)
Employment Deprivation (22.5%)
Education, Skills and Training Deprivation (13.5%)
Health Deprivation and Disability (13.5%)
Crime (9.3%)
Barriers to Housing and Services (9.3%)
Living Environment Deprivation (9.3%) The figures in brackets are the weights which are used to produce the overall IMD. District Level Summaries
At the local authority level the ID can be summarised in a range of ways to describe relative deprivation among local authorities. Each of these will lead to a different ranking of local authorities. Summary measures for local authorities look at different aspects, such as how the borough does on average; the extent to which people are most affected by deprivation; or how bad the deprivation is in the worst parts. No single summary measure is the ‘best’ measure as each highlights different aspects of deprivation, and leads to a different ranking of areas. For simplicity, this report generally focuses on just one of the measures in describing deprivation - the Average Rank measure.
2 The 'Income Affecting Older People' and 'Income Affecting Children' domains are sub-sets of the Income domain

4
Introduction
The Average Rank measure summarises the average level of deprivation across the higher level local authority area, based on the ranks of the LSOAs in the area. Summary Measures for Harrow, 2010 & 2015 Source: CLG, Indices of Deprivation 2010 & 2015, Crown Copyright
Higher Level Geography
Summary Measures
Harrow's LA District Rank
2015
Harrow's LA District Rank
2010
Average rank 213 184
Average score 219 194
Proportion of LSOAs in the
most deprived 10% nationally200* 200*
Extent 235 212
Local concentration 233 210
Income scale 86 71
Employment scale 103 103 * LAs with no LSOAs in the 10% most deprived nationally receive a score of zero, and a joint rank of 200
All of the above summary measures show that Harrow’s national ranking has improved on all the measures since the 2010 ID. Harrow’s rankings are fairly similar for all the different measures, which are summarised below:
‘Average rank’ and ‘average scores’ identify the average level of deprivation in an area, taking account of all the LSOAs in the area
‘Extent’ is a summary of the degree to which the local authority is highly deprived. It is a weighted sum of the population living in the most deprived 30 per cent of areas
‘Local concentration’ identifies LAs with extreme levels of deprivation, by comparing the most deprived LSOAs locally against those in other areas nationally
The income and employment scales record the number of people in a LA who are employment or income deprived. If two districts have the same percentage of income or employment deprived people, the authority with the larger number of deprived people will be ranked as more deprived on this measure because more people are experiencing the deprivation.
See Appendix B for further details on the higher area summary measures. Data Sources
The Indices of Deprivation 2015 uses census data only when alternative data from administrative sources is not available. Four such indicators were derived from the 2011 Census: adult skill levels and English language proficiency in the Education, Skills and Training Deprivation Domain; household overcrowding in the Barriers to Housing and Services Domain; and houses without central heating in the Living Environment Deprivation Domain.
For a full list of sources and dates for each of the domains see Appendix A.

5
Introduction
Lower Layer Super Output Areas
Lower Layer Super Output Areas (LSOAs) are the smallest geography for which ID data are produced. Harrow has 137 LSOAs equating to six or seven per ward and nationally there are now 32,844 LSOAs. In 2010 there were 32,428 LSOAs nationally, but population changes in the 2011 Census led to the overall change in the number of LSOAs, as LSOAs were designed to be of a similar population size with approximately 1,500 people in each LSOA. Nationally some new LSOAs have been created through the splitting of existing LSOAs and some boundaries have been changed to improve homogeneity. Only one of Harrow’s LSOA boundaries (in Rayners Lane ward) was changed as a result of the 2011 Census, but this was only due to a minor realignment, so all of Harrow’s LSOAs are actually directly comparable over time. However, with over 400 new LSOAs in England comparison of ranking changes in numerical terms over the last two Indices of Deprivation isn’t strictly possible, so a better measure is to compare areas according to which deciles or quintiles that they are recorded in based on the national rankings. Wards
The Indices of Deprivation 2015 (ID) are produced at LSOA level, as per the ID 2010. Summary measures are available for: Local Authority Districts; upper-tier local authorities; Local Enterprise Partnerships; and Clinical Commissioning Groups.
Ward level data is not produced as part of the standard outputs. However, DCLG has produced guidance on how to aggregate the information to different geographies using the LSOA average score summary measure, weighted by the LSOA population size. This methodology has been followed in producing the ward level summaries in this report (wherever possible). For further information see Appendix A of the DCLG Research Report on the ID 2015. Comparisons with the 2010 Indices of Deprivation
Previous Harrow reports on the 2010 Indices of Deprivation (including the Harrow Vitality Profiles reports) are generally based on the local authority boundaries in force prior to the restructuring on 1 April 2009, when there were 354 local authorities in England.
This report differs from the previous reports, as it is based on the local authority boundaries in force as at 1 April 2009, when the number of local authorities in England was reduced to 326. Therefore comparisons have generally only been made with the 2010 ID in this paper.
There have been a small number of changes made to some of the indicators since the ID 2010, which means that direct comparability in some areas is not strictly possible. Most notably the main changes include: the broadening of the indicator on housing affordability (as described under the Housing and Services domain); a new indicator on claimants of Carer’s Allowance (see under Employment Deprivation); and the inclusion of data on English language proficiency (see under Education, Skills and Training).
As previously mentioned, there have also been changes to the number of LSOAs nationally, but not within Harrow. Changes in deprivation levels over time are relative to other areas. If a rank remains unchanged between the 2010 and 2015 ID, this may not mean that there have been no changes to the level of deprivation in that area.

6
Introduction
About the Data
All neighbourhoods (LSOAs) in England are ranked between 1 and 32,844, with ‘1’ the most deprived nationally, so the lower the ranking, the higher the level of deprivation. It is important to note that these statistics are a measure of relative deprivation, not affluence, and to recognise that not every person living in a deprived area will themselves be deprived. Likewise, there will be some deprived people living in the least deprived areas. National rankings have only been produced at local authority level for the overall IMD, the seven main domains (detailed on Page 3) and the Income affecting Children (IDACI) and Income affecting Older People (IDAOPI) sub-sets of the Income domain.

7
Multiple Deprivation
Multiple Deprivation
Harrow is ranked 213th out of 326 Districts in England, an improved ranking since 2010, when the borough was ranked 184th, where 1st is the most deprived
Overall Harrow’s rankings have improved showing that the borough has become relatively less deprived since previous indices in 2007 and 2010
Most multiple deprivation is in the centre of the borough, with pockets of deprivation in the south and east
Harrow’s least deprived areas are found in the west of the borough
National & London Rank 213/326 England 28/33 London
8
Multiple Deprivation
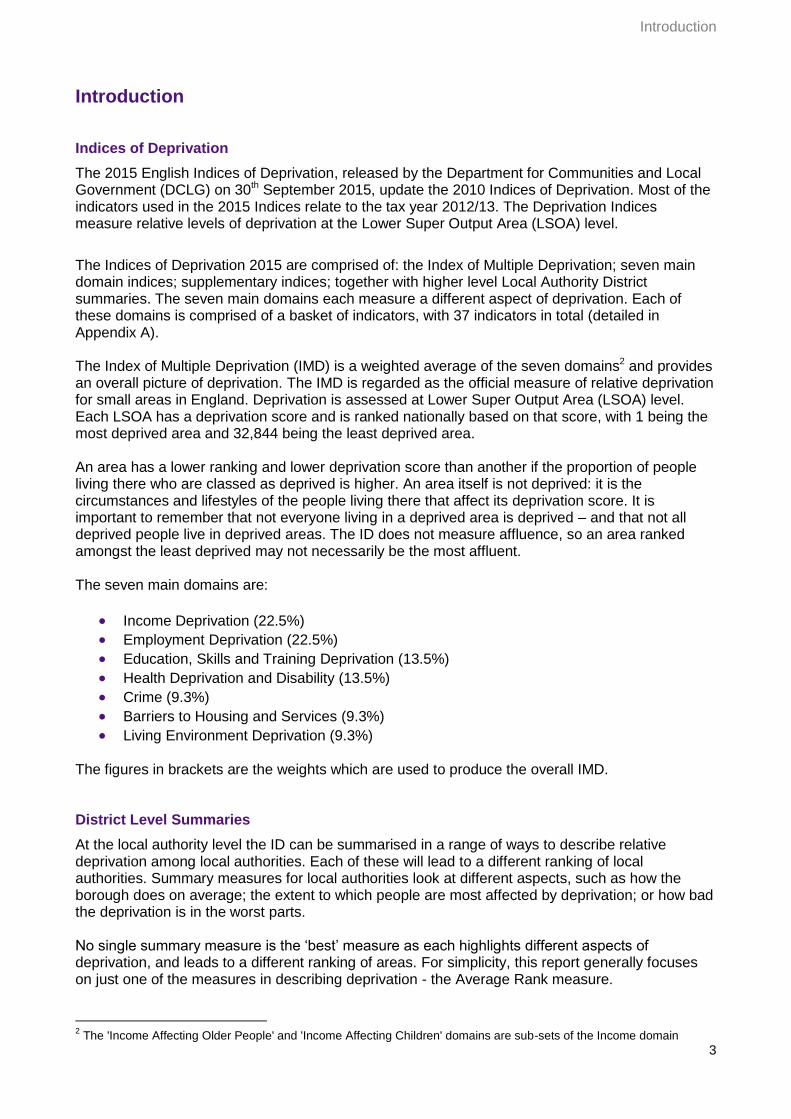
Harrow's top ten ranked LSOAs for Multiple Deprivation Source: CLG, Indices of Deprivation 2015, Crown Copyright
LSOA Ward National
Rank 2015 National
Rank 2010 Rank
Change
Rank & Location on
Map
E01002217 Roxbourne 5,370 3,879
1
E01002227 Stanmore Park 5,441 4,968
2
E01002151 Hatch End 6,680 5,944
3
E01002139 Harrow Weald 7,164 6,722
4
E01002235 Wealdstone 7,188 7,904
5
E01002120 Edgware 8,019 7,662
6
E01002133 Harrow on the Hill
8,053 8,169
7
E01002185 Pinner 9,188 6,807
8
E01002215 Roxbourne 9,523 10,972
9
E01002130 Greenhill 9,742 10,124
10
Note: Green arrows indicate improved rankings in 2015. Red arrows show lower rankings in 2015, indicating an increased level of deprivation relative to other areas.
9
Multiple Deprivation
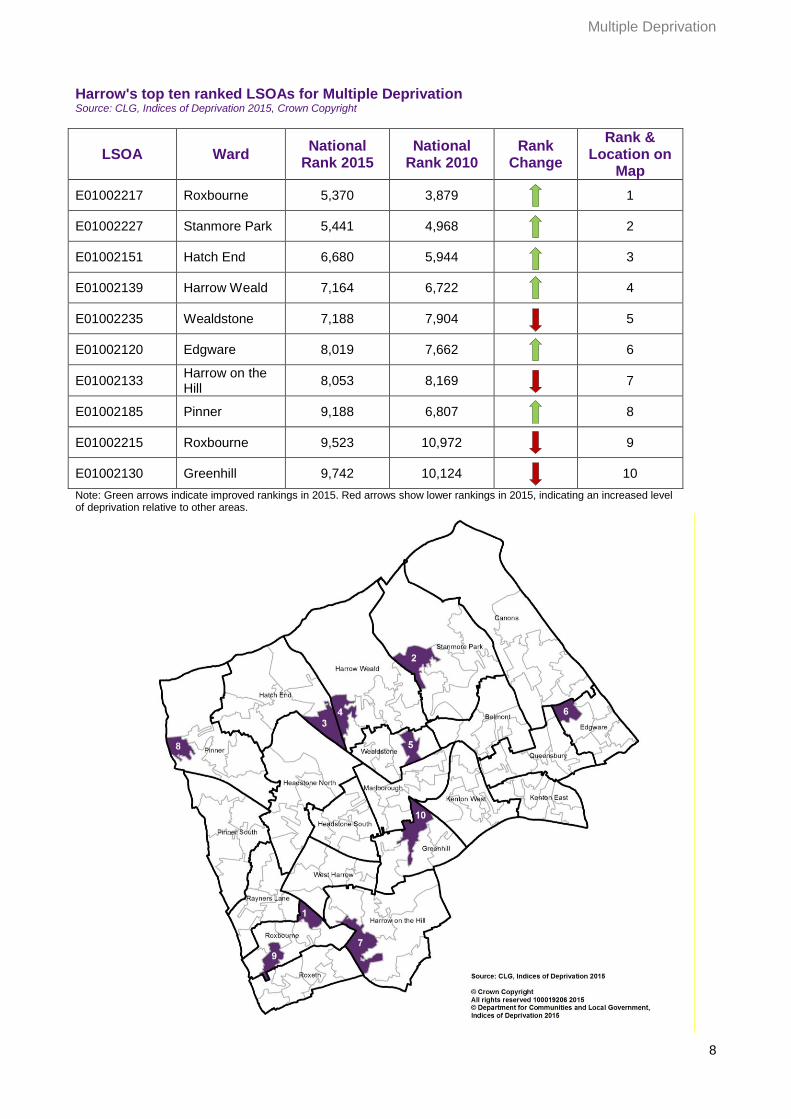
Overall multiple deprivation in Harrow has fallen compared to the 2010 and 2007 IMDs. The number of LSOAs in Harrow in the top 20 per cent most deprived in England has fallen from three to two. Harrow’s most deprived LSOA is ranked nationally as the 5,370th most deprived in England - this LSOA is in Roxbourne ward and encompasses the Rayners Lane Estate. However, this LSOA has an improved ranking since 2010, as do the next three of the borough’s most deprived LSOAs. Harrow’s second most deprived LSOA is in Stanmore Park ward, covering the Woodlands and Cottesmore Estates. Of the 137 LSOAs in Harrow only two fall within the top 20 per cent most deprived in England; they are in the wards of Roxbourne and Stanmore Park, This is an improved position on 2010, when three of Harrow’s LSOAs were in England’s most deprived 20 per cent. Harrow has no LSOAs in the top 10 per cent most deprived nationally. Harrow’s top four most deprived LSOAs in 2015 were also the borough’s most deprived LSOAs in 2010. However, all four of these LSOAs have improved rankings (higher), compared to 2010. Four of Harrow’s top ten ranked LSOAs for Multiple Deprivation have worse rankings compared to the 2010 IMD, whilst six have improved rankings. 28 of Harrow’s LSOAs are in the least deprived 20 per cent in the country, five more than in 2010. 14 of those are in the least deprived 10 per cent, up from eight in 2010; they are in the wards of Pinner (3), Hatch End (3), Pinner South (4); Headstone North (3); and Rayners Lane (1). The location of Harrow’s top ten most deprived LSOAs can be seen in the map on Page 8. They are distributed right across the borough with only Roxbourne ward having more than one LSOA in the top ten. With the exception of the LSOAs ranked 3rd and 4th in Harrow, the top ten do not adjoin or abut one another and there is no particular spatial pattern to their distribution. They do however coincide with areas with a higher concentration of social housing suggesting that households living in this type of housing stock are among the most deprived. There are no LSOAs in Harrow in the 10 per cent most deprived in England. Multiple Deprivation by ward Source: CLG, Indices of Deprivation 2015, Crown Copyright Note: Ward level data has been calculated from LSOA average IMD scores
0
5
10
15
20
25
IMD
ave
rag
e s
co
re
10
2
89
19
21
28
21
1514
3
8
14
20
30
24
15 15
8
1 2 3 4 5 6 7 8 9 10
Decile
2015
2010
Less deprivedLess deprivedMore deprived Less deprivedLess deprivedMore deprived
Multiple Deprivation
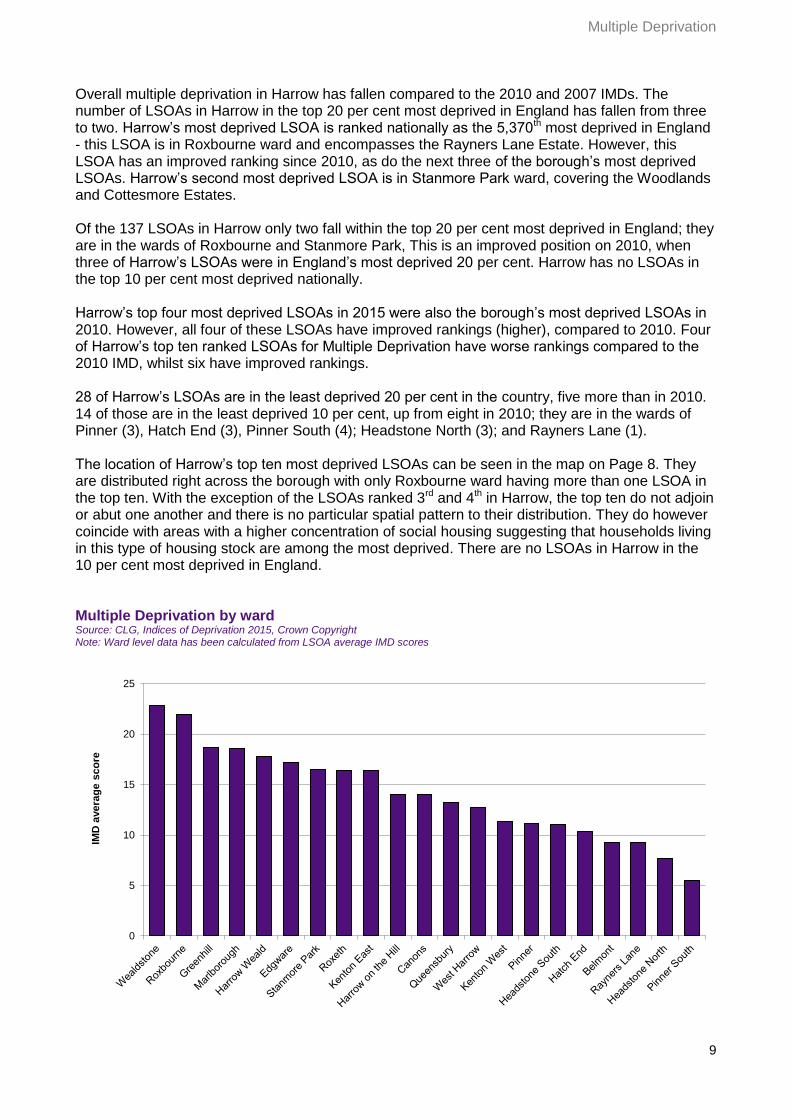
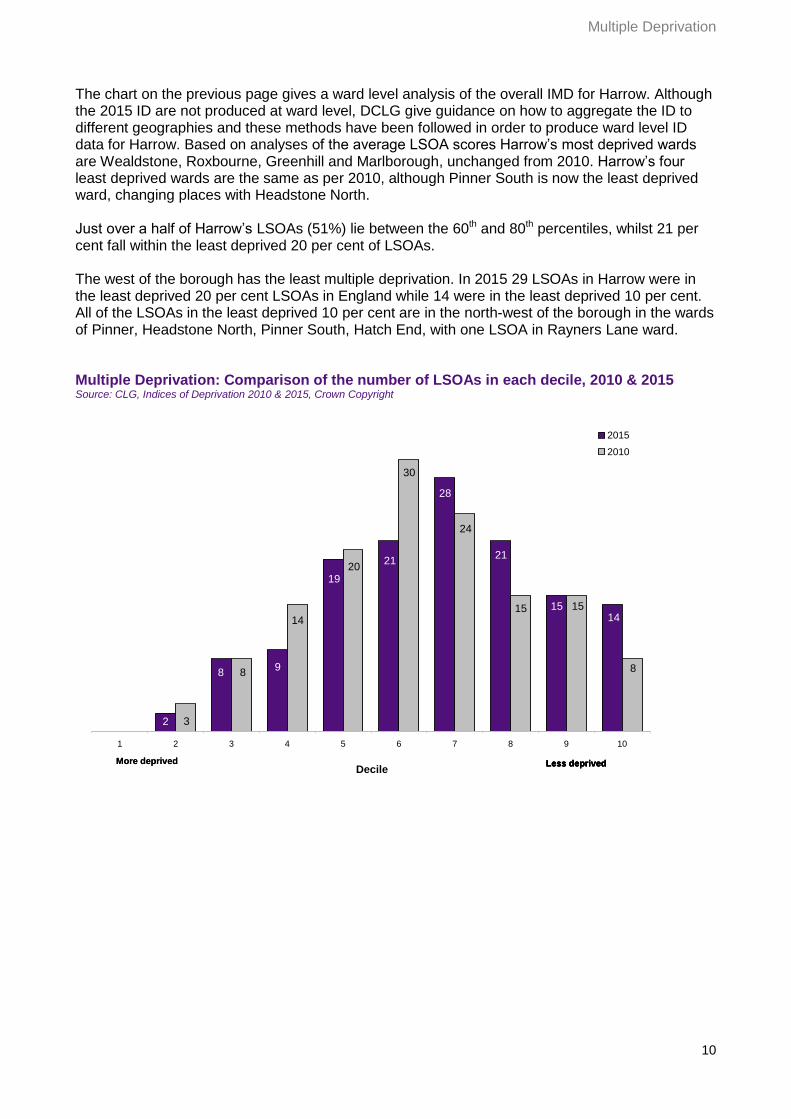
The chart on the previous page gives a ward level analysis of the overall IMD for Harrow. Although the 2015 ID are not produced at ward level, DCLG give guidance on how to aggregate the ID to different geographies and these methods have been followed in order to produce ward level ID data for Harrow. Based on analyses of the average LSOA scores Harrow’s most deprived wards are Wealdstone, Roxbourne, Greenhill and Marlborough, unchanged from 2010. Harrow’s four least deprived wards are the same as per 2010, although Pinner South is now the least deprived ward, changing places with Headstone North. Just over a half of Harrow’s LSOAs (51%) lie between the 60th and 80th percentiles, whilst 21 per cent fall within the least deprived 20 per cent of LSOAs. The west of the borough has the least multiple deprivation. In 2015 29 LSOAs in Harrow were in the least deprived 20 per cent LSOAs in England while 14 were in the least deprived 10 per cent. All of the LSOAs in the least deprived 10 per cent are in the north-west of the borough in the wards of Pinner, Headstone North, Pinner South, Hatch End, with one LSOA in Rayners Lane ward. Multiple Deprivation: Comparison of the number of LSOAs in each decile, 2010 & 2015 Source: CLG, Indices of Deprivation 2010 & 2015, Crown Copyright
11
Income Deprivation
Income Deprivation
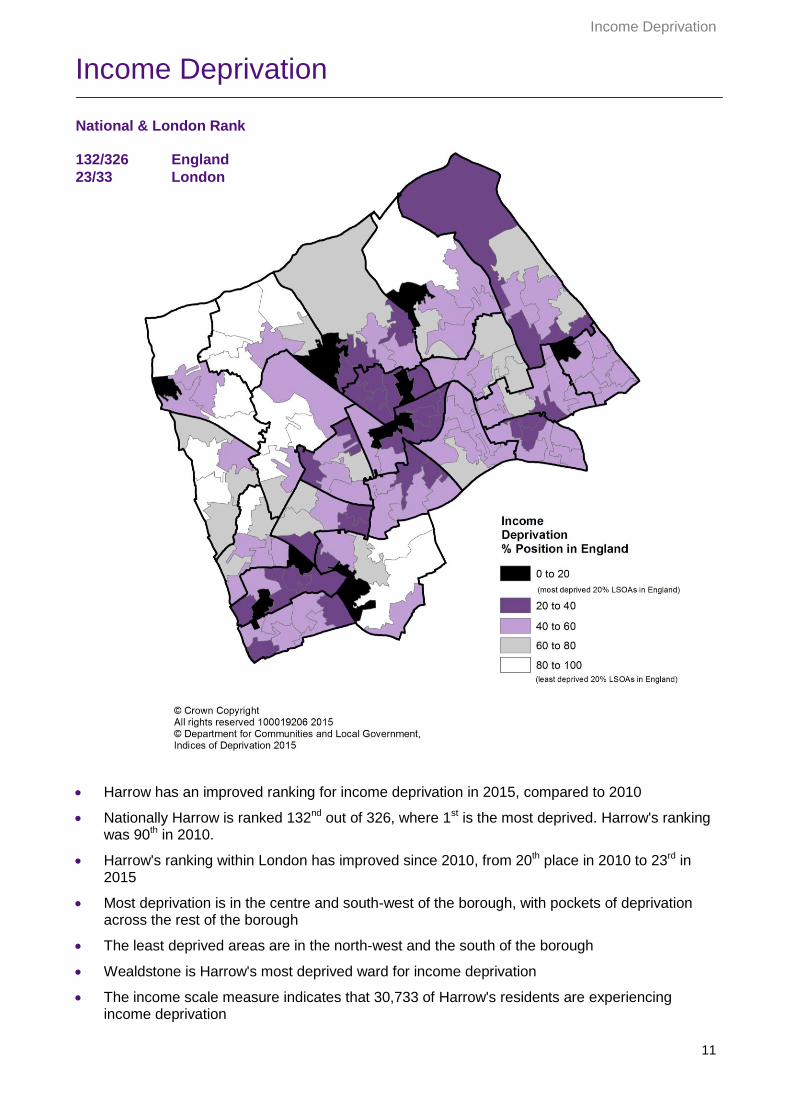
Harrow has an improved ranking for income deprivation in 2015, compared to 2010
Nationally Harrow is ranked 132nd out of 326, where 1st is the most deprived. Harrow's ranking was 90th in 2010.
Harrow's ranking within London has improved since 2010, from 20th place in 2010 to 23rd in 2015
Most deprivation is in the centre and south-west of the borough, with pockets of deprivation across the rest of the borough
The least deprived areas are in the north-west and the south of the borough
Wealdstone is Harrow's most deprived ward for income deprivation
The income scale measure indicates that 30,733 of Harrow's residents are experiencing income deprivation
National & London Rank 132/326 England
23/33 London
12
Income Deprivation
Income Deprivation by ward Source: CLG, Indices of Deprivation 2015, Crown Copyright Note: Ward level data has been calculated from LSOA average income scores
0
0.05
0.1
0.15
0.2
0.25
Inc
om
e a
ve
rag
e s
co
re
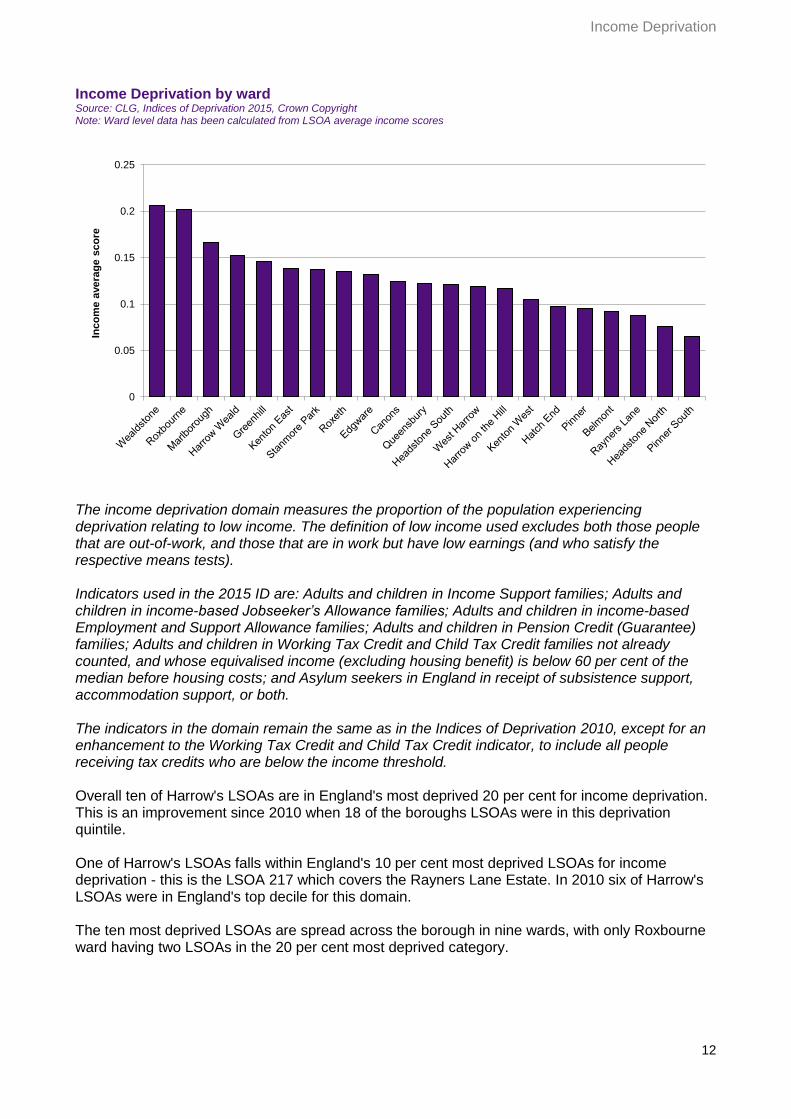
The income deprivation domain measures the proportion of the population experiencing deprivation relating to low income. The definition of low income used excludes both those people that are out-of-work, and those that are in work but have low earnings (and who satisfy the respective means tests). Indicators used in the 2015 ID are: Adults and children in Income Support families; Adults and children in income-based Jobseeker’s Allowance families; Adults and children in income-based Employment and Support Allowance families; Adults and children in Pension Credit (Guarantee) families; Adults and children in Working Tax Credit and Child Tax Credit families not already counted, and whose equivalised income (excluding housing benefit) is below 60 per cent of the median before housing costs; and Asylum seekers in England in receipt of subsistence support, accommodation support, or both. The indicators in the domain remain the same as in the Indices of Deprivation 2010, except for an enhancement to the Working Tax Credit and Child Tax Credit indicator, to include all people receiving tax credits who are below the income threshold. Overall ten of Harrow's LSOAs are in England's most deprived 20 per cent for income deprivation. This is an improvement since 2010 when 18 of the boroughs LSOAs were in this deprivation quintile. One of Harrow's LSOAs falls within England's 10 per cent most deprived LSOAs for income deprivation - this is the LSOA 217 which covers the Rayners Lane Estate. In 2010 six of Harrow's LSOAs were in England's top decile for this domain. The ten most deprived LSOAs are spread across the borough in nine wards, with only Roxbourne ward having two LSOAs in the 20 per cent most deprived category.
13
1
9
11
20
32
28
9
1110
66
12
18
32
28
15
6
9
7
4
1 2 3 4 5 6 7 8 9 10
Decile
2015
2010
Less deprivedMore deprived
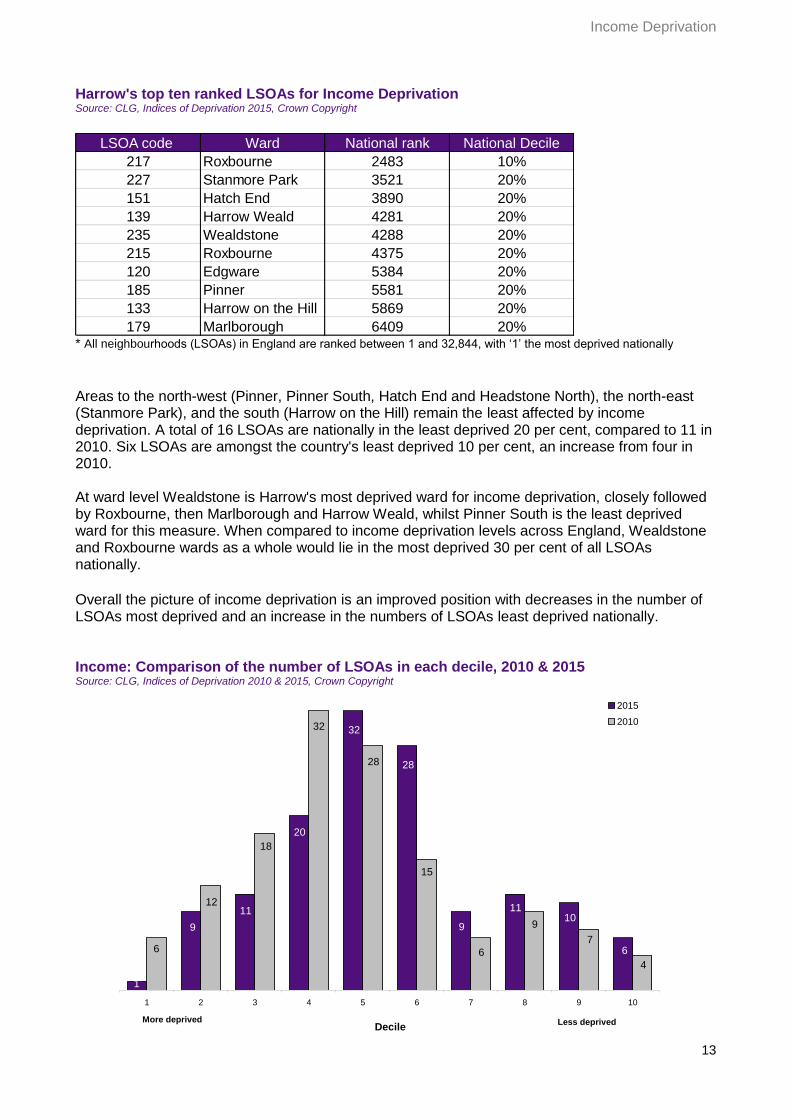
Income Deprivation Harrow's top ten ranked LSOAs for Income Deprivation Source: CLG, Indices of Deprivation 2015, Crown Copyright
LSOA code Ward National rank National Decile
217 Roxbourne 2483 10%
227 Stanmore Park 3521 20%
151 Hatch End 3890 20%
139 Harrow Weald 4281 20%
235 Wealdstone 4288 20%
215 Roxbourne 4375 20%
120 Edgware 5384 20%
185 Pinner 5581 20%
133 Harrow on the Hill 5869 20%
179 Marlborough 6409 20% * All neighbourhoods (LSOAs) in England are ranked between 1 and 32,844, with ‘1’ the most deprived nationally
Areas to the north-west (Pinner, Pinner South, Hatch End and Headstone North), the north-east (Stanmore Park), and the south (Harrow on the Hill) remain the least affected by income deprivation. A total of 16 LSOAs are nationally in the least deprived 20 per cent, compared to 11 in 2010. Six LSOAs are amongst the country's least deprived 10 per cent, an increase from four in 2010. At ward level Wealdstone is Harrow's most deprived ward for income deprivation, closely followed by Roxbourne, then Marlborough and Harrow Weald, whilst Pinner South is the least deprived ward for this measure. When compared to income deprivation levels across England, Wealdstone and Roxbourne wards as a whole would lie in the most deprived 30 per cent of all LSOAs nationally.
Overall the picture of income deprivation is an improved position with decreases in the number of LSOAs most deprived and an increase in the numbers of LSOAs least deprived nationally. Income: Comparison of the number of LSOAs in each decile, 2010 & 2015 Source: CLG, Indices of Deprivation 2010 & 2015, Crown Copyright
14
Income Deprivation
Income Deprivation Affecting Children (IDACI)
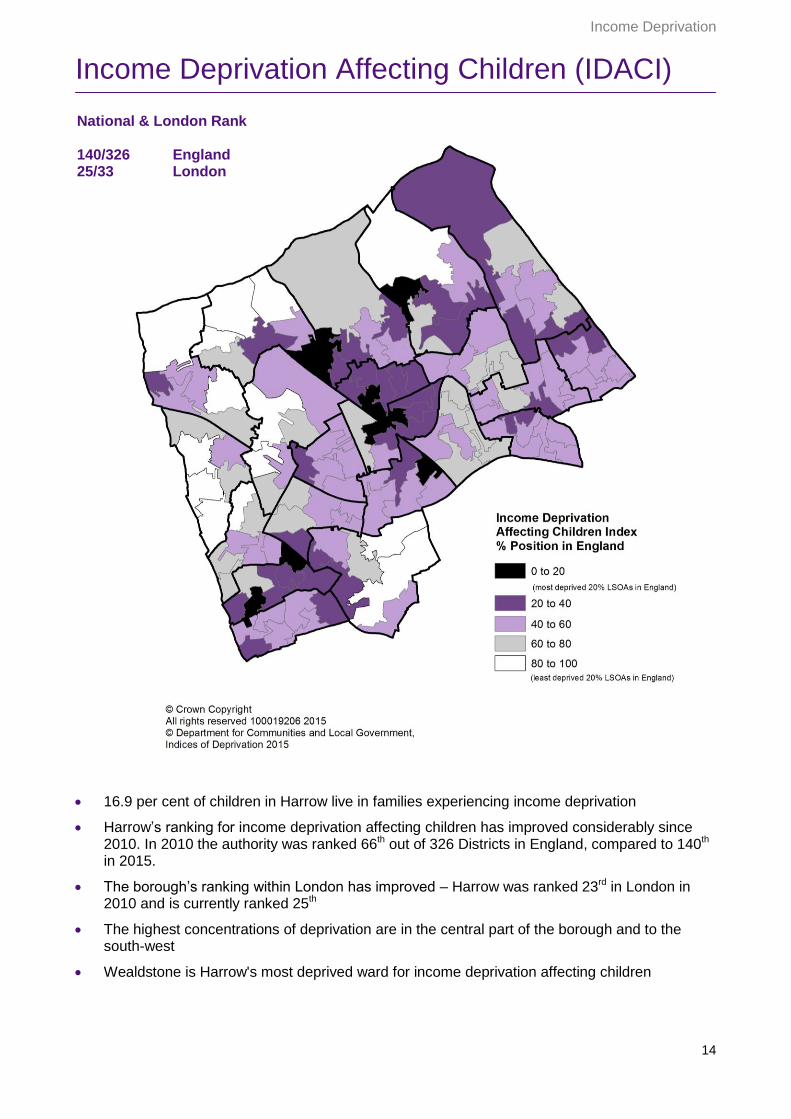
16.9 per cent of children in Harrow live in families experiencing income deprivation
Harrow’s ranking for income deprivation affecting children has improved considerably since 2010. In 2010 the authority was ranked 66th out of 326 Districts in England, compared to 140th in 2015.
The borough’s ranking within London has improved – Harrow was ranked 23rd in London in 2010 and is currently ranked 25th
The highest concentrations of deprivation are in the central part of the borough and to the south-west
Wealdstone is Harrow's most deprived ward for income deprivation affecting children
National & London Rank 140/326 England 25/33 London

15
Income Deprivation
The Income Deprivation Affecting Children Index (IDACI) measures the proportion of all children aged 0 to 15 living in income deprived families3. This is one of two supplementary indices and is a sub-set of the Income Deprivation Domain. Income deprivation affecting children follows a similar pattern to income deprivation in general. Overall the picture of income deprivation affecting children is varied, with LSOAs in each of the quintile bands. The 2015 ID shows that 16.9 per cent of children in Harrow live in families experiencing income deprivation. Based on the 2010 ID, the Greater London Authority (GLA) estimated that Harrow's corresponding level for 2010 was 24.4 per cent4. Eight of Harrow's LSOAs feature in the most deprived 20 per cent of LSOAs in England, compared to 25 LSOAs in 2010. Three LSOAS are amongst the country's most deprived 10 per cent, down from eight in the 2010 ID. None of Harrow's LSOAs are in the most deprived 5 per cent of LSOAs, an improved position from 2010, when four of the borough's LSOAs were identified in the most deprived 5 per cent nationally. Overall far fewer of Harrow’s LSOAs are in the four most deprived quintiles, compared to 2010. Harrow's most deprived LSOAs for income deprivation affecting children are adjoining LSOAs in Marlborough and Wealdstone wards, and the LSOA in Roxbourne ward covering the Rayners Lane Estate - these LSOAs are in the country's most deprived 10 per cent. The wards of Stanmore Park, Harrow Weald, Hatch End and Greenhill also have LSOAs featuring in the 20 per cent most deprived in England. There are 14 LSOAs in the least deprived 20 per cent in the country, up from nine in 2010. Five LSOAs are in the country's least deprived 10 per cent and these are all to the west of the borough - in Harrow on the Hill, Hatch End, Headstone North, Pinner and Pinner South wards. Harrow's top ten ranked LSOAs for Income Deprivation Affecting Children Source: CLG, Indices of Deprivation 2015, Crown Copyright
LSOA code Ward National rank National Decile
179 Marlborough 2678 10%
217 Roxbourne 2806 10%
236 Wealdstone 2983 10%
151 Hatch End 4096 20%
227 Stanmore Park 4284 20%
139 Harrow Weald 4663 20%
215 Roxbourne 4894 20%
131 Greenhill 6545 20%
231 Wealdstone 6785 30%
117 Canons 7122 30% * All neighbourhoods (LSOAs) in England are ranked between 1 and 32,844, with ‘1’ the most deprived nationally
Wealdstone is Harrow's most deprived ward for income deprivation affecting children, followed by Roxbourne, then Marlborough and Harrow Weald, whilst Pinner South is the least deprived ward for this measure.
3 The word ‘family’ is used to designate a ‘benefit unit’, that is the claimant, any partner and any dependent children
(those for whom Child Benefit is received) 4 Income Deprivation Affecting Children and Older People, Intelligence Update 02-2012, GLA
16
Income Deprivation
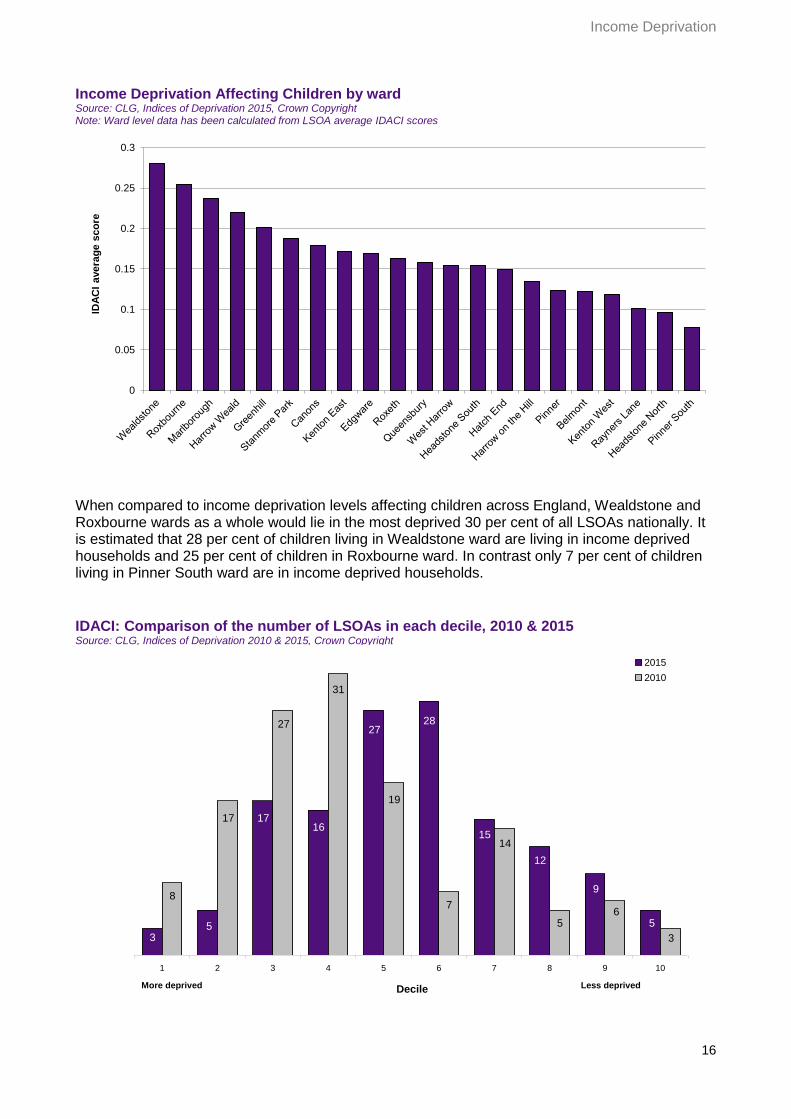
Income Deprivation Affecting Children by ward Source: CLG, Indices of Deprivation 2015, Crown Copyright Note: Ward level data has been calculated from LSOA average IDACI scores
0
0.05
0.1
0.15
0.2
0.25
0.3
IDA
CI
avera
ge s
co
re
When compared to income deprivation levels affecting children across England, Wealdstone and Roxbourne wards as a whole would lie in the most deprived 30 per cent of all LSOAs nationally. It is estimated that 28 per cent of children living in Wealdstone ward are living in income deprived households and 25 per cent of children in Roxbourne ward. In contrast only 7 per cent of children living in Pinner South ward are in income deprived households.
IDACI: Comparison of the number of LSOAs in each decile, 2010 & 2015 Source: CLG, Indices of Deprivation 2010 & 2015, Crown Copyright
35
1716
2728
15
12
9
5
8
17
27
31
19
7
14
56
3
1 2 3 4 5 6 7 8 9 10
Decile
2015
2010
More deprived Less deprived
17
Income Deprivation
Income Deprivation Affecting Older People (IDAOPI)
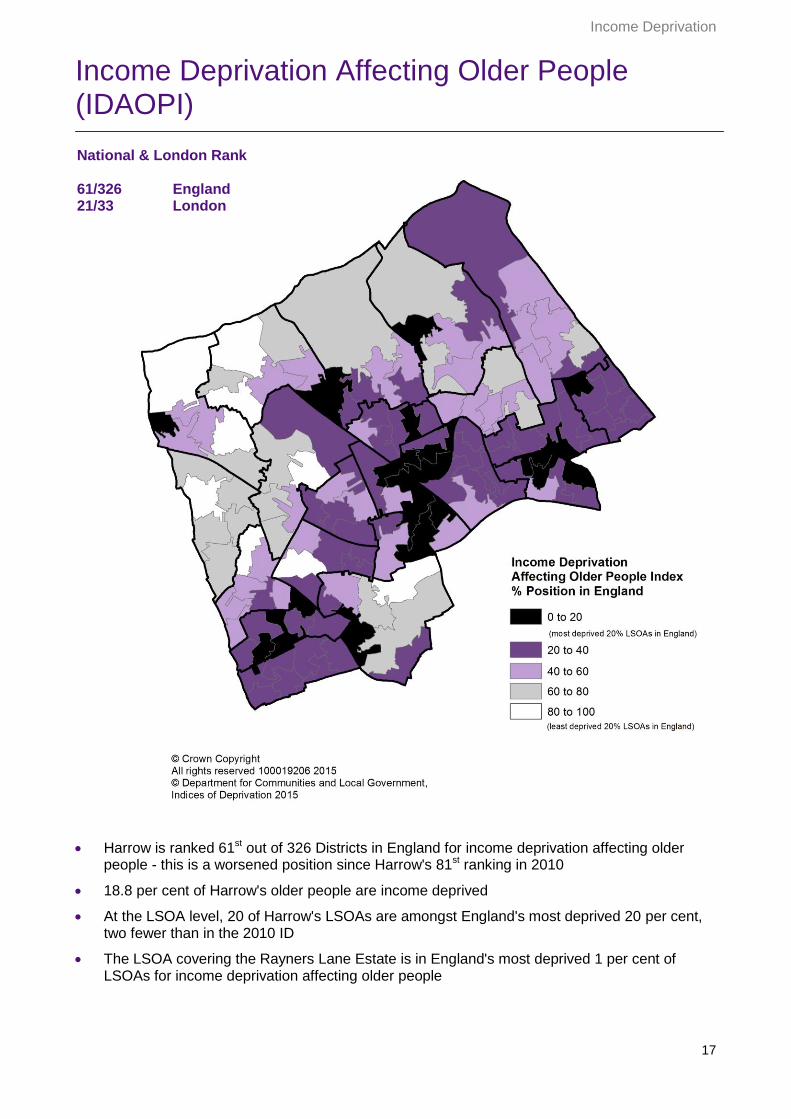
Harrow is ranked 61st out of 326 Districts in England for income deprivation affecting older people - this is a worsened position since Harrow's 81st ranking in 2010
18.8 per cent of Harrow's older people are income deprived
At the LSOA level, 20 of Harrow's LSOAs are amongst England's most deprived 20 per cent, two fewer than in the 2010 ID
The LSOA covering the Rayners Lane Estate is in England's most deprived 1 per cent of LSOAs for income deprivation affecting older people
National & London Rank 61/326 England 21/33 London
18
Income Deprivation
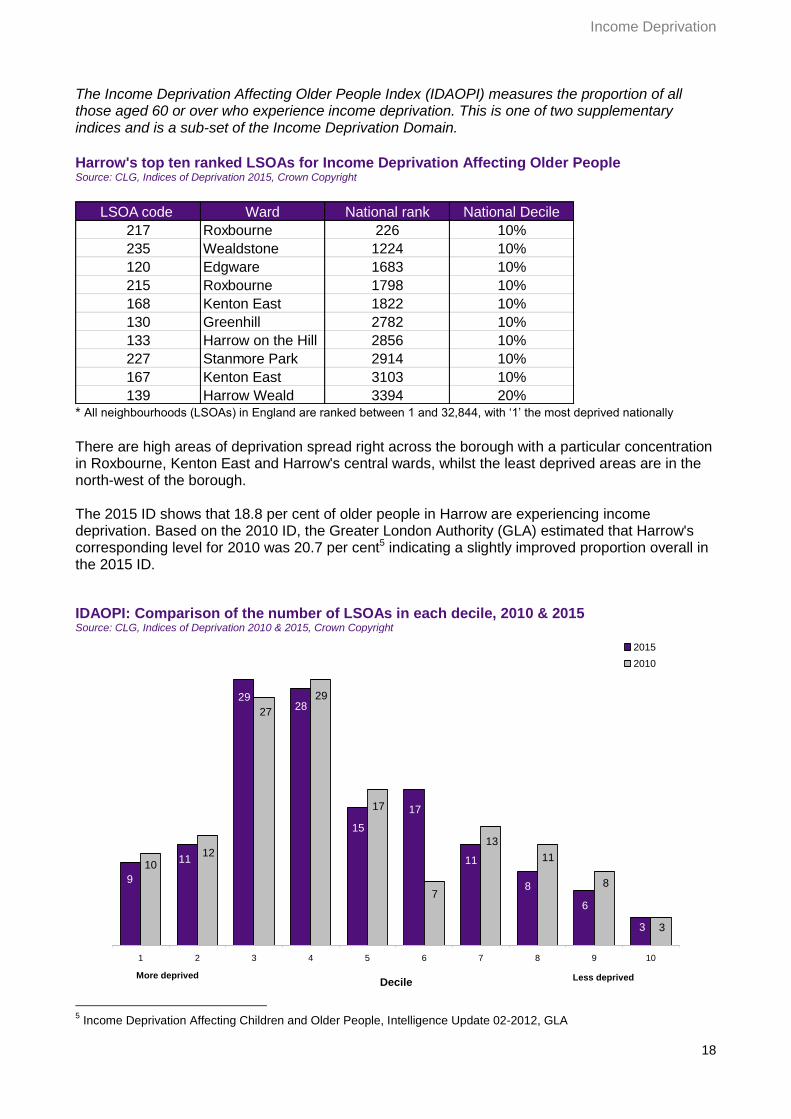
The Income Deprivation Affecting Older People Index (IDAOPI) measures the proportion of all those aged 60 or over who experience income deprivation. This is one of two supplementary indices and is a sub-set of the Income Deprivation Domain.
Harrow's top ten ranked LSOAs for Income Deprivation Affecting Older People Source: CLG, Indices of Deprivation 2015, Crown Copyright
LSOA code Ward National rank National Decile
217 Roxbourne 226 10%
235 Wealdstone 1224 10%
120 Edgware 1683 10%
215 Roxbourne 1798 10%
168 Kenton East 1822 10%
130 Greenhill 2782 10%
133 Harrow on the Hill 2856 10%
227 Stanmore Park 2914 10%
167 Kenton East 3103 10%
139 Harrow Weald 3394 20% * All neighbourhoods (LSOAs) in England are ranked between 1 and 32,844, with ‘1’ the most deprived nationally
There are high areas of deprivation spread right across the borough with a particular concentration in Roxbourne, Kenton East and Harrow's central wards, whilst the least deprived areas are in the north-west of the borough. The 2015 ID shows that 18.8 per cent of older people in Harrow are experiencing income deprivation. Based on the 2010 ID, the Greater London Authority (GLA) estimated that Harrow's corresponding level for 2010 was 20.7 per cent5 indicating a slightly improved proportion overall in the 2015 ID.
IDAOPI: Comparison of the number of LSOAs in each decile, 2010 & 2015 Source: CLG, Indices of Deprivation 2010 & 2015, Crown Copyright
9
11
2928
15
17
11
8
6
3
1012
27
29
17
7
13
11
8
3
1 2 3 4 5 6 7 8 9 10
Decile
2015
2010
Less deprivedMore deprived
5 Income Deprivation Affecting Children and Older People, Intelligence Update 02-2012, GLA
19
Income Deprivation
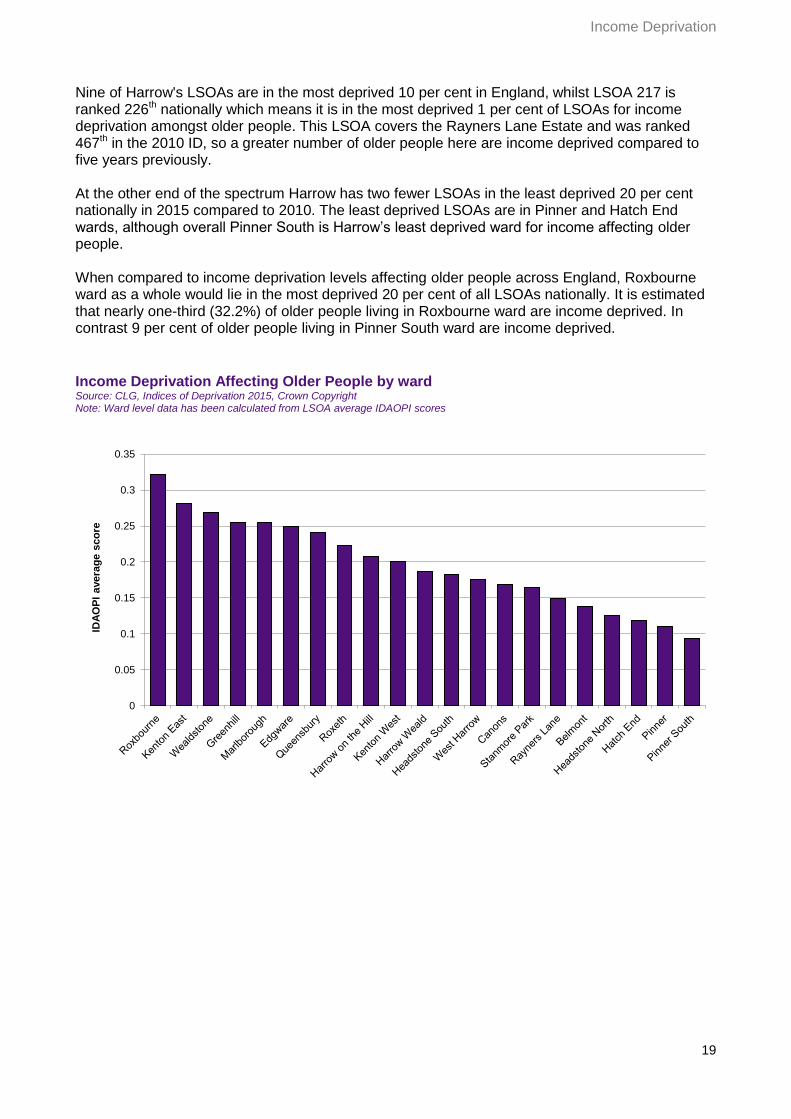
Nine of Harrow's LSOAs are in the most deprived 10 per cent in England, whilst LSOA 217 is ranked 226th nationally which means it is in the most deprived 1 per cent of LSOAs for income deprivation amongst older people. This LSOA covers the Rayners Lane Estate and was ranked 467th in the 2010 ID, so a greater number of older people here are income deprived compared to five years previously. At the other end of the spectrum Harrow has two fewer LSOAs in the least deprived 20 per cent nationally in 2015 compared to 2010. The least deprived LSOAs are in Pinner and Hatch End wards, although overall Pinner South is Harrow’s least deprived ward for income affecting older people. When compared to income deprivation levels affecting older people across England, Roxbourne ward as a whole would lie in the most deprived 20 per cent of all LSOAs nationally. It is estimated that nearly one-third (32.2%) of older people living in Roxbourne ward are income deprived. In contrast 9 per cent of older people living in Pinner South ward are income deprived.
Income Deprivation Affecting Older People by ward Source: CLG, Indices of Deprivation 2015, Crown Copyright Note: Ward level data has been calculated from LSOA average IDAOPI scores
0
0.05
0.1
0.15
0.2
0.25
0.3
0.35
IDA
OP
I a
ve
rag
e s
co
re

20
Employment Deprivation
Employment Deprivation
Employment deprivation is generally dispersed at low levels across the borough, but is more prevalent in the central swathe of the borough and across to the south-east
Harrow is ranked 217th out of 326 Districts in England, which is a slightly improved ranking since the borough's 213rd ranking in the 2010 ID
Harrow’s position in London has worsened slightly from 27th ranking in 2010 to 26th ranking in 2015, where 1st is the most deprived
The employment scale measure indicates that 12,083 of Harrow's residents are experiencing employment deprivation
National & London Rank 217/326 England 26/33 London
21
Employment Deprivation
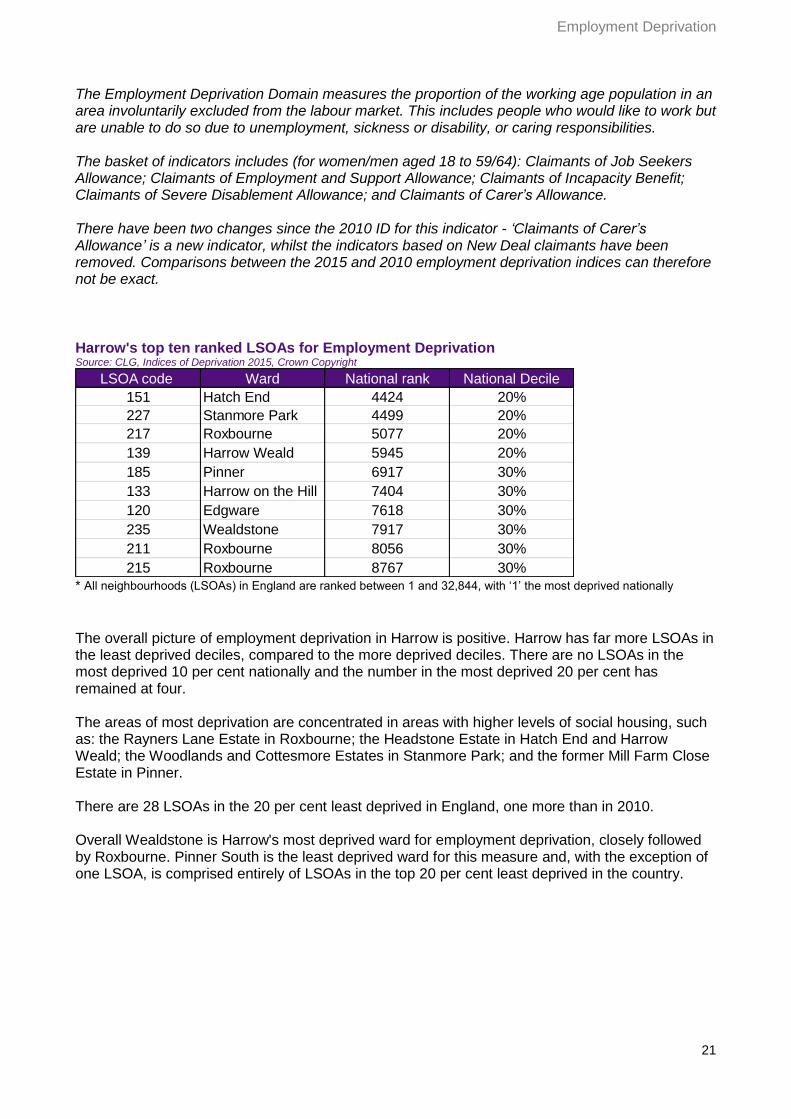
The Employment Deprivation Domain measures the proportion of the working age population in an area involuntarily excluded from the labour market. This includes people who would like to work but are unable to do so due to unemployment, sickness or disability, or caring responsibilities. The basket of indicators includes (for women/men aged 18 to 59/64): Claimants of Job Seekers Allowance; Claimants of Employment and Support Allowance; Claimants of Incapacity Benefit; Claimants of Severe Disablement Allowance; and Claimants of Carer’s Allowance. There have been two changes since the 2010 ID for this indicator - ‘Claimants of Carer’s Allowance’ is a new indicator, whilst the indicators based on New Deal claimants have been removed. Comparisons between the 2015 and 2010 employment deprivation indices can therefore not be exact.
Harrow's top ten ranked LSOAs for Employment Deprivation Source: CLG, Indices of Deprivation 2015, Crown Copyright
LSOA code Ward National rank National Decile
151 Hatch End 4424 20%
227 Stanmore Park 4499 20%
217 Roxbourne 5077 20%
139 Harrow Weald 5945 20%
185 Pinner 6917 30%
133 Harrow on the Hill 7404 30%
120 Edgware 7618 30%
235 Wealdstone 7917 30%
211 Roxbourne 8056 30%
215 Roxbourne 8767 30% * All neighbourhoods (LSOAs) in England are ranked between 1 and 32,844, with ‘1’ the most deprived nationally
The overall picture of employment deprivation in Harrow is positive. Harrow has far more LSOAs in the least deprived deciles, compared to the more deprived deciles. There are no LSOAs in the most deprived 10 per cent nationally and the number in the most deprived 20 per cent has remained at four. The areas of most deprivation are concentrated in areas with higher levels of social housing, such as: the Rayners Lane Estate in Roxbourne; the Headstone Estate in Hatch End and Harrow Weald; the Woodlands and Cottesmore Estates in Stanmore Park; and the former Mill Farm Close Estate in Pinner. There are 28 LSOAs in the 20 per cent least deprived in England, one more than in 2010. Overall Wealdstone is Harrow's most deprived ward for employment deprivation, closely followed by Roxbourne. Pinner South is the least deprived ward for this measure and, with the exception of one LSOA, is comprised entirely of LSOAs in the top 20 per cent least deprived in the country.

22
Employment Deprivation
Employment: Comparison of the number of LSOAs in each decile, 2010 & 2015 Source: CLG, Indices of Deprivation 2010 & 2015, Crown Copyright
0
4
8 7
1716
32
25
13
15
4
7
15
11
25 25
23
1413
1 2 3 4 5 6 7 8 9 10
Decile
2015
2010
Less deprivedMore deprived
Employment Deprivation by ward Source: CLG, Indices of Deprivation 2015, Crown Copyright Note: Ward level data has been calculated from LSOA average employment scores
0
0.02
0.04
0.06
0.08
0.1
0.12
0.14
Em
plo
ym
en
t avera
ge s
co
re
23
Health Deprivation and Disability
Health Deprivation and Disability
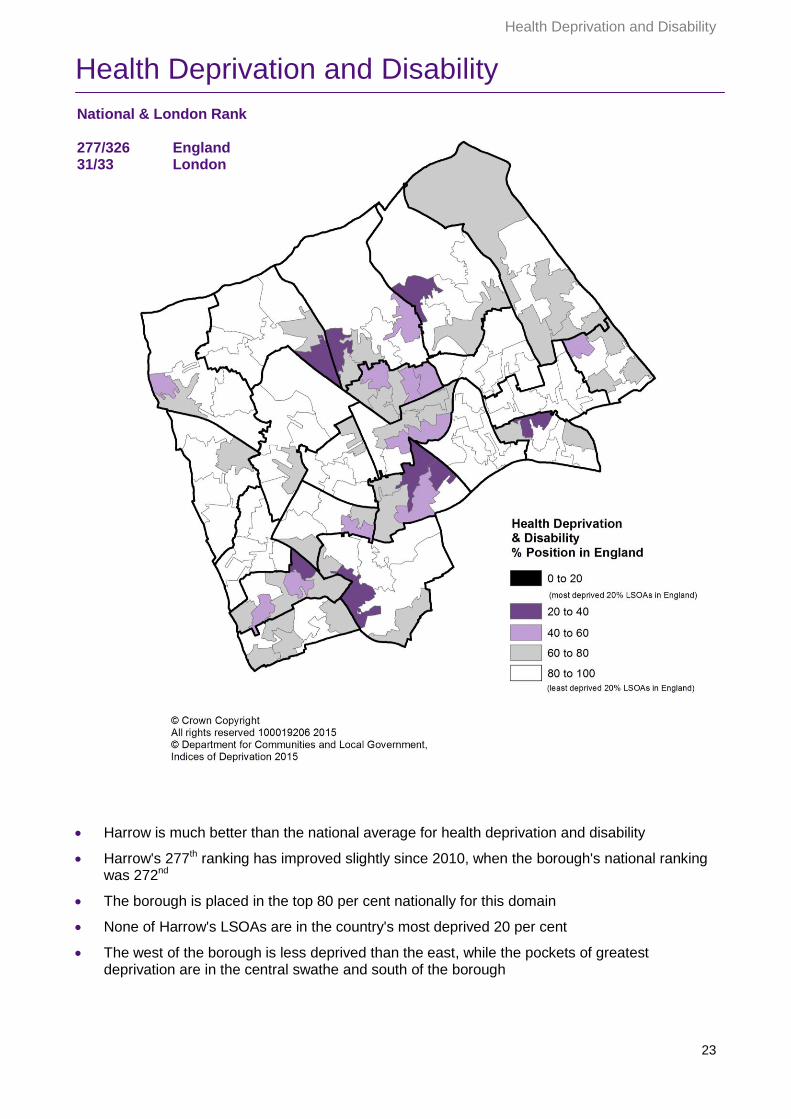
Harrow is much better than the national average for health deprivation and disability
Harrow's 277th ranking has improved slightly since 2010, when the borough's national ranking was 272nd
The borough is placed in the top 80 per cent nationally for this domain
None of Harrow's LSOAs are in the country's most deprived 20 per cent
The west of the borough is less deprived than the east, while the pockets of greatest deprivation are in the central swathe and south of the borough
National & London Rank 277/326 England 31/33 London
24
Health Deprivation and Disability
The Health Deprivation and Disability Domain measures the risk of premature death and the impairment of quality of life through poor physical or mental health. The domain measures morbidity, disability and premature mortality but not aspects of behaviour or environment that may be predictive of future health deprivation.
Health deprivation and disability is a basket of indicators: Years of Potential Life Lost: an age and sex standardised measure of premature death; Comparative Illness and Disability Ratio: an age and sex standardised morbidity/disability ratio; Acute Morbidity: an age and sex standardised rate of emergency admission to hospital; Mood and Anxiety disorders: the rate of adults suffering from mood and anxiety disorders. There have been minor changes to the data and definitions to this domain. The data on claimants of Employment Support Allowance (which replaced Incapacity Benefit and Income Support paid because of an illness or disability for new claimants from 2008) was incorporated into this indicator since the 2010 ID. Work Capability Assessments for incapacity benefits were also introduced in 2008, further affecting the number of people eligible for these benefits.
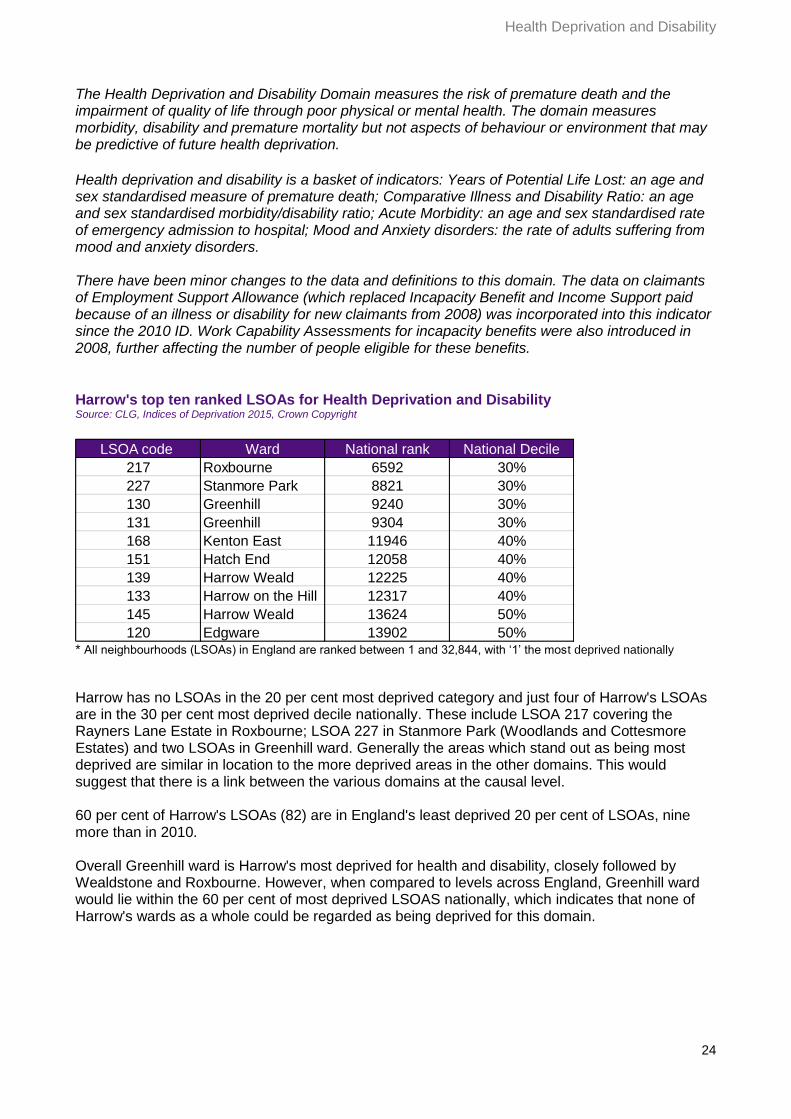
Harrow's top ten ranked LSOAs for Health Deprivation and Disability Source: CLG, Indices of Deprivation 2015, Crown Copyright
LSOA code Ward National rank National Decile
217 Roxbourne 6592 30%
227 Stanmore Park 8821 30%
130 Greenhill 9240 30%
131 Greenhill 9304 30%
168 Kenton East 11946 40%
151 Hatch End 12058 40%
139 Harrow Weald 12225 40%
133 Harrow on the Hill 12317 40%
145 Harrow Weald 13624 50%
120 Edgware 13902 50% * All neighbourhoods (LSOAs) in England are ranked between 1 and 32,844, with ‘1’ the most deprived nationally
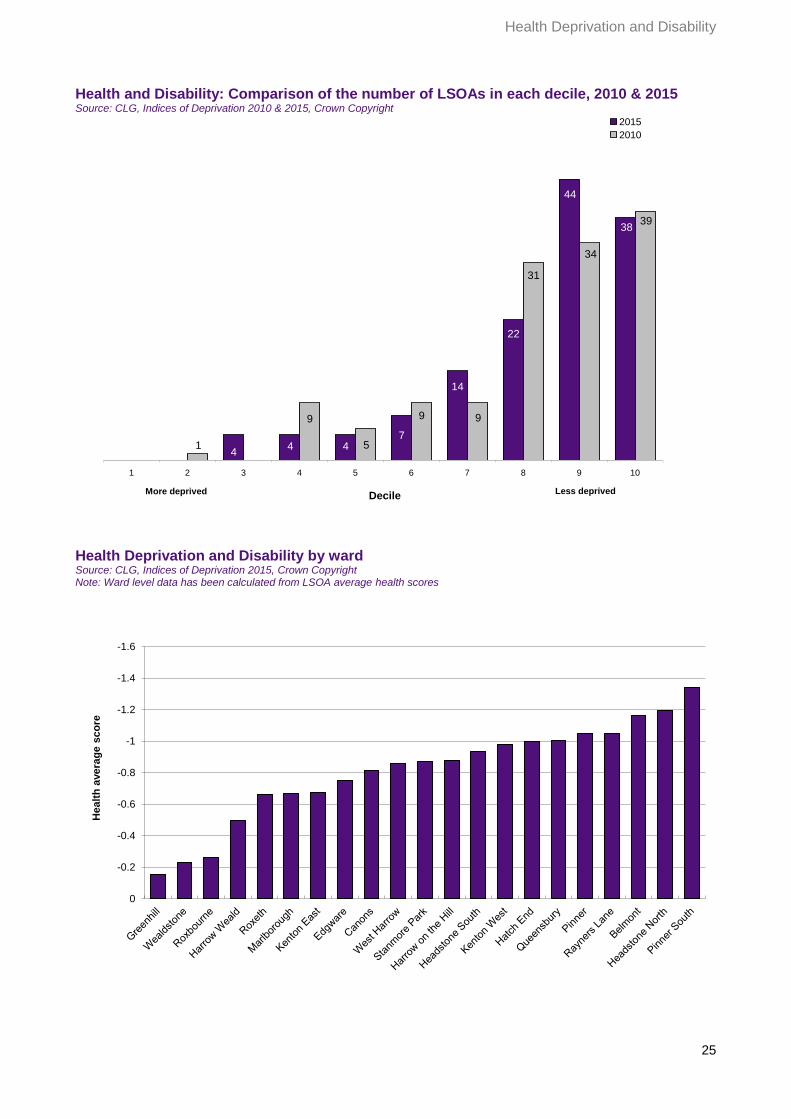
Harrow has no LSOAs in the 20 per cent most deprived category and just four of Harrow's LSOAs are in the 30 per cent most deprived decile nationally. These include LSOA 217 covering the Rayners Lane Estate in Roxbourne; LSOA 227 in Stanmore Park (Woodlands and Cottesmore Estates) and two LSOAs in Greenhill ward. Generally the areas which stand out as being most deprived are similar in location to the more deprived areas in the other domains. This would suggest that there is a link between the various domains at the causal level. 60 per cent of Harrow's LSOAs (82) are in England's least deprived 20 per cent of LSOAs, nine more than in 2010. Overall Greenhill ward is Harrow's most deprived for health and disability, closely followed by Wealdstone and Roxbourne. However, when compared to levels across England, Greenhill ward would lie within the 60 per cent of most deprived LSOAS nationally, which indicates that none of Harrow's wards as a whole could be regarded as being deprived for this domain.
25
Health Deprivation and Disability
Health and Disability: Comparison of the number of LSOAs in each decile, 2010 & 2015 Source: CLG, Indices of Deprivation 2010 & 2015, Crown Copyright
0 0
44 4
7
14
22
44
38
1
9
5
9 9
31
34
39
1 2 3 4 5 6 7 8 9 10
Decile
2015
2010
Less deprivedMore deprived
Health Deprivation and Disability by ward Source: CLG, Indices of Deprivation 2015, Crown Copyright Note: Ward level data has been calculated from LSOA average health scores
-1.6
-1.4
-1.2
-1
-0.8
-0.6
-0.4
-0.2
0
He
alt
h a
ve
rag
e s
co
re

26
Education, Skills and Training Deprivation
Education, Skills and Training Deprivation
Harrow is one of the least education, skills and training deprived local authorities in the country
Harrow has a slightly higher ranking in 2015, compared to 2010 when the borough was ranked 316th
There are small clusters of deprivation dispersed across the borough, but Wealdstone ranks highest on a ward basis
National & London Rank 303/326 England 26/33 London

27
Education, Skills and Training Deprivation
The Education, Skills and Training Deprivation Domain measures the lack of attainment and skills in the local population. The indicators fall into two sub-domains: one relating to children and young people and one relating to adult skills. This basket of indicators includes: Key Stage 2 attainment; Key Stage 4 attainment; Secondary school absence; Staying on in education post 16; Entry to higher education; Adult skills; and English language proficiency. There has been one major addition to this basket of indicators since the 2010 ID. The new indicator is the inclusion of an English language proficiency indicator to capture those adults who experience barriers to learning and disadvantage in the labour market because of lack of proficiency in English. Harrow is likely to score quite high on this 2011 Census indicator, with the 2011 Census showing that Harrow had above average proportions of residents who do not speak English at all, or do not speak English well, compared to the London and national averages. Since the 2010 ID the Key Stage 3 attainment indicator has been removed, as Key Stage 3 assessments became teacher assessment only from 2008/9. There has also been a change in the upper age band of the adult skills indicator from 54 (2010 ID) to 59 for women and 64 for men in the 2015 ID. Comparisons between the 2015 and 2010 education, skills and training deprivation indices can therefore not be exact.
Harrow's top ten ranked LSOAs for Education, Skills & Training Deprivation Source: CLG, Indices of Deprivation 2015, Crown Copyright
LSOA code Ward National rank National Decile
235 Wealdstone 8128 30%
139 Harrow Weald 9259 30%
151 Hatch End 9986 40%
217 Roxbourne 10284 40%
211 Roxbourne 10607 40%
124 Edgware 11319 40%
215 Roxbourne 11847 40%
219 Roxeth 12212 40%
167 Kenton East 12393 40%
227 Stanmore Park 12951 40% * All neighbourhoods (LSOAs) in England are ranked between 1 and 32,844, with ‘1’ the most deprived nationally
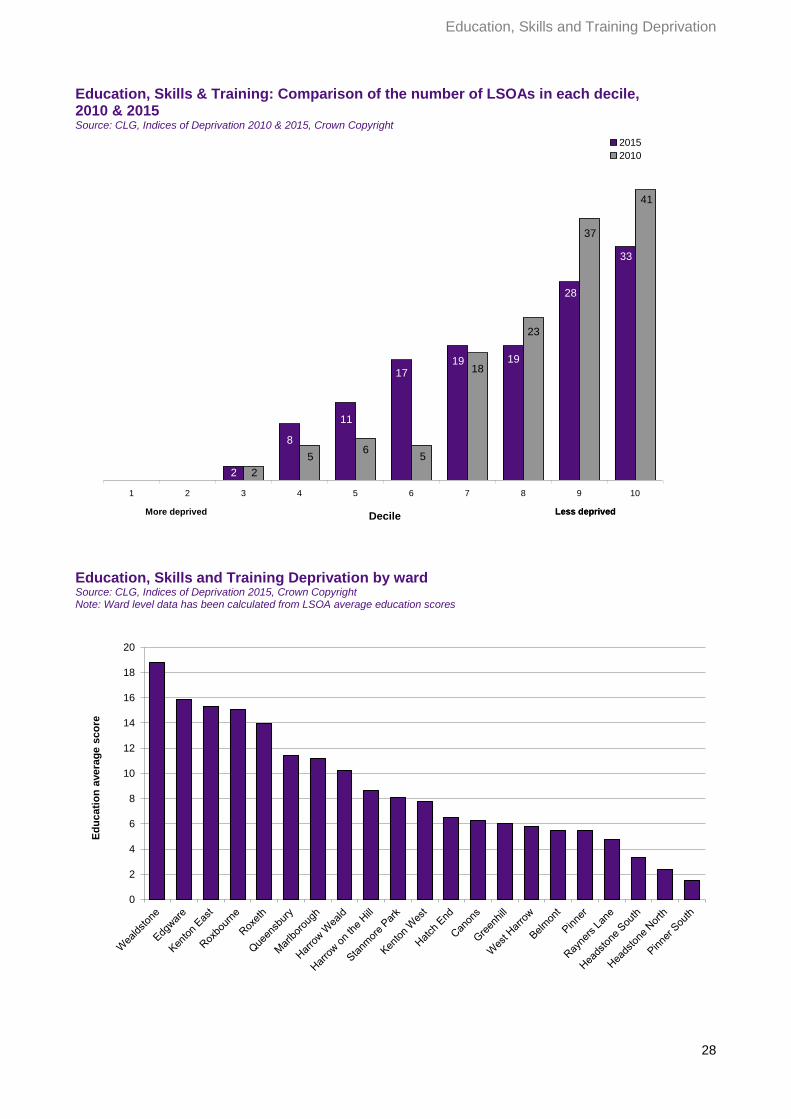
Harrow is amongst the best of all districts for low levels of education, skills and training deprivation, although the borough's ranking has worsened slightly since the 2010 ranking of 316th. Similarly Harrow's ranking within London has risen from 28th place to 26th. The main reason for these slightly deteriorated rankings is the inclusion of a new English proficiency indicator in the basket of indicators for this domain. Harrow has no LSOAs in the 20 per cent most deprived in England and only two in the most deprived 30 per cent decile. These two LSOA are in Roxbourne and Harrow Weald ward. 61 of Harrows LSOAs (45%) are in the top 20 per cent least deprived. Two of these LSOAs (in Hatch End and Pinner wards) are in England's least deprived 1 per cent. Where deprivation does exist it is largely in pockets in central, south-western and south-eastern areas. On a ward level Wealdstone, Edgware and Kenton East overall show the highest levels of deprivation. The least deprived wards on this measure are Pinner South, Headstone North and Headstone South, none of these wards having any LSOAs outside England's least deprived 20 per cent.
28
Education, Skills and Training Deprivation
Education, Skills & Training: Comparison of the number of LSOAs in each decile, 2010 & 2015 Source: CLG, Indices of Deprivation 2010 & 2015, Crown Copyright
2
8
11
1719 19
28
33
2
56
5
18
23
37
41
1 2 3 4 5 6 7 8 9 10
Decile
2015
2010
Less deprivedLess deprivedMore deprived
Education, Skills and Training Deprivation by ward Source: CLG, Indices of Deprivation 2015, Crown Copyright Note: Ward level data has been calculated from LSOA average education scores
0
2
4
6
8
10
12
14
16
18
20
Ed
uc
ati
on
ave
rag
e s
co
re

29
Education, Skills and Training Deprivation
Adult Skills Sub-Domain
Adults skills levels are worse in the centre, south-east and south-west of the borough
Kenton East is Harrow's most deprived ward for this measure
Only one of Harrow's LSOAs is in England's most deprived 20 per cent for this indicator, whilst 35 per cent are in England's least deprived 20 per cent

30
Education, Skills and Training Deprivation
This sub-domain of the Education, Skills & Training index includes: the proportion of working-age adults (women aged 25 to 59 and men aged 25 to 64) with no or low qualifications; and an English language proficiency indicator, which is the proportion of the working-age population (women aged 25 to 59 and men aged 25 to 64) who cannot speak English or cannot speak English ‘well’. The latter is a new indicator to include those adults who experience barriers to learning and disadvantage in the labour market as a result of lack of proficiency in English. These are non-overlapping counts in order to eliminate double counting of people within domains. At ward level Kenton East scores highest for this measure. This is perhaps to be expected as the 2011 Census showed that Kenton East ward has the highest percentage of residents who cannot speak English, at 1.8 per cent (193 residents). According to the 2011 Census question on main language spoken at home, Gujarati speakers predominate in the wards to the east of Harrow. Around 20 per cent of residents in Kenton West, Kenton East and Queensbury wards speak largely Gujarati. Similarly the 2011 showed that Harrow’s Romanian speakers are also largely concentrated in the wards to the east of the borough. Harrow's top ten ranked LSOAs in the Adult Skills Sub-Domain Source: CLG, Indices of Deprivation 2015, Crown Copyright
LSOA code Ward National rank National Decile
139 Harrow Weald 5626 20%
167 Kenton East 6652 30%
215 Roxbourne 6850 30%
124 Edgware 7200 30%
235 Wealdstone 7248 30%
217 Roxbourne 8172 30%
211 Roxbourne 8702 30%
168 Kenton East 9101 30%
151 Hatch End 9876 40%
120 Edgware 10168 40% * All neighbourhoods (LSOAs) in England are ranked between 1 and 32,844, with ‘1’ the most deprived nationally
Adult skills: Comparison of the number of LSOAs in each decile, 2010 & 2015 Source: CLG, Indices of Deprivation 2010 & 2015, Crown Copyright
1
7
1615
16 15
19
26
22
0
1 34
1113
28
3938
1 2 3 4 5 6 7 8 9 10
Decile
2015
2010
Less deprivedMore deprived
31
Education, Skills and Training Deprivation
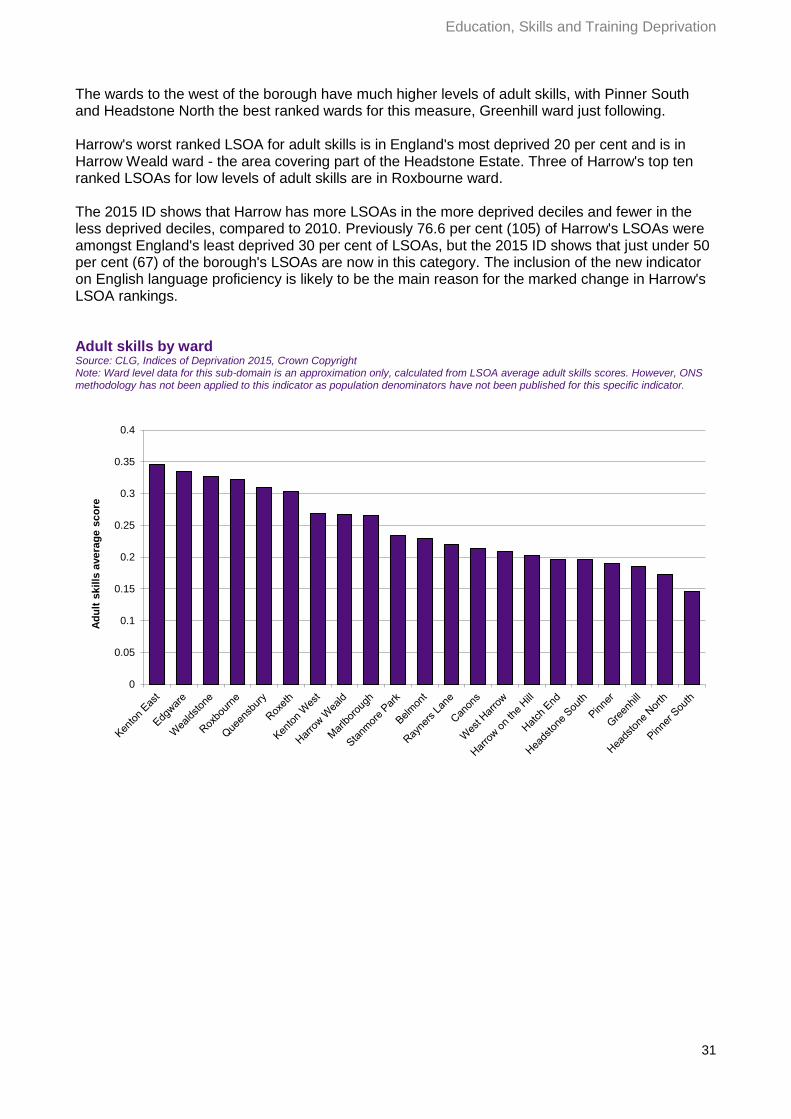
The wards to the west of the borough have much higher levels of adult skills, with Pinner South and Headstone North the best ranked wards for this measure, Greenhill ward just following. Harrow's worst ranked LSOA for adult skills is in England's most deprived 20 per cent and is in Harrow Weald ward - the area covering part of the Headstone Estate. Three of Harrow's top ten ranked LSOAs for low levels of adult skills are in Roxbourne ward. The 2015 ID shows that Harrow has more LSOAs in the more deprived deciles and fewer in the less deprived deciles, compared to 2010. Previously 76.6 per cent (105) of Harrow's LSOAs were amongst England's least deprived 30 per cent of LSOAs, but the 2015 ID shows that just under 50 per cent (67) of the borough's LSOAs are now in this category. The inclusion of the new indicator on English language proficiency is likely to be the main reason for the marked change in Harrow's LSOA rankings. Adult skills by ward Source: CLG, Indices of Deprivation 2015, Crown Copyright Note: Ward level data for this sub-domain is an approximation only, calculated from LSOA average adult skills scores. However, ONS methodology has not been applied to this indicator as population denominators have not been published for this specific indicator.
0
0.05
0.1
0.15
0.2
0.25
0.3
0.35
0.4
Ad
ult
sk
ills
avera
ge s
co
re

32
Education, Skills and Training Deprivation
Children and Young People Sub-Domain
Harrow performs very well for this sub-domain on Children and Young People, with none of Harrow's LSOAs in the country's most deprived 20 per cent of LSOAs
55 per cent (75) of the borough's LSOAs are in the least deprived 20 per cent of LSOAs for this sub-domain
There are small clusters of more deprived LSOAs dispersed across the borough, but Wealdstone ranks highest on a ward basis
33
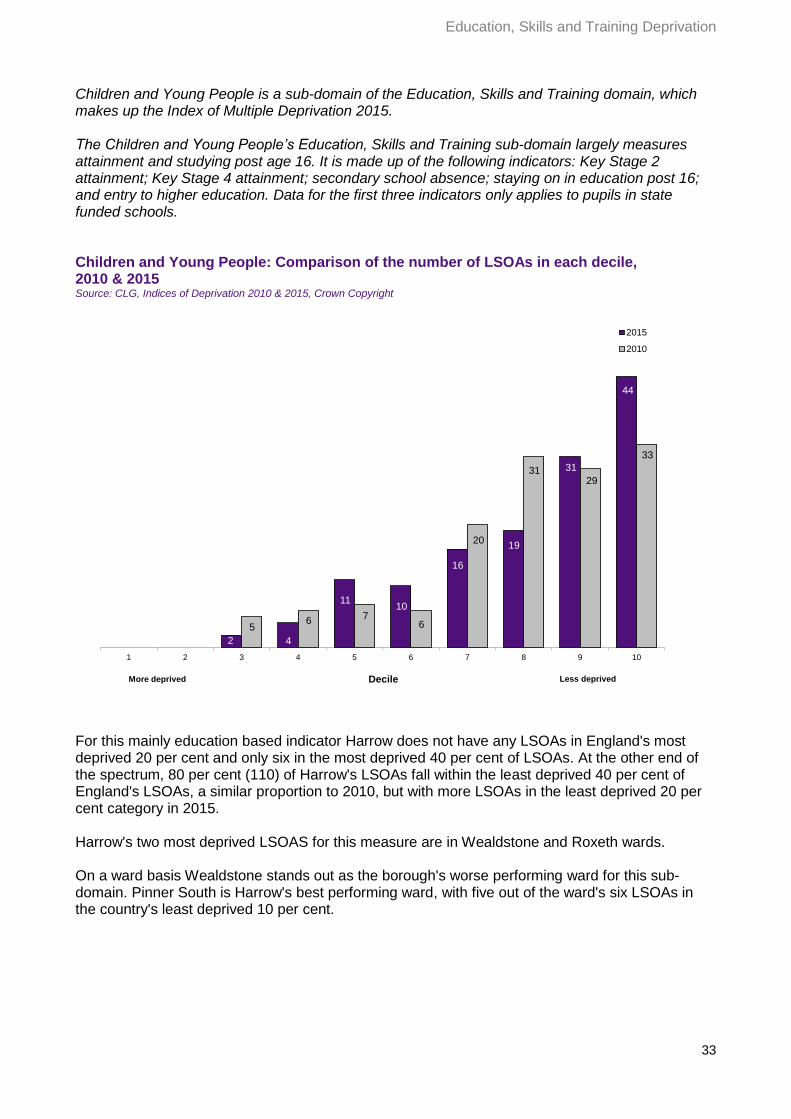
Education, Skills and Training Deprivation Children and Young People is a sub-domain of the Education, Skills and Training domain, which makes up the Index of Multiple Deprivation 2015. The Children and Young People’s Education, Skills and Training sub-domain largely measures attainment and studying post age 16. It is made up of the following indicators: Key Stage 2 attainment; Key Stage 4 attainment; secondary school absence; staying on in education post 16; and entry to higher education. Data for the first three indicators only applies to pupils in state funded schools. Children and Young People: Comparison of the number of LSOAs in each decile, 2010 & 2015 Source: CLG, Indices of Deprivation 2010 & 2015, Crown Copyright
1 2 4
1110
16
19
31
44
0
56 7
6
20
3129
33
1 2 3 4 5 6 7 8 9 10
Decile
2015
2010
Less deprivedMore deprived
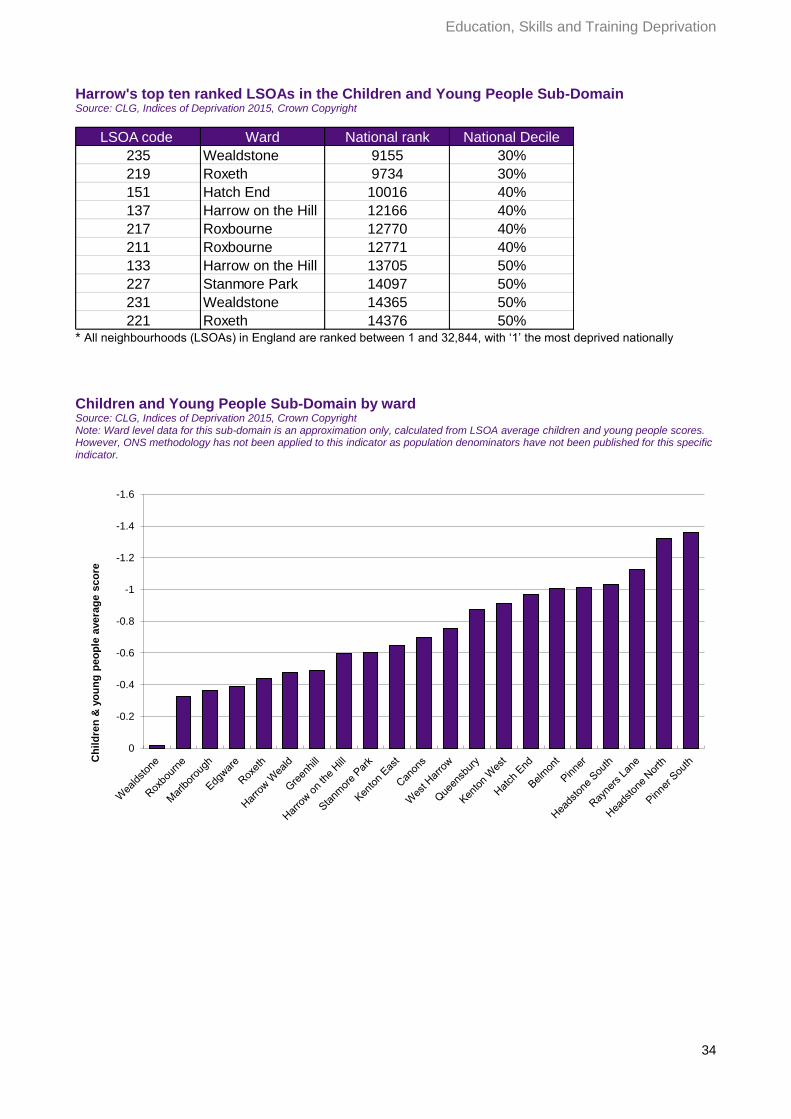
For this mainly education based indicator Harrow does not have any LSOAs in England's most deprived 20 per cent and only six in the most deprived 40 per cent of LSOAs. At the other end of the spectrum, 80 per cent (110) of Harrow's LSOAs fall within the least deprived 40 per cent of England's LSOAs, a similar proportion to 2010, but with more LSOAs in the least deprived 20 per cent category in 2015. Harrow's two most deprived LSOAS for this measure are in Wealdstone and Roxeth wards. On a ward basis Wealdstone stands out as the borough's worse performing ward for this sub-domain. Pinner South is Harrow's best performing ward, with five out of the ward's six LSOAs in the country's least deprived 10 per cent.
34
Education, Skills and Training Deprivation Harrow's top ten ranked LSOAs in the Children and Young People Sub-Domain Source: CLG, Indices of Deprivation 2015, Crown Copyright
LSOA code Ward National rank National Decile
235 Wealdstone 9155 30%
219 Roxeth 9734 30%
151 Hatch End 10016 40%
137 Harrow on the Hill 12166 40%
217 Roxbourne 12770 40%
211 Roxbourne 12771 40%
133 Harrow on the Hill 13705 50%
227 Stanmore Park 14097 50%
231 Wealdstone 14365 50%
221 Roxeth 14376 50% * All neighbourhoods (LSOAs) in England are ranked between 1 and 32,844, with ‘1’ the most deprived nationally
Children and Young People Sub-Domain by ward Source: CLG, Indices of Deprivation 2015, Crown Copyright Note: Ward level data for this sub-domain is an approximation only, calculated from LSOA average children and young people scores. However, ONS methodology has not been applied to this indicator as population denominators have not been published for this specific indicator.
-1.6
-1.4
-1.2
-1
-0.8
-0.6
-0.4
-0.2
0
Ch
ild
ren
& y
ou
ng
pe
op
le a
ve
rag
e s
co
re
35
Living Environment Deprivation
Living Environment Deprivation
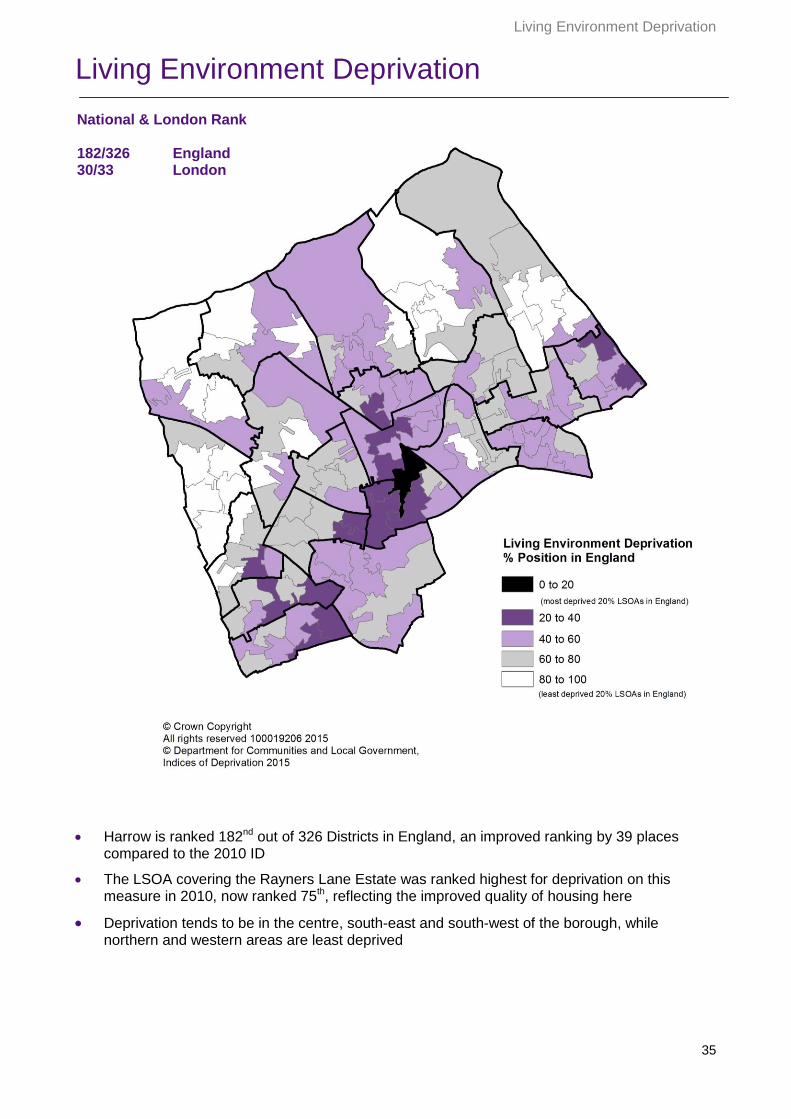
Harrow is ranked 182nd out of 326 Districts in England, an improved ranking by 39 places
compared to the 2010 ID
The LSOA covering the Rayners Lane Estate was ranked highest for deprivation on this measure in 2010, now ranked 75th, reflecting the improved quality of housing here
Deprivation tends to be in the centre, south-east and south-west of the borough, while northern and western areas are least deprived
National & London Rank 182/326 England 30/33 London
36
Living Environment Deprivation
The Living Environment Deprivation Domain measures the quality of the local environment. The indicators fall into two sub-domains. The ‘indoors’ living environment measures the quality of housing; while the ‘outdoors’ living environment contains measures of air quality and road traffic accidents. The indicators in the domain remain the same as in the Indices of Deprivation 2010 and include:
Housing in poor condition
Houses without central heating
Air quality
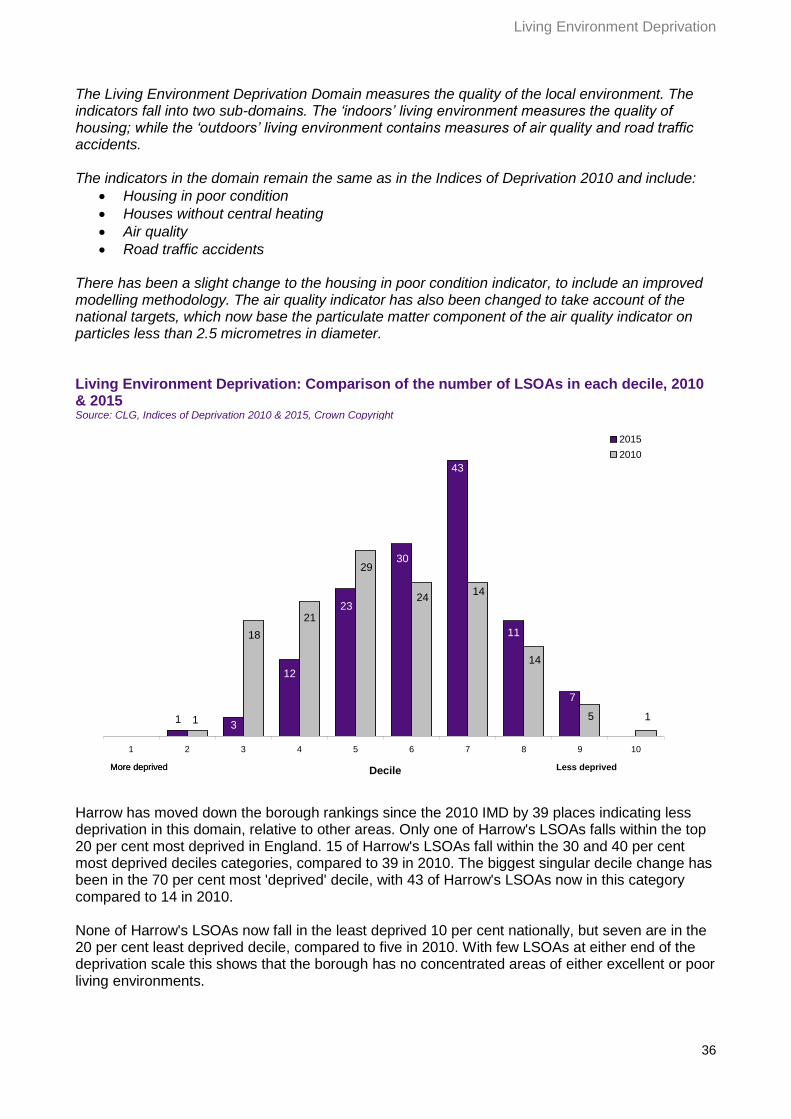
Road traffic accidents There has been a slight change to the housing in poor condition indicator, to include an improved modelling methodology. The air quality indicator has also been changed to take account of the national targets, which now base the particulate matter component of the air quality indicator on particles less than 2.5 micrometres in diameter. Living Environment Deprivation: Comparison of the number of LSOAs in each decile, 2010 & 2015
Source: CLG, Indices of Deprivation 2010 & 2015, Crown Copyright
0 13
12
23
30
43
11
7
0
0 1
18
21
29
2414
14
5 1
1 2 3 4 5 6 7 8 9 10
Decile
2015
2010
More deprivedMore deprived Less deprived
Harrow has moved down the borough rankings since the 2010 IMD by 39 places indicating less deprivation in this domain, relative to other areas. Only one of Harrow's LSOAs falls within the top 20 per cent most deprived in England. 15 of Harrow's LSOAs fall within the 30 and 40 per cent most deprived deciles categories, compared to 39 in 2010. The biggest singular decile change has been in the 70 per cent most 'deprived' decile, with 43 of Harrow's LSOAs now in this category compared to 14 in 2010. None of Harrow's LSOAs now fall in the least deprived 10 per cent nationally, but seven are in the 20 per cent least deprived decile, compared to five in 2010. With few LSOAs at either end of the deprivation scale this shows that the borough has no concentrated areas of either excellent or poor living environments.
37
Living Environment Deprivation
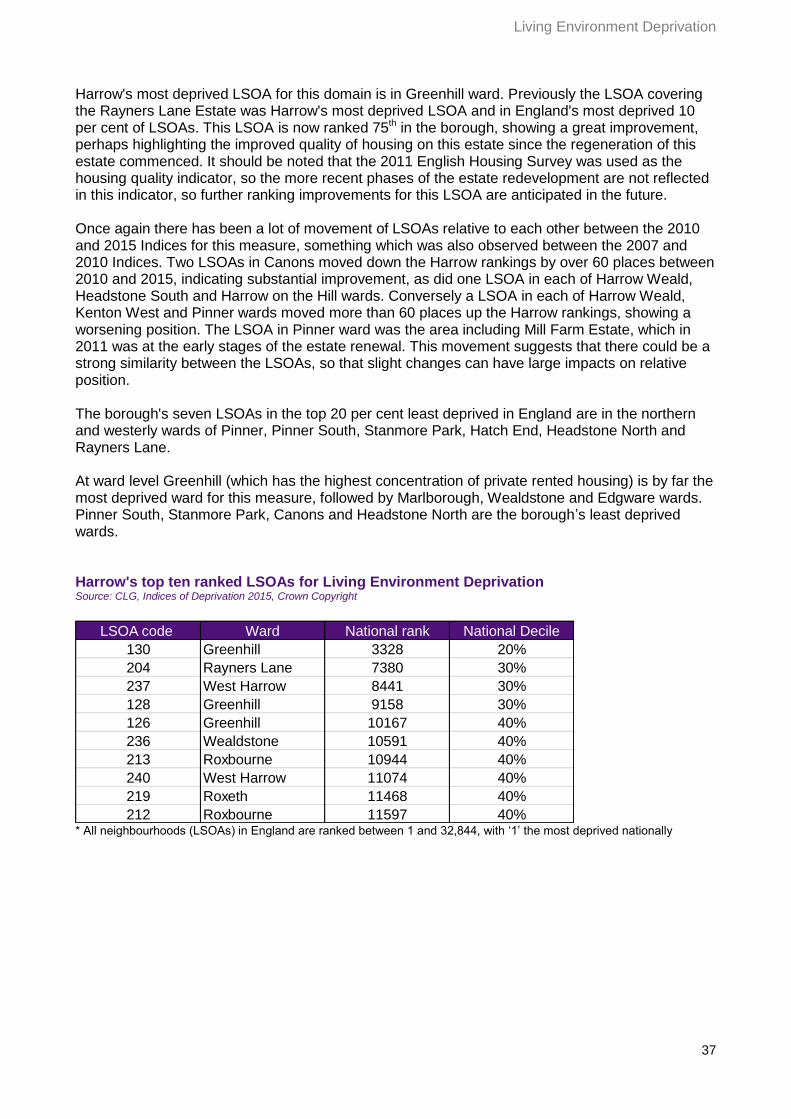
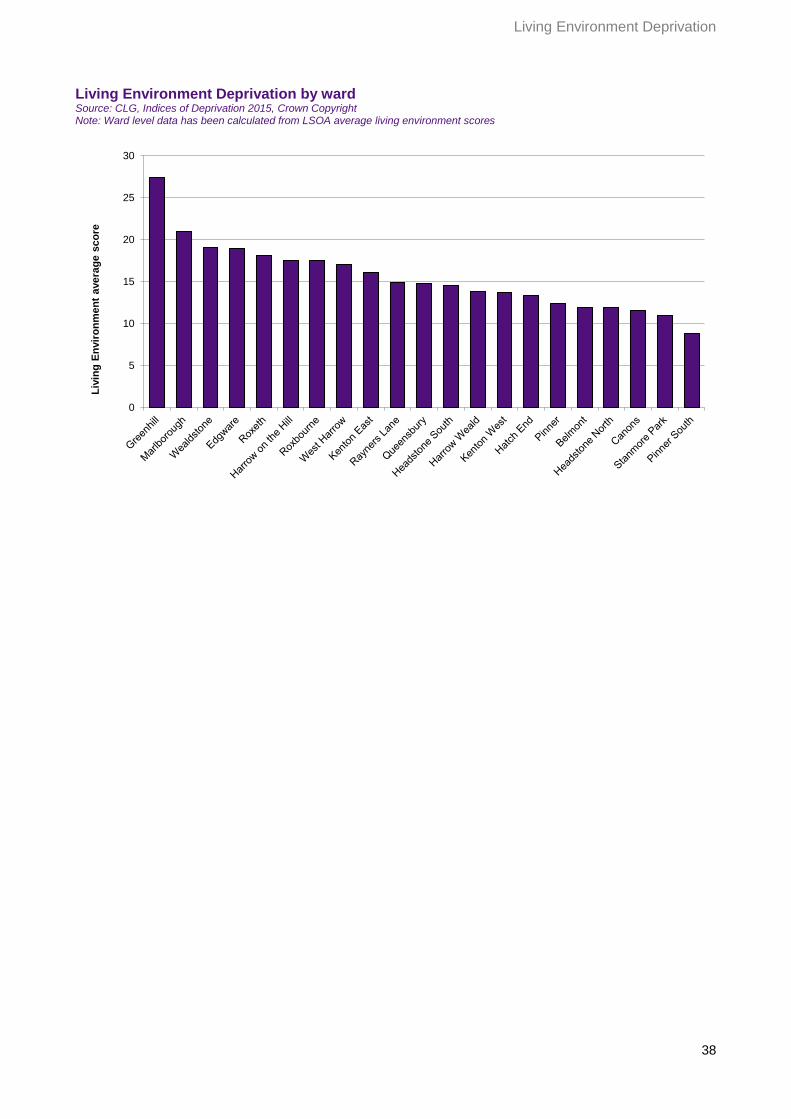
Harrow's most deprived LSOA for this domain is in Greenhill ward. Previously the LSOA covering the Rayners Lane Estate was Harrow's most deprived LSOA and in England's most deprived 10 per cent of LSOAs. This LSOA is now ranked 75th in the borough, showing a great improvement, perhaps highlighting the improved quality of housing on this estate since the regeneration of this estate commenced. It should be noted that the 2011 English Housing Survey was used as the housing quality indicator, so the more recent phases of the estate redevelopment are not reflected in this indicator, so further ranking improvements for this LSOA are anticipated in the future. Once again there has been a lot of movement of LSOAs relative to each other between the 2010 and 2015 Indices for this measure, something which was also observed between the 2007 and 2010 Indices. Two LSOAs in Canons moved down the Harrow rankings by over 60 places between 2010 and 2015, indicating substantial improvement, as did one LSOA in each of Harrow Weald, Headstone South and Harrow on the Hill wards. Conversely a LSOA in each of Harrow Weald, Kenton West and Pinner wards moved more than 60 places up the Harrow rankings, showing a worsening position. The LSOA in Pinner ward was the area including Mill Farm Estate, which in 2011 was at the early stages of the estate renewal. This movement suggests that there could be a strong similarity between the LSOAs, so that slight changes can have large impacts on relative position. The borough's seven LSOAs in the top 20 per cent least deprived in England are in the northern and westerly wards of Pinner, Pinner South, Stanmore Park, Hatch End, Headstone North and Rayners Lane. At ward level Greenhill (which has the highest concentration of private rented housing) is by far the most deprived ward for this measure, followed by Marlborough, Wealdstone and Edgware wards. Pinner South, Stanmore Park, Canons and Headstone North are the borough’s least deprived wards. Harrow's top ten ranked LSOAs for Living Environment Deprivation Source: CLG, Indices of Deprivation 2015, Crown Copyright
LSOA code Ward National rank National Decile
130 Greenhill 3328 20%
204 Rayners Lane 7380 30%
237 West Harrow 8441 30%
128 Greenhill 9158 30%
126 Greenhill 10167 40%
236 Wealdstone 10591 40%
213 Roxbourne 10944 40%
240 West Harrow 11074 40%
219 Roxeth 11468 40%
212 Roxbourne 11597 40% * All neighbourhoods (LSOAs) in England are ranked between 1 and 32,844, with ‘1’ the most deprived nationally
38
Living Environment Deprivation
Living Environment Deprivation by ward Source: CLG, Indices of Deprivation 2015, Crown Copyright Note: Ward level data has been calculated from LSOA average living environment scores
0
5
10
15
20
25
30
Liv
ing
En
vir
on
men
t avera
ge s
co
re

39
Living Environment Deprivation
'Indoors' Living Sub-Domain
Harrow has fewer LSOAs in the most deprived deciles for this indicator, compared to the 2010 ID
None of Harrow's deciles are in the most deprived 10 per cent of LSOAs in England. The LSOA covering the Rayners Lane Estate is now ranked 58th for this indicator - previously this was the borough's most deprived indicator and ranked 1st
Pockets of deprivation are more concentrated in the central wards of the borough and to the south-west
40
Living Environment Deprivation
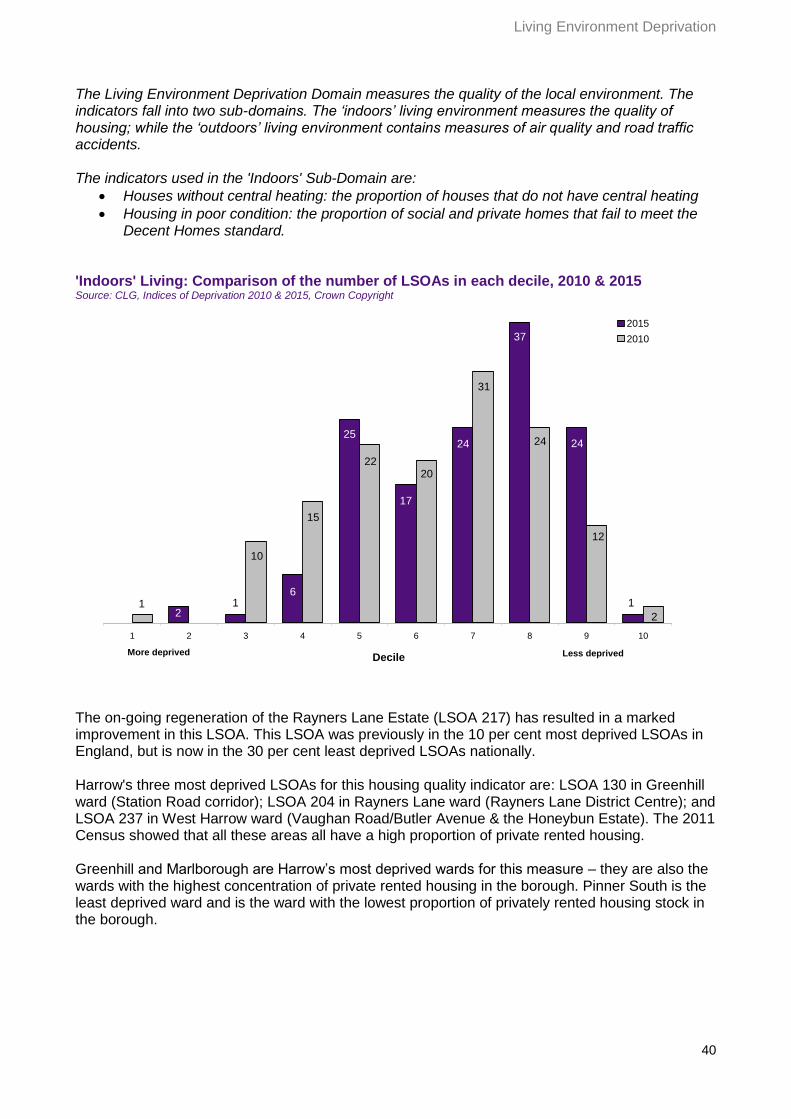
The Living Environment Deprivation Domain measures the quality of the local environment. The indicators fall into two sub-domains. The ‘indoors’ living environment measures the quality of housing; while the ‘outdoors’ living environment contains measures of air quality and road traffic accidents. The indicators used in the 'Indoors' Sub-Domain are:
Houses without central heating: the proportion of houses that do not have central heating
Housing in poor condition: the proportion of social and private homes that fail to meet the Decent Homes standard.
'Indoors' Living: Comparison of the number of LSOAs in each decile, 2010 & 2015
Source: CLG, Indices of Deprivation 2010 & 2015, Crown Copyright
1
24
37
24
17
25
61
2
0
2
12
24
31
2022
15
10
01
1 2 3 4 5 6 7 8 9 10
Decile
2015
2010
Less deprivedMore deprived
The on-going regeneration of the Rayners Lane Estate (LSOA 217) has resulted in a marked improvement in this LSOA. This LSOA was previously in the 10 per cent most deprived LSOAs in England, but is now in the 30 per cent least deprived LSOAs nationally. Harrow's three most deprived LSOAs for this housing quality indicator are: LSOA 130 in Greenhill ward (Station Road corridor); LSOA 204 in Rayners Lane ward (Rayners Lane District Centre); and LSOA 237 in West Harrow ward (Vaughan Road/Butler Avenue & the Honeybun Estate). The 2011 Census showed that all these areas all have a high proportion of private rented housing. Greenhill and Marlborough are Harrow’s most deprived wards for this measure – they are also the wards with the highest concentration of private rented housing in the borough. Pinner South is the least deprived ward and is the ward with the lowest proportion of privately rented housing stock in the borough.
41
Living Environment Deprivation
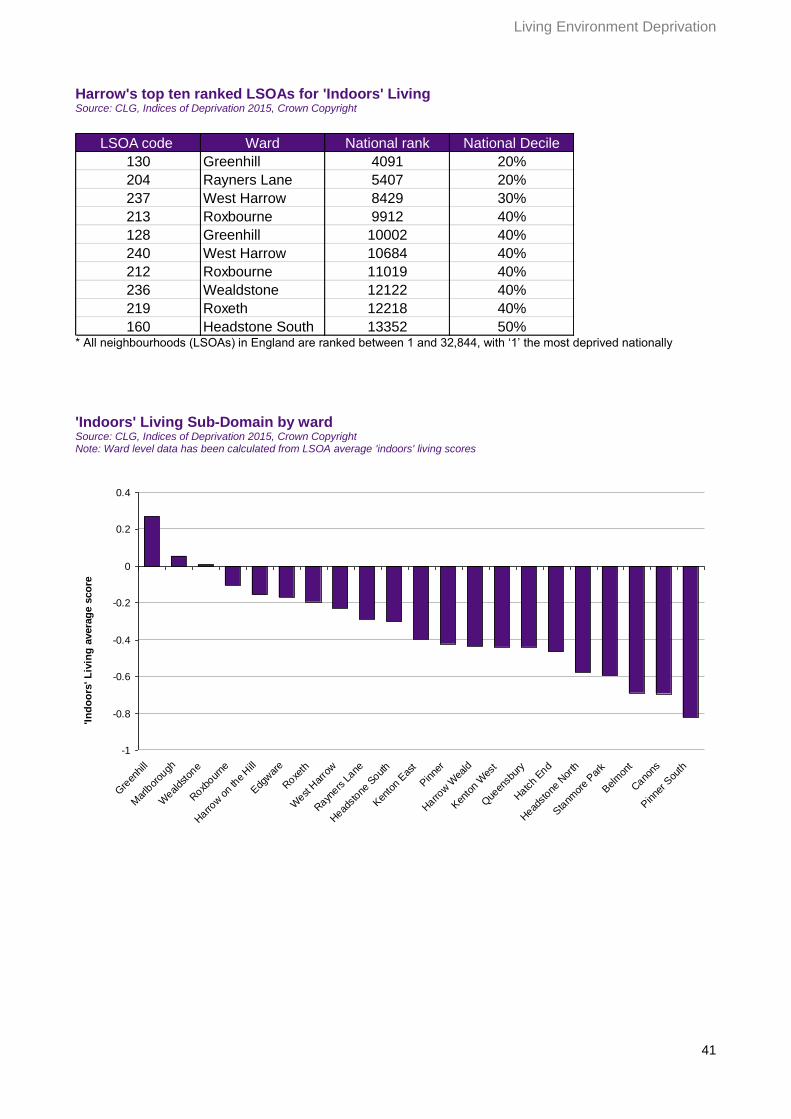
Harrow's top ten ranked LSOAs for 'Indoors' Living Source: CLG, Indices of Deprivation 2015, Crown Copyright
LSOA code Ward National rank National Decile
130 Greenhill 4091 20%
204 Rayners Lane 5407 20%
237 West Harrow 8429 30%
213 Roxbourne 9912 40%
128 Greenhill 10002 40%
240 West Harrow 10684 40%
212 Roxbourne 11019 40%
236 Wealdstone 12122 40%
219 Roxeth 12218 40%
160 Headstone South 13352 50% * All neighbourhoods (LSOAs) in England are ranked between 1 and 32,844, with ‘1’ the most deprived nationally
'Indoors' Living Sub-Domain by ward Source: CLG, Indices of Deprivation 2015, Crown Copyright Note: Ward level data has been calculated from LSOA average 'indoors' living scores
-1
-0.8
-0.6
-0.4
-0.2
0
0.2
0.4
Gre
enhill
Mar
lbor
ough
Weal
dsto
ne
Roxb
ourne
Harro
w o
n th
e Hill
Edg
war
e
Roxe
th
West
Har
row
Rayn
ers L
ane
Head
stone
Sout
h
Ken
ton
Eas
t
Pinne
r
Harro
w W
eald
Ken
ton
Wes
t
Que
ensb
ury
Hatc
h End
Head
stone
Nor
th
Sta
nmor
e Par
k
Belm
ont
Cano
ns
Pinne
r Sou
th
'In
do
ors
' L
ivin
g a
vera
ge s
co
re

42
Living Environment Deprivation
'Outdoors' Living Sub-Domain
There have been improvements in the ‘outdoors’ living domain, with just six of Harrow’s LSOAs in the country’s most deprived 20 per cent of LSOAs, compared to 28 in 2010
None of Harrow LSOAs are in England’s least deprived 10 per cent of LSOAs
Harrow, like all London Boroughs, is worse than average for deprivation concerned with the outdoors living environment
‘Outdoors’ deprivation is worse in Harrow compared to ‘indoors’ deprivation
43
Living Environment Deprivation
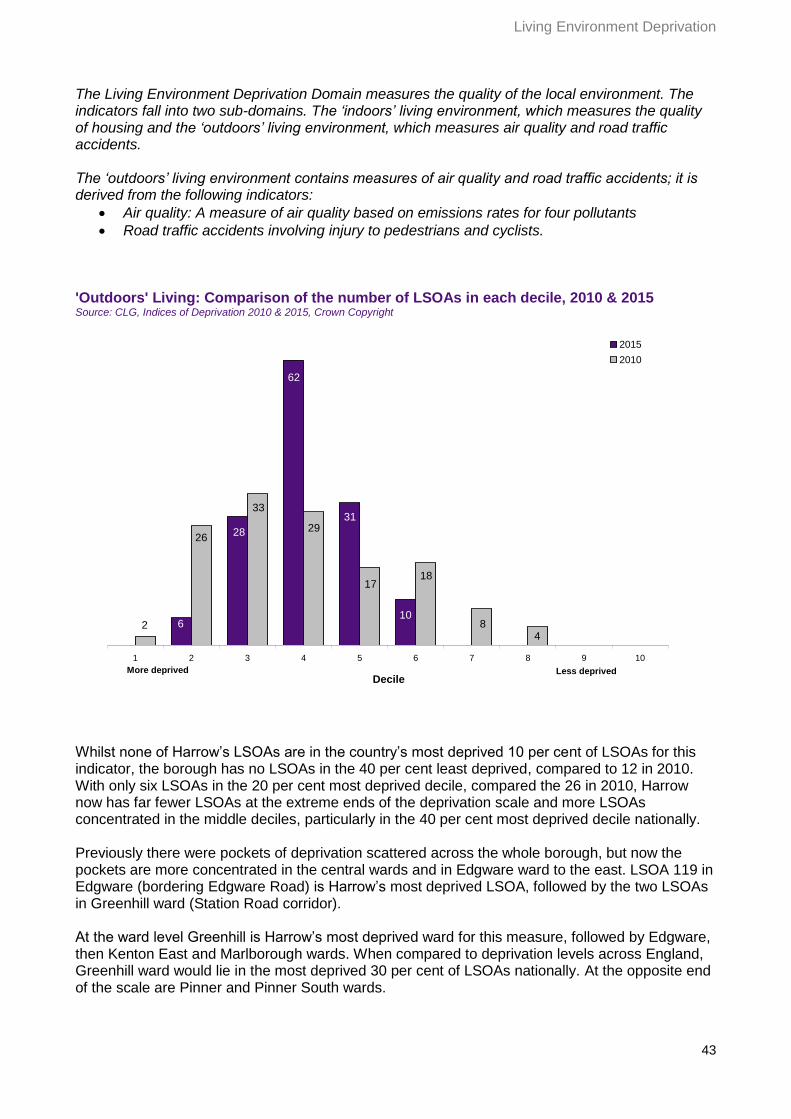
The Living Environment Deprivation Domain measures the quality of the local environment. The indicators fall into two sub-domains. The ‘indoors’ living environment, which measures the quality of housing and the ‘outdoors’ living environment, which measures air quality and road traffic accidents. The ‘outdoors’ living environment contains measures of air quality and road traffic accidents; it is derived from the following indicators:
Air quality: A measure of air quality based on emissions rates for four pollutants
Road traffic accidents involving injury to pedestrians and cyclists. 'Outdoors' Living: Comparison of the number of LSOAs in each decile, 2010 & 2015
Source: CLG, Indices of Deprivation 2010 & 2015, Crown Copyright
0
6
28
62
31
10
0 0 0
02
26
33
29
1718
84
0 01 2 3 4 5 6 7 8 9 10
Decile
2015
2010
Less deprivedMore deprived
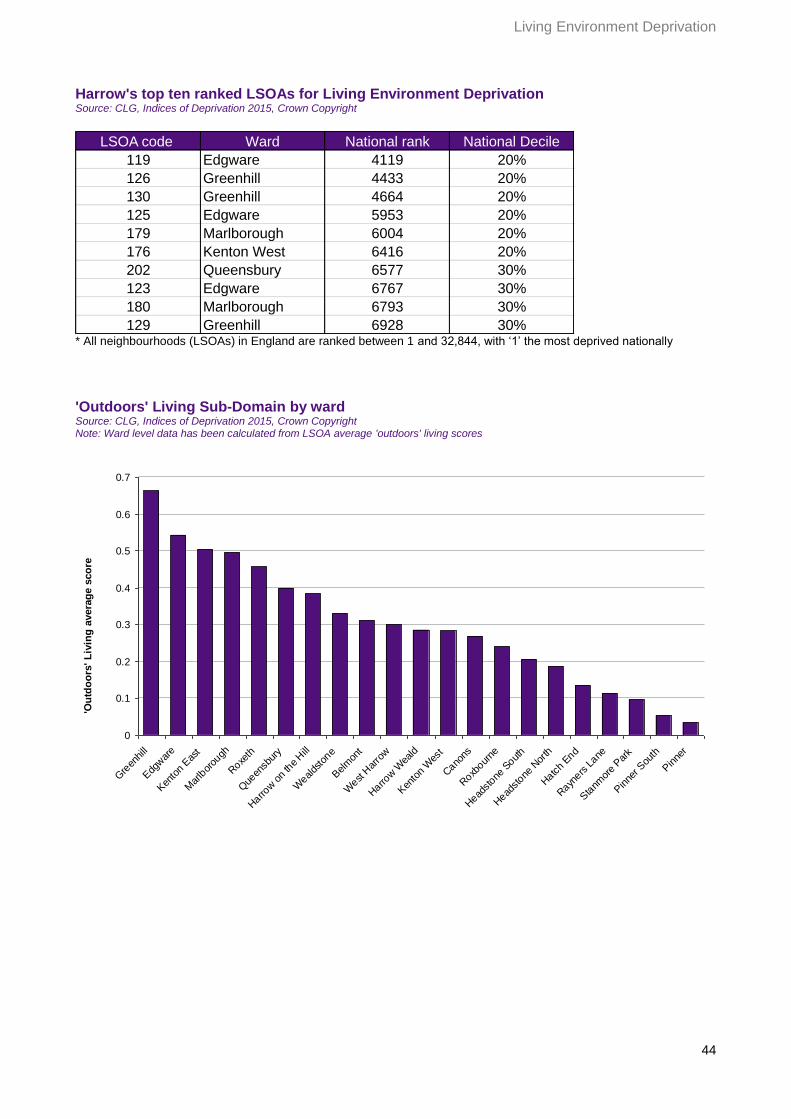
Whilst none of Harrow’s LSOAs are in the country’s most deprived 10 per cent of LSOAs for this indicator, the borough has no LSOAs in the 40 per cent least deprived, compared to 12 in 2010. With only six LSOAs in the 20 per cent most deprived decile, compared the 26 in 2010, Harrow now has far fewer LSOAs at the extreme ends of the deprivation scale and more LSOAs concentrated in the middle deciles, particularly in the 40 per cent most deprived decile nationally. Previously there were pockets of deprivation scattered across the whole borough, but now the pockets are more concentrated in the central wards and in Edgware ward to the east. LSOA 119 in Edgware (bordering Edgware Road) is Harrow’s most deprived LSOA, followed by the two LSOAs in Greenhill ward (Station Road corridor). At the ward level Greenhill is Harrow’s most deprived ward for this measure, followed by Edgware, then Kenton East and Marlborough wards. When compared to deprivation levels across England, Greenhill ward would lie in the most deprived 30 per cent of LSOAs nationally. At the opposite end of the scale are Pinner and Pinner South wards.
44
Living Environment Deprivation
Harrow's top ten ranked LSOAs for Living Environment Deprivation Source: CLG, Indices of Deprivation 2015, Crown Copyright
LSOA code Ward National rank National Decile
119 Edgware 4119 20%
126 Greenhill 4433 20%
130 Greenhill 4664 20%
125 Edgware 5953 20%
179 Marlborough 6004 20%
176 Kenton West 6416 20%
202 Queensbury 6577 30%
123 Edgware 6767 30%
180 Marlborough 6793 30%
129 Greenhill 6928 30% * All neighbourhoods (LSOAs) in England are ranked between 1 and 32,844, with ‘1’ the most deprived nationally
'Outdoors' Living Sub-Domain by ward Source: CLG, Indices of Deprivation 2015, Crown Copyright Note: Ward level data has been calculated from LSOA average 'outdoors' living scores
0
0.1
0.2
0.3
0.4
0.5
0.6
0.7
Gre
enhill
Edg
war
e
Ken
ton
Eas
t
Mar
lbor
ough
Roxe
th
Que
ensb
ury
Harro
w o
n th
e Hill
Weal
dsto
ne
Belm
ont
West
Har
row
Harro
w W
eald
Ken
ton
Wes
t
Cano
ns
Roxb
ourne
Head
stone
Sout
h
Head
stone
Nor
th
Hatc
h End
Rayn
ers L
ane
Sta
nmor
e Par
k
Pinne
r Sou
th
Pinne
r
'Ou
tdo
ors
' L
ivin
g a
vera
ge s
co
re

45
Barriers to Housing and Services
Barriers to Housing and Services
Harrow performs worse for barriers to Housing and Services than any other deprivation indicator, but London generally has by far the highest levels of deprivation for this indicator, compared to all other regions in England
Harrow is ranked 48th out of 326 Districts in England, with an unchanged ranking compared to 2010
Deprivation is more concentrated in the centre, north and east of the borough
National & London Rank 48/326 England 22/33 London

46
Barriers to Housing and Services
The Barriers to Housing and Services Domain measures the physical and financial accessibility of housing and local services. The indicators fall into two sub-domains: ‘geographical barriers’, which relate to the physical proximity of local services, and ‘wider barriers’ which includes issues relating to access to housing, such as affordability and homelessness, as well as overcrowding. The indicators used in this domain are described in detail on Pages 49 and 52. There have been a number of modifications to the indicators used in this domain. The indicators in the domain remain the same as in the Indices of Deprivation 2010, apart from changes to the housing affordability indicator including:
Broadening the measure to include affordability of the private rental market;
Improving the income estimation methodology, and producing the indicator at LSOA level, rather than local authority districts; and
Using local Housing Market Areas as the reference area Other changes include strengthening the homelessness indicator, by using the average of three years’ worth of data, instead on one year used previously. Barriers to Housing and Services: Comparison of the number of LSOAs in each decile, 2010 & 2015 Source: CLG, Indices of Deprivation 2010 & 2015, Crown Copyright
6
15
30 30 31
18
5 1 1
0
7
21
55
45
7 20 0 0 0
1 2 3 4 5 6 7 8 9 10
Decile
2015
2010
More deprivedMore deprived Less deprived
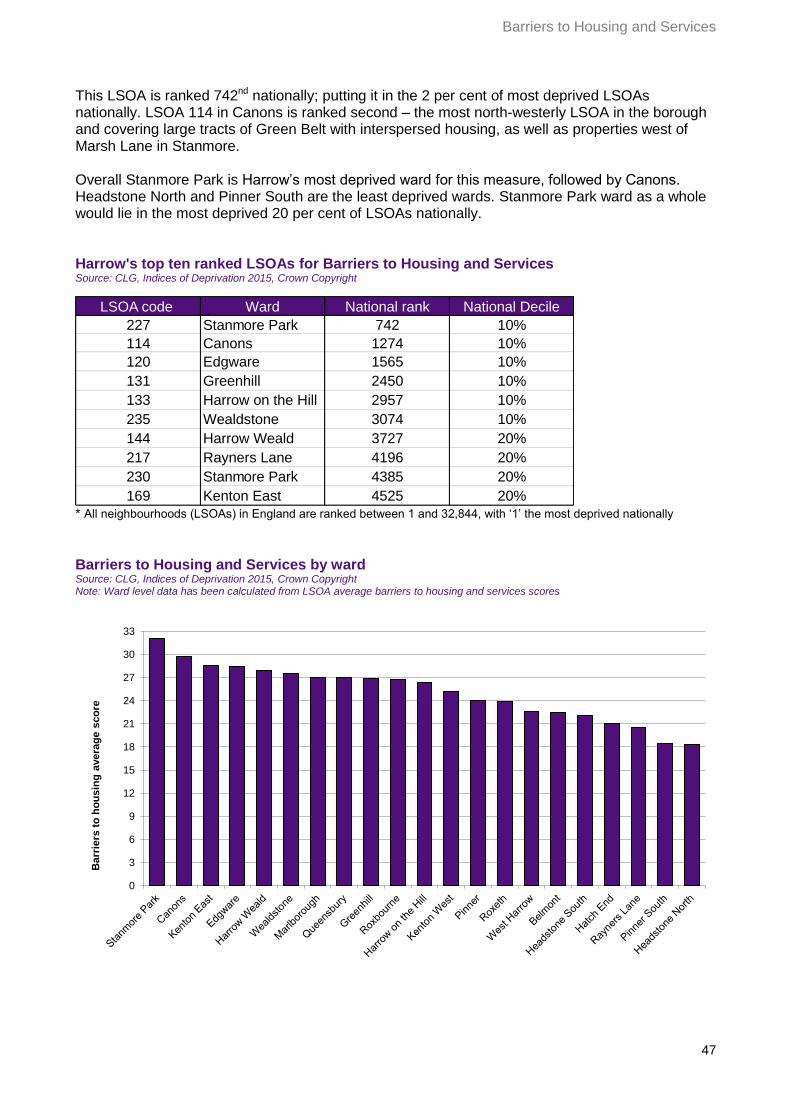
Barriers to Housing and Services is the indicator in which Harrow performs worst. Harrow has six LSOAs in the 10 per cent most deprived nationally, just one less than in 2010. There has been a slight improvement at the least deprived end of the scale, with seven LSOAs overall in the least deprived 40 per cent of LSOAs nationally, compared to none in 2010. 93 per cent of all LSOAs in Harrow in 2010 were in the 40 per cent most deprived in the country; this figure is much improved now, at 59 per cent. Nationally Harrow’s ranking has remained 48th over the last two IDs. Particular areas of concern are: wards in the north-east of the borough; in the central corridor of the borough; to the east, and pockets in the south-west. At the LSOA level Harrow’s most deprived LSOA for this measure is LSOA 227 in Stanmore Park ward, an area covering three council estates – Cottesmore, Woodlands and Woodlands Drive.
47
Barriers to Housing and Services
This LSOA is ranked 742nd nationally; putting it in the 2 per cent of most deprived LSOAs nationally. LSOA 114 in Canons is ranked second – the most north-westerly LSOA in the borough and covering large tracts of Green Belt with interspersed housing, as well as properties west of Marsh Lane in Stanmore. Overall Stanmore Park is Harrow’s most deprived ward for this measure, followed by Canons. Headstone North and Pinner South are the least deprived wards. Stanmore Park ward as a whole would lie in the most deprived 20 per cent of LSOAs nationally. Harrow's top ten ranked LSOAs for Barriers to Housing and Services Source: CLG, Indices of Deprivation 2015, Crown Copyright
LSOA code Ward National rank National Decile
227 Stanmore Park 742 10%
114 Canons 1274 10%
120 Edgware 1565 10%
131 Greenhill 2450 10%
133 Harrow on the Hill 2957 10%
235 Wealdstone 3074 10%
144 Harrow Weald 3727 20%
217 Rayners Lane 4196 20%
230 Stanmore Park 4385 20%
169 Kenton East 4525 20% * All neighbourhoods (LSOAs) in England are ranked between 1 and 32,844, with ‘1’ the most deprived nationally
Barriers to Housing and Services by ward Source: CLG, Indices of Deprivation 2015, Crown Copyright Note: Ward level data has been calculated from LSOA average barriers to housing and services scores
0
3
6
9
12
15
18
21
24
27
30
33
Barr
iers
to
ho
usin
g a
vera
ge s
co
re
48
Barriers to Housing and Services
Geographical Barriers Sub-Domain
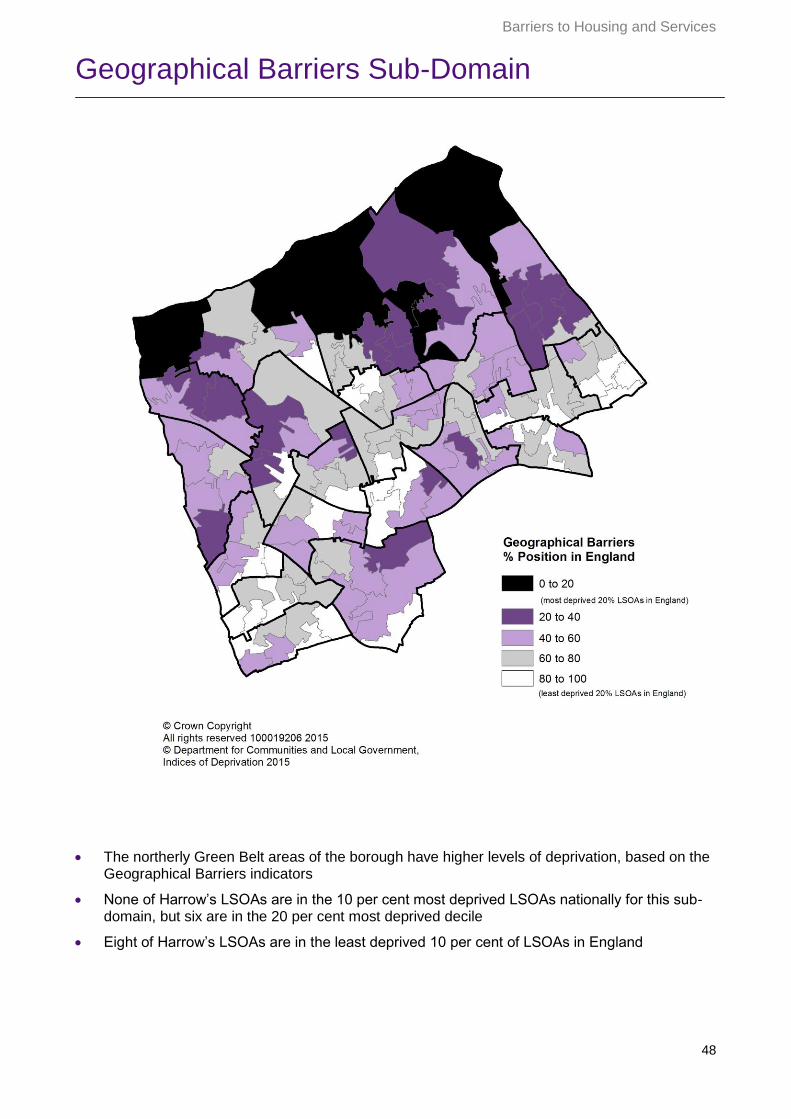
The northerly Green Belt areas of the borough have higher levels of deprivation, based on the Geographical Barriers indicators
None of Harrow’s LSOAs are in the 10 per cent most deprived LSOAs nationally for this sub-domain, but six are in the 20 per cent most deprived decile
Eight of Harrow’s LSOAs are in the least deprived 10 per cent of LSOAs in England

49
Barriers to Housing and Services
Geographical Barriers is a Sub-Domain of the Barriers to Housing and Services deprivation domain. The indicators used in the Geographical Barriers sub-domain are:
Road distance to a post office: A measure of the mean distance to the closest post office for people living in the LSOA
Road distance to a primary school: A measure of the mean distance to the closest primary school for people living in the LSOA
Road distance to a general store or supermarket: A measure of the mean distance to the closest supermarket or general store for people living in the LSOA
Road distance to a GP surgery: A measure of the mean distance to the closest GP surgery for people living in the LSOA
Geographical Barriers: Comparison of the number of LSOAs in each decile, 2010 & 2015 Source: CLG, Indices of Deprivation 2010 & 2015, Crown Copyright
0
6
8
11
22 22
17
23
20
8
0
7
3
6
2120
26
10
38
6
1 2 3 4 5 6 7 8 9 10
Decile
2015
2010
Less deprivedMore deprived
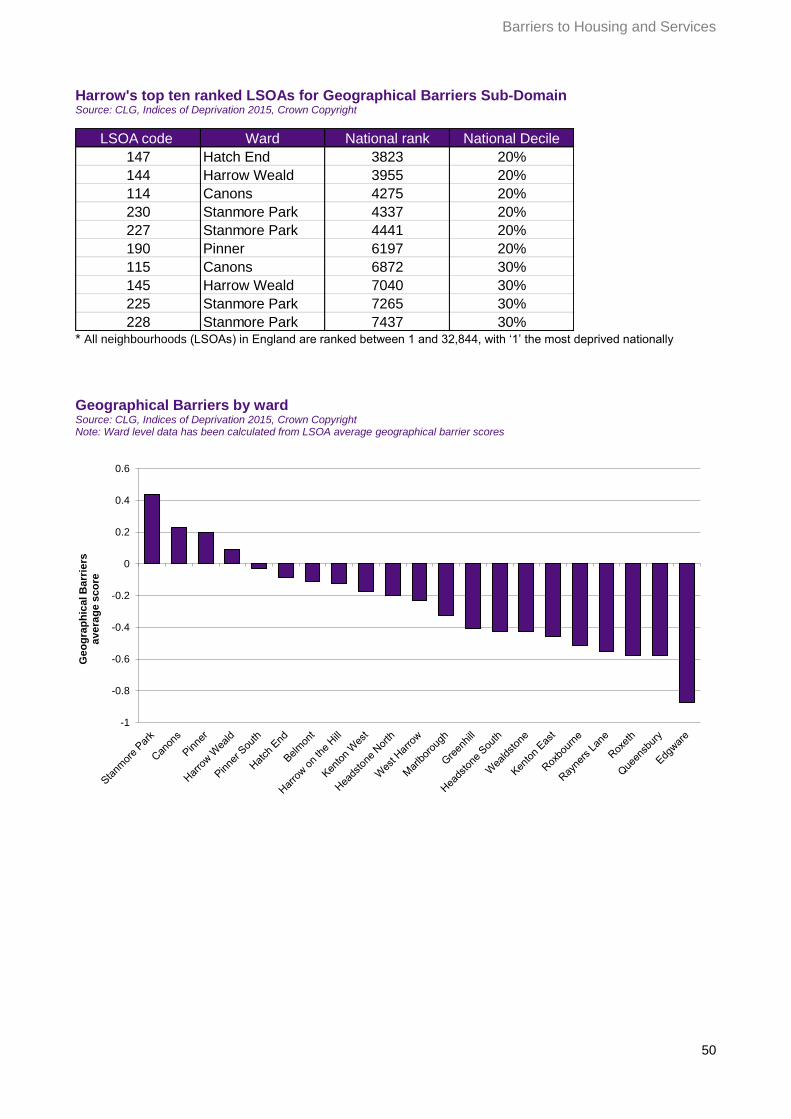
Harrow has no LSOAs in the 10 per cent most deprived category for this sub-domain, but the borough’s 137 LSOAs are widely distributed across all the other deciles. Harrow’s ‘top ten’ LSOAs, which are most deprived based on Geographical Barriers, are all situated in the wards to the north of the borough, in the more rural parts of Hatch End, Harrow Weald, Canons, Stanmore Park and Pinner. The least deprived LSOAs are largely located in areas to the south of the borough, where a higher number of services are situated. Stanmore Park is Harrow’s most deprived ward on this measure; Edgware, Queensbury and Roxeth, the least deprived.
50
Barriers to Housing and Services
Harrow's top ten ranked LSOAs for Geographical Barriers Sub-Domain Source: CLG, Indices of Deprivation 2015, Crown Copyright
LSOA code Ward National rank National Decile
147 Hatch End 3823 20%
144 Harrow Weald 3955 20%
114 Canons 4275 20%
230 Stanmore Park 4337 20%
227 Stanmore Park 4441 20%
190 Pinner 6197 20%
115 Canons 6872 30%
145 Harrow Weald 7040 30%
225 Stanmore Park 7265 30%
228 Stanmore Park 7437 30% * All neighbourhoods (LSOAs) in England are ranked between 1 and 32,844, with ‘1’ the most deprived nationally
Geographical Barriers by ward Source: CLG, Indices of Deprivation 2015, Crown Copyright Note: Ward level data has been calculated from LSOA average geographical barrier scores
-1
-0.8
-0.6
-0.4
-0.2
0
0.2
0.4
0.6
Ge
og
rap
hic
al B
arr
iers
av
era
ge
sc
ore

51
Barriers to Housing and Services
Wider Barriers Sub-Domain
Harrow has high levels of deprivation based on this Wider Barriers sub-domain, which measures household overcrowding, homelessness and housing affordability
The highest levels of deprivation are in the centre and south of the borough, with pockets in areas where some of Harrow’s highest concentration of council owned housing stock is situated
None of Harrow’s LSOAs are in England’s 30 per cent least deprived LSOAs

52
14
55
41
13
9 3 2
0 0
0
21
98
11 7
0
0 0
0 0 01 2 3 4 5 6 7 8 9 10
Decile
2015
2010
Less deprivedMore deprived
Barriers to Housing and Services
Wider Barriers is a Sub-Domain of the Barriers to Housing and Services deprivation domain. The indicators used in this domain are:
Household overcrowding: The proportion of all households in a LSOA which are judged to have insufficient space to meet the household’s needs
Homelessness: Local authority district level rate of acceptances for housing assistance under the homelessness provisions of the 1996 Housing Act, assigned to the constituent LSOA
Housing affordability: Difficulty of access to owner-occupation or the private rental market, expressed as the inability to afford to enter owner occupation or the private rental market
Wider Barriers: Comparison of the number of LSOAs in each decile, 2010 & 2015 Source: CLG, Indices of Deprivation 2010 & 2015, Crown Copyright
The 2015 ID shows a wider distribution of LSOAs across the seven most deprived deciles, compared to the 2010 distribution across the four most deprived deciles. However, Harrow has no LSOAs in the 30 per cent least deprived LSOAs in England for this housing led sub-domain. 14 of the borough’s LSOAs are in the ten per cent of England’s most deprived, an improvement since 2010 when 21 of Harrow’s LSOAs were in this category. The most deprived areas are in the south-east, south west and central parts of the borough, as well as in the areas with a higher concentration of council housing. Harrow’s most deprived LSOA is in Edgware ward, and all of Edgware’s seven LSOAs are in England’s most deprived 20 per cent of LSOAs, as are Wealdstone’s and Kenton East’s LSOAs.
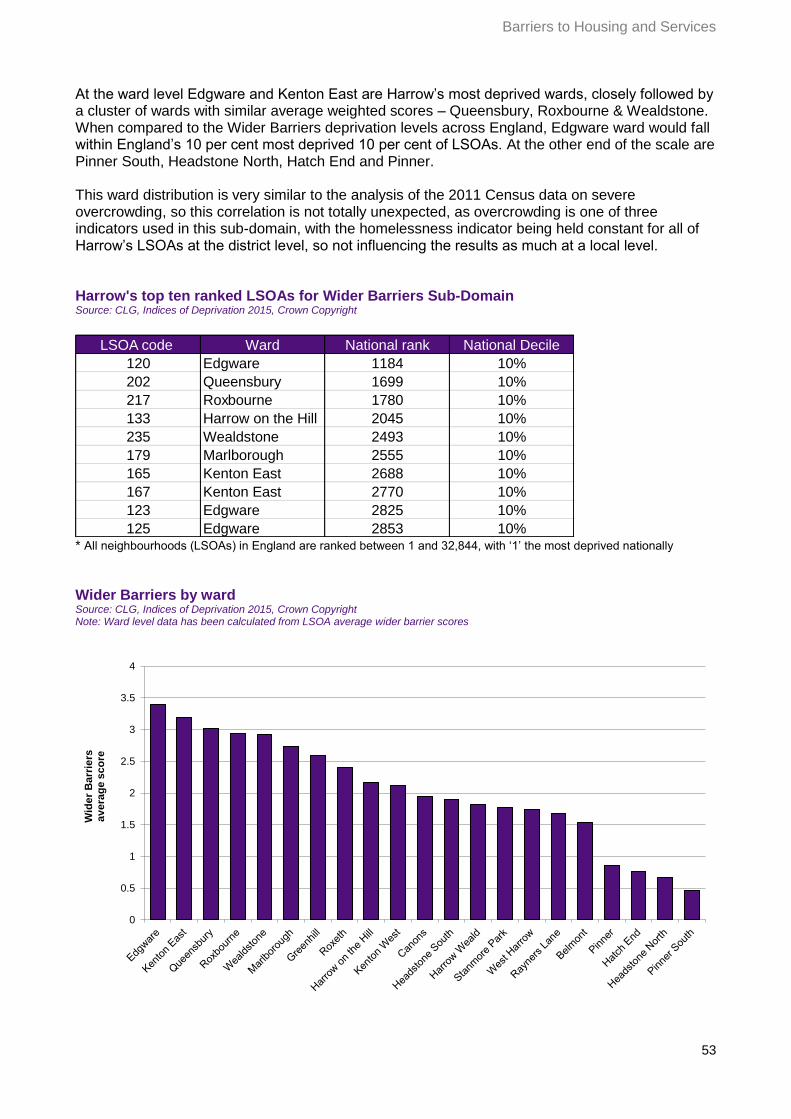
53
Barriers to Housing and Services
At the ward level Edgware and Kenton East are Harrow’s most deprived wards, closely followed by a cluster of wards with similar average weighted scores – Queensbury, Roxbourne & Wealdstone. When compared to the Wider Barriers deprivation levels across England, Edgware ward would fall within England’s 10 per cent most deprived 10 per cent of LSOAs. At the other end of the scale are Pinner South, Headstone North, Hatch End and Pinner. This ward distribution is very similar to the analysis of the 2011 Census data on severe overcrowding, so this correlation is not totally unexpected, as overcrowding is one of three indicators used in this sub-domain, with the homelessness indicator being held constant for all of Harrow’s LSOAs at the district level, so not influencing the results as much at a local level. Harrow's top ten ranked LSOAs for Wider Barriers Sub-Domain Source: CLG, Indices of Deprivation 2015, Crown Copyright
LSOA code Ward National rank National Decile
120 Edgware 1184 10%
202 Queensbury 1699 10%
217 Roxbourne 1780 10%
133 Harrow on the Hill 2045 10%
235 Wealdstone 2493 10%
179 Marlborough 2555 10%
165 Kenton East 2688 10%
167 Kenton East 2770 10%
123 Edgware 2825 10%
125 Edgware 2853 10% * All neighbourhoods (LSOAs) in England are ranked between 1 and 32,844, with ‘1’ the most deprived nationally
Wider Barriers by ward Source: CLG, Indices of Deprivation 2015, Crown Copyright Note: Ward level data has been calculated from LSOA average wider barrier scores
0
0.5
1
1.5
2
2.5
3
3.5
4
Wid
er
Ba
rrie
rsa
ve
rag
e s
co
re
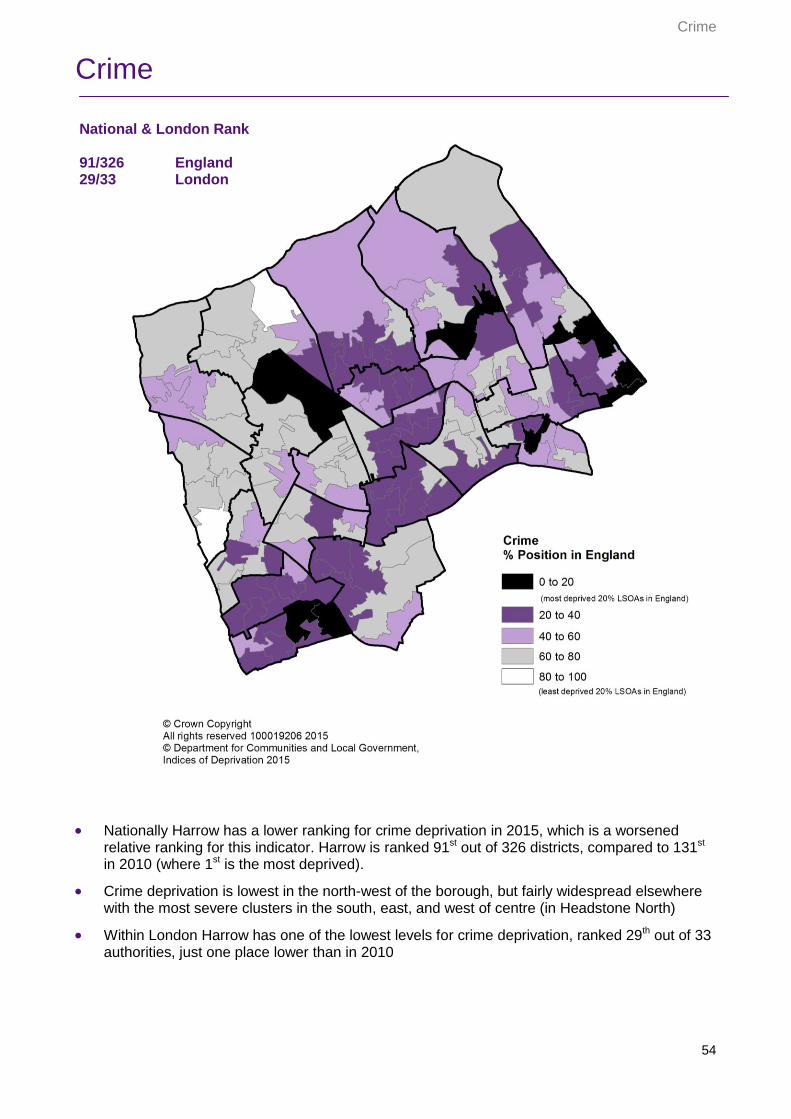
54
Crime
Crime
Nationally Harrow has a lower ranking for crime deprivation in 2015, which is a worsened relative ranking for this indicator. Harrow is ranked 91st out of 326 districts, compared to 131st in 2010 (where 1st is the most deprived).
Crime deprivation is lowest in the north-west of the borough, but fairly widespread elsewhere with the most severe clusters in the south, east, and west of centre (in Headstone North)
Within London Harrow has one of the lowest levels for crime deprivation, ranked 29th out of 33 authorities, just one place lower than in 2010
National & London Rank 91/326 England 29/33 London
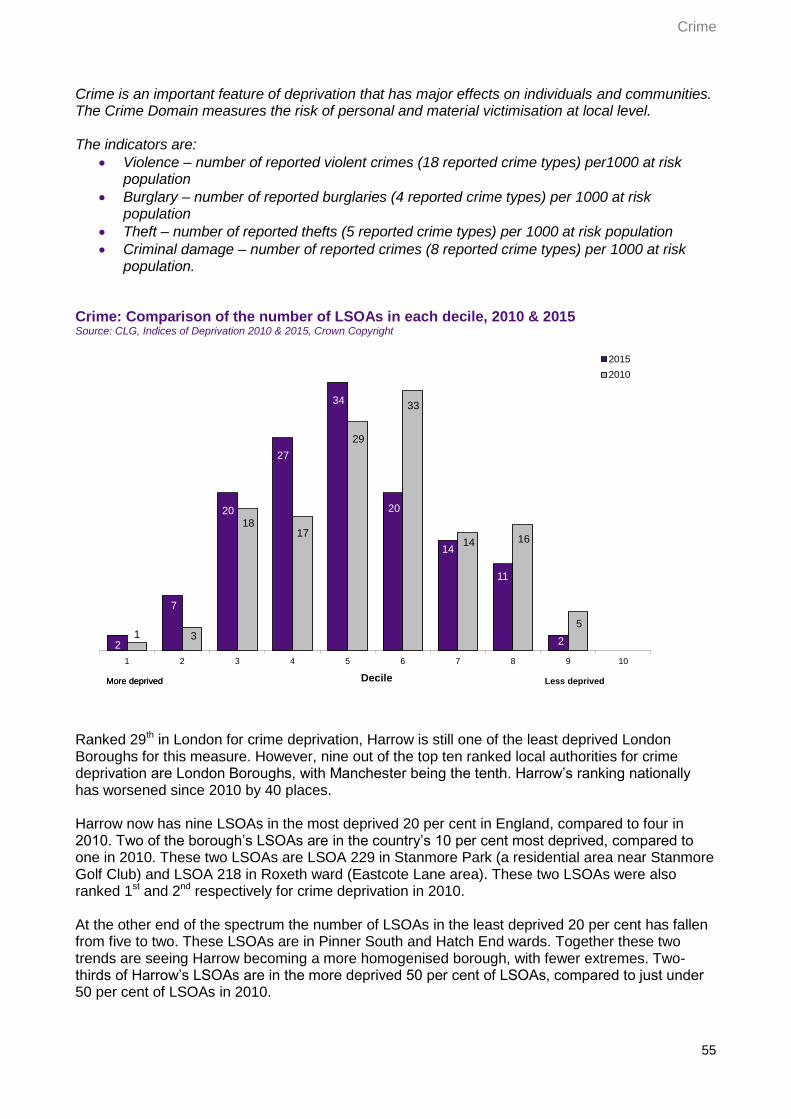
55
Crime
Crime is an important feature of deprivation that has major effects on individuals and communities. The Crime Domain measures the risk of personal and material victimisation at local level. The indicators are:
Violence – number of reported violent crimes (18 reported crime types) per1000 at risk population
Burglary – number of reported burglaries (4 reported crime types) per 1000 at risk population
Theft – number of reported thefts (5 reported crime types) per 1000 at risk population
Criminal damage – number of reported crimes (8 reported crime types) per 1000 at risk population.
Crime: Comparison of the number of LSOAs in each decile, 2010 & 2015 Source: CLG, Indices of Deprivation 2010 & 2015, Crown Copyright
2
7
20
27
34
20
14
11
2
0
1 3
1817
29
33
14 16
5
0
1 2 3 4 5 6 7 8 9 10
Decile
2015
2010
More deprivedMore deprived Less deprived
Ranked 29th in London for crime deprivation, Harrow is still one of the least deprived London Boroughs for this measure. However, nine out of the top ten ranked local authorities for crime deprivation are London Boroughs, with Manchester being the tenth. Harrow’s ranking nationally has worsened since 2010 by 40 places. Harrow now has nine LSOAs in the most deprived 20 per cent in England, compared to four in 2010. Two of the borough’s LSOAs are in the country’s 10 per cent most deprived, compared to one in 2010. These two LSOAs are LSOA 229 in Stanmore Park (a residential area near Stanmore Golf Club) and LSOA 218 in Roxeth ward (Eastcote Lane area). These two LSOAs were also ranked 1st and 2nd respectively for crime deprivation in 2010. At the other end of the spectrum the number of LSOAs in the least deprived 20 per cent has fallen from five to two. These LSOAs are in Pinner South and Hatch End wards. Together these two trends are seeing Harrow becoming a more homogenised borough, with fewer extremes. Two-thirds of Harrow’s LSOAs are in the more deprived 50 per cent of LSOAs, compared to just under 50 per cent of LSOAs in 2010.

56
Crime
At ward level Edgware and Roxeth ward are the most deprived wards for this measure, with Pinner South the least crime deprived ward. The ranking of one LSOA in Edgware ward has worsened by 60 places between 2010 and 2015. At the other end of the scale, two LSOAs in Pinner South ward show greatly improved rankings over the past five years, improving by 89 and 61 places respectively. Crime deprivation has also greatly improved in LSOA 227 in Stanmore Park ward (Cottesmore and Woodlands Estates) by 72 places. Harrow's top ten ranked LSOAs for Crime Source: CLG, Indices of Deprivation 2015, Crown Copyright
LSOA code Ward National rank National Decile
229 Stanmore Park 2993 10%
218 Roxeth 3017 10%
123 Edgware 3536 20%
154 Headstone North 3937 20%
125 Edgware 4549 20%
219 Roxeth 4872 20%
167 Kenton East 5911 20%
119 Edgware 5927 20%
118 Canons 5930 20%
212 Roxbourne 6934 30% * All neighbourhoods (LSOAs) in England are ranked between 1 and 32,844, with ‘1’ the most deprived nationally
Crime by ward Source: CLG, Indices of Deprivation 2015, Crown Copyright Note: Ward level data has been calculated from LSOA average crime scores
-0.6
-0.4
-0.2
0
0.2
0.4
0.6
Cri
me
ave
rag
e s
co
re

57
Comparisons
Harrow’s Rank in relation to the National Deprivation Rankings
The following chart is based on a ranking of all 326 local authorities in England following the 2009 local government restructure. As a result these rankings are only directly comparable with the 2010 Indices of Deprivation rankings. A lower ranking denotes a higher level of deprivation. Harrow's Rank in relation to the National Deprivation Rankings Source: CLG, Indices of Deprivation 2010 and 2015, Crown Copyright
131
143
48
316
272
213
77
66
90
184
91
182
48
303
277
217
61
140
132
213
0 50 100 150 200 250 300
Crime
Living Environment
Barriers to Housing & Services
Education, Skills & Training
Health & Disability
Employment
Income Affecting Older People
Income Affecting Children
Income
Multiple Deprivation
Ranking out of 326 Local Authorities in England
IMD
In
dic
ato
r
2015
2010
The Index for Multiple Deprivation (IMD) is an indicator which incorporates other indices to provide a summary statistic. With a ranking of 213 out of 326 Harrow is in the 65th percentile nationally, an improved ranking since its 184th place in 2010 (56th percentile nationally). The constituent elements of the IMD shown in the chart above and weighted as follows: Income Deprivation Domain 22.5% Employment Deprivation Domain 22.5% Health Deprivation & Disability Domain 13.5% Education, Skills & Training Deprivation Domain 13.5% Barriers to Housing & Services Domain 9.3% Crime Domain 9.3% Living Environment Deprivation Domain 9.3% Income Deprivation affecting Children (IDACI) and Income Deprivation affecting Older People (IDAOPI) are sub-sets of the Income Deprivation Domain.
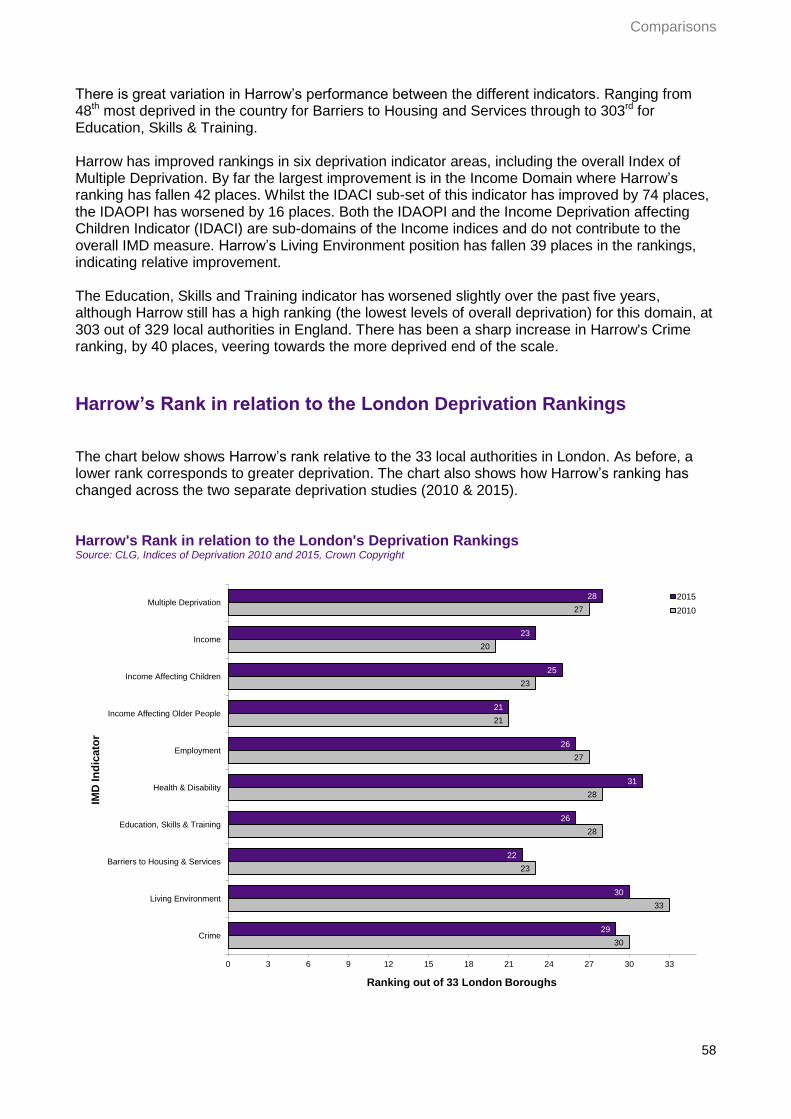
58
Comparisons
There is great variation in Harrow’s performance between the different indicators. Ranging from 48th most deprived in the country for Barriers to Housing and Services through to 303rd for Education, Skills & Training. Harrow has improved rankings in six deprivation indicator areas, including the overall Index of Multiple Deprivation. By far the largest improvement is in the Income Domain where Harrow’s ranking has fallen 42 places. Whilst the IDACI sub-set of this indicator has improved by 74 places, the IDAOPI has worsened by 16 places. Both the IDAOPI and the Income Deprivation affecting Children Indicator (IDACI) are sub-domains of the Income indices and do not contribute to the overall IMD measure. Harrow’s Living Environment position has fallen 39 places in the rankings, indicating relative improvement. The Education, Skills and Training indicator has worsened slightly over the past five years, although Harrow still has a high ranking (the lowest levels of overall deprivation) for this domain, at 303 out of 329 local authorities in England. There has been a sharp increase in Harrow's Crime ranking, by 40 places, veering towards the more deprived end of the scale.
Harrow’s Rank in relation to the London Deprivation Rankings The chart below shows Harrow’s rank relative to the 33 local authorities in London. As before, a lower rank corresponds to greater deprivation. The chart also shows how Harrow’s ranking has changed across the two separate deprivation studies (2010 & 2015). Harrow's Rank in relation to the London's Deprivation Rankings Source: CLG, Indices of Deprivation 2010 and 2015, Crown Copyright
30
33
23
28
28
27
21
23
20
27
29
30
22
26
31
26
21
25
23
28
0 3 6 9 12 15 18 21 24 27 30 33
Crime
Living Environment
Barriers to Housing & Services
Education, Skills & Training
Health & Disability
Employment
Income Affecting Older People
Income Affecting Children
Income
Multiple Deprivation
Ranking out of 33 London Boroughs
IMD
In
dic
ato
r
2015
2010

59
London Borough
IMD -
Average
score
IMD - Rank
of average
rank
(national)
London
Rank 2015
London
Rank 2010
Hackney 35.3 2 1 1
Barking and Dagenham 34.6 3 2 6
Tower Hamlets 35.7 6 3 3
Newham 32.9 8 4 2
Islington 32.5 13 5 4
Waltham Forest 30.2 15 6 5
Haringey 31.0 21 7 7
Lambeth 28.9 22 8 8
Southwark 29.5 23 9 12
Lewisham 28.6 26 10 9
Brent 26.7 39 11 11
Westminster 27.7 43 12 17
Greenwich 25.5 50 13 10
Enfield 27.0 53 14 16
Camden 25.0 69 15 14
Hammersmith and Fulham 24.4 76 16 13
Hounslow 22.5 86 17 18
Ealing 23.6 87 18 15
Croydon 23.6 91 19 20
Kensington and Chelsea 23.4 99 20 19
Redbridge 20.2 119 21 22
Wandsworth 18.3 147 22 21
Hillingdon 18.1 153 23 23
Barnet 17.8 157 24 24
Havering 17.9 166 25 25
Bexley 16.2 195 26 26
Merton 14.9 212 27 29
Harrow 14.3 213 28 27
Sutton 14.6 217 29 28
Bromley 15.2 220 30 30
City of London 13.6 226 31 32
Kingston upon Thames 11.1 278 32 31
Richmond upon Thames 10.0 296 33 33
Comparisons Harrow’s lowest ranked indicator is Income affecting Older People whereby the borough is placed 21st out of 33 (unchanged since 2010). Harrow’s best ranked indicator is the Health and Disability indicator with a ranking of 31st in London and three places higher compared to 2010. In the majority of indicators Harrow’s ranking in London has declined slightly on its 2010 performance. In particular the Living Environment indicator shows a decrease of three places within the London ranking. Previously Harrow was ranked 33rd in London for this indicator making it the least deprived borough. IMD ranking of London boroughs, 2010 and 2015 Source: CLG, Indices of Deprivation 2010 & 2015, Crown Copyright
Note: The average IMD score is calculated by totalling the scores for all LSOA within the local authority area and dividing
by the number of LSOAs. The average rank is calculated by putting the 326 Local Authority Districts in England into a rank order based the population weighted average rank of all LSOAs in the LAD. A rank of 1 nationally is the most deprived.

60
Comparisons
Harrow’s Rank in relation to the Outer London Deprivation Rankings There are 19 boroughs which constitute Outer London6. The chart below shows how Harrow is performing against this group of local authorities. In five indicators Harrow has improved on its 2010 ranking, in two the ranking has remained constant and in three indicators deprivation has increased relative to the other Outer London Boroughs. In four out of ten indicators Harrow is in the top four performing boroughs in Outer London. The three indicators where Harrow has seen a worsening position relative to the other Outer London Boroughs are in the Living Environment domain; Crime; and Income affecting Older People. Nationally Harrow’s ranking improved by 39 places for Living Environment deprivation, but not for Income affecting Older People or Crime. With the exception of the indicator for Income Deprivation Affecting Older People (IDAPI) Harrow is in the top performing 50 per cent of Outer London Boroughs. Harrow's Rank in relation to the Outer London Deprivation Rankings Source: CLG, Indices of Deprivation 2015 and 2010, Crown Copyright
6 The Outer London Boroughs are: Barking & Dagenham; Barnet; Bexley; Brent; Bromley; Croydon; Ealing; Enfield;
Greenwich; Harrow; Havering; Hillingdon; Hounslow; Kingston upon Thames; Merton; Redbridge; Richmond upon Thames; Sutton; and Waltham Forest.
17
19
10
16
16
14
9
11
10
14
16
16
11
16
17
14
8
13
12
15
0 3 6 9 12 15 18
Crime
Living Environment
Barriers to Housing & Services
Education, Skills & Training
Health & Disability
Employment
Income Affecting Older People
Income Affecting Children
Income
Multiple Deprivation
Ranking out of 19 Outer London Boroughs
IMD
In
dic
ato
r
2015
2010
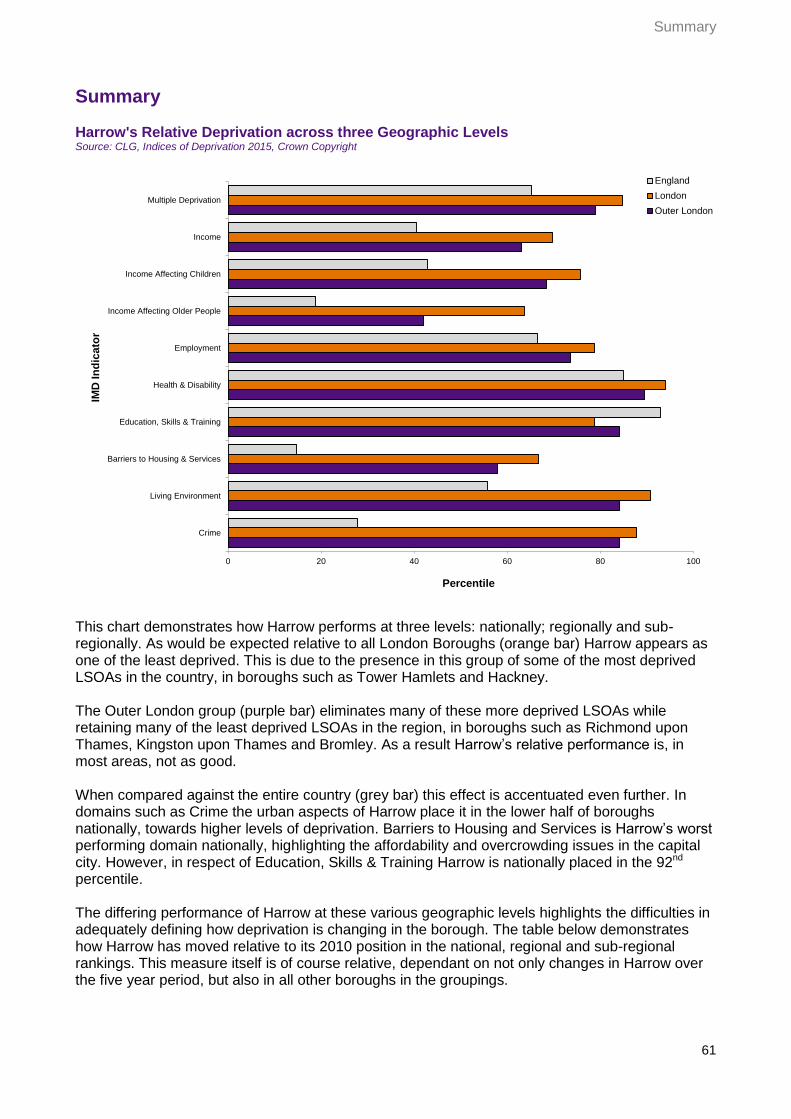
61
Summary
Summary Harrow's Relative Deprivation across three Geographic Levels Source: CLG, Indices of Deprivation 2015, Crown Copyright
0 20 40 60 80 100
Crime
Living Environment
Barriers to Housing & Services
Education, Skills & Training
Health & Disability
Employment
Income Affecting Older People
Income Affecting Children
Income
Multiple Deprivation
Percentile
IMD
In
dic
ato
r
England
London
Outer London
This chart demonstrates how Harrow performs at three levels: nationally; regionally and sub-regionally. As would be expected relative to all London Boroughs (orange bar) Harrow appears as one of the least deprived. This is due to the presence in this group of some of the most deprived LSOAs in the country, in boroughs such as Tower Hamlets and Hackney. The Outer London group (purple bar) eliminates many of these more deprived LSOAs while retaining many of the least deprived LSOAs in the region, in boroughs such as Richmond upon Thames, Kingston upon Thames and Bromley. As a result Harrow’s relative performance is, in most areas, not as good. When compared against the entire country (grey bar) this effect is accentuated even further. In domains such as Crime the urban aspects of Harrow place it in the lower half of boroughs nationally, towards higher levels of deprivation. Barriers to Housing and Services is Harrow’s worst performing domain nationally, highlighting the affordability and overcrowding issues in the capital city. However, in respect of Education, Skills & Training Harrow is nationally placed in the 92nd percentile. The differing performance of Harrow at these various geographic levels highlights the difficulties in adequately defining how deprivation is changing in the borough. The table below demonstrates how Harrow has moved relative to its 2010 position in the national, regional and sub-regional rankings. This measure itself is of course relative, dependant on not only changes in Harrow over the five year period, but also in all other boroughs in the groupings.
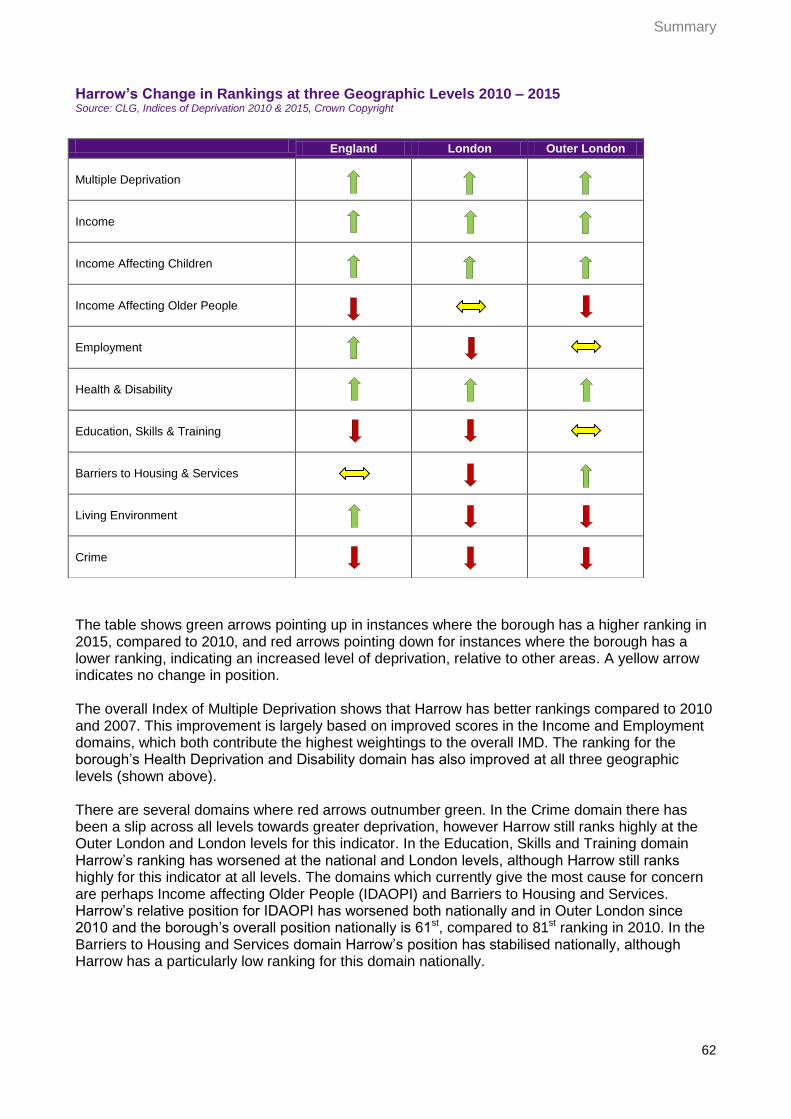
62
Summary Harrow’s Change in Rankings at three Geographic Levels 2010 – 2015 Source: CLG, Indices of Deprivation 2010 & 2015, Crown Copyright
The table shows green arrows pointing up in instances where the borough has a higher ranking in 2015, compared to 2010, and red arrows pointing down for instances where the borough has a lower ranking, indicating an increased level of deprivation, relative to other areas. A yellow arrow indicates no change in position. The overall Index of Multiple Deprivation shows that Harrow has better rankings compared to 2010 and 2007. This improvement is largely based on improved scores in the Income and Employment domains, which both contribute the highest weightings to the overall IMD. The ranking for the borough’s Health Deprivation and Disability domain has also improved at all three geographic levels (shown above). There are several domains where red arrows outnumber green. In the Crime domain there has been a slip across all levels towards greater deprivation, however Harrow still ranks highly at the Outer London and London levels for this indicator. In the Education, Skills and Training domain Harrow’s ranking has worsened at the national and London levels, although Harrow still ranks highly for this indicator at all levels. The domains which currently give the most cause for concern are perhaps Income affecting Older People (IDAOPI) and Barriers to Housing and Services. Harrow’s relative position for IDAOPI has worsened both nationally and in Outer London since 2010 and the borough’s overall position nationally is 61st, compared to 81st ranking in 2010. In the Barriers to Housing and Services domain Harrow’s position has stabilised nationally, although Harrow has a particularly low ranking for this domain nationally.
England London Outer London
Multiple Deprivation
Income
Income Affecting Children
Income Affecting Older People
Employment
Health & Disability
Education, Skills & Training
Barriers to Housing & Services
Living Environment
Crime
63
Further Information
Further Information
2015 Indices of Deprivation https://www.gov.uk/government/statistics/english-indices-of-deprivation-2015 Guidance Document https://www.gov.uk/government/uploads/system/uploads/attachment_data/file/464430/English_Index_of_Multiple_Deprivation_2015_-_Guidance.pdf Research Report https://www.gov.uk/government/publications/english-indices-of-deprivation-2015-research-report Technical Report https://www.gov.uk/government/publications/english-indices-of-deprivation-2015-technical-report
Copyright Data are © Crown copyright, Department for Communities and Local Government, Indices of Deprivation 2015. Maps are reproduced from Ordnance Survey material with the permission of Ordnance Survey on behalf of the Controller of Her Majesty’s Stationary Office © Crown copyright. Unauthorised reproduction infringes Crown copyright and may lead to prosecution or civil proceedings. 100019206, 2015. Contact Officer: Sue Kaminska, Regeneration, Planning & Enterprise 020 8736 6090 (internal x6090) e-mail: [email protected] December 2015 O:\SUE\Deprivation\ID 2015\2015 IMD Colours.doc (rev1)

64
Appendices
Appendix A: Data Sources Source: CLG, Indices of Deprivation 2015, Crown Copyright
Domain Indicator Data supplier Data time point
Income Deprivation
Domain
Adults and children in Income Support families
Adults and children in income-based Jobseeker’s Allowance families
Adults and children in income-based Employment and Support
Allowance families
Adults and children in Pension Credit (Guarantee) families
Adults and children in Working Tax Credit and Child Tax Credit families
not already counted, and whose equivalised income (excluding housing
benefit) is below 60 per cent of the median before housing costs
Asylum seekers in England in receipt of subsistence support,
accommodation support, or both
Department for Work and Pensions, Her
Majesty's Revenue and Customs and the
Home Office
2012
Employment
Deprivation Domain
Claimants of Jobseeker’s Allowance (both contribution-based and
income-based), women aged 18-59 and men aged 18-64
Claimants of Employment and Support Allowance (both contribution-
based and income-based), women aged 18-59 and men aged 18-64
Claimants of Incapacity Benefit, women aged 18-59 and men aged 18-
64
Claimants of Severe Disablement Allowance, women aged 18-59 and
men aged 18-64
Claimants of Carer’s Allowance, women aged 18-59 and men aged 18-
64
Department for Work and Pensions Four quarters from
May 2012 to
February 2013
Key Stage 2 attainment
Key Stage 4 attainment
Secondary school absence
Department for Education 2010/11, 2011/12
and 2012/13
Staying on in education post 16 Her Majesty's Revenue and Customs 2010 to 2012
Entry to higher education Higher Education Statistics Agency 2009/10 to
2012/13
Adult Skills Office for National Statistics 2011
English language proficiency Office for National Statistics 2011
Years of potential life lost Office for National Statistics 2008 to 2012
Comparative illness and disability ratio Department for Work and Pensions 2013
Acute morbidity Health and Social Care Information
Centre
2011/12 to
2012/13
Mood and anxiety disorders Health and Social Care Information
Centre; Department for Work and
Pensions; Office for National Statistics
2008 to 2013
Crime Domain Violence
Burglary
Theft
Criminal damage
Association of Chief Police Officers,
provided by the Home Office
2013/2014
Road distance to a post office Post Office Ltd 2014
Road distance to a primary school Department for Education Edubase 2014
Road distance to general store or supermarket Ordnance Survey 2014
Road distance to a GP surgery Organisation Data Service, Health and
Social Care Information Centre, licenced
under the Open Government Licence v2.0
2014
Household overcrowding Office for National Statistics 2011
Homelessness Department for Communities and Local
Government
2011/12, 2012/13
and 2013/14
Housing affordability Estimated primarily from the Family
Resources Survey, Regulated Mortgage
Survey, Land Registry house prices, and
Valuation Office Agency market rents.
2012
Housing in poor condition Estimated from the English Housing
Survey, 2011
2011
Houses without central heating Office for National Statistics 2011
Air quality indicator Estimated from UK Air Information
Resource air quality, 2012
2012
Road traffic accidents indicator Department for Transport 2011, 2012 and
2013
Barriers to Housing
and Services Domain
Living Environment
Deprivation Domain
Education, Skills and
Training Deprivation
Domain
Health Deprivation
and Disability Domain
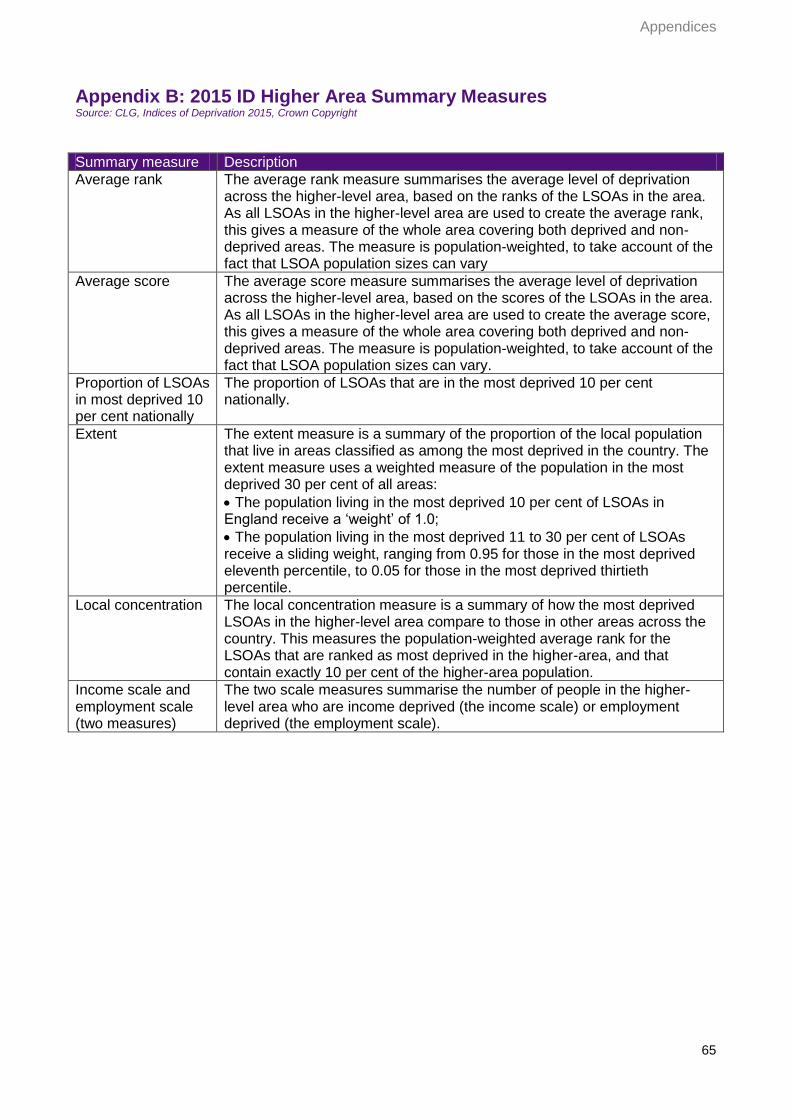
65
Appendices
Appendix B: 2015 ID Higher Area Summary Measures Source: CLG, Indices of Deprivation 2015, Crown Copyright
Summary measure Description
Average rank The average rank measure summarises the average level of deprivation across the higher-level area, based on the ranks of the LSOAs in the area. As all LSOAs in the higher-level area are used to create the average rank, this gives a measure of the whole area covering both deprived and non-deprived areas. The measure is population-weighted, to take account of the fact that LSOA population sizes can vary
Average score The average score measure summarises the average level of deprivation across the higher-level area, based on the scores of the LSOAs in the area. As all LSOAs in the higher-level area are used to create the average score, this gives a measure of the whole area covering both deprived and non-deprived areas. The measure is population-weighted, to take account of the fact that LSOA population sizes can vary.
Proportion of LSOAs in most deprived 10 per cent nationally
The proportion of LSOAs that are in the most deprived 10 per cent nationally.
Extent The extent measure is a summary of the proportion of the local population that live in areas classified as among the most deprived in the country. The extent measure uses a weighted measure of the population in the most deprived 30 per cent of all areas:
The population living in the most deprived 10 per cent of LSOAs in England receive a ‘weight’ of 1.0;
The population living in the most deprived 11 to 30 per cent of LSOAs receive a sliding weight, ranging from 0.95 for those in the most deprived eleventh percentile, to 0.05 for those in the most deprived thirtieth percentile.
Local concentration The local concentration measure is a summary of how the most deprived LSOAs in the higher-level area compare to those in other areas across the country. This measures the population-weighted average rank for the LSOAs that are ranked as most deprived in the higher-area, and that contain exactly 10 per cent of the higher-area population.
Income scale and employment scale (two measures)
The two scale measures summarise the number of people in the higher-level area who are income deprived (the income scale) or employment deprived (the employment scale).
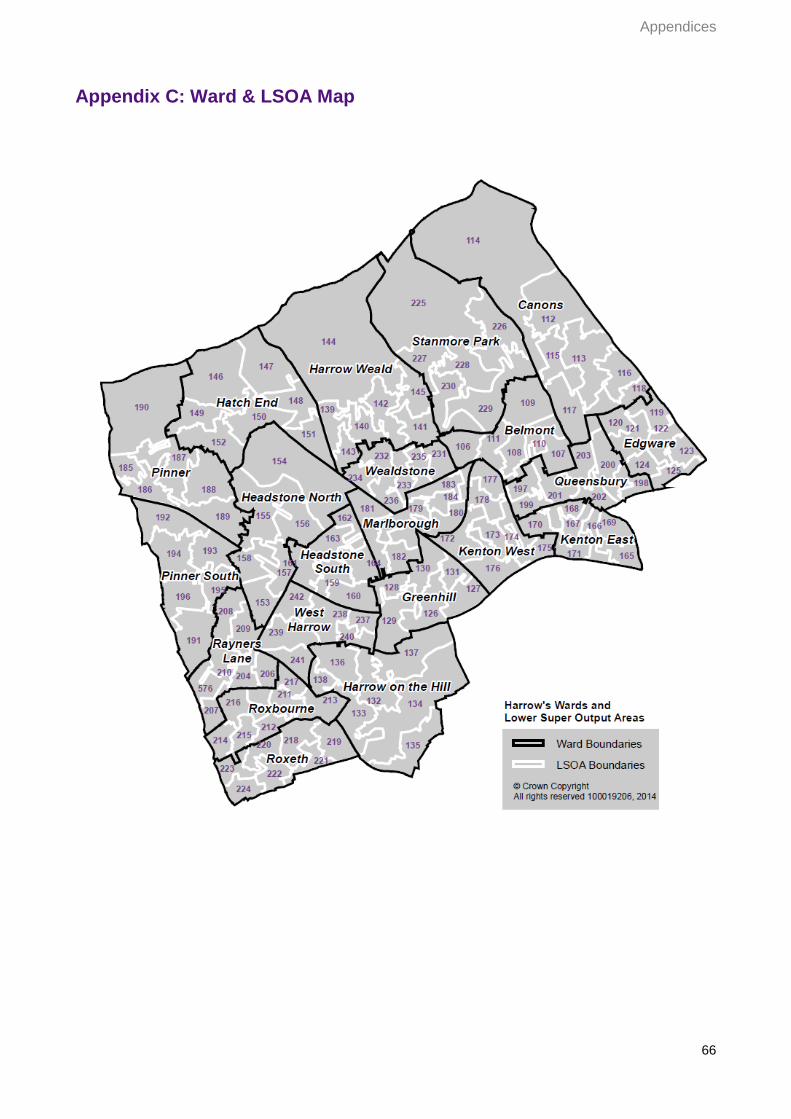
66
Appendices
Appendix C: Ward & LSOA Map