15th africa fine coffee conference (afca) feed the future
TRANSCRIPT

15th Africa Fine Coffee Conference (AFCA)
Feed the Future Africa Great Lakes Coffee Program (AGLC)
Topic: Control of Antestia/PTD and Improving Coffee
Productivity in Burundi and Rwanda
February 17, 2017 Addis Ababa, Ethiopia


Outline of presentation
1. AGLC approach to challenge
2. Guiding questions
3. Background
4. Coffee overview
5. Preliminary studies by University of Rwanda and Roger family company as GKI-Link
6. AGLC methodology
7. Preliminary results
8. Conclusion
9. Acknowledgement
4
AGLC- Introduction to
the Challenge
And Background

5

6
AGLC Background• AGLC is a 3-year USAID-funded initiative that
addresses 2 major challenges in the coffee sector in Rwanda and Burundi
• Reduce antestia bug/potato taste defect (PTD)
• Raise coffee productivity
• Partners• Rwanda: Univ. of Rwanda (UR) and Inst. of Policy
Analysis and Research (IPAR)
• Burundi: University of Ngozi, Polytechnic Univ. of Gitega
• USA: Michigan State University (MSU) and Global Knowledge Initiative (GKI)
• Components: • applied research • policy engagement • capacity building

7
Applied research component
• AGLC draws upon a broad mix of quantitative and qualitative methodologies, including:
• Experimental field/plot level data collection
• Coffee farmer/household surveys (and CWS survey)
• Key Informant Interviews
• Focus Group Discussions
• Comprehensive coffee sector data base• Goal to integrate information from these four data
collection activities
• Provide empirical basis for policy engagement and farmer capacity building

Guiding questions on the
Antestia Problem in
Burundi and Rwanda
8
9
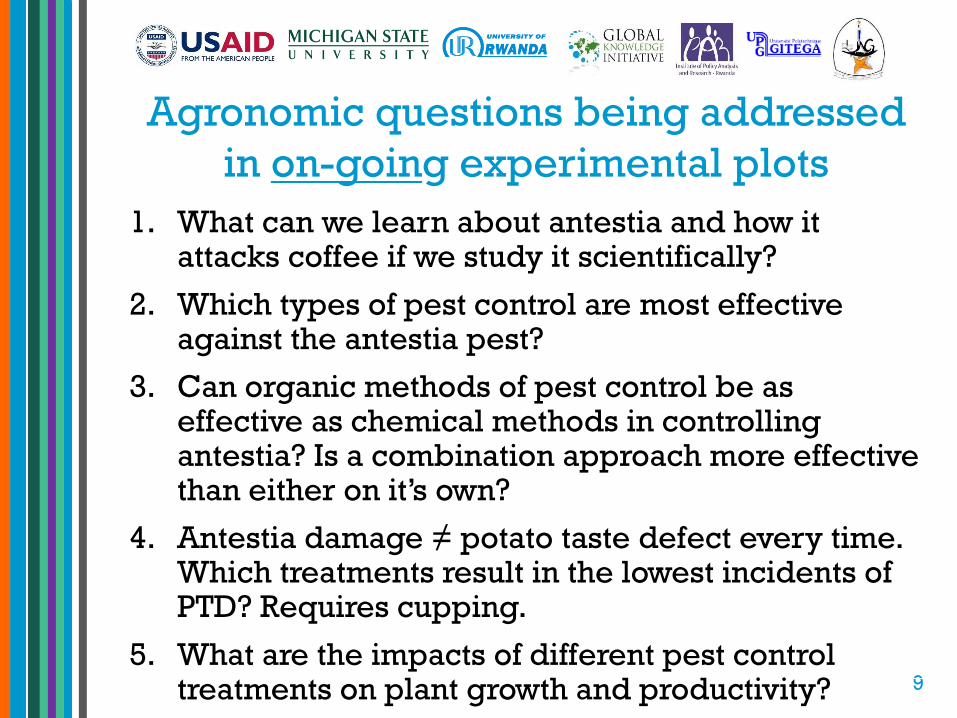
1. What can we learn about antestia and how it attacks coffee if we study it scientifically?
2. Which types of pest control are most effective against the antestia pest?
3. Can organic methods of pest control be as effective as chemical methods in controlling antestia? Is a combination approach more effective than either on it’s own?
4. Antestia damage ≠ potato taste defect every time. Which treatments result in the lowest incidents of PTD? Requires cupping.
5. What are the impacts of different pest control treatments on plant growth and productivity?
Agronomic questions being addressed
in on-going experimental plots

10
1. How can we implement experimental plots in ways that improve capacity of the farmers who own them and their neighbors?
2. How can we implement experimental plots in ways that build-up the next generation of extension workers with deep coffee knowledge?
Capacity-building questions being
addressed in the experimental plots

11
The household and field survey (n=2024) part of the project addresses PTD issues and productivity via large coffee farmer field and household surveys. Important questions related to PTD are discussed in the analysis.
See “Determinants of Farmer Investments” and “Estimating Cost of Production” papers available as handouts.
Mid-line survey (n=1024) completed in January 2017 for Rwanda, currently underway in Burundi.
Household survey

12
Rwandan coffee Background

21st Century Rwandan Coffee
Industry: New Policy 1998
A Radical Transformation of towards QUALITY
1. Government of Rwanda targeted coffee as a priority sector
2. Liberalized coffee sector
3. Cooperatives promotion and support
4. Emphasis was placed on quality
5. Private sector participation encouraged
6. Cupping laboratories built
7. Cooperative and private promoted
8. Involve development partners

Quality in all links along the
Coffee value chain
A Radical Transformation of towards
QUALITY
1. Cherry picking and selection2. Floatation for sorting and grading3. Clean water use4. Parchment sorting and grading5. Precise fermentation6. Linear sun drying7. Lot creation8. Lot quality control9. Regional cupping laboratory10. Market link and buyers contacts

Quality in all links along the Coffee value chain
A Radical Transformation of towards
QUALITY
1. Parchment sorting and grading2. Precise fermentation3. Linear sun drying4. Lot creation5. Lot quality control6. Regional cupping laboratory7. Market link and buyers contacts
8. Parchment sorting and grading


Challenges to coffee production
(from NAEB)
A Radical Transformation of towards
QUALITY
Poor soil fertility
Lack of knowledge of farmers on good coffee husbandry
Old coffee trees (24 % of the total number) which are not productive.
Pests and diseases pressure.
main insect pests being:
antestia, (Antestiospsis sp.)
coffee berry borer;
Main diseases are:
Coffee leaf rust (CLR) and
Coffee berry Disease (CBD)

Challenges to coffee production
(from NAEB)
A Radical Transformation of towards
QUALITY
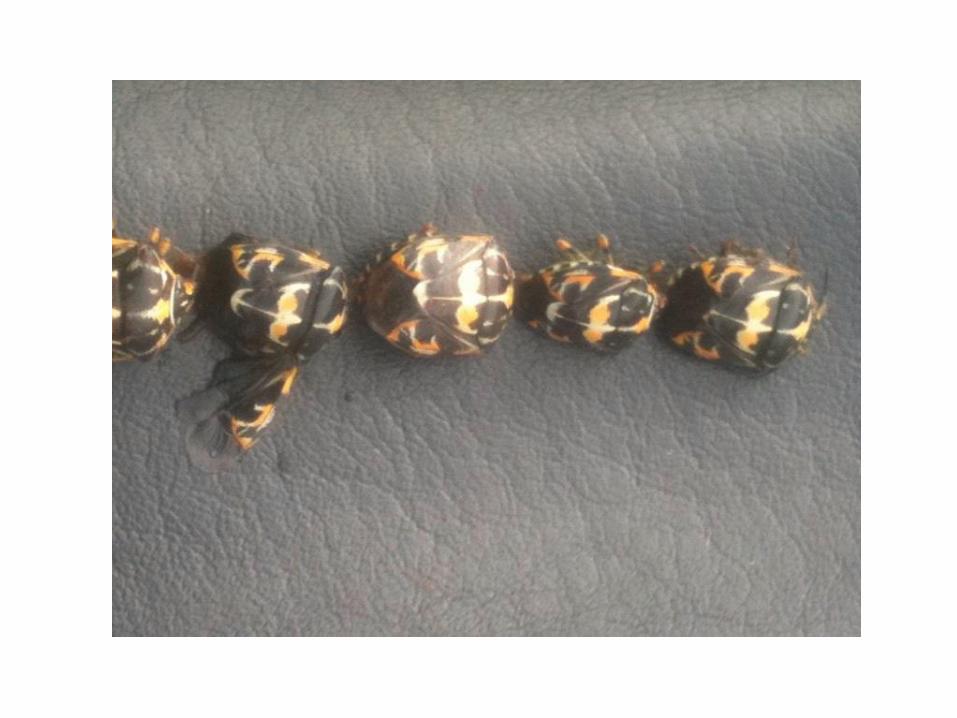
Antestia spread in all the coffee growing zones
Feeds on berries and green shoots
It is thought to be linked with the potato taste
Can cause loss up to 30% if not controlled and affect
the quality of coffee as well

Current Antestia bug control
A Radical Transformation of towards
QUALITY
Chemical control:
Use of synthetic pesticides
Use of Natural pyrethrin, Pyrethrine 5EW,
produced locally by the Agropharm
Africa.
Cultural Control:
Training of farmer : eg FFS

Pilot study at University of Rwanda in
partnership with
Roger Family Company/San Fransisco
bay
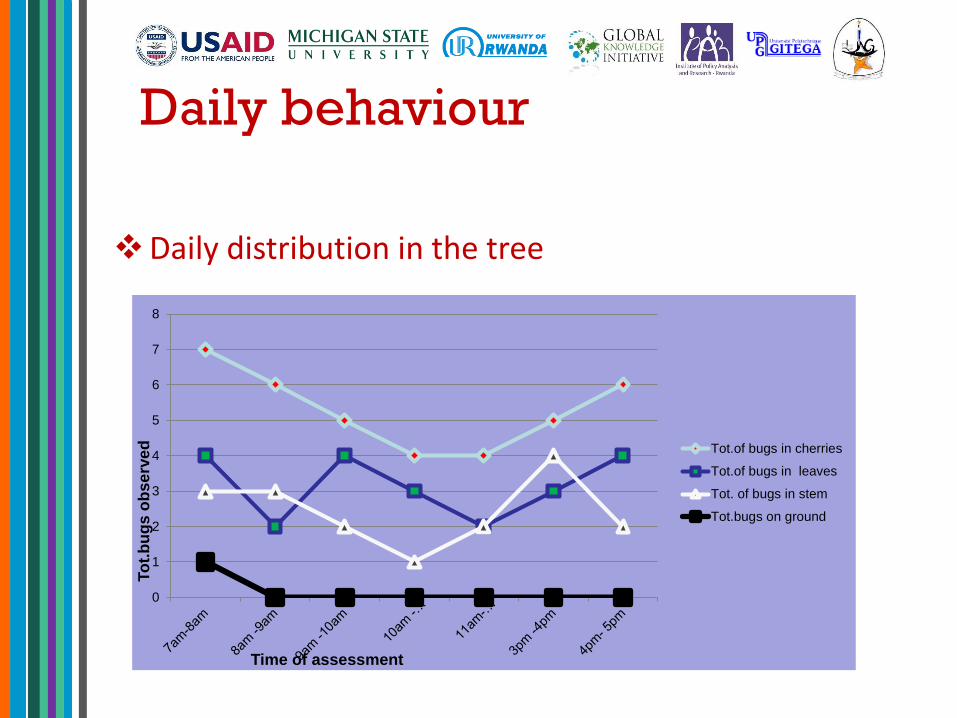
Daily behaviour
Daily distribution in the tree
0
1
2
3
4
5
6
7
8
To
t.b
ug
s o
bse
rve
d
Time of assessment
Tot.of bugs in cherries
Tot.of bugs in leaves
Tot. of bugs in stem
Tot.bugs on ground
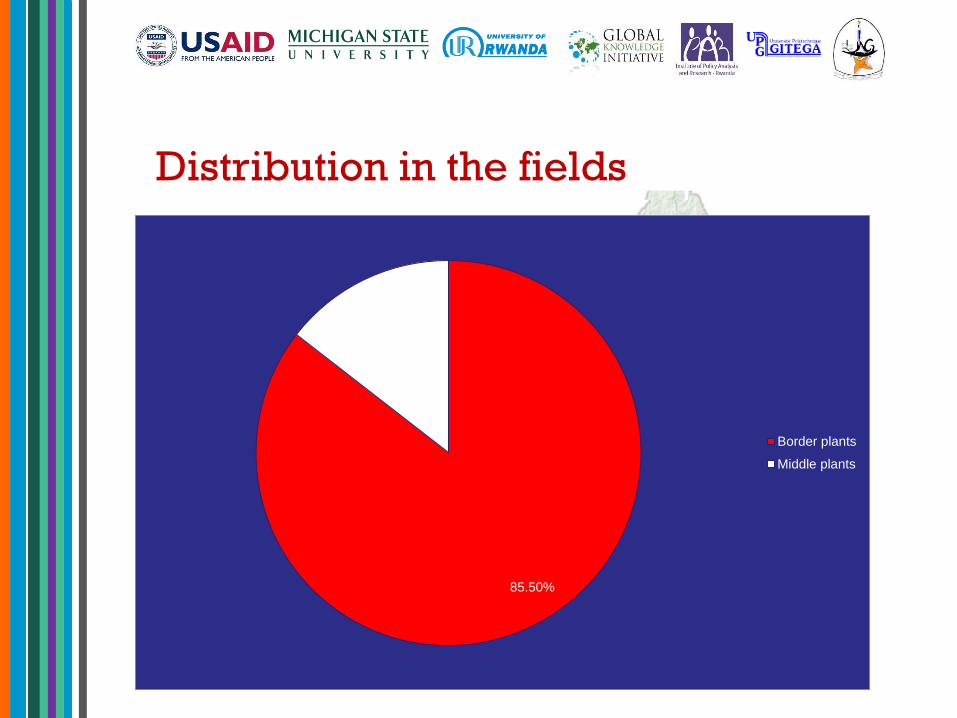
Distribution in the fields
Distribution on farm
85.50%
14.50%
Border plants
Middle plants

Pilot study at University of Rwanda in
partnership with RFC
Presence of egg parasitoids

Presence of egg parasitoids in 2013 and
2014

entomopathogenic fungi

Presence of entomopathogenic
fungi at different growth stages
Infection rate in antestia bugs
increased with development stage
eggs (40%),
nymphs (60%)
adults (73.3%)

Entomopathogenic fungi:
Metarhizium anisopliae showed a great percentage of occurrence in all growth stages :
Eggs(28%),
nymphs (28%)
adults (42.85%)
This implies that M.anisopliae has
more potential than other
entomopathogenic fungi. Especially
for adult control

31
AGLC- Study Plots
Methodology

128 agronomic study plots
32
• 16 coffee washing
stations in each
country selected.
• 4 farmers’ plots
(minimum 200
trees) selected
from each washing
station.
• 2 countries x 16
washing stations x
4 plots/ws = 128
study plots

Field workYear 1:
Field/Farmer selection
Field set-up
Hire/train enumerators
Soil samples
Challenging roads and places

Field-Farmer Selection
Burundi
Rwanda

Protocol
Plot 1
Confidor(Rwanda)
Equivalent,ARFIC recommended for Burundi
Application:2 blanket sprays per season
Plot 2
Pyrethrum EWC [ORGANIC}
Application:2 blanket sprays per season
Plot 3
Confidor (or equivalent) + Pyrethrum EWC
Application:1 blanket spray Confidor, 1 blanket spray EWC later in season
Plot 4
IPM (EWC spot-spray)
Application:Spot spray weekly
Plot 5
Control (no treatment)
Insecticide Treatments

Field Set-upPlot
#
1
2
3
4
5

Field set-upPainted
tree
trunks.

Enumerator Training

Soil Samples

Field work – Year 1 & 2
• Soil analysis (challenges)
• Antestia knock-down and counts
• Tree growth and vigour
• Cupping
Soil analysis at University of Ngozi, Burundi

Antestia knock-down and
count
In the
morning
.
1. Spray EWC
Wait 10
minutes.
2. shake 3. Count bugs
4. Record

Tree growth and vigour

Cupping to assess
incidence of PTD Potato Taste
Yes/No

44
Initial
Research Findings
from Experimental
Fields

Progress update - no
conclusions yet• Antestia incidents high in dark, bushy canopy. “Pruning
on its own can reduce antestia by half. “ ~ Dr. Dick Walyaro, RAB.
• Organic and domestically available pyrethrum of high interest. Cost issues. Testing “spot” vs. “blanket” application.
• Expect soil analysis to show lack of potassium in Rwanda, which reduces sweetness in the cup.1 Distribution of fertilizer issue.
• Fly crop issues.
1 Malliavin Nzamurambaho: San Francisco Bay Coffee

Early results.
Ngozi + Kayanza, Burundi Year 1 Quarter 4 Update
Avg. # of Antestiabugs
Yield – KG cherry/tree
1a Treat 1 (Confidor): 0.9 1.98
1b Treat 2 (Pyrethrum): 0.4 1.73
1c Treat 3 (Confidor+): 0.7 1.50
1d Treat 4 (IPM – Pyrethrum+): 0.5 1.47
1e Treat 5. Control: 0.0 1.64
Treatment 1 has highest incidence of antestia and
highest yield.

Expecting 2017 study plot
data More precise estimates of % yield reduction due to
antestia damage. (We typically use 30%, is it accurate?)
Correlation between antestia presence and PTD in the cup.
Disaggregation of antestia and PTD incidence by geography, type of input use, plant and soil characteristics.
Better understanding of antestia habits and lifecycle.

Capacity buildingFarmers Future Extensionists

49
Research Findings
from Household &
Field Surveys

50
Input Application Rates
0%
20%
40%
60%
80%
100%
Appliedfertilizers
Appliedpesticides
Appliedmanure
Pe
rce
nt
of
HH
s
Percent of HHs Applying Inputs
Rwanda
Burundi
51
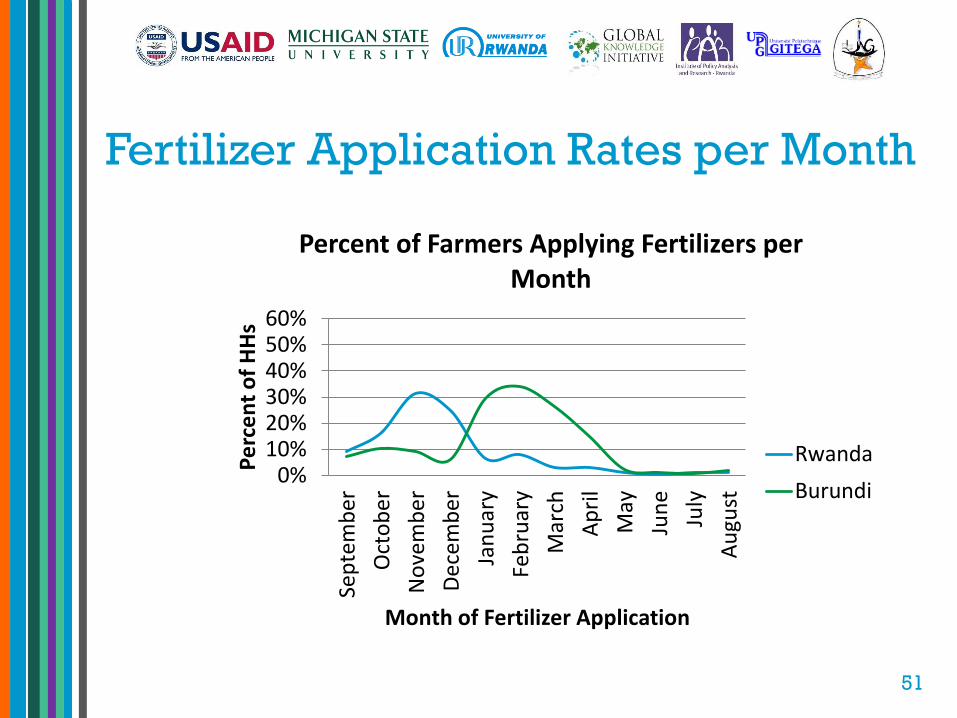
Fertilizer Application Rates per Month
0%10%20%30%40%50%60%
Sep
tem
ber
Oct
ob
er
No
vem
be
r
Dec
emb
er
Jan
uar
y
Feb
ruar
y
Mar
ch
Ap
ril
May
Jun
e
July
Au
gust
Pe
rce
nt
of
HH
s
Month of Fertilizer Application
Percent of Farmers Applying Fertilizers per Month
Rwanda
Burundi

52
Pesticide Application Rates per Month
0%10%20%30%40%50%60%
Sep
tem
ber
Oct
ob
er
No
vem
be
r
Dec
emb
er
Jan
uar
y
Feb
ruar
y
Mar
ch
Ap
ril
May
Jun
e
July
Au
gust
Pe
rce
nt
of
HH
Month of Pesticide Application
Percent of Farmers Applying Pesticides per Month
Rwanda
Burundi

53
Reasons for Not Using Inputs
0% 20% 40% 60% 80% 100%
No labor available
Don't know how
Too expensive
Not worth cost
Other
Not available
Not free
Percent of HH reporting reason
Re
aso
n f
or
No
t U
sin
g Fe
rtili
zers
Reasons for Not Using Fertilizer(for HH not using fertilizer)
0% 20% 40% 60% 80% 100%
No labor available
Don't know how
Too expensive
Not worth cost
Other
Not available
Not free
Percent of HH reporting reason
Re
son
fo
r N
ot
Usi
ng
Pe
stic
ide
s
Reasons for Not Using Pesticide(for HH not using pesticides)
Burundi
Rwanda

54
Antestia and PTD: Do Farmers Know
What They Are?
0%
20%
40%
60%
80%
100%
Know Antestia Knows PTD
Pe
rce
nt
of
HH
s
Percent of Farmers Who Know Antestia and PTD
Rwanda
Burundi

55
Antestia and PTD: How do farmers
identify antestia?
0%
10%
20%
30%
40%
50%
60%
70%
80%
90%
100%
Pricks Cherry Causes Cherry to Fall Affects Leaf Growth Affects Branch Growth
Pe
rce
nt
of
HH
s
How Antestia Affects Coffee Trees
Impacts of Antestia on Coffee, as Identified by Farmers
Rwanda
Burundi

56
Antestia and PTD: How do farmers
identify PTD?
0%
10%
20%
30%
40%
50%
Defect in Coffee Bad taste in coffee Bad smell in coffee Causes lower coffeeprices
Pe
rce
nt
of
HH
s
PTD
Description of PTD by Farmers
Rwanda
Burundi

57
Antestia in Farms
0%
20%
40%
60%
80%
100%
Had Antestia in their Fields Had Antestia in 2014-15
Pe
rce
nt
of
HH
s
Percent of Coffee Farmers Observing Antestia in their Coffee
Rwanda
Burundi
58
0%
20%
40%
60%
80%
100%
0 bugs 1-3 bugs 4-6 bugs 7-10 bugs more than 10bugs per tree
Pe
rce
nt
of
HH
s
Number of Antestia Bugs per Tree
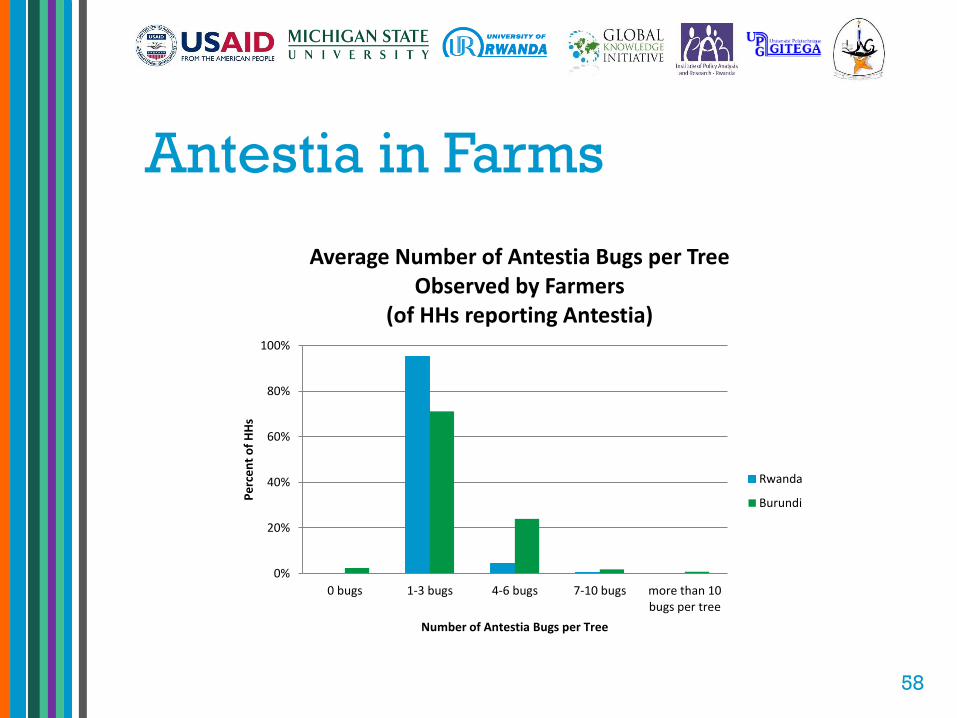
Average Number of Antestia Bugs per Tree Observed by Farmers
(of HHs reporting Antestia)
Rwanda
Burundi
Antestia in Farms

59
Antestia Control95% of farmers in Burundi and 76% of farmers in Rwanda who have had
Antestia in their coffee trees reported having taken some form of Antestia control
0%
20%
40%
60%
80%
100%
Blanket Spray Pick by Hand Spot Spray Blanket or spot or pickoff
Pe
rce
nt
of
HH
s
Metod of Antestia Control
Percent of Coffee Farmer Using Selected Methods for Antestia Control
(Among those taking control measures)
Rwanda
Burundi

Acknowledgement USAID for support and funding this research in both
Rwanda and Burundi. The AGLC is funded by Feed the Future-USAID, without it we could not be having the important data we are getting
Government of Rwanda and Burundi for support and enabling environment
Coffee farmers in both Rwanda and Burundi for their willingness to work with the AGLC project
Coffee stakeholders in Rwanda and Burundi for the willingness to help us in many ways
