15.963 management accounting and control - mit opencourseware · 15.963 management accounting and...
TRANSCRIPT

MIT OpenCourseWare ____________http://ocw.mit.edu
15.963 Management Accounting and ControlSpring 2007
For information about citing these materials or our Terms of Use, visit: ________________http://ocw.mit.edu/terms.
15.963 Managerial Accounting and Control
Spring 2007
Prof. Mozaffar Khan
MIT Sloan School of Management

Vyaderm� Three companies, A, B and C have net income of $100m, $120m and
$80m, respectively. � Rank them on performance.
� What is the benchmark? � Problem is differences in size or invested capital.
� Now suppose they have Return on Investment (ROI) of 8%, 6% and 10% respectively. � Now rank them on performance. � Again, this is difficult. We do not know how risky these firms are. � Risk will determine the required return. � We have to compare the ROI with the required return for each firm –
suppose it is 4%, 8% and 10%, respectively. � Now we can say that A (B) [C] performed better than (worse than) [as]
expected.

Vyaderm
� To maximize firm value, the firm must earn more than its cost of capital.
� The third performance metric is in %, but captures the spirit of two important (and essentially similar) metrics: � Residual income, and � Economic Value Added (EVA). � These differ only in certain details.
� EVA is, broadly speaking, = Income – (Expected income) = Income – (Cost of Capital*Invested Capital). � This is a dollar amount, not percentage, so larger firms will
generally have higher EVA.

Vyaderm
� Why did Vedrine introduce EVA? � Prior CEO focused on earnings per share, without regard to
invested capital. � Prior system also had a large subjective component.
� How will EVA help? � Forces balance sheet accountability. � Will help identify, and therefore manage, EVA drivers, and
thereby increase firm value.

Vyaderm� What are the features of the EVA system at Vyaderm?
� EVA centers � EVA drivers � EVA incentive program, i.e., compensation tied directly to EVA.
� The first two features use EVA to measure business unit performance. The third uses EVA to measure managers’ performance. Should these be linked?
� Consider EVA centers, and the definition of EVA.� How do you determine the cost of capital for, e.g., the Dermatology
division?� The division does not issue its own debt.� It does not have its own separately traded equity.� Does this introduce subjectivity and distrust?

Vyaderm� How do you the determine the investment base for the dermatology
division?� Can we construct a balance sheet for separate divisions?� Are there shared resources?� This will be very difficult and subjective.
� So, determining divisional EVA is problematic. � Vedrine would like to establish a single, global EVA center. Is this a
good idea? � The company as a whole has a clearly defined balance sheet, and cost of
capital may be easier to estimate. � The main problem with this is that it weakens the link between an
individual manager’s effort (say, manager in Singapore) and hercompensation.
� This will foster mistrust, and will reduce employee motivation. � This weaker link will also promote free-riding and therefore decrease
efficiency.

Vyaderm
� This may be one reason to use EVA for measuring business performance but not compensation.
� Let’s consider the accounting adjustments to “Income” or “Net Operating Income After Taxes” (NOPAT), at Vyaderm.
� In calculating ‘Economic’ Value Added, we need ‘Economic’ income. � i.e., accounting income has to be adjusted to better approximate
economic income. � Accounting income has to conform to GAAP, which tends
to be conservative. For example…….

Vyaderm
� R&D is expensed, not capitalized, under GAAP. � For R&D to qualify as an asset, and therefore be capitalized, the
timing and extent of future benefits would have to be verifiable. � GAAP takes the position that this is not the case, and therefore
does not allow R&D capitalization. � However, an economic asset does not have to satisfy the
verifiability (of timing and extent) criteria of GAAP. � It simply needs to have some value in expectation, to be considered an
economic asset. � The expected value (or full value in this case) of R&D is
considered an economic asset and therefore capitalized for EVA calculation.

Vyaderm � However, this asset also has a finite life, and should therefore be
amortized over this period. � Vyaderm amortizes R&D over five years, straight line.
� The same logic applies to marketing expenses. � Since these will yield benefits over a shorter period, they are amortized by
Vyaderm over three years, straight line. � Goodwill from an acquisition is the excess of purchase price over the
fair market value of the separable net assets. � This is a measure of such things as reputation, client base and other
intangible assets. � This capitalized by Vyaderm for EVA purposes, and not amortized.
� These are by no means all the adjustments. Consultants offer a litanyof adjustments (the idea of diminishing marginal benefits probably applies).

Vyaderm
� How does the bonus calculation work?
� There is a bonus bank, or a stock of funds from which a bonus can be distributed. This bank has to be calculated first.
� Second, a formula determines the bonus paid out from this bank. � The formula is based on improvements over the prior year.
� Improvement is the value added. � This motivates continuous growth, but ratchets might introduce other
behavioral distortions. � In good years, some sales may be deferred at year-end.
� It is not as good after a windfall year and better after a poor year. � It does not penalize good managers who take over poorly performing
divisions.

Payout
Bank
Exhibit 2
BONUS INCENTIVE
Improvement Goal
TOTAL BONUS EARNED
EVA IMPROVEMENT
Year 1 Target
Year 0 Actual EVA
Target Incentive
Slope = Target Incentive / EVA Interval
EVA Interval
Note: The EVA interval is the shortfall from target that eliminates the bonus. An EVA center’s performance (%) = 1 + [actual improvement – improvement goal) / EVA interval].

Vyaderm � What is the role of the EVA interval? � It allows risk taking, by allowing positive additions to the bonus bank
even for shortfalls from target. � Allowing managers to take calculated risks, or preventing them from
being overly risk averse, is important. � The shorter the interval, the greater the risk imposed on managers, and the
more risk-averse they might generally be when the bank balance is positive.
� On the other hand, they might also engage in excessive risk taking when the balance is hopelessly negative.
� It acts as a lever for bonus payments. � The bonus payment per dollar of improvement beyond the bottom of the
interval is (target bonus / interval). � The shorter the interval, the higher the payment per dollar of EVA
improvement, and the greater the risk imposed on managers. � This is the risk/reward tradeoff.

Vyaderm
� What is the role of the bonus bank? � It smoothes intertemporal fluctuations in managers’ income, and therefore
reduces the risk imposed on them. � In expectation, this will reduce the firm’s compensation costs.
� Let us calculate the 2000 EVA for the Dermatology Division. � The divisional cost of capital is given as 11% in exhibit 8. � We need the economic NOPAT, and the economic capital base. � For economic NOPAT, start with the adjustments, e.g., R&D. � For each year, on the income statement:
� add this back to income before taxes, and � subtract the amortization charge for this and past years.
Vyaderm
� For each year, on the balance sheet, � add R&D, and � subtract the amortization expense for this and previous years.

R&D Adjustments
($000s) 1995 1996 1997 1998 1999 2000 2001E 2002E
R&D Expense as Reported on P&L 10673 12487 14610 17094 20000 39000 27378 32032
(5 Year Amortization Period) 1995 1996
2135 2135 2497
2135 2497
2135 2497
2135 2497 2497
1997 2922 2922 2922 2922 2922 1998 3419 3419 3419 3419 3419 1999 4000 4000 4000 4000 2000 7800 7800 7800 2001 5476 5476 2002 6406
R&D Amortization Under EVA 2135 4632 7554 10973 14973 20638 23616 27101
Cumulative R&D Expense (P&L) 10673 23160 37770 54864 74864 113864 141242 173274 Less: Cumulative Amortization (EVA) 2135 6767 14321 25293 40266 60904 84521 111622
Capitalized R&D for EVA Calculation of Capital 8538 16393 23449 29571 34598 52960 56721 61652

Advertising Adjustments
($000s) 1998 1999 2000 2001E 2002E
Advertising Expense as Reported on P&L 41 45 50 55 61
(3 Year Amortization Period) 1996 1997
11 13 13
1998 14 14 14 1999 15 15 15 2000 17 17 17 2001 18 18 2002 20
Advertising Amortization Under EVA 38 41 46 50 55
Cumulative Advertising Expense (P&L) 113 158 208 263 324 Less: Cumulative Amortization (EVA) 73 114 160 210 265
Capitalized Advertising for EVA Calculation of Capital 40 44 48 53 59

2000 EVA for Dermatology($000s) 1999 2000 2001E 2002E
NOPAT: Net Income Before Tax Research & Development Expense 1. R&D Adjustment Advertising Expense 2. Advertising Adjustment 3. Goodwill Amortization Net Operating Profit Before Taxes (NOPBT) Current Year's Income Tax Payments
20000 20000 -14973
45 -41
2500 27531 -7875
51000 39000 -20638
50 -46
2500 71866 -18725
27848 27378 -23616
55 -50
2500 34114 -10622
32861 32032 -27101
61 -55
2500 40297 -12376
Net Operating Profit After Taxes (NOPAT)
CAPITAL: Net Operating Assets (NOA) 1. Capitalized R&D 2. Capitalized Advertising 3. Accumulated Goodwill Amortization
19656
110000 34598
44 7500
53141
135000 52960
48 10000
23493
153164 56721
53 12500
27921
180734 61653
59 15000
Capital
Capital Charge (11%)
152142
-16736
198008
-21781
222439
-24468
257445
-28319
Economic Value Added (EVA) 2920 31360 -976 -398

Vyaderm � The projections for 2001 and 2002 are based on assumed
growth rates of: � 18% for net income before tax (as between 1995 and 1999); � 17% for R&D (as between 1995 and 1999); � 10% for advertising (as between 1995 and 1999); � 18% for net operating assets (as between 1995 and 1999).
� Why is the projected EVA negative for 2001 and 2002? � The growth rate of (capitalized) R&D expense is over 30% per
year, outstripping the income growth rate.
Manager’s Bonus Calculation
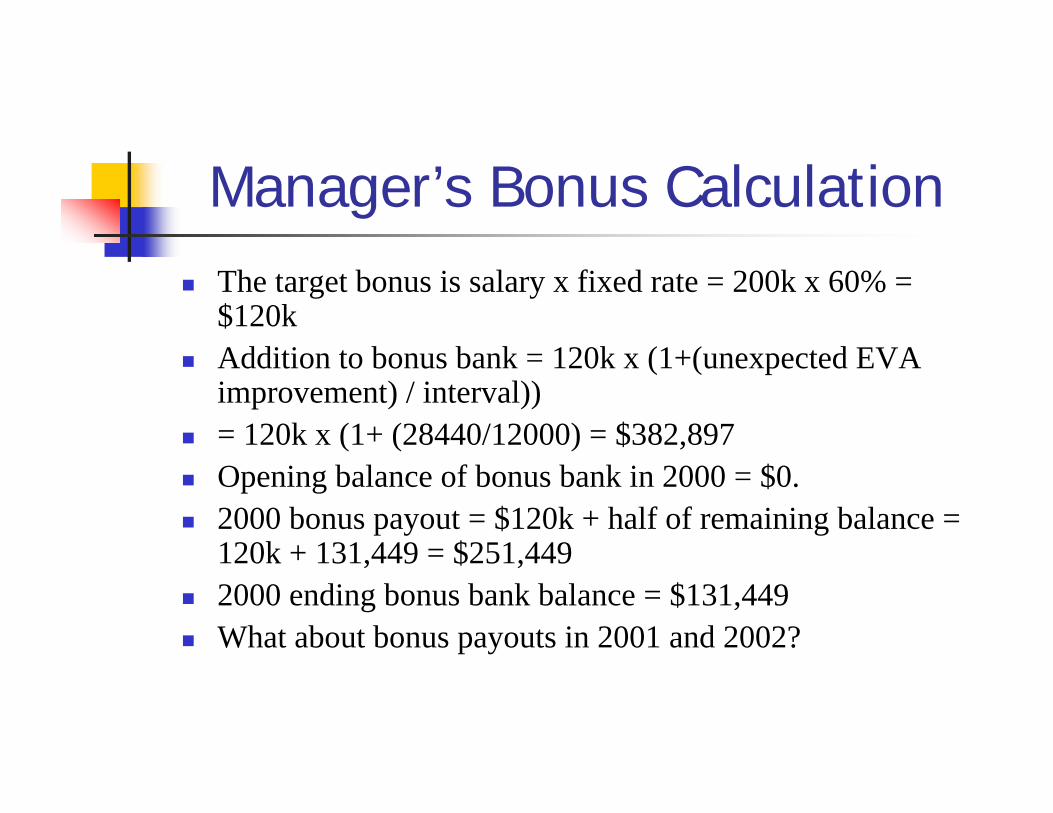
� The target bonus is salary x fixed rate = 200k x 60% = $120k
� Addition to bonus bank = 120k x (1+(unexpected EVA improvement) / interval))
� = 120k x (1+ (28440/12000) = $382,897 � Opening balance of bonus bank in 2000 = $0. � 2000 bonus payout = $120k + half of remaining balance =
120k + 131,449 = $251,449 � 2000 ending bonus bank balance = $131,449 � What about bonus payouts in 2001 and 2002?
Projected Bonus Payouts in 2001 and 2002
($000s except bonus) 1999 Old Model
2000 EVA Year 1
2001E EVA Year 2
2002E EVA Year 3
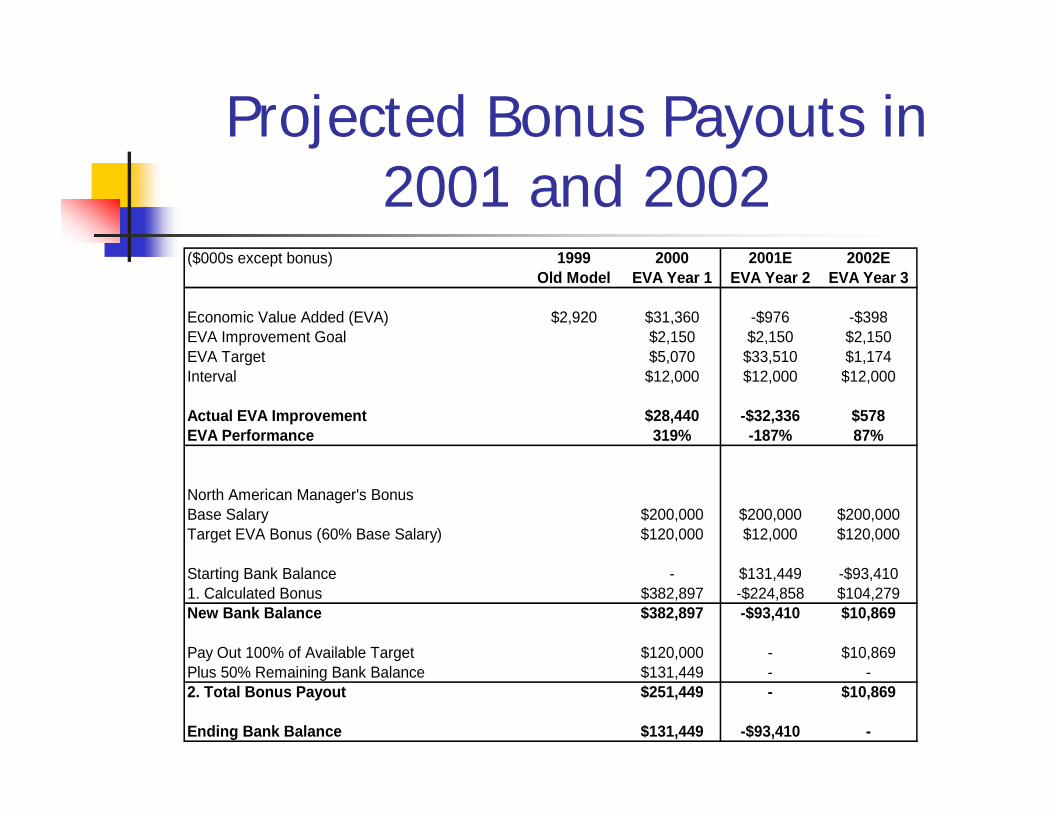
Economic Value Added (EVA) $2,920 EVA Improvement Goal EVA Target Interval
Actual EVA Improvement EVA Performance
$31,360 $2,150 $5,070 $12,000
$28,440 319%
-$976 $2,150
$33,510 $12,000
-$32,336 -187%
-$398 $2,150 $1,174 $12,000
$578 87%
North American Manager's Bonus Base Salary Target EVA Bonus (60% Base Salary)
Starting Bank Balance 1. Calculated Bonus
$200,000 $120,000
-$382,897
$200,000 $12,000
$131,449 -$224,858
$200,000 $120,000
-$93,410 $104,279
New Bank Balance
Pay Out 100% of Available Target Plus 50% Remaining Bank Balance
$382,897
$120,000 $131,449
-$93,410
--
$10,869
$10,869 -
2. Total Bonus Payout
Ending Bank Balance
$251,449
$131,449
-
-$93,410
$10,869
-

Vyaderm � Why is the bonus payout so low immediately after 2000?
� Because the bonus formula is based on improvements over the prior year.
� It is hard to improve over a windfall year.� It will take a few years to build the bank back up.
� Consider spillover effects of this bonus scheme. If the company wishes to hire new managers in 2001 or 2002, will it be successful? � Should it make exceptions to the formula for new hires in these
years? � Will this affect the credibility of the system, or foster resentment
from existing employees?
Vyaderm
� Another feature of the bonus system is that, for individual managers, the bonus bank is portable within the company.
� Rotating managers between divisions for development purposes is a an important HR tool at companies.
� How will this system affect rotation? � Those being rotated out of Dermatology will generally be better off
than those staying another couple of years. � Who would want to rotate in to Dermatology in 2001?
� What should Vyaderm do?

Vyaderm � The essential problem is that excessive risk is being
imposed on managers. � The bonus payout is very volatile. � Manager’s compensation will therefore be higher on average,
which is more costly for the firm. � Risk is controlled through the interval in the bonus
formula. � Widening the interval will reduce risk. � It will reduce the bonus payout this year (reward will be
commensurate with risk). � The advantage is that it will also penalize the bank less in 2001,
per dollar of unexpected EVA improvement.

Vyaderm � Other takeaways:
� EVA is better at measuring business performance than managerial performance.
� Consider delinking the two roles of EVA at Vyaderm. � Managerial performance may be better measured through key EVA
drivers within the manager’s control. � If the link between managerial effort (or performance) and the
performance measure is weak, a host of problems arise, including: � demotivation; � free-riding; � difficulty in recruitment and retention; � possibly excessive risk and therefore compensation cost, etc.
� Consider using multiple performance measures, e.g., Citibank case next week.