145-2010: sas® enterprise guide® 4.2: getting to code...
TRANSCRIPT

Paper 145-2010
SAS® Enterprise Guide® 4.2: Getting to Code You Andy Ravenna, SAS Institute Inc., New York, NY
ABSTRACT Both experienced and new users to SAS have a need for SAS Enterprise Guide to write and run their code. Experienced users are accustomed to entering all their code into the Program Editor window and simply clicking Submit. New users do not have this same set of expectations. However, both users will profit from the many features of SAS Enterprise Guide, such as modifying code that has been written by a task.
This paper introduces SAS Enterprise Guide 4.2 to experienced and new users of SAS who need to code. It focuses on the key points of a session involving coding: creating a project; accessing your data; writing, modifying, and storing your code. It also answers several common questions for SAS coders, such as “How do I write a LIBNAME statement in SAS Enterprise Guide?” and “How can I get to the code from a task and make changes to it?” Attendees receive enough information that they can return to the office with the confidence to start coding with SAS Enterprise Guide.
INTRODUCTION This paper is an introduction to coding with SAS Enterprise Guide. If you have absolutely no exposure to the SAS Enterprise Guide interface, complete the free Getting Started tutorial that is available from the Help menu. The tutorial is a great way to familiarize yourself with some of the features before you tackle coding. The audience for this paper falls into one of two very different categories:
• New Users who are unfamiliar with SAS coding • Experienced Users who have been coding in SAS for years
This paper was created with SAS 9.2 and SAS Enterprise Guide 4.2, running on top of a Microsoft Windows platform. SAS Enterprise Guide 4.2 was released in March 2009. If you are still using SAS Enterprise Guide 4.1, you will notice some enhancements to the interface and functionality, but the two versions are very similar.
New Users: To determine the version of SAS Enterprise Guide that you have, select Help►About SAS Enterprise Guide from the menus that are located at the top of the screen.
Experienced Users: If you want more details about the enhancements, select Help►SAS Enterprise Guide Help. Click the Contents tab, open the What’s New folder, and then select What's New in SAS Enterprise Guide 4.2. For more in-depth examples, see the 2009 SAS Global Forum Paper 320-2009, “What’s New in SAS® Enterprise Guide® 4.2?”
The scenario used in this paper refers to Freddie Mac mortgage data that is available from www.freddiemac.com. A Microsoft Excel spreadsheet contains Freddie Mac's Conventional Mortgage Home Price Index (CMHPI) data that is summarized at the Metropolitan level. The following quote from freddiemac.com defines these index values: “CMHPI provides a measure of typical price inflation for houses within the US.” These values will be imported from an Excel spreadsheet, manipulated through a DATA step, and produced into reports.
1
Foundations and FundamentalsSAS Global Forum 2010

GETTING STARTED There are three main areas to navigate when you use the current release of SAS Enterprise Guide: the project tree, the workspace area, and the resources pane.
Figure 1. The SAS Enterprise Guide Interface
The project tree displays data, code, and tasks. The workspace area displays the data, code, logs, results, and process flows. The resources pane enables you to display the task list, SAS folders, server list, or prompt manager. In addition to these three main areas, the toolbar at the top of the application gives you access to many of the basic functions.
2
Foundations and FundamentalsSAS Global Forum 2010
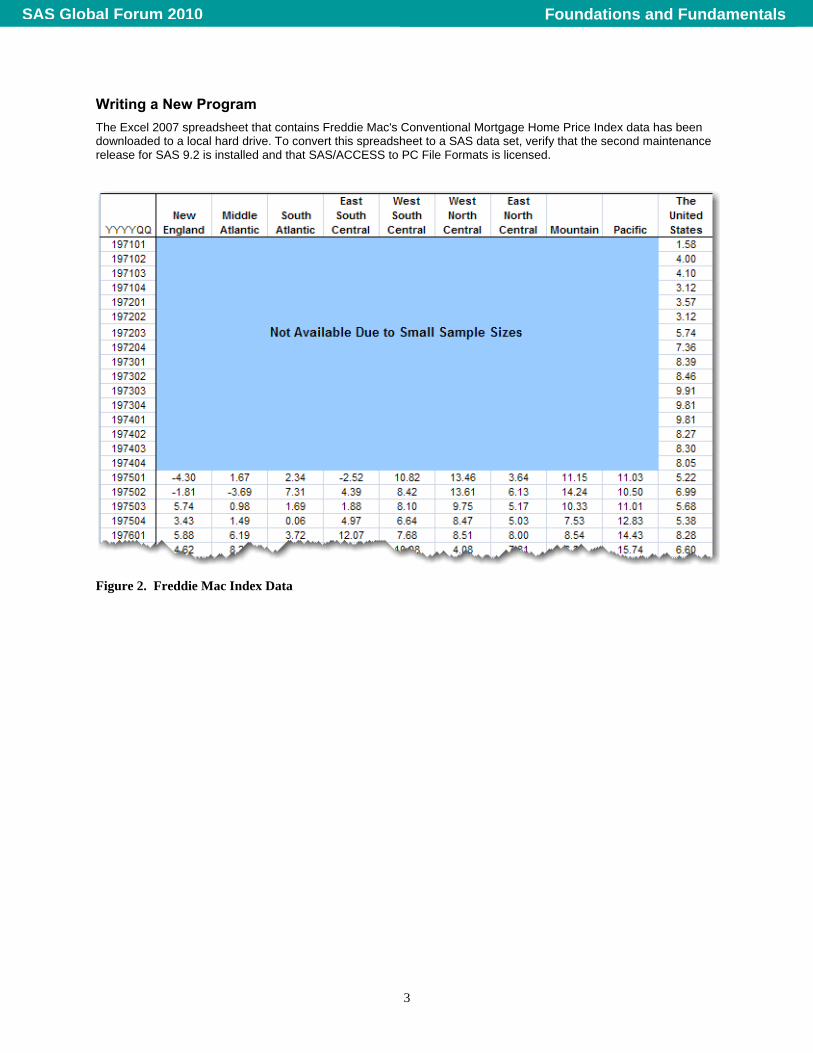
Writing a New Program The Excel 2007 spreadsheet that contains Freddie Mac's Conventional Mortgage Home Price Index data has been downloaded to a local hard drive. To convert this spreadsheet to a SAS data set, verify that the second maintenance release for SAS 9.2 is installed and that SAS/ACCESS to PC File Formats is licensed.
Figure 2. Freddie Mac Index Data
3
Foundations and FundamentalsSAS Global Forum 2010
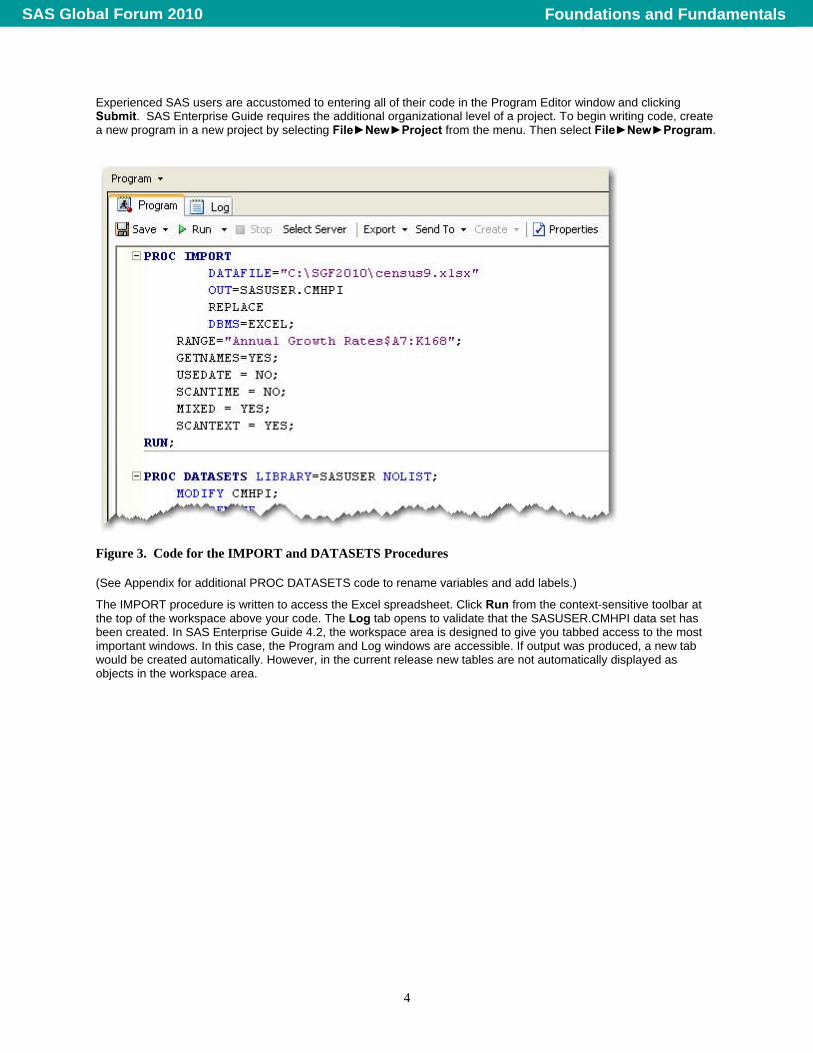
Experienced SAS users are accustomed to entering all of their code in the Program Editor window and clicking Submit. SAS Enterprise Guide requires the additional organizational level of a project. To begin writing code, create a new program in a new project by selecting File►New►Project from the menu. Then select File►New►Program.
Figure 3. Code for the IMPORT and DATASETS Procedures (See Appendix for additional PROC DATASETS code to rename variables and add labels.)
The IMPORT procedure is written to access the Excel spreadsheet. Click Run from the context-sensitive toolbar at the top of the workspace above your code. The Log tab opens to validate that the SASUSER.CMHPI data set has been created. In SAS Enterprise Guide 4.2, the workspace area is designed to give you tabbed access to the most important windows. In this case, the Program and Log windows are accessible. If output was produced, a new tab would be created automatically. However, in the current release new tables are not automatically displayed as objects in the workspace area.
4
Foundations and FundamentalsSAS Global Forum 2010
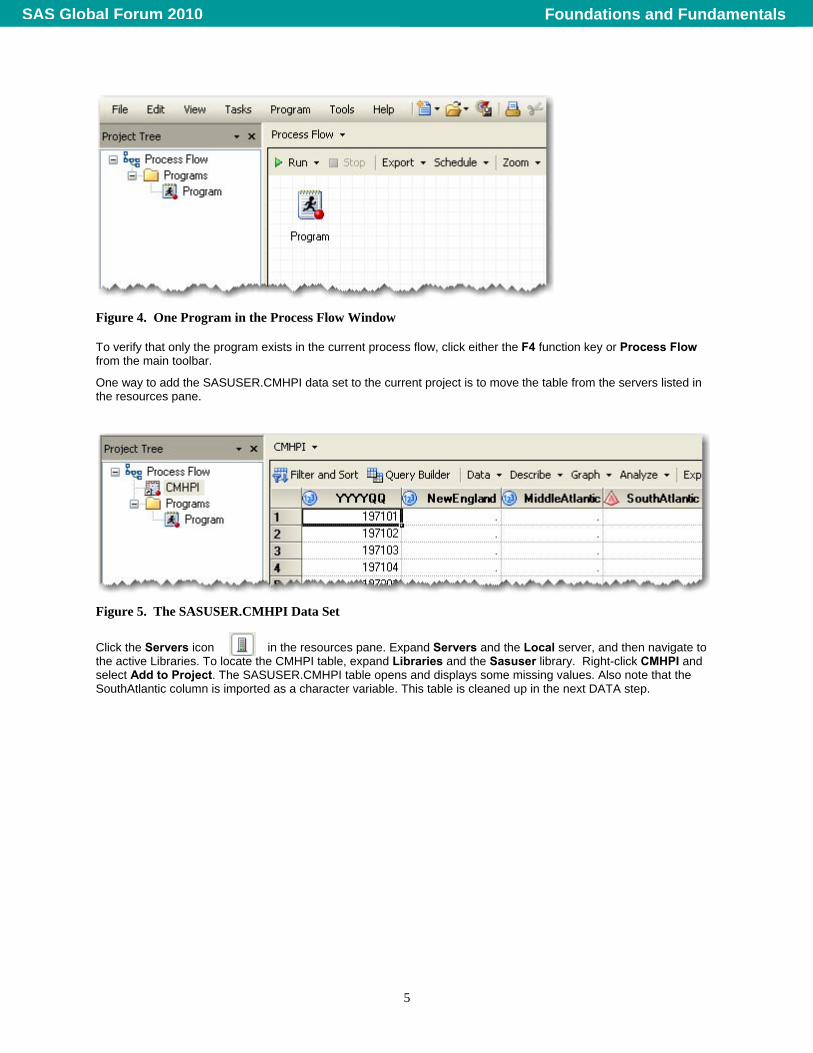
Figure 4. One Program in the Process Flow Window To verify that only the program exists in the current process flow, click either the F4 function key or Process Flow from the main toolbar.
One way to add the SASUSER.CMHPI data set to the current project is to move the table from the servers listed in the resources pane.
Figure 5. The SASUSER.CMHPI Data Set
Click the Servers icon in the resources pane. Expand Servers and the Local server, and then navigate to the active Libraries. To locate the CMHPI table, expand Libraries and the Sasuser library. Right-click CMHPI and select Add to Project. The SASUSER.CMHPI table opens and displays some missing values. Also note that the SouthAtlantic column is imported as a character variable. This table is cleaned up in the next DATA step.
5
Foundations and FundamentalsSAS Global Forum 2010

Figure 6. Linking the Code to the Table To return to the process flow view, click the F4 function key or Process Flow from the main toolbar. Because the SASUSER.CMHPI table was added to the project manually, it is not linked to the code. Right-click on the program, and then select Link Program to►CMHPI (Process Flow) ►OK. Rename the program by right-clicking on Program, selecting Rename, and then typing Import Index Data.
New Users: SAS Enterprise Guide connects objects with a solid line. Objects that you link together are connected by a dashed line.
Experienced Users: Connecting programs with links is one way to control the order in which programs are executed. SAS Enterprise Guide runs a project the way you read a book, from left to right and top to bottom. You can also control the order in which programs are executed by selecting File►New►Ordered List.
6
Foundations and FundamentalsSAS Global Forum 2010

Adding an Existing Program The code to clean up the CMHPI data set is stored in a local file named FIX_CMHPI.sas that is stored on the hard drive.
Figure 7. The Open Program Window
To open existing programs in SAS Enterprise Guide, select File►Open►Program and navigate to the desired file. Select the file, and then click Open.
New Users: Programs that are written in a project are automatically saved when the project is saved. There is no need to save programs to an external subdirectory. Existing programs that are added to projects are added only as shortcuts that point to their external location. The program is not automatically copied into the project.
Experienced Users: Programs that are written in a project are automatically saved and embedded in the project. Already-existing programs that are brought into a project become part of the project only if they are embedded by right-clicking the program and selecting Properties►General►Embed. The project can be used as a replacement for a single subdirectory. Programs can be saved externally to a project by selecting the program, and then selecting File►Save ‘Program Name’ As. If multiple subdirectories are desired as an organizational tool, multiple process flows can be used as an organizational structure.
7
Foundations and FundamentalsSAS Global Forum 2010
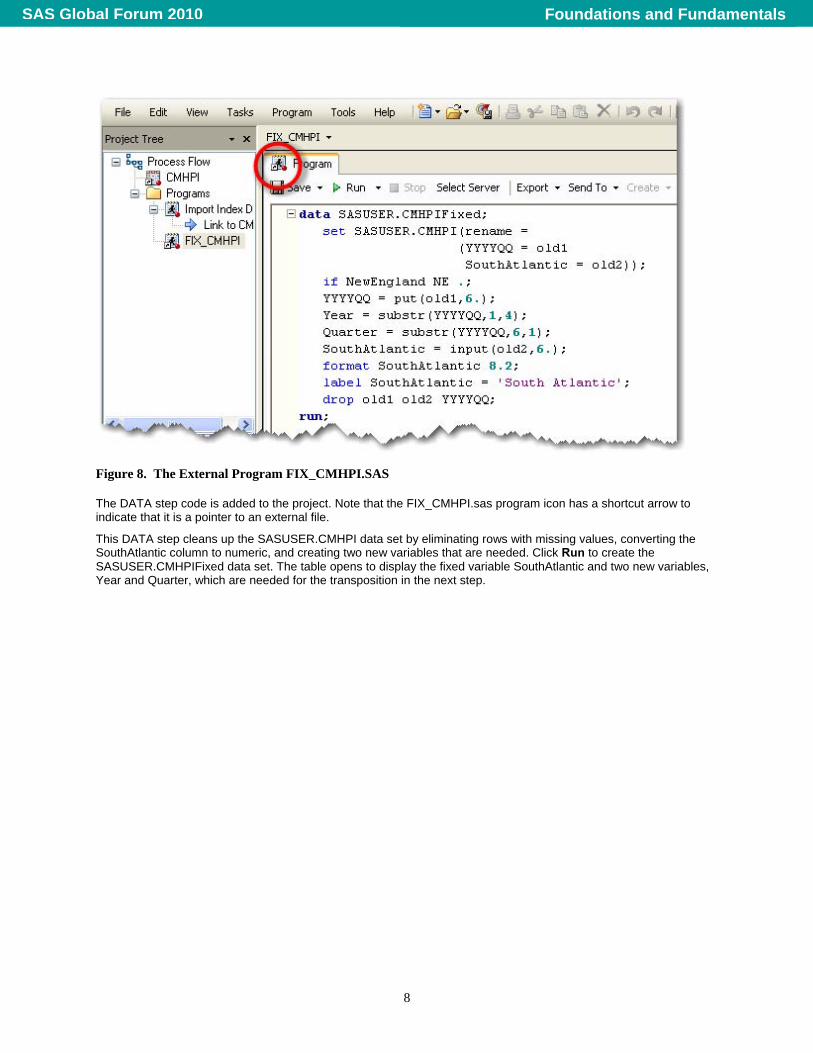
Figure 8. The External Program FIX_CMHPI.SAS The DATA step code is added to the project. Note that the FIX_CMHPI.sas program icon has a shortcut arrow to indicate that it is a pointer to an external file.
This DATA step cleans up the SASUSER.CMHPI data set by eliminating rows with missing values, converting the SouthAtlantic column to numeric, and creating two new variables that are needed. Click Run to create the SASUSER.CMHPIFixed data set. The table opens to display the fixed variable SouthAtlantic and two new variables, Year and Quarter, which are needed for the transposition in the next step.
8
Foundations and FundamentalsSAS Global Forum 2010

Figure 9. Linking the Two Programs
To show both programs in the current process flow, click either the F4 function key or Process Flow from the main toolbar. Link the programs in a logically dependent order by right-clicking on the CMHPI data set in the Process Flow window and selecting Link CMHPI to►FIX_CMHPI (Process Flow)►OK. To see the new process flow and the new data set SASUSER.CMHPIFixed at the same time, split the workspace area by selecting View►Workspace Layout►Stacked from the menu. In the bottom window of the workspace, scroll through the recently viewed items and select the FIX_CMHPI program. Then click the Output Data tab, which is the CMHPIFIXED table.
9
Foundations and FundamentalsSAS Global Forum 2010
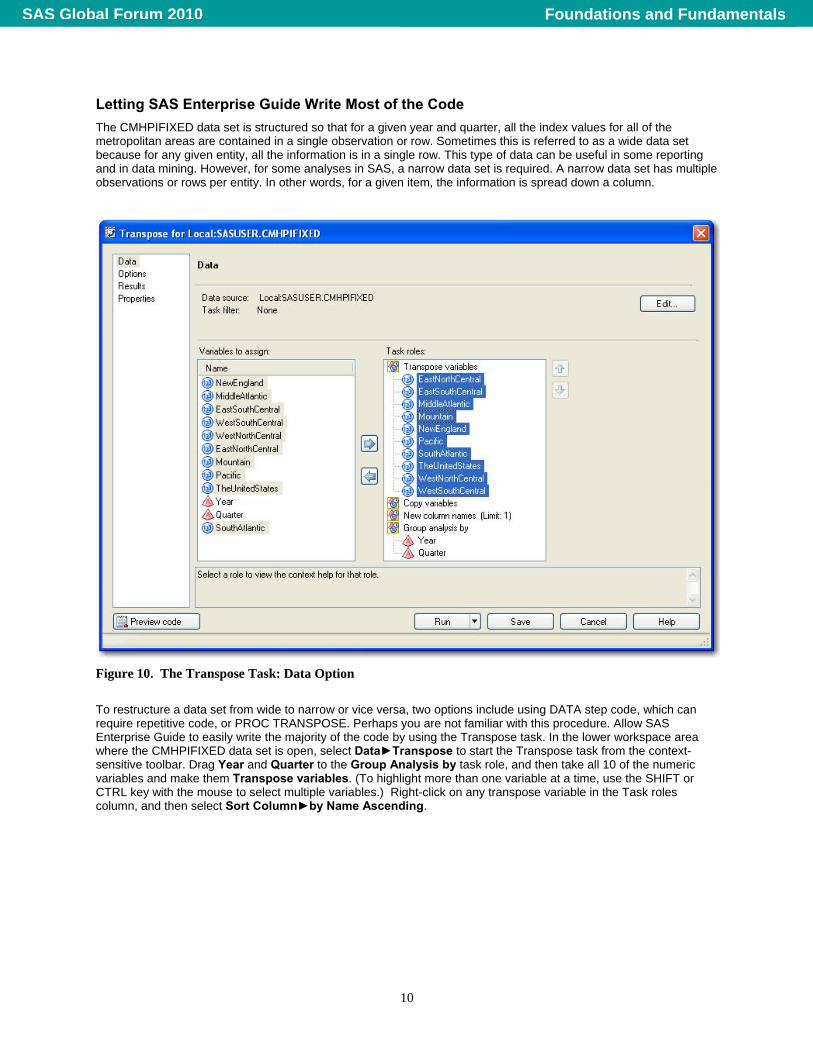
Letting SAS Enterprise Guide Write Most of the Code The CMHPIFIXED data set is structured so that for a given year and quarter, all the index values for all of the metropolitan areas are contained in a single observation or row. Sometimes this is referred to as a wide data set because for any given entity, all the information is in a single row. This type of data can be useful in some reporting and in data mining. However, for some analyses in SAS, a narrow data set is required. A narrow data set has multiple observations or rows per entity. In other words, for a given item, the information is spread down a column.
Figure 10. The Transpose Task: Data Option
To restructure a data set from wide to narrow or vice versa, two options include using DATA step code, which can require repetitive code, or PROC TRANSPOSE. Perhaps you are not familiar with this procedure. Allow SAS Enterprise Guide to easily write the majority of the code by using the Transpose task. In the lower workspace area where the CMHPIFIXED data set is open, select Data►Transpose to start the Transpose task from the context-sensitive toolbar. Drag Year and Quarter to the Group Analysis by task role, and then take all 10 of the numeric variables and make them Transpose variables. (To highlight more than one variable at a time, use the SHIFT or CTRL key with the mouse to select multiple variables.) Right-click on any transpose variable in the Task roles column, and then select Sort Column►by Name Ascending.
10
Foundations and FundamentalsSAS Global Forum 2010
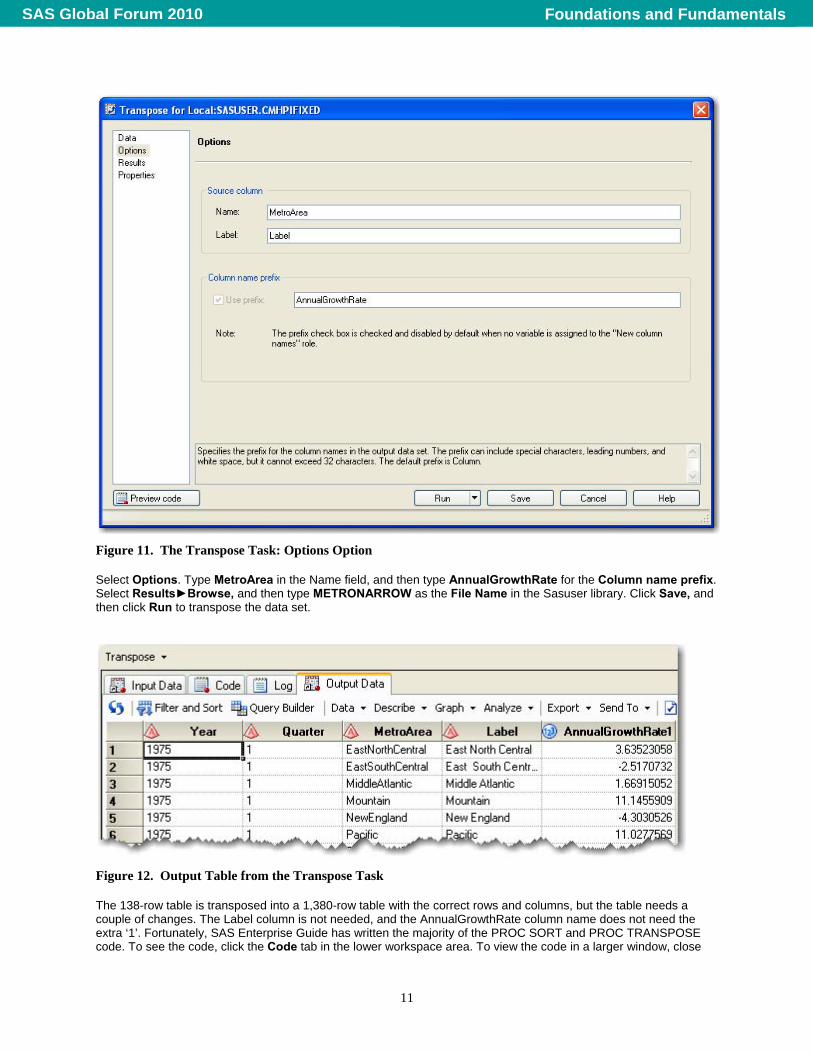
Figure 11. The Transpose Task: Options Option Select Options. Type MetroArea in the Name field, and then type AnnualGrowthRate for the Column name prefix. Select Results►Browse, and then type METRONARROW as the File Name in the Sasuser library. Click Save, and then click Run to transpose the data set.
Figure 12. Output Table from the Transpose Task The 138-row table is transposed into a 1,380-row table with the correct rows and columns, but the table needs a couple of changes. The Label column is not needed, and the AnnualGrowthRate column name does not need the extra ‘1’. Fortunately, SAS Enterprise Guide has written the majority of the PROC SORT and PROC TRANSPOSE code. To see the code, click the Code tab in the lower workspace area. To view the code in a larger window, close
11
Foundations and FundamentalsSAS Global Forum 2010

the process flow view in the upper workspace area by clicking the Close button in the upper right corner of the process flow.
Figure 13. Procedure Code Only from Transpose Task To make edits, begin entering text in the code window. SAS Enterprise Guide displays a message that enables you to create a copy of the read-only code that is associated with the task. Click Yes. In the new code window, delete any code that does not belong to either PROC SORT or PROC TRANSPOSE.
Figure 14. Transpose Task Code with Edits Made If you prefer to have the line numbers in the code window to help you make your edits, you can turn those on from the Options window. Select Tools►Options►SAS Programs►Editor Options►Show line numbers.
Starting on line 11 of the Code for Transpose program, add two data set options to the SASUSER.METRONARROW data set. Inside the open parenthesis after the LABEL="Transposed SASUSER.CMHPIFIXED" option, add rename = (AnnualGrowthRate1 = AnnualGrowthRate) and drop = Label. These two options will rename the Growth Rate column and drop the column that contains the old metro labels, respectively.
12
Foundations and FundamentalsSAS Global Forum 2010

Figure 15. SASUSER.METRONARROW Data Set Click Run to use your customized code to overwrite the previous SASUSER.METRONARROW table.
Adding a Library As a final piece of the data manipulation, store the new data set in a new library named Fredmac on the local hard drive.
Figure 16. Adding a LIBNAME Statement
To access the PROC TRANSPOSE code, click the Program tab in the Code for Transpose window. At line 10, add the following statement: libname FREDMAC "C:\SGF2010";. On line 12, change the Sasuser library to the new Fredmac library. Click Run and answer Yes to create the METRONARROW data set in the new permanent library.
New Users: Just like the code that is being submitted, the LIBNAME statement that you submit is executed on the machine defined as the current server. With default installations of both SAS and SAS Enterprise Guide on the same machine, the server is considered a local server and named Local.
Experienced Users: SAS is often installed on a machine other than the machine that is running SAS Enterprise Guide. In this case, the server is considered a remote server and the code (including LIBNAME statements) is executed on that remote machine. If there are multiple servers, you can select the server to run the program. If a code window is open, click Select Server at the top of the context-sensitive toolbar.
You can also assign LIBNAME statements by using the Assign Project Library wizard under the Tools menu. However, this library reference is deassigned when you close your SAS Enterprise Guide session and will need to be rerun at the beginning of the next SAS Enterprise Guide session that requires the library reference.
13
Foundations and FundamentalsSAS Global Forum 2010

Exporting the Code At this point there are three separate programs that are in an almost logical order. Link that third and final transpose program to the end of the other two programs, and then export all of the code into a single program on the hard drive.
Figure 17. Link Final Program To return to the process flow view, click either the F4 function key or Process Flow from the main toolbar. Right-click on the Transpose task, and then click Delete►Yes. Because you have the code from the Transpose task, you no longer need the task itself. Right-click on the CMHPIFIXED data set and select Link CMHPFIXED to►Code for Transpose (Process Flow)►OK.
14
Foundations and FundamentalsSAS Global Forum 2010

Figure 18. Export Three Programs into One From the menu at the top of the main application, select File►Export►Export All Code In Process Flow. Next, in the Export to file field, type C:\SGF2010\FredMacData.sas. To keep the code as simple as possible, deselect Include headers and Include generated wrapper code. Click Export to write all three programs into the single file FredMacData.sas.
15
Foundations and FundamentalsSAS Global Forum 2010

Creating a New Process Flow Now that the METRONARROW data set has been created, we’ll create a couple of reports in a new process flow to demonstrate some additional programming features in SAS Enterprise Guide.
Figure 19. A New Process Flow in the Same Project At the top of the main application, select File►New►Process Flow. Right-click the default name of Project Flow 1 in the project tree, and then select Rename. Change the name to Reports.
Perhaps you have never learned or written PROC REPORT code and you are unsure as to which task in SAS Enterprise Guide uses it. You can use the task list in the resources pane to discover the associations between tasks and procedures.
16
Foundations and FundamentalsSAS Global Forum 2010

Figure 20. The Relationship between Tasks and Procedures Revealed Click the Task List icon in the resources pane. Then select Tasks by Name located below the four resource icons. In the resource window, split the vertical view so that you can see both the Description list and the SAS Procedures list (you may need to widen the resources pane to view the split.) Click SAS Procedures and the Procedures list will rearrange in alphabetical order. Scroll to reveal that PROC REPORT is used by the List Report wizard.
17
Foundations and FundamentalsSAS Global Forum 2010
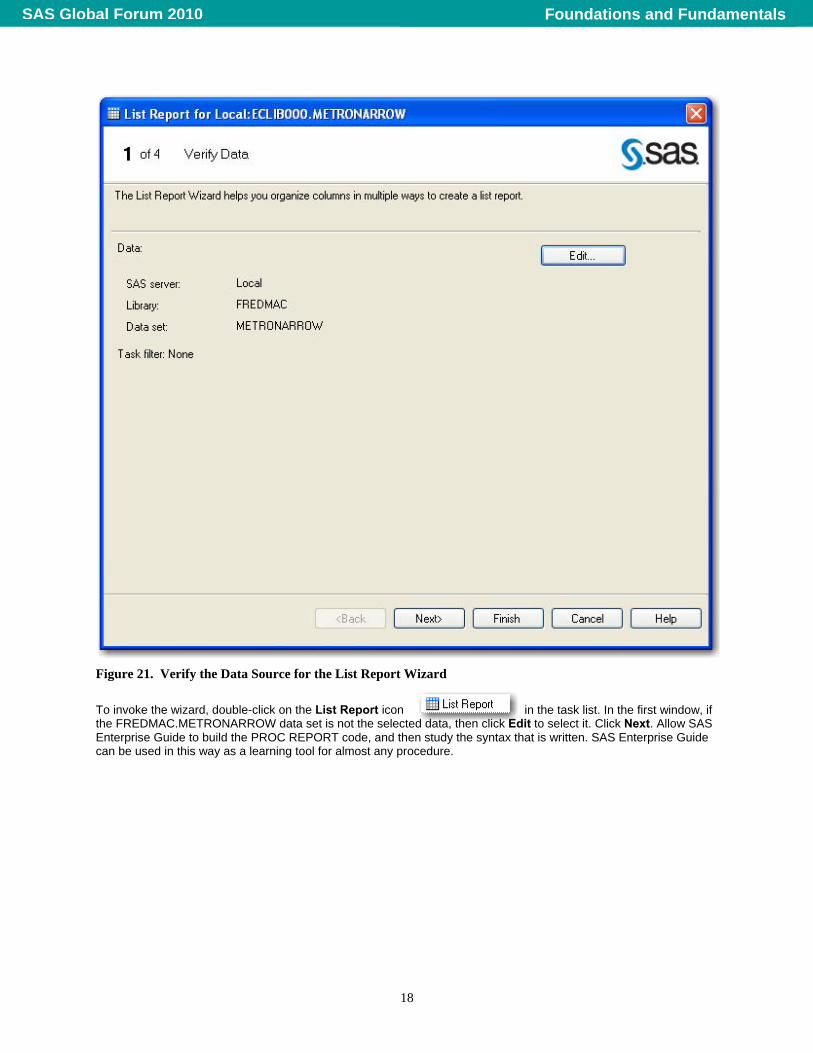
Figure 21. Verify the Data Source for the List Report Wizard
To invoke the wizard, double-click on the List Report icon in the task list. In the first window, if the FREDMAC.METRONARROW data set is not the selected data, then click Edit to select it. Click Next. Allow SAS Enterprise Guide to build the PROC REPORT code, and then study the syntax that is written. SAS Enterprise Guide can be used in this way as a learning tool for almost any procedure.
18
Foundations and FundamentalsSAS Global Forum 2010

Figure 22. Build the Table for the List Report Wizard In the second window of the wizard, right-click on the MetroArea column and select Delete. To produce a crosstab chart of quarter by year, right-click on the Quarter column and select Move►Position above►AnnualGrowthRate.
19
Foundations and FundamentalsSAS Global Forum 2010

Figure 23. Customizing the Table PROC REPORT has some great nesting features that you can take advantage of, so right-click on the AnnualGrowthRate column and select Duplicate. Then right-click on the first AnnualGrowthRate column and select Statistics►Show lowest value (MIN). For the second column, repeat and select Statistics►Show highest value (MAX). To keep the final report headings nice and simple, delete most of the column headings by right-clicking anywhere on the table and selecting Edit►Column Headings. Then deselect both the Select all and Display the type of statistic in the column headings check boxes before clicking OK.
Figure 24. Formatting the Analysis Variables
20
Foundations and FundamentalsSAS Global Forum 2010
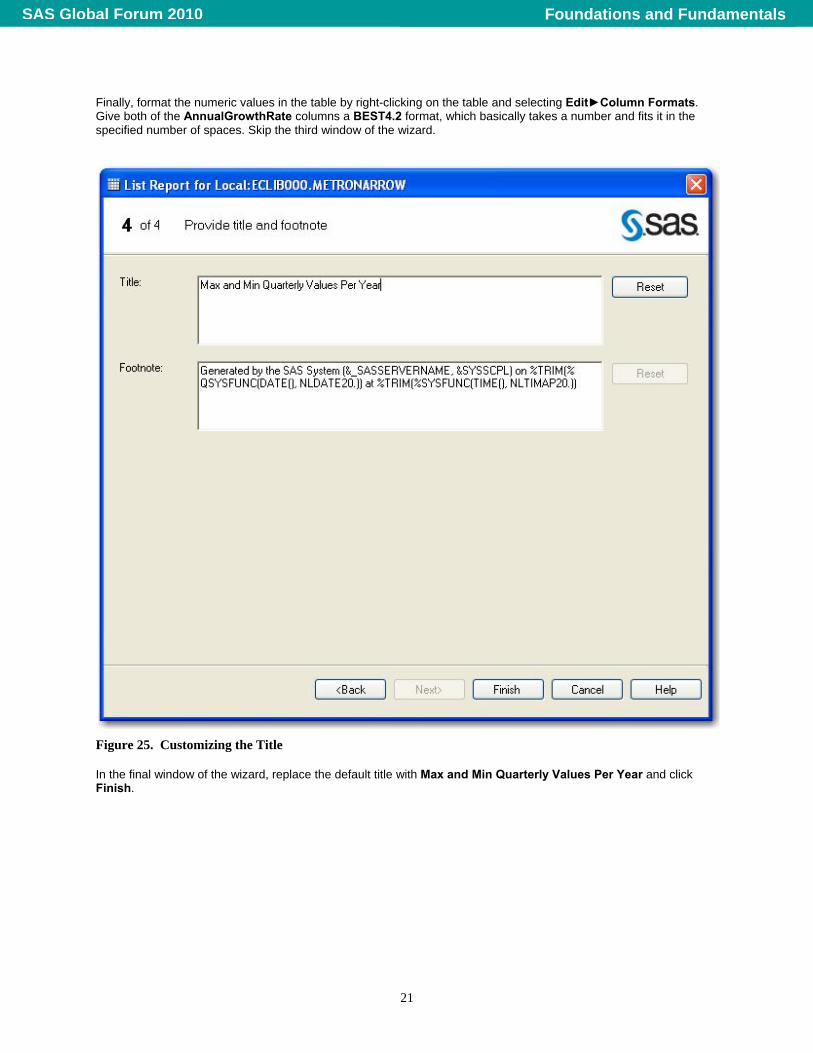
Finally, format the numeric values in the table by right-clicking on the table and selecting Edit►Column Formats. Give both of the AnnualGrowthRate columns a BEST4.2 format, which basically takes a number and fits it in the specified number of spaces. Skip the third window of the wizard.
Figure 25. Customizing the Title In the final window of the wizard, replace the default title with Max and Min Quarterly Values Per Year and click Finish.
21
Foundations and FundamentalsSAS Global Forum 2010

Figure 26. The Output from the List Report Wizard
Figure 27. The Code to Produce the Output By now you have probably figured out where to locate the code that created this report. (If not, click the Code tab in the workspace window.) You can now see that PROC REPORT uses the FORMAT= option rather than the FORMAT statement in a DEFINE statement. Even though the new Reports process flow was created before this report was created, the List Report wizard was placed in the original process flow because that was the location of the data source.
22
Foundations and FundamentalsSAS Global Forum 2010

Figure 28. Process Flow with List Report Wizard To return to the process flow view, click either the F4 function key or Process Flow from the main toolbar. Right-click on List Report and select Move List Report to Process Flow►0 Reports. In the upper left corner of the workspace area, select the Reports process flow to validate that the wizard was moved and that it brought the correct data source. This begins the organizational structure of having DATA step programming in one process flow and reporting programming in another.
New Users: Programmers who are new to SAS can take advantage of the fact that SAS Enterprise Guide stores all code, logs, and results inside one project. To save your project, select File►Save ‘Project Name’ As from the menu and choose the location.
Experienced Users: Programmers who have been writing SAS code for many years can choose to use traditional storage methods for their programs. As shown earlier, you can export all code in a project by using the Export All Code window. From either the process flow window or the project tree, you can also right-click almost any code, log, or output object and choose to save it individually to an external location.
Figure 29. The Bottom Rows of the Quarterly Report
The final row of the report contains some missing values that are represented as dots or periods. This is sometimes undesirable, so use SAS code to replace the missing periods with blanks.
23
Foundations and FundamentalsSAS Global Forum 2010

Figure 30. Inserting Custom Code before and after Tasks Are Run To open the Options window, select Tools►Options from the menu at the top of the application. Select the Custom Code option in the selection pane, and then select both the Insert custom SAS code before task and query code and Insert custom SAS code after task and query code check boxes. Click the Edit button for the “before” code and type options missing = “ “;. Click Save. To reset the option for other items that are run, such as code for SAS programs, change the option back. Click the Edit button for the “after” code and type options missing = “.“;. Click Save►OK.
24
Foundations and FundamentalsSAS Global Forum 2010

Figure 31. Missing Values Replaced with Blanks To refresh the report and see the new report, select Run►Run Reports from the process flow view. Modifying Code in a Task Another occasion where you might want to combine your coding skills and the code-writing abilities of SAS Enterprise Guide is in modifying the code of a task. Create a three-dimensional pie chart with the Freddie Mac data set in a task, and then edit the code to add a graph option.
Figure 32. Creating a Simple Pie Chart
To see the METRONARROW data set in the data grid, click the Input Data tab in the workspace area of the Reports process flow window. To start the Pie Chart task, select Graph►Pie Chart. For the Pie Chart option, select Simple Pie.
25
Foundations and FundamentalsSAS Global Forum 2010

Figure 33. Subset the Data Select the Data option in the selection pane and make MetroArea the Column to chart and AnnualGrowthRate the Sum of task role. Click Edit to open the Edit Data and Filter window. Use the menu in the task filter to select Year and Equal to. Then type 2000 in the third text entry box. (You can also click the ellipsis button directly to the right of the box to query the data for the year values.) Click OK. The capability to subset data directly in a task is a new feature in SAS Enterprise Guide 4.2.
26
Foundations and FundamentalsSAS Global Forum 2010

Figure 34. Selecting the Three-Dimensional Option Select the Layout option in the selection pane, and then click the 3 Dimensional radio button in the Dimension box.
27
Foundations and FundamentalsSAS Global Forum 2010

Figure 35. Display Averages in Pie Chart
Finally, select the Advanced option and choose Average as the Statistic used to calculate slice. Click Run to create the three-dimensional pie chart.
28
Foundations and FundamentalsSAS Global Forum 2010

Figure 36. Average Indexes for Year 2000
The pie chart can be enhanced by emphasizing the largest slice held by NewEngland. This option can be added to the task code.
29
Foundations and FundamentalsSAS Global Forum 2010

Figure 37. Entering Custom Code
To access the Pie Chart task that already contains the customizations you have made, select Modify Task in the workspace area. Click Preview code in the lower left corner of the task. In the Code Preview for Task window, click Insert Code to open the User Code window. You can make your code edits in the User Code window. Scroll in the User Code window until you find the <double-click to insert code> gray bar that falls between the NOHEADING option and the semicolon (;). Double-click on that gray bar to open the Enter User Code window. Type the following code: explode = “NewEngland”. Click OK twice, and then close the Code Preview for Task window. Now click Run, and then click Yes to replace the results.
30
Foundations and FundamentalsSAS Global Forum 2010

Figure 38. Pie Chart with NewEngland Slice Emphasized When you export the code from a customized task, all of the custom code is automatically included in the exported code. Because this pie chart includes both a subset on the original data set and some customized code, you can call attention to these changes in a project by adding a custom note.
Figure 39. Adding a Note to Indicate Customization To return to the Reports process flow view, click either the F4 function key or Reports from the main toolbar. Click the Pie Chart object in the process flow view to activate it. From the menu at the top of the application, select File► New►Note. In the Note window, type Filtered for year 2000 and Explode = option is used as custom code. Click Properties in the workspace area to access the Properties for Note window. Change the label to read Please Read!, and then click OK.
31
Foundations and FundamentalsSAS Global Forum 2010

Figure 40. The Reports Process Flow Window
To return to the Reports process flow view, click the F4 function key or Reports from the main toolbar.
CONCLUSION SAS Enterprise Guide provides many features for coders. For programmers who are just getting started, SAS Enterprise Guide can be used as a teaching tool. It can write the basic correct syntax for procedures that you are learning, and then you can dress it up with more options and customizations. For the hard-core coder who simply wants to continue to open a program window and start writing SAS code, this product provides the interface to enable you to do that. Clearly, the winning programmer will be the one who has the knowledge to use the best of both worlds—pointing and clicking when that is more efficient and being able to code when coding is more efficient.
APPENDIX Here is additional code that was used in the PROC IMPORT program:
PROC DATASETS LIBRARY=SASUSER NOLIST; MODIFY CMHPI; RENAME "New England"n = NewEngland "Middle Atlantic"n = MiddleAtlantic "South Atlantic"n = SouthAtlantic "East South Central"n = EastSouthCentral "East North Central"n = EastNorthCentral "West South Central"n = WestSouthCentral "West North Central"n = WestNorthCentral "The United States"n = TheUnitedStates ; LABEL yyyyqq = "YYYYQQ" NewEngland = "New England"
32
Foundations and FundamentalsSAS Global Forum 2010

33
MiddleAtlantic = "Middle Atlantic" SouthAtlantic = "South Atlantic" EastSouthCentral = "East South Central" WestSouthCentral = "West South Central" WestNorthCentral = "West North Central" EastNorthCentral = "East North Central" mountain = "Mountain" pacific = "Pacific" TheUnitedStates = "The United States" ; FORMAT NewEngland F12.2 MiddleAtlantic F12.2 EastSouthCentral F12.2 WestSouthCentral F12.2 WestNorthCentral F12.2 EastNorthCentral F12.2 mountain F12.2 pacific F12.2 TheUnitedStates F12.2 ; QUIT;
REFERENCES Fecht, Marje, and Rupinder Dhilon. 2009. “A SAS® Programmer’s Guide to SAS® Enterprise Guide®.” Proceedings of the SAS Global Forum 2009 Conference. Cary, NC: SAS Institute Inc. Hemedinger, Chris, and Anand Chitale. 2009. “What’s New in SAS® Enterprise Guide® 4.2?” Proceedings of the SAS Global Forum 2009 Conference. Cary, NC: SAS Institute Inc. Slaughter, Susan, and Lora Delwiche. 2008. “Writing Code in SAS® Enterprise Guide®.” Proceedings of the SAS Global Forum 2009 Conference. Cary, NC: SAS Institute Inc.
RECOMMENDED READING For a community of other SAS Enterprise Guide users, including SAS programmers, visit the SAS Enterprise Guide discussion forum at http://support.sas.com/forums.
CONTACT INFORMATION Your comments and questions are valued and encouraged. Contact the author:
Andy Ravenna SAS Institute Inc. 787 Seventh Avenue New York, NY 10019 212-757-3826 x54018 [email protected]
SAS and all other SAS Institute Inc. product or service names are registered trademarks or trademarks of SAS Institute Inc. in the USA and other countries. ® indicates USA registration.
Other brand and product names are trademarks of their respective companies.
Foundations and FundamentalsSAS Global Forum 2010