1400 ieee transactions on biomedical engineering…lomn/cours/cv/bme/histopatho/long... · 1400...
TRANSCRIPT

1400 IEEE TRANSACTIONS ON BIOMEDICAL ENGINEERING, VOL. 61, NO. 5, MAY 2014
Breast Cancer Histopathology Image Analysis:A Review
Mitko Veta∗, Josien P. W. Pluim, Paul J. van Diest, and Max A. Viergever
Abstract—This paper presents an overview of methods that havebeen proposed for the analysis of breast cancer histopathology im-ages. This research area has become particularly relevant with theadvent of whole slide imaging (WSI) scanners, which can performcost-effective and high-throughput histopathology slide digitiza-tion, and which aim at replacing the optical microscope as the pri-mary tool used by pathologist. Breast cancer is the most prevalentform of cancers among women, and image analysis methods thattarget this disease have a huge potential to reduce the workloadin a typical pathology lab and to improve the quality of the inter-pretation. This paper is meant as an introduction for nonexperts.It starts with an overview of the tissue preparation, staining andslide digitization processes followed by a discussion of the differentimage processing techniques and applications, ranging from anal-ysis of tissue staining to computer-aided diagnosis, and prognosisof breast cancer patients.
Index Terms—Breast cancer, computer-aided diagnosis, digitalpathology, histopathology, image analysis, object detection, objectsegmentation.
I. INTRODUCTION
PATHOLOGY Labs are currently undergoing a transforma-tion toward a fully digital workflow [1]. In addition to the
digital management of tissue samples, pathology orders, andreports, this includes the digitization of histopathology slidesand use of computer monitors for viewing them, which aimsto replace the optical microscope as the primary tool used bypathologists. This transformation has only recently been en-abled by the introduction of cost and time efficient whole slideimaging (WSI) scanners, as successors to microscope-mounteddigital cameras. This process of adoption of digital slide imagesis somewhat analogous to the digitization of radiological imag-ing. However, a full analogy is difficult to establish becausein pathology the primary object of analysis is the tissue rather
Manuscript received October 16, 2013; revised December 17, 2013; acceptedJanuary 19, 2014. Date of publication January 30, 2014; date of current ver-sion April 17, 2014. The work of M. Veta was financially supported by theproject Care4Me (Cooperative Advanced Research for Medical Efficiency) inthe framework of the EU research programme ITEA. Asterisk indicates corre-sponding author.
∗M. Veta is with the Image Sciences Institute, University Medical CenterUtrecht, Utrecht 3584 CX, The Netherlands (e-mail: [email protected]).
J. P. W. Pluim and M. A. Viergever are with the Image Sciences Institute,University Medical Center Utrecht, Utrecht 3584 CX, The Netherlands (e-mail:[email protected]; [email protected]).
P. J. van Diest is with the Department of Pathology, University MedicalCenter Utrecht, Utrecht 3584 CX, The Netherlands (e-mail: [email protected]).
Color versions of one or more of the figures in this paper are available onlineat http://ieeexplore.ieee.org.
Digital Object Identifier 10.1109/TBME.2014.2303852
than the image [2]. Adoption of a fully digital clinical workflowin radiology benefitted from the ability to acquire radiologi-cal images digitally. By contrast, the barrier to entry is higherfor histology, which is a distinctly analog modality that mustalways undergo an analog-to-digital conversion before comput-erized analysis.
A relatively large percentage of the samples that are analyzedin pathology labs are from breast cancer patients, since this dis-ease is the most prevalent form of cancer among women [3].Analysis methods that are routinely performed by pathologists,such as determination of the histological grade and the hormonereceptor status by immunohistochemistry (IHC), can be tediousand are hampered by observer variability [4], [5]. The histo-logical tumor grade is commonly determined according to themodified Bloom–Richardson system, which consists of semi-quantitative assessment of nuclear atypia, tubule formation, andmitotic activity [6], [7]. The analysis of immunohistochemicallystained slides mainly involves the estimation of the number ofcells that are positive for a particular antigen and the degree ofpositivity (staining intensity) [8], [9].
One of the main benefits of digital slides compared to con-ventional glass slides is that they enable the use of quantitativeautomatic image analysis methods. These methods have thepotential to tackle the problems that stem from the subjectiveinterpretation by pathologists and, at the same time, reduce theirworkload [10].
In this paper, we give an overview of image analysis methodsthat have been proposed for breast cancer histopathology im-ages. We focus on automatic image analysis of histopathologytissue preparations imaged by brightfield microscopy, since thiscovers the bulk of the work that is performed by pathologistsfor this disease. However, some techniques developed for othertissue types or microscopy modalities that are relevant for thescope of our paper are mentioned throughout the text when ap-propriate. For a broader overview of digital pathology and theuse of automatic methods for analysis of histopathology slides,we refer the reader to the recent reviews in [11]–[15].
II. TISSUE PREPARATION AND IMAGING
Before we proceed to discuss the different image analysisalgorithms and applications, we give an overview of the tissuepreparation and staining processes and digitization of histo-logical slides. In the typical hospital workflow, breast tumorexcisions or biopsies are performed in the operating room afterwhich the material is sent for analysis to the pathology lab. Thefirst step of the tissue preparation process is formalin fixationand embedding in paraffin. From the paraffin blocks, sections
0018-9294 © 2014 IEEE. Personal use is permitted, but republication/redistribution requires IEEE permission.See http://www.ieee.org/publications standards/publications/rights/index.html for more information.

VETA et al.: BREAST CANCER HISTOPATHOLOGY IMAGE ANALYSIS: A REVIEW 1401
Fig. 1. Example histological stains. (a) Hematoxylin and eosin. (b) IHC staining for ER. The antibody is visualized with the DAB chromogen (3, 3’-Diaminobenzidine) and the tissue is counterstained with hematoxylin. The nuclei that are dyed with the brown stain are considered to be positive. (c) IHC stainingfort HER2 with hematoxylin counterstaining. HER2 is expressed in the nuclear membranes.
with a thickness of 3–5 μm are cut using a microtome (a highprecision cutting instrument) and mounted on glass slides.
The structures of interest in the tissue, in most instances thenuclei and cytoplasm, are not readily visible on the mountedsections. They therefore need to be dyed with stains that high-light them. The standard staining protocol uses hematoxylin andeosin [H&E, Fig. 1(a)]. In spite of the fact that this staining pro-tocol has been in use for around a century, the diagnostic andprognostic procedure for all patients still almost always starts bystaining the sections with H&E. Hematoxylin binds to DNA andthereby dyes the nuclei blue/purple, and eosin binds to proteinsand dyes other structures (cytoplasm, stroma, etc.) pink.
IHC is a more advanced staining technique, which makes useof antibodies to highlight specific antigens in the tissue [seeFig. 1(b) and (c)]. In breast cancer, IHC is commonly used tohighlight the presence of estrogen (ER), progesterone (PR), andhuman epidermal growth factor 2 (HER2) receptors, as well asto assess the proliferation of the tumor, for example, by high-lighting the Ki-67 protein, which is associated with cell prolifer-ation [8], [9], [16]. When performing IHC, the tissue is usuallycounterstained with hematoxylin to identify the nuclei and tovisualize the tissue architecture (in case of nuclear antigens, vi-sualize the nuclei in which the target antigen is absent). Whenquantification is of primary interest, such as with the determina-tion of the ER, PR, and HER2 receptor status for breast cancerpatients by IHC, the staining protocols need to be standardizedand quality controlled in order to obtain reproducible results,which are comparable across different patients [17], [18].
Very often in breast cancer research, many different markershighlighted by IHC from hundreds or thousands of patients needto be considered. In order to achieve high-throughput analysis,researchers resort to using tissue microarrays (TMAs) [19], [20].TMAs are constructed by punching small core biopsies (usuallywith a core diameter of 0.6 mm) from selected regions of theparaffin blocks containing the tissue to be analyzed, and trans-ferring them to a recipient paraffin block in a regular pattern.The recipient paraffin block, which now contains tissue frommany different subjects, is then cut and stained in a standard-ized manner. Because with TMAs tissues from different patientsare stained under the same conditions, the resulting stainingvariability is significantly lower than with routinely prepared
histopathology slides, which makes them more suitable for im-age analysis.
Currently, the typical pathology lab workflow is concluded bystaining and coverslipping of the glass slides, after which theyare sent to the pathologist for analysis. As digital pathologybecomes more commonplace, slide digitization is added as anadditional stage to this workflow [1]. The early slide digitizationsystems were digital cameras mounted on standard microscopes,which could capture still images. Present day WSI scanners,which enable high throughput slide digitization at relatively lowcost, handle the entire scanning procedure automatically. Thisincludes loading of the slides on the scanning platform, detec-tion of the relevant tissue regions and focus point selection,image acquisition, compression, storing and registration on alaboratory information system. Most of the WSI scanners thatare currently in use perform slide scanning at 20× or 40×mag-nification with a spatial resolution in the order of 0.50 μm/pixeland 0.25 μm/pixel, respectively. Because of the large size, thecaptured RGB image is compressed most commonly with JPEGor JPEG 2000. For faster navigation, the images can be stored ina pyramid structure with increasing magnification at each levelof the pyramid. This also facilitates multiscale image analysis.
The tissue preparation, staining, and slide digitization pro-cesses can have a significant impact on the tissue/image appear-ance, and insight into them may lead to a better design of imageanalysis algorithms. The impact can be manifested in severalways. For example, improper fixation can lead to changes intissue morphology and thus induce incorrect tissue morphom-etry by automatic image analysis. If sections are not properlystained (i.e., over- or under-stained) and mounted, this may re-sult in out-of-focus regions and/or missing parts. Even smallvariations of the staining conditions can lead to variations in tis-sue appearance and cause problems for automatic image analysisalgorithms. This issue of staining/appearance variability will beconsidered in more detail in the following sections.
III. STAINING ANALYSIS
When performing image analysis of histopathology images,it is of interest to separate the histological stains that dye differ-ent tissue components. For instance, if the application is nuclei
1402 IEEE TRANSACTIONS ON BIOMEDICAL ENGINEERING, VOL. 61, NO. 5, MAY 2014
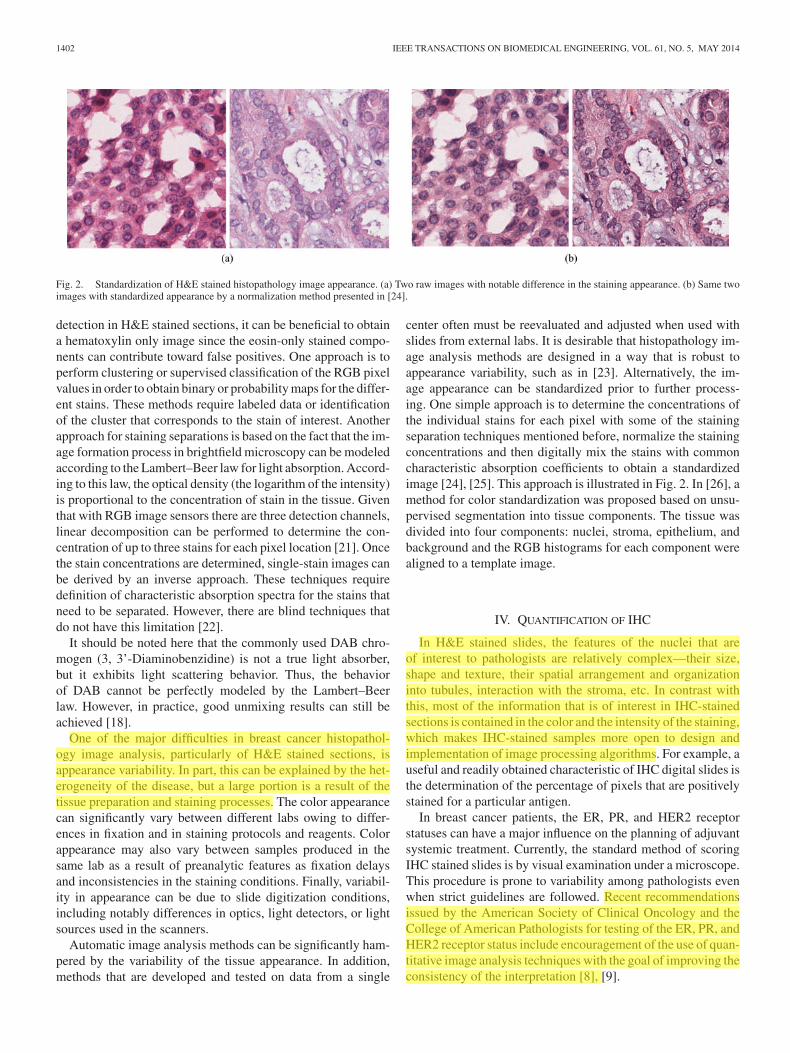
Fig. 2. Standardization of H&E stained histopathology image appearance. (a) Two raw images with notable difference in the staining appearance. (b) Same twoimages with standardized appearance by a normalization method presented in [24].
detection in H&E stained sections, it can be beneficial to obtaina hematoxylin only image since the eosin-only stained compo-nents can contribute toward false positives. One approach is toperform clustering or supervised classification of the RGB pixelvalues in order to obtain binary or probability maps for the differ-ent stains. These methods require labeled data or identificationof the cluster that corresponds to the stain of interest. Anotherapproach for staining separations is based on the fact that the im-age formation process in brightfield microscopy can be modeledaccording to the Lambert–Beer law for light absorption. Accord-ing to this law, the optical density (the logarithm of the intensity)is proportional to the concentration of stain in the tissue. Giventhat with RGB image sensors there are three detection channels,linear decomposition can be performed to determine the con-centration of up to three stains for each pixel location [21]. Oncethe stain concentrations are determined, single-stain images canbe derived by an inverse approach. These techniques requiredefinition of characteristic absorption spectra for the stains thatneed to be separated. However, there are blind techniques thatdo not have this limitation [22].
It should be noted here that the commonly used DAB chro-mogen (3, 3’-Diaminobenzidine) is not a true light absorber,but it exhibits light scattering behavior. Thus, the behaviorof DAB cannot be perfectly modeled by the Lambert–Beerlaw. However, in practice, good unmixing results can still beachieved [18].
One of the major difficulties in breast cancer histopathol-ogy image analysis, particularly of H&E stained sections, isappearance variability. In part, this can be explained by the het-erogeneity of the disease, but a large portion is a result of thetissue preparation and staining processes. The color appearancecan significantly vary between different labs owing to differ-ences in fixation and in staining protocols and reagents. Colorappearance may also vary between samples produced in thesame lab as a result of preanalytic features as fixation delaysand inconsistencies in the staining conditions. Finally, variabil-ity in appearance can be due to slide digitization conditions,including notably differences in optics, light detectors, or lightsources used in the scanners.
Automatic image analysis methods can be significantly ham-pered by the variability of the tissue appearance. In addition,methods that are developed and tested on data from a single
center often must be reevaluated and adjusted when used withslides from external labs. It is desirable that histopathology im-age analysis methods are designed in a way that is robust toappearance variability, such as in [23]. Alternatively, the im-age appearance can be standardized prior to further process-ing. One simple approach is to determine the concentrations ofthe individual stains for each pixel with some of the stainingseparation techniques mentioned before, normalize the stainingconcentrations and then digitally mix the stains with commoncharacteristic absorption coefficients to obtain a standardizedimage [24], [25]. This approach is illustrated in Fig. 2. In [26], amethod for color standardization was proposed based on unsu-pervised segmentation into tissue components. The tissue wasdivided into four components: nuclei, stroma, epithelium, andbackground and the RGB histograms for each component werealigned to a template image.
IV. QUANTIFICATION OF IHC
In H&E stained slides, the features of the nuclei that areof interest to pathologists are relatively complex—their size,shape and texture, their spatial arrangement and organizationinto tubules, interaction with the stroma, etc. In contrast withthis, most of the information that is of interest in IHC-stainedsections is contained in the color and the intensity of the staining,which makes IHC-stained samples more open to design andimplementation of image processing algorithms. For example, auseful and readily obtained characteristic of IHC digital slides isthe determination of the percentage of pixels that are positivelystained for a particular antigen.
In breast cancer patients, the ER, PR, and HER2 receptorstatuses can have a major influence on the planning of adjuvantsystemic treatment. Currently, the standard method of scoringIHC stained slides is by visual examination under a microscope.This procedure is prone to variability among pathologists evenwhen strict guidelines are followed. Recent recommendationsissued by the American Society of Clinical Oncology and theCollege of American Pathologists for testing of the ER, PR, andHER2 receptor status include encouragement of the use of quan-titative image analysis techniques with the goal of improving theconsistency of the interpretation [8], [9].
VETA et al.: BREAST CANCER HISTOPATHOLOGY IMAGE ANALYSIS: A REVIEW 1403
The ER and PR receptor statuses are customarily determinedby counting the percentage of positively stained nuclei. If thispercentage is above a predefined threshold (10% in Europe and1% in the USA) the tissue is defined positive. The automaticquantification of the ER and PR status thus usually involvesthe use of an automated nuclei detection or segmentation al-gorithm [27] (this topic will be covered in detail in the fol-lowing section). As an alternative to this, the percentage ofpositively stained nuclear area can be determined [28]. In [29],a method which computes features that reflect the area of pos-itively stained nuclei and the nuclear intensity was proposed.These features were then mapped to an ordinal scale that is usedby pathologists.
In comparison with the ER and PR receptors, which areexpressed in the cell nuclei, the HER2 receptor is expressedon the cell membranes. The tumors are scored positive whenmore than 30% of the cell membranes show complete, uniform,and intensive staining. Cases with complete but nonuniformor weak staining in more than 10% of the cells are equivocal,and cases with no staining or incomplete staining are definedto be negative. Equivocal cases are further evaluated by othermethods [30].
The largest challenge in HER2 staining quantification liesin correct membrane segmentation, which can be particularlychallenging in negative cases and cases with incomplete andfaint staining. A method for automated assessment of HER2IHC is presented in [31]. In the first stage of this approach, allimage pixels are classified as belonging to epithelial nuclei orcell membranes. The nuclear regions are further segmented intoindividual nuclei by watershed segmentation and the cell mem-branes are determined by adaptive ellipse fitting. Slides are thenclassified into one of the three scoring groups based on featuresdescribing the membrane staining intensity and completeness.In [32], following nuclei segmentation, approximate membranecontours were determined by Voronoi tessellation. The approxi-mate contours were then refined based on the membrane stainingintensity. Hall et al. [33] proposed a method where features forHER2 quantification were extracted based on positive controls,thus eliminating the variability in the staining between differentslides.
Most of the commercially available image analysis tools in-clude algorithms for positive nuclei counting and membranestaining quantification. A review of imaging solutions for quan-titative IHC can be found in [34]. Two publicly available webapplications for ER/PR and HER2 quantifications are describedin [28] and [35]. In various recent studies, automatic scoring hasshown high agreement with expert scoring and other methods(such as FISH for HER2 scoring) [36]–[44].
V. OBJECT DETECTION AND SEGMENTATION
A. Tissue and Tissue Components Segmentation
The typical histopathology slide contains a tissue area ofapproximately 15 mm × 15 mm. At the resolutions at whichdigital slides are captured, this will result in images with asize of up to several gigapixels. Because processing of thesevery large images might result in computational problems, it is
common practice to identify the regions of the slides that are ofinterest prior to performing more detailed image analysis.
Generally, large portions of the slides are empty, i.e., theydo not contain tissue. Most WSI scanners have the ability toidentify empty tiles in the slide during the scanning process andavoid scanning them, which results in reduction of scanningtime. One such approach for supervised tissue localization wasproposed in [45].
When analysis of TMAs is performed, the individual TMAcores need to be identified and segmented and their coordinateson the TMA grid need to be assigned so they can be matched tothe donor paraffin block [46]–[48].
In general, large areas of the tissue are not relevant for theproblem at hand. For example, for computer-aided diagnosisof breast cancer (classification into the classes benign or ma-lignant) only the epithelial regions of the tissue are relevant.When quantification of IHC or histological grading needs to beperformed, only the tumor tissue is of interest and nontumorregions need to be excluded from the analysis. Furthermore,epithelial and stromal regions of the tumor have different sig-nificance for prognosis. Segmentation of the tumor into thesecomponents is often used as a preprocessing step when per-forming automatic morphometry and histological grading, orfor guidance when constructing TMAs [49]. In the majority ofthe published studies on tissue segmentation, this kind of com-partmentalization is achieved by supervised pixel-wise classi-fication of small rectangular image regions based on color andtexture features [50]–[54], although unsupervised methods havebeen proposed [55].
B. Nuclei Detection and Segmentation
The segmentation of nuclei in breast cancer histopathologyimages can be considered a basic functional block in many dif-ferent applications. Quantification of IHC nuclear staining hasalready been mentioned in the previous section. Other applica-tions include extraction of prognostically relevant morphomet-ric features (size, shape, chromatin texture), automatic nuclearpleomorphism grading as part of a computer-aided prognosissystem, detection of lymphocytic infiltration, and detection ofmalignancy and tubule formation in a bottom-up manner.
Nuclei segmentation remains a very challenging problem,particularly for routinely stained H&E sections, despite the nu-merous attempts to solve it. Many of the challenges arise fromthe variability of the tissue appearance, which is in part dueto imperfections in the staining process. Furthermore, there isan inherent diversity of the appearance of epithelial cancer-ous nuclei, which may vary from almost normal-like round tohighly irregularly shaped and enlarged nuclei with coarse andmarginalized chromatin and prominent nucleoli (small roundstructures inside the nuclei). This is illustrated in Fig. 3. Differ-ent nucleus types, such as elongated fibroblasts and lymphocytenuclei, often appear together with epithelial nuclei, which candecrease the specificity when only epithelial nuclei need to bedetected or segmented. Additionally, nuclei may be overlap-ping, clustered or tightly clumped, which makes them difficultto separate. Lastly, hematoxylin-stained “junk” particles, which

1404 IEEE TRANSACTIONS ON BIOMEDICAL ENGINEERING, VOL. 61, NO. 5, MAY 2014
Fig. 3. Different nuclei appearances in breast cancer histopathology images (from left to right): small and round with relatively uniform chromatin, organizedinto tubules, marginalized chromatin, and prominent nucleoli.
tend to appear in high-grade tumors, can hamper the nucleisegmentation.
A large variety of approaches for segmentation of nuclei inbreast cancer histopathology images have been proposed. Theyvary not only as concerns the segmentation method proper, butalso in the pre- and postprocessing steps that aim to improvesegmentation performance.
The most difficult aspect of nuclei segmentation in breast can-cer histopathology images is the detection of individual nuclei,especially when they are clustered closely together and overlap.Some proposed methods try and identify the individual nucleiprior to performing the segmentation procedure (marker extrac-tion), whereas others first segment clumps of nuclei from the restof the tissue and then proceed to separate those into individualnuclei. Methods such as the Hough transform [56] and votingalong the direction of the image gradient to infer the center ofthe object [57], [58] have been used for both identification ofnucleus markers and separation of segmented clumps. Anotherpopular approach to separate clumps of nuclei is to split themalong points of high concavity [59], [60]. In [61], separation ofclustered nuclei is achieved by unsupervised Bayesian classifi-cation. Supervised methods for nuclei detection have also beenproposed, with good performance [62].
With regards to the core segmentation technique, active con-tours are among the more popular methods [56], [57], [63]. Theirobjective is to find a minimum energy fit of moving contoursto the image, the energy being defined in such a way that thecontours are attracted to the boundaries of the objects of inter-est. The contours need to be seeded close to the target nucleilocations, which is why the approach is usually paired with anuclei detection method. In [57], the level set active contourssegmentation includes a repulsion term to prevent the contoursof adjacent cells from overlapping. The active contour model fornuclei and lymphocyte nuclei segmentation proposed in [63] in-corporates boundary, region and shape prior terms, and performssimultaneous segmentation of multiple objects in the image.
Several methods have been proposed that work by initiallydefining a large number of candidate regions and then selectingthe ones that are likely to represent a correctly segmented object.In [64], candidate regions are identified by the maximally sta-ble extremal regions (MSER) detector. This detector producesa large number of potentially overlapping regions. Each candi-date region is evaluated with a statistical model, and dynamic
programming is used to select a set of nonoverlapping regionsthat best fit the model. The authors of [59] proposed gener-ating a very large number of candidate objects by identifyingall possible closed contours within the image by contour trac-ing. A set of nonoverlapping contours is obtained by definingthe objects that are most “fit” based on the contour gradientstrength. In [58], candidate regions are initially identified bya marker-controlled watershed approach at multiple scales andusing multiple marker types, which yields a large number ofoverlapping contours. Regions unlikely to represent valid nu-clei are removed based on size, shape, boundary, and chromatindistribution features. Local concurrences are resolved by greedyselection of the contours most likely to represent nuclei, usingthe solidity of the object as a fitness value.
Other recently proposed and promising methods for nucleisegmentation in breast cancer histopathology are based on dic-tionaries of discriminative image patches [65] and marked pointprocesses [66], [67].
Detection and segmentation of lymphocyte nuclei and detec-tion of lymphocytic infiltrations can be considered specials caseof nuclei detection/segmentation. In [68], region growing withhigh sensitivity and low specificity is used to initially segmentlymphocyte nuclei and other objects. Then, maximum a poste-riori estimation that incorporates size, luminance, and spatialproximity information is used to improve the specificity of thedetector. Finally, the results from the lymphocyte nuclei de-tection are input to a classifier that discriminates between thelymphocyte infiltration phenomenon and the baseline level oflymphocytes. In [60], output from a Gaussian mixture clus-tering algorithm is used to initialize geodesic active contoursegmentation. The overlapping objects are resolved by split-ting them along high concavity points. Lymphocyte nuclei aredistinguished from other objects by texture-based clustering.
The choice of the segmentation method is closely relatedto the intended application and the available time and com-putational resources. For example, active contours may yieldsuperior nuclear segmentation, but at the cost of increased com-putational complexity, which limits their use for high throughputapplications. When such high throughput processing is needed,a simple thresholding of the hematoxylin channel followed bymorphological operations and splitting of clusters along highconcavity points might be used, but at the cost of less accuratesegmentation results.

VETA et al.: BREAST CANCER HISTOPATHOLOGY IMAGE ANALYSIS: A REVIEW 1405
Fig. 4. Mitotic figures in breast cancer histopathology images. a) Region from a PPH3 labeled section. This staining method is specific to cells in the M phasewhich are clearly visible as dark brown objects (marked with green arrows). b) The same section stained with H&E. The corresponding four mitotic figures arevisible as hyperchromatic objects. However, many other similar objects appear which complicates mitosis counting.
So far we have only listed methods that specifically aim atdealing with nuclei segmentation in breast cancer histopathol-ogy sections imaged with brightfield microscopy as an ap-plication. However, methods developed for other tissue types(e.g., prostate) or microscopy modalities (e.g., fluorescence mi-croscopy) can also be applied to this problem [69]–[77]. In orderto use these methods, some adaptation of some of the image pro-cessing steps will likely be needed, for example, modificationof the way a nuclear staining image is obtained.
C. Tubules Segmentation
Along with nuclear pleomorphism, the degree of structuraldifferentiation of the tissue is one of the earliest prognosticfactors for breast cancer patients that have been identified bypathologists. Cancer disrupts the ability of the nuclei to commu-nicate with each other and organize themselves into structuressuch as tubules, making the lack of tubule formation an indica-tor for advanced malignancy. The tubules are generally roundor oval structures consisting of lumen surrounded by a layer ofepithelial cells. The major challenge in tubule segmentation isthe similar appearance of other structures, such as adipose tis-sue or tears formed during the tissue preparation process, whichonly lack the outside layer of well-arranged epithelial nuclei.
A color gradient-based geodesic active contour model forsegmentation of the tubular lumen areas was proposed in [78].The segmentation is initialized by weighted mean shift cluster-ing and normalized cuts, and performs more favorably than theChan-Vese region-based active contour model. This study wasextended in [79] by incorporating domain knowledge to distin-guish between tubules and other lumen-like areas. The authorsshow that the segmentation result can be used to infer the de-gree of tubule formation as defined in the Bloom–Richardsongrading system. Although the literature for tubule segmentationin breast cancer is not extensive, methods developed for seg-mentation of other related structures are also applicable to thisproblem. A very closely related application is segmentation ofglands in prostate cancer histopathology images [70], [80]–[82].The methods developed for this application might be used fortubule segmentation in breast cancer with little adaptation. Itshould also be mentioned that some of the features that can
be derived by performing segmentation of tubules, can also becaptured by computing features that describe the overall archi-tecture of the tissue [83], [84].
D. Mitotic Figures Detection and Assessment of Proliferation
Of the three components that are part of histological gradingof breast cancer, the assessment of tumor proliferation is proba-bly the most important and prognostically significant one [85].The oldest and still most widely used form of assessment oftumor proliferation is counting of mitotic figures in a predefinedtissue area (usually 2 mm2). The nuclei of the cells that are inthe M phase of the cell cycle have distinctive morphologicalappearance in the H&E sections. Most commonly, mitotic fig-ures manifest themselves as hyperchromatic objects without aclear nuclear membrane, with “hairy” protrusions around theedges and basophilia instead of eosinophilia in the surroundingcytoplasm. However, these are more instructive than definingfeatures, and the bulk of the training of pathologists consistsof looking at specific examples of mitotic figures designated assuch by experts. The task of identifying mitotic figures is noto-riously time-consuming and difficult, due to the fact that manyother objects such as apoptotic and necrotic nuclei may havesimilar appearance, which renders it difficult even for trainedexperts to make a distinction. Lymphocyte nuclei, compressednuclei, “junk” particles, and other artifacts from the tissue prepa-ration process can also have a hyperchromatic appearance.
In addition to mitosis counting in H&E sections, there arealso IHC techniques that can be used for assessment of prolif-eration of breast cancer tumors. However, they are not routinelyused owing to increased cost and additional time delay. Themost widely used IHC technique is labeling of the Ki-67 anti-gen that is associated with cell proliferation and expressed inall cell cycle phases except G0 [86]. Because Ki-67 labelingis unspecific to the M phase, the assessment of the number ofmitotic figures is usually higher than by counting in H&E sec-tions and it might not have the same significance. A proposedalternative to Ki-67 is phosphohistone H3 (PPH3) that has theadvantage of targeting only nuclei in the M phase, and has beenshown to have prognostic significance [87]. An example regionlabeled for PPH3 is shown in Fig. 4(a). In both of these staining

1406 IEEE TRANSACTIONS ON BIOMEDICAL ENGINEERING, VOL. 61, NO. 5, MAY 2014
methods, the techniques for quantification of positively stainednuclei discussed in Section III can be used.
The standard approach of assessing tumor proliferation inpathology labs, however, still remains mitosis counting. Giventhat this is the most tedious part of the Bloom–Richardson grad-ing system, there is a large incentive to develop an automaticmitosis detection algorithm that works with the routinely pre-pared H&E sections.
The earliest proposed approaches were unavoidably ham-pered by the limited image acquisition quality and computa-tional power [88] and the need of specialized staining such asFeulgen to better highlight the chromatin [89], [90]. Recently,two publicly available datasets of H&E stained breast cancerhistopathology images with annotated mitotic figures were madeavailable [91], [92], which sparked further development of dif-ferent mitosis detection approaches [93]–[102].
The majority of the proposed approaches work by first iden-tifying candidate objects or locations that are then classifiedas mitotic figures or other objects. By far, the most distinctivefeature of the mitotic figures is their hyperchromicity. In mostcases, the intensity of the staining of the mitotic figures is notice-ably darker than normal epithelial nuclei and only comparableto apoptotic, necrotic or compressed nuclei (artifact from thetissue preparation) and lymphocyte nuclei. This is illustrated inFig. 4(b). The candidate extraction phase often may make use ofthis distinctiveness by performing thresholding, local intensityminima detection or pixel-wise classification followed by refin-ing of the detected regions by morphological operations and/oractive contours segmentation. In the second stage, more spe-cialized features designed to capture the specific morphology ofmitotic figures are used to train a classification model. However,convolutional neural networks that operate on raw RGB imagepatches appear to exhibit the best performance for this detectiontask [93], [97], [98]. The approach that was proposed in [93]is unique in the sense that it uses deep convolutional neuralnetworks and does not perform candidate detection as an initialstage. Instead, it performs classification at every pixel location,which achieves excellent results.
A limiting factor of automatic mitosis detection is that wholeslide images are typically scanned at a single focal plane. Dur-ing mitosis counting, pathologists rely on “fine tuning” of thefocus—something that is missing in whole slide images at asingle focal plane. Digital slide scanners that perform imageacquisition at multiple focal planes are now becoming morecommon; however, this feature is not widely used because ofthe increased storage demands. We anticipate that in the future,as storage costs go down and new image compression techniquesbecome available, this limitation will be removed.
VI. COMPUTER-AIDED DIAGNOSIS AND PROGNOSIS
The objective of image analysis of digitized histopathologyslides is to facilitate, and preferably automate, computer-aideddiagnosis and prognosis (CAD and CAP) in pathology labs.CAD is defined as the detection of cancer within the examinedtissue, whereas CAP addresses the more complex problem ofpredicting the outcome for the patient based on the available
data. There are numerous challenges in achieving this objective,including the large image sizes and the lack of representativedatasets with high quality annotations by multiple observers,and with patient follow-up. On the other hand, the incentives fordeveloping CAD and CAP systems are overwhelming. Patientsthat are suspected of having breast cancer undergo a biopsy thatis examined by a pathologist. Large numbers of cases are foundto be benign [103], often easily distinguishable from cancer,which implies that a CAD system operating at high sensitivitycan significantly reduce the workload of the pathologist, evenif the specificity is moderate. This kind of system can also beused for quality control and assurance, for example, to identifypositive cases that have been missed during the routine exam-ination. Furthermore, the extraction of quantitative parametersfrom tumor regions can go a long way toward reducing the inter-and intraobserver variability of breast cancer grading, which hasbeen well documented in the literature.
Some of the proposed breast cancer detection techniques op-erate by examining nuclear features, as cancer nuclei have adistinct morphology—large size, coarse chromatin texture, andirregular shape. In [56], ROIs from breast cancer histopathol-ogy slides are classified as benign or malignant based on twofeatures related to the nuclear size: the median nuclear area andthe number of large well-formed nuclei in the region. Nuclearmorphometric features are also used in [104] in combinationwith texture and topology features for malignancy detection inbreast cancer histopathology. The extraction of nuclear morpho-metric features, in most cases, relies on a nuclei segmentationprocedure. The influence of the nuclei segmentation accuracyon the subsequent feature extraction for classification into theclasses benign and malignant is examined in [105]. The con-clusion of the authors was that perfect segmentation accuracy isnot needed as it does not necessarily guarantee optimal perfor-mance. In [84], cancer tissue is distinguished from noncancer-ous tissue based on Gabor texture features, without relying ona nuclei segmentation algorithm.
In order to arrive at computer-aided prognosis of breast can-cer patients, researchers have both developed image analysissystems in the context of the currently employed grading sys-tems, and aspired to discover novel imaging biomarkers fromhistopathology images. In some cases, the output of the stainingquantification and object detection and segmentation techniquesdiscussed in the previous section can be directly used as part ofestablished clinical practice, provided their output is compara-ble to the performance of human experts. This, for example, isthe case with the quantification of positively stained nuclei andthe detection of mitotic figures. In most cases, however, thesetechniques are used only as building blocks of more complexsystems. Some proposed methods aim at predicting the cancergrade assigned by pathologists, most commonly according to theBloom and Richardson grading system, or one of its constituentcomponents such as the nuclear pleomorphism score [106].Classifiers trained with features describing the tissue architec-ture in combination with nuclear features have been shown tobe successful in distinguishing between different breast cancergrades [84], [107]. In [108], two features were identified thatcan successfully discriminate between the three breast cancer

VETA et al.: BREAST CANCER HISTOPATHOLOGY IMAGE ANALYSIS: A REVIEW 1407
grades—the density of nuclei with irregular chromatin and thedensity of tubules in the tissue.
It should be noted here that breast cancer grades can be seen asestimates of patient outcome based on an expert opinion. In thatsense, CAP systems that aim at predicting the histological tumorgrade use this as an intermediate end-point for the prediction ofsurvival. The use of reliable intermediate end-points is crucialin a situation where the actual patient survival is not knownor it is difficult to obtain. Besides the histological grade, otherintermediate end-points can be used, for example, the risk scoresfrom gene expression assays. Such work was presented in [109]and [110], where tissue architecture features were used to predictthe Oncotype DX recurrence score with high accuracy, whichsuggests that image analysis methods have the potential to beused as a cheap alternative or supplement to gene expressionprofiling.
When patient cohorts with known survival outcome are avail-able, systems can be built that directly predict patient survivalbased on the available data, both from imaging and from othersources, thus avoiding the use of possibly unreliable interme-diate end points. One such example can be found in [111],where the mean nuclear area calculated by automatic nucleisegmentation was shown to be prognostically relevant for malebreast cancer patients in addition to other histological and clini-cal features. The fractal dimension of the tissue, extracted frominvasive breast cancer TMAs stained with pan-cytokeratin (spe-cific to epithelial components), which was previously associ-ated with tumor grade [112], was also shown to have prognosticvalue [113]. In [114], the authors proposed a system that success-fully predicts patient outcome based on automatically extractedquantitative features from histopathology images. In addition,they identified three novel and previously unrecognized stromalfeatures that are significantly associated with patient survival.
An exciting and promising area of research is the integrationof imaging biomarkers from histopathology images with ge-nomic data. Structural information about the tissue is lost whenpreparing the molecular assays, hence imaging biomarkers maybe complementary to genomic data. In a recent study [115], theauthors used an image analysis approach to derive knowledgeabout the tumor cellular composition (percentage of cancer, stro-mal and lymphocytic nuclei), which they used to correct copynumber data and more accurately estimate the HER2 amplifica-tion. In addition, they combined image features with genomicinformation to train a predictor of survival of ER-negative breastcancer patients. This predictor had a better performance in com-parison with using image features or genomic information only.In another study [116], the authors developed a workflow forimage analysis of histopathology images and integration of mor-phological features with genomic data for biomarker discovery.Four of the morphological features were identified as biomarkersthat can separate patients into groups with different outcomes.
Many of the proposed methods for automatic breast cancerdetection, grading, and prognosis have been trained and eval-uated only on relatively small regions from the image slides,either digitized TMA slides or manually selected regions fromwhole-slide images. Although these methods are useful in asemiautomatic setting, it is necessary for a high throughput and
automatic application to either produce an output for the entireslide (or even, from a set of slides originating from one speci-men), as in [107], where this is achieved by using a multifield-of-view framework, or to perform extraction of relevant ROIsfor the problem at hand and limit the analysis solely to thoseregions [50], [54], [117].
VII. DISCUSSION
Over the past few years the interest in analysis of histopathol-ogy images has been steadily increasing, prompted by the intro-duction of WSI scanners into pathology labs and the imminentacceptance of digital slides as a primary diagnostic modality.
The use of quantitative techniques is viewed as a solutionto the problem of observer variability of the interpretation ofhistopathology slides, both by pathology professionals and im-age analysis experts. In the case of breast cancer, several ap-plications for quantification of immunohistochemically stainedtissue have already gained approval from the United States Foodand Drug Administration (FDA). Methods that work with rou-tinely prepared H&E stained slides have great potential to makean impact on the pathology workflow. However, ensuring ro-bustness is challenging owing to the complexity of the tissuecharacteristics that need to be analyzed. Nevertheless, progresshas been made both in the development of basic image anal-ysis tools for H&E stained sections (i.e., object detection andsegmentation methods) and in the development of systems thatpredict patient outcome either directly or by use of interme-diate endpoints such as the histological grade as assigned bypathologists. Further improvements are needed in order to pro-duce methods that have performance levels that are suitable forclinical application.
At multiple points throughout the text we have mentioned thatthe steps of tissue preparation, staining, and slide digitizationthat precede image analysis can influence the results. The morequantitative analysis of histopathology image data will becomepart of routine pathology practice, the more optimization oftissue preparation, staining, and slide digitization will be needed.However, some variation in the appearance will still be presenteven under closely monitored conditions, so analysis methodswill have to be developed in a way that is robust to such avariation.
Perhaps the main obstacle in the development of newhistopathology image analysis methods lies in the lack of largepublicly available annotated datasets. While the advent of WSIscanners has produced vast quantities of image data, it is diffi-cult to obtain ground truth annotations in a form that can readilybe used for development and testing of image analysis methods,even when this data is tied to the pathology reports. For example,the tumor grade or the mitotic activity index that can be found inpathology reports are often based on the analysis of a particularregion from a single slide viewed under a microscope, whilethe slide itself has been selected from a set of slides originatingfrom the same sample. Information about the selected slide andthe region within that slide where analysis was performed isnot recorded and thus correspondence between the routine an-notation and the image data is difficult to establish. In addition,

1408 IEEE TRANSACTIONS ON BIOMEDICAL ENGINEERING, VOL. 61, NO. 5, MAY 2014
owing to the large observer variability, annotation by multi-ple observers is needed to produce high quality ground truths,which is both time-consuming and expensive, particularly forlarge datasets. Making annotated image datasets publicly avail-able will provide a breeding ground for the development of newimage analysis algorithms and will enhance the objectivity ofmethod comparison and improve the quality of computer-aideddiagnosis and prognosis.
REFERENCES
[1] N. Stathonikos, M. Veta, A. Huisman, and P. J. van Diest, “Going fullydigital: Perspective of a Dutch academic pathology lab,” J. Pathol. In-form., vol. 4, Jun. 2013.
[2] J. D. Hipp, A. Fernandez, C. C. Compton, and U. J. Balis, “Why a pathol-ogy image should not be considered as a radiology image,” J. Pathol.Inform., vol. 2, Jun. 2011.
[3] F. Bray, P. McCarron, and D. M. Parkin, “The changing global patternsof female breast cancer incidence and mortality,” Breast Cancer Res.,vol. 6, no. 6, pp. 229–239, 2004.
[4] J. S. Meyer, C. Alvarez, C. Milikowski, N. Olson, I. Russo, J. Russo,A. Glass, B. A. Zehnbauer, K. Lister, and R. Parwaresch, “Breast carci-noma malignancy grading by bloom–richardson system vs proliferationindex: Reproducibility of grade and advantages of proliferation index,”Mod. Pathol., vol. 18, no. 8, pp. 1067–1078, May 2005.
[5] E. A. Perez, V. J. Suman, N. E. Davidson, S. Martino, P. A. Kaufman,W. L. Lingle, P. J. Flynn, J. N. Ingle, D. Visscher, and R. B. Jenkins,“HER2 testing by local, central, and reference laboratories in specimensfrom the north central cancer treatment group N9831 intergroup adjuvanttrial,” J. Clin. Oncol., vol. 24, no. 19, pp. 3032–3038, Jul. 2006.
[6] C. W. Elston and I. O. Ellis, “Pathological prognostic factors in breastcancer. i. the value of histological grade in breast cancer: Experiencefrom a large study with long-term follow-up,” Histopathology, vol. 19,no. 5, pp. 403–410, Nov. 1991.
[7] E. A. Rakha, J. S. Reis-Filho, F. Baehner, D. J. Dabbs, T. Decker,V. Eusebi, S. B. Fox, S. Ichihara, J. Jacquemier, S. R. Lakhani,J. Palacios, A. L. Richardson, S. J. Schnitt, F. C. Schmitt, P.-H. Tan,G. M. Tse, S. Badve, and I. O. Ellis, “Breast cancer prognostic clas-sification in the molecular era: The role of histological grade,” BreastCancer Res., vol. 12, no. 4, p. 207, 2010.
[8] A. C. Wolff, M. E. H. Hammond, J. N. Schwartz, K. L. Hagerty,D. C. Allred, R. J. Cote, M. Dowsett, P. L. Fitzgibbons, W. M. Hanna,A. Langer, L. M. McShane, S. Paik, M. D. Pegram, E. A. Perez,M. F. Press, A. Rhodes, C. Sturgeon, S. E. Taube, R. Tubbs, G. H. Vance,M. van de Vijver, T. M. Wheeler, D. F. Hayes, and American Society ofClinical Oncology/College of American Pathologists, “American societyof clinical oncology/college of american pathologists guideline recom-mendations for human epidermal growth factor receptor 2 testing inbreast cancer,” Arch. Pathol. Lab. Med., vol. 131, no. 1, pp. 18–43, 2007.
[9] M. E. H. Hammond, D. F. Hayes, A. C. Wolff, P. B. Mangu, andS. Temin, “American society of clinical oncology/college of americanpathologists guideline recommendations for immunohistochemical test-ing of estrogen and progesterone receptors in breast cancer,” J. Oncol.Pract., vol. 6, no. 4, pp. 195–197, Jul. 2010.
[10] G. A. Meijer, J. A. Belien, P. J. van Diest, and J. P. Baak, “Origins of . . .image analysis in clinical pathology.,” J. Clin. Pathol., vol. 50, no. 5,pp. 365–370, May 1997.
[11] M. N. Gurcan, L. E. Boucheron, A. Can, A. Madabhushi, N. M. Rajpoot,and B. Yener, “Histopathological image analysis: A review,” IEEE Rev.Biomed. Eng., vol. 2, pp. 147–171, 2009.
[12] T. J. Fuchs and J. M. Buhmann, “Computational pathology: Challengesand promises for tissue analysis,” Comp. Med. Imag. Grap., vol. 35,no. 7–8, pp. 515–530, Oct. 2011.
[13] S. Di Cataldo, E. Ficarra, and E. Macii, “Computer-aided techniques forchromogenic immunohistochemistry: Status and directions,” Comput.Biol. Med., vol. 42, no. 10, pp. 1012–1025, Oct. 2012.
[14] S. Al-Janabi, A. Huisman, and P. J. Van Diest, “Digital pathology: Cur-rent status and future perspectives,” Histopathology, vol. 61, no. 1, pp. 1–9, 2011.
[15] F. Ghaznavi, A. Evans, A. Madabhushi, and M. Feldman, “Digital imag-ing in pathology: Whole-slide imaging and beyond,” Annu. Rev. Pathol.,vol. 8, pp. 331–359, Jan. 2013.
[16] P. L. Fitzgibbons, D. L. Page, D. Weaver, A. D. Thor, D. C. Allred,G. M. Clark, S. G. Ruby, F. O’Malley, J. F. Simpson, J. L. Connolly,D. F. Hayes, S. B. Edge, A. Lichter, and S. J. Schnitt, “Prognostic fac-tors in breast cancer. College of American pathologists consensus state-ment 1999,” Arch. Pathol. Lab. Med., vol. 124, no. 7, pp. 966–978, Jul.2000.
[17] R. A. Walker, “Quantification of immunohistochemistry—Issues con-cerning methods, utility and semiquantitative assessment I,” Histopathol-ogy, vol. 49, no. 4, pp. 406–410, 2006.
[18] C. R. Taylor and R. M. Levenson, “Quantification ofimmunohistochemistry—Issues concerning methods, utility andsemiquantitative assessment II,” Histopathology, vol. 49, no. 4,pp. 411–424, 2006.
[19] J. Kononen, L. Bubendorf, A. Kallioniemi, M. Barlund, P. Schraml,S. Leighton, J. Torhorst, M. J. Mihatsch, G. Sauter, and O. P. Kallioniemi,“Tissue microarrays for high-throughput molecular profiling of tumorspecimens,” Nat. Med., vol. 4, no. 7, pp. 844–847, Jul. 1998.
[20] M. Skacel, B. Skilton, J. D. Pettay, and R. R. Tubbs, “Tissue microarrays:A powerful tool for high-throughput analysis of clinical specimens: Areview of the method with validation data,” Appl. Immunohisto. M. M.,vol. 10, no. 1, pp. 1–6, Mar. 2002.
[21] A. C. Ruifrok and D. A. Johnston, “Quantification of histochemical stain-ing by color deconvolution,” Anal. Quant. Cytol. Histol., vol. 23, no. 4,pp. 291–299, Aug. 2001.
[22] M. Gavrilovic, J. C. Azar, J. Lindblad, C. Wahlby, E. Bengtsson,C. Busch, and I. B. Carlbom, “Blind color decomposition of histologicalimages,” IEEE T. Med. Imag., vol. 32, no. 6, pp. 983–994, 2013.
[23] J. Monaco, J. Hipp, D. Lucas, S. Smith, U. Balis, and A. Madabhushi,“Image segmentation with implicit color standardization using spatiallyconstrained expectation maximization: Detection of nuclei,” in In Med-ical Image Computing and Computer-Assisted Intervention, N. Ayache,H. Delingette, P. Golland, and K. Mori, Eds. Berlin Germany: Springer,2012, pp. 365–372.
[24] M. Macenko, M. Niethammer, J. S. Marron, D. Borland, J. T. Woosley,X. Guan, C. Schmitt, and N. E. Thomas, “A method for normalizing his-tology slides for quantitative analysis,” in Proc. IEEE Int. Symp. Biomed.Imag., 2009, pp. 1107–1110.
[25] C. C. Bilgin, J. Rittscher, R. Filkins, and A. Can, “Digitally adjustingchromogenic dye proportions in brightfield microscopy images,” J. Mi-crosc., vol. 245, no. 3, pp. 319–330, 2012.
[26] A. Basavanhally and A. Madabhushi, “EM-based segmentation-drivencolor standardization of digitized histopathology,” in Proc. SPIE Med.Imag., 2013, pp. 86760G–86760G.
[27] E. Rexhepaj, D. J. Brennan, P. Holloway, E. W. Kay, A. H. McCann,G. Landberg, M. J. Duffy, K. Jirstrom, and W. M. Gallagher, “Novelimage analysis approach for quantifying expression of nuclear proteinsassessed by immunohistochemistry: Application to measurement of oe-strogen and progesterone receptor levels in breast cancer,” Breast CancerRes., vol. 10, no. 5, p. R89, 2008.
[28] V. J. Tuominen, S. Ruotoistenmaki, A. Viitanen, M. Jumppanen, andJ. Isola, “Immunoratio: A publicly available web application for quan-titative image analysis of estrogen receptor (ER), progesterone receptor(PR), and Ki-67,” Breast Cancer Res., vol. 12, no. 4, p. R56, 2010.
[29] T. Amaral, S. J. Mckenna, K. Robertson, and A. Thompson, “Classi-fication and immunohistochemical scoring of breast tissue microarrayspots,” IEEE T. Biomed. Eng., vol. 60, no. 10, pp. 2806–2814, Oct.2013.
[30] C. B. Moelans, R. A. de Weger, M. T. M. van Blokland, C. Ezendam,S. Elshof, M. G. J. Tilanus, and P. J. van Diest, “HER-2/neu amplifi-cation testing in breast cancer by multiplex ligation-dependent probeamplification in comparison with immunohistochemistry and in situ hy-bridization,” Cell. Oncol., vol. 31, no. 1, pp. 1–10, 2009.
[31] H. Masmoudi, S. M. Hewitt, N. Petrick, K. J. Myers, andM. A. Gavrielides, “Automated quantitative assessment of HER-2/neuimmunohistochemical expression in breast cancer,” IEEE T. Med. Imag.,vol. 28, no. 6, pp. 916–925, Jun. 2009.
[32] E. Ficarra, S. Di Cataldo, A. Acquaviva, and E. Macii, “Automatedsegmentation of cells with IHC membrane staining,” IEEE T. Biomed.Eng., vol. 58, no. 5, pp. 1421–1429, May 2011.
[33] B. H. Hall, M. Ianosi-Irimie, P. Javidian, W. Chen, S. Ganesan, andD. J. Foran, “Computer-assisted assessment of the human epidermalgrowth factor receptor 2 immunohistochemical assay in imaged his-tologic sections using a membrane isolation algorithm and quantitativeanalysis of positive controls,” BMC Med. Imag., vol. 8, no. 1, p. 11, Jun.2008.

VETA et al.: BREAST CANCER HISTOPATHOLOGY IMAGE ANALYSIS: A REVIEW 1409
[34] M. Rojo, G. Bueno, and J. Slodkowska, “Review of imaging solutionsfor integrated quantitative immunohistochemistry in the pathology dailypractice,” Folia Histochem. Cyto., vol. 47, no. 3, pp. 349–354, Jan. 2009.
[35] V. J. Tuominen, T. T. Tolonen, and J. Isola, “ImmunoMembrane: A pub-licly available web application for digital image analysis of HER2 im-munohistochemistry,” Histopathology, vol. 60, no. 5, pp. 758–767, Apr.2012.
[36] K. L. Bolton, M. Garcia-Closas, R. M. Pfeiffer, M. A. Duggan,W. J. Howat, S. M. Hewitt, X. R. Yang, R. Cornelison, S. L. Anzick,P. Meltzer, S. Davis, P. Lenz, J. D. Figueroa, P. D. P. Pharoah, andM. E. Sherman, “Assessment of automated image analysis of breastcancer tissue microarrays for epidemiologic studies,” Cancer Epidem.Biomar., vol. 19, no. 4, pp. 992–999, Apr. 2010.
[37] M. C. Lloyd, P. Allam-Nandyala, C. N. Purohit, N. Burke, D. Coppola,and M. M. Bui, “Using image analysis as a tool for assessment of prog-nostic and predictive biomarkers for breast cancer: How reliable is it?,”J. Pathol. Inform., vol. 1, Dec. 2010.
[38] D. M. Minot, J. Voss, S. Rademacher, T. Lwin, J. Orsulak, B. Caron,R. Ketterling, A. Nassar, B. Chen, and A. Clayton, “Image analysis ofHER2 immunohistochemical staining reproducibility and concordancewith fluorescence in situ hybridization of a laboratory-validated scoringtechnique,” Amer. J. Clin. Pathol., vol. 137, no. 2, pp. 270–276, Feb.2012.
[39] M. A. Gavrielides, B. D. Gallas, P. Lenz, A. Badano, and S. M. Hewitt,“Observer variability in the interpretation of HER2/neu immunohis-tochemical expression with unaided and computer-aided digital mi-croscopy,” Arch. Pathol. Lab. Med., vol. 135, no. 2, pp. 233–242, Feb.2011.
[40] A. Laurinaviciene, D. Dasevicius, V. Ostapenko, S. Jarmalaite,J. Lazutka, and A. Laurinavicius, “Membrane connectivity estimatedby digital image analysis of HER2 immunohistochemistry is concordantwith visual scoring and fluorescence in situ hybridization results: Algo-rithm evaluation on breast cancer tissue microarrays,” Diagn. Pathol.,vol. 6, no. 1, p. 87, Sep. 2011.
[41] A. Brugmann, M. Eld, G. Lelkaitis, S. Nielsen, M. Grunkin, J. D. Hansen,N. T. Foged, and M. Vyberg, “Digital image analysis of membrane con-nectivity is a robust measure of HER2 immunostains,” Breast CancerRes. Treat., vol. 132, no. 1, pp. 41–49, Feb. 2012.
[42] G. Turashvili, S. Leung, D. Turbin, K. Montgomery, B. Gilks, R. West,M. Carrier, D. Huntsman, and S. Aparicio, “Inter-observer reproducibil-ity of HER2 immunohistochemical assessment and concordance withfluorescent in situ hybridization (FISH): Pathologist assessment com-pared to quantitative image analysis,” BMC Cancer, vol. 9, no. 1, p. 165,May 2009.
[43] A. Nassar, C. Cohen, S. S. Agersborg, W. Zhou, K. A. Lynch,M. Albitar, E. A. Barker, B. L. Vanderbilt, J. Thompson, E. R. Heyman,H. Lange, A. Olson, and M. T. Siddiqui, “Trainable immunohistochem-ical HER2/neu image analysis: A multisite performance study using260 breast tissue specimens,” Arch. Pathol. Lab. Med., vol. 135, no. 7,pp. 896–902, Jul. 2011.
[44] Z. M. A. Mohammed, J. J. Going, D. C. McMillan, C. Orange, E. Mallon,J. C. Doughty, and J. Edwards, “Comparison of visual and automatedassessment of HER2 status and their impact on outcome in primaryoperable invasive ductal breast cancer,” Histopathology, vol. 61, no. 4,pp. 675–684, 2012.
[45] R. S. Alomari, R. Allen, B. Sabata, and V. Chaudhary, “Localization oftissues in high-resolution digital anatomic pathology images,” in Proc.SPIE Med. Imag., 2009, pp. 726016–726016.
[46] Y. Wang, K. Savage, C. Grills, A. McCavigan, J. A. James, D. A. Fennell,and P. W. Hamilton, “A TMA de-arraying method for high throughputbiomarker discovery in tissue research,” PLoS ONE, vol. 6, no. 10,p. e26007, Oct. 2011.
[47] B. Lahrmann, N. Halama, K. Westphal, C. Ernst, Z. Elsawaf, P. Sinn,F. X. Bosch, H. Dickhaus, D. Jager, P. Schirmacher, and N. Grabe, “Ro-bust gridding of TMAs after whole-slide imaging using template match-ing,” Cytometry A, vol. 77, no. 12, pp. 1169–1176, Dec. 2010.
[48] D. J. Foran, L. Yang, W. Chen, J. Hu, L. A. Goodell, M. Reiss, F. Wang,T. Kurc, T. Pan, A. Sharma, and J. H. Saltz, “ImageMiner: A software sys-tem for comparative analysis of tissue microarrays using content-basedimage retrieval, high-performance computing, and grid technology,” JAmer. Med. Inform. Assoc., vol. 18, no. 4, pp. 403–415, Jul. 2011.
[49] B. Karacali and A. Tozeren, “Automated detection of regions of interestfor tissue microarray experiments: An image texture analysis,” BMCMed. Imag., vol. 7, no. 1, p. 2, Mar. 2007.
[50] C. Bahlmann, A. Patel, J. Johnson, J. Ni, A. Chekkoury, P. Khurd,A. Kamen, L. Grady, E. Krupinski, A. Graham, and R. Weinstein, “Auto-mated detection of diagnostically relevant regions in H&E stained digitalpathology slides,” in Proc. SPIE Med. Imag., 2012, pp. 831504–831504.
[51] N. Linder, J. Konsti, R. Turkki, E. Rahtu, M. Lundin, S. Nordling,C. Haglund, T. Ahonen, M. Pietikainen, and J. Lundin, “Identification oftumor epithelium and stroma in tissue microarrays using texture analy-sis,” Diagn. Pathol., vol. 7, no. 1, p. 22, Mar. 2012.
[52] S. J. McKenna, T. Amaral, S. Akbar, L. Jordan, and A. Thompson, “Im-munohistochemical analysis of breast tissue microarray images usingcontextual classifiers,” J. Pathol. Inform., vol. 4, Mar. 2013.
[53] C.-W. Wang, D. Fennell, I. Paul, K. Savage, and P. Hamilton, “Robust au-tomated tumour segmentation on histological and immunohistochemicaltissue images,” PLoS ONE, vol. 6, no. 2, p. e15818, Feb. 2011.
[54] M. Peikari, J. Zubovits, G. Clarke, and A. Martel, “A texture based ap-proach to automated detection of diagnostically relevant regions in breastdigital pathology,” in Proc. Int. Conf. Med. Image Comput. Comput. As-sisted Intervention — Workhop Breast Image Anal., 2013.
[55] A. M. Khan, H. El-Daly, E. Simmons, and N. M. Rajpoot, “HyMaP:A hybrid magnitude-phase approach to unsupervised segmentation oftumor areas in breast cancer histology images,” J. Pathol. Inform., vol. 4,Mar. 2013.
[56] E. Cosatto, M. Miller, H. P. Graf, and J. S. Meyer, “Grading nuclearpleomorphism on histological micrographs,” in Proc. Int. Conf. PatternRecog., 2008, pp. 1–4.
[57] X. Qi, F. Xing, D. J. Foran, and L. Yang, “Robust segmentation of over-lapping cells in histopathology specimens using parallel seed detectionand repulsive level set,” IEEE T. Biomed. Eng., vol. 59, no. 3, pp. 754–765, Mar. 2012.
[58] M. Veta, P. J. van Diest, R. Kornegoor, A. Huisman, M. A. Viergever, andJ. P. W. Pluim, “Automatic nuclei segmentation in H&E stained breastcancer histopathology images,” PLoS ONE, vol. 8, no. 7, p. e70221, Jul.2013.
[59] S. Wienert, D. Heim, K. Saeger, A. Stenzinger, M. Beil, P. Hufnagl,M. Dietel, C. Denkert, and F. Klauschen, “Detection and segmentation ofcell nuclei in virtual microscopy images: A minimum-model approach,”Sci. Rep., vol. 2, Jul. 2012.
[60] H. Fatakdawala, J. Xu, A. Basavanhally, G. Bhanot, S. Ganesan,M. Feldman, J. E. Tomaszewski, and A. Madabhushi, “Expectation-maximization-driven geodesic active contour with overlap resolution(EMaGACOR): Application to lymphocyte segmentation on breast can-cer histopathology,” IEEE T. Biomed. Eng., vol. 57, no. 7, pp. 1676–1689,Jul. 2010.
[61] C. Jung, C. Kim, S. W. Chae, and S. Oh, “Unsupervised segmentation ofoverlapped nuclei using bayesian classification,” IEEE T. Biomed. Eng.,vol. 57, no. 12, pp. 2825–2832, Dec. 2010.
[62] J. P. Vink, M. B. Van Leeuwen, C. H. M. Van Deurzen, and G. DeHaan, “Efficient nucleus detector in histopathology images,” J. Microsc.,vol. 249, no. 2, pp. 124–135, 2013.
[63] S. Ali and A. Madabhushi, “An integrated region-, boundary-, shape-based active contour for multiple object overlap resolution in histologicalimagery,” IEEE T. Med. Imag., vol. 31, no. 7, pp. 1448–1460, Jul. 2012.
[64] C. Arteta, V. Lempitsky, J. A. Noble, and A. Zisserman, “Learning to de-tect cells using non-overlapping extremal regions,” in Proc. Med. ImageComput. Comput-Assisted Intervention, 2012, pp. 348–356.
[65] A. Karsnas, A. L. Dahl, and R. Larsen, “Learning histopathological pat-terns,” J. Pathol. Inform., vol. 2, Jan. 2012.
[66] C. Avenel and M. S. Kulikova, “Marked point processes with simple andcomplex shape objects for cell nuclei extraction from breast cancer H&Eimages,” in Proc. SPIE Med. Imag., 2013, pp. 86760Z–86760Z.
[67] M. Kulikova, A. Veillard, L. Roux, and D. Racoceanu, “Nuclei extractionfrom histopathological images using a marked point process approach,”in Proc. SPIE Med. Imag., 2012, pp. 831428–831428.
[68] A. N. Basavanhally, S. Ganesan, S. Agner, J. P. Monaco, M. D. Feldman,J. E. Tomaszewski, G. Bhanot, and A. Madabhushi, “Computerizedimage-based detection and grading of lymphocytic infiltration in HER2+breast cancer histopathology,” IEEE T. Biomed. Eng., vol. 57, no. 3,pp. 642–653, 2010.
[69] G. Cong and B. Parvin, “Model-based segmentation of nuclei,” PatternRecog., vol. 33, no. 8, pp. 1383–1393, Aug. 2000.
[70] U. Adiga, R. Malladi, R. Fernandez-Gonzalez, and C. O. de Solorzano,“High-throughput analysis of multispectral images of breast cancer tis-sue,” IEEE T. Image Process., vol. 15, no. 8, pp. 2259–2268, Aug.2006.

1410 IEEE TRANSACTIONS ON BIOMEDICAL ENGINEERING, VOL. 61, NO. 5, MAY 2014
[71] P. R. Gudla, K. Nandy, J. Collins, K. J. Meaburn, T. Misteli, andS. J. Lockett, “A high-throughput system for segmenting nuclei usingmultiscale techniques,” Cytometry A, vol. 73 A, no. 5, pp. 451–466, May2008.
[72] G. Li, T. Liu, J. Nie, L. Guo, J. Chen, J. Zhu, W. Xia, A. Mara, S. Holley,and S. T. C. Wong, “Segmentation of touching cell nuclei using gradientflow tracking,” J. Microsc., vol. 231, no. 1, pp. 47–58, Jul. 2008.
[73] N. Malpica, C. O. de Solorzano, J. J. Vaquero, A. Santos, I. Vallcorba,J. M. Garcıa-Sagredo, and F. del Pozo, “Applying watershed algorithmsto the segmentation of clustered nuclei,” Cytometry, vol. 28, no. 4,pp. 289–297, Aug. 1997.
[74] S. Naik, S. Doyle, S. Agner, A. Madabhushi, M. Feldman, andJ. Tomaszewski, “Automated gland and nuclei segmentation for grad-ing of prostate and breast cancer histopathology,” in Proc. IEEE Int.Symp. Biomed. Imag., New York, NY, USA, 2008, pp. 284–287.
[75] H. Kong, M. Gurcan, and K. Belkacem-Boussaid, “Partitioninghistopathological images: An integrated framework for supervised color-texture segmentation and cell splitting,” IEEE T. Med. Imag., vol. 30,no. 9, pp. 1661–1677, Sep. 2011.
[76] C. Wahlby, I. M. Sintorn, F. Erlandsson, G. Borgefors, and E. Bengtsson,“Combining intensity, edge and shape information for 2D and 3D seg-mentation of cell nuclei in tissue sections,” J. Microsc., vol. 215, pp. 67–76, Jul. 2004.
[77] Y. Al-Kofahi, W. Lassoued, W. Lee, and B. Roysam, “Improved auto-matic detection and segmentation of cell nuclei in histopathology im-ages,” IEEE T. Biomed. Eng., vol. 57, no. 4, pp. 841–852, Apr. 2010.
[78] J. Xu, A. Janowczyk, S. Chandran, and A. Madabhushi, “A weightedmean shift, normalized cuts initialized color gradient based geodesic ac-tive contour model: Applications to histopathology image segmentation,”in Proc. SPIE Med. Imag., 2010, pp. 76230Y–76230Y.
[79] A. Basavanhally, E. Yu, J. Xu, S. Ganesan, M. Feldman, J. Tomaszewski,and A. Madabhushi, “Incorporating domain knowledge for tubule detec-tion in breast histopathology using o’callaghan neighborhoods,” in Proc.SPIE Med. Imag., 2011, pp. 796310–796310.
[80] Y. Peng, Y. Jiang, L. Eisengart, M. A. Healy, F. H. Straus, and X. J. Yang,“Segmentation of prostatic glands in histology images,” in Proc. IEEEInt. Symp. Biomed. Imag., 2011, pp. 2091–2094.
[81] J. Xu, J. P. Monaco, and A. Madabhushi, “Markov random field drivenregion-based active contour model (MaRACel): Application to medicalimage segmentation,” in Proc. Med. Image Comput. Comput.-AssistedIntervention, 2010, pp. 197–204.
[82] K. Nguyen, A. Sarkar, and A. K. Jain, “Structure and context in prostaticgland segmentation and classification,” in Proc. Med. Image Comput.Comput.-Assisted Intervention, 2012, pp. 115–123.
[83] P. J. van Diest, J. C. Fleege, and J. P. Baak, “Syntactic structure analy-sis in invasive breast cancer: Analysis of reproducibility, biologic back-ground, and prognostic value,” Hum. Pathol., vol. 23, no. 8, pp. 876–883,Aug. 1992.
[84] S. Doyle, S. Agner, A. Madabhushi, M. Feldman, and J. Tomaszewski,“Automated grading of breast cancer histopathology using spectral clus-tering with textural and architectural image features,” in Proc. 5th IEEEInt. Symp. Biomed. Imag., 2008, pp. 496–499.
[85] P. J. van Diest, E. van der Wall, and J. P. A. Baak, “Prognostic valueof proliferation in invasive breast cancer: A review,” J. Clin. Pathol.,vol. 57, no. 7, pp. 675–681, Jul. 2004.
[86] M. Dowsett, T. O. Nielsen, R. A’Hern, J. Bartlett, R. C. Coombes,J. Cuzick, M. Ellis, N. L. Henry, J. C. Hugh, T. Lively, L. McShane,S. Paik, F. Penault-Llorca, L. Prudkin, M. Regan, J. Salter, C. Sotiriou,I. E. Smith, G. Viale, J. A. Zujewski, and D. F. Hayes, “Assessment ofKi67 in breast cancer: Recommendations from the international Ki67in breast cancer working group,” J. Nat. Cancer I., vol. 103, no. 22,pp. 1656–1664, Nov. 2011.
[87] I. Skaland, E. A. M. Janssen, E. Gudlaugsson, J. Klos, K. H. Kjellevold,H. Søiland, and J. P. A. Baak, “Phosphohistone H3 expression has muchstronger prognostic value than classical prognosticators in invasive lymphnode-negative breast cancer patients less than 55 years of age,” Mod.Pathol., vol. 20, no. 12, pp. 1307–1315, 2007.
[88] E. J. Kaman, A. W. M. Smeulders, P. W. Verbeek, I. T. Young, andJ. P. A. Baak, “Image processing for mitoses in sections of breastcancer: A feasibility study,” Cytometry, vol. 5, no. 3, pp. 244–249,1984.
[89] T. K. ten Kate, J. A. M. Belien, A. W. M. Smeulders, and J. P. A. Baak,“Method for counting mitoses by image processing in Feulgen stainedbreast cancer sections,” Cytometry, vol. 14, no. 3, pp. 241–250,1993.
[90] J. A. Belien, J. P. Baak, P. J. van Diest, and A. H. van Ginkel, “Countingmitoses by image processing in feulgen stained breast cancer sections:The influence of resolution,” Cytometry, vol. 28, no. 2, pp. 135–140, Jun.1997.
[91] R. Ludovic, R. Daniel, K. Maria, I. Humayun, K. Jacques, C. Frederique,G. Catherine, L. Gilles, L. Nicolas, and Ng. Metin, “Mitosis detectionin breast cancer histological images an ICPR 2012 contest,” J. Pathol.Inform., vol. 4, no. 1, p. 8, 2013.
[92] “Assessment of mitosis detection algorithms 2013 (AMIDA13),” [On-line]. Available: http://amida13.isi.uu.nl
[93] D. C. Ciresan, A. Giusti, L. M. Gambardella, and J. Schmidhuber, “Mi-tosis detection in breast cancer histology images with deep neural net-works,” in Proc. Med. Image Comput. Comput.-Assisted Intervention,2013, pp. 411–418.
[94] C.-H. Huang and H.-K. Lee, “Automated mitosis detection based oneXclusive independent component analysis,” in Proc. Int. Conf. PatternRecog., 2012, pp. 1856–1859.
[95] H. Irshad, S. Jalali, L. Roux, D. Racoceanu, L. J. Hwee, G. L. Naour,and F. Capron, “Automated mitosis detection using texture, SIFT featuresand HMAX biologically inspired approach,” J. Pathol. Inform., vol. 4,Mar. 2013.
[96] H. Irshad, “Automated mitosis detection in histopathology using morpho-logical and multi-channel statistics features,” J. Pathol. Inform., vol. 4,no. 1, p. 10, 2013.
[97] C. Malon and E. Cosatto, “Classification of mitotic figures with convo-lutional neural networks and seeded blob features,” J. Pathol. Inform.,vol. 4, no. 1, p. 9, 2013.
[98] C. Malon, E. Brachtel, E. Cosatto, H. P. Graf, A. Kurata, M. Kuroda,J. S. Meyer, A. Saito, S. Wu, and Y. Yagi, “Mitotic figure recognition:Agreement among pathologists and computerized detector,” Anal. Cell.Pathol., vol. 35, no. 2, pp. 97–100, Jan. 2012.
[99] C. Sommer, L. Fiaschi, F. A. Hamprecht, and D. W. Gerlich, “Learning-based mitotic cell detection in histopathological images,” in Proc. Int.Conf. Pattern Recog., 2012, pp. 2306–2309.
[100] F. B. Tek, “Mitosis detection using generic features and an ensem-ble of cascade adaboosts,” J. Pathol. Inform., vol. 4, no. 1, p. 12,2013.
[101] N. Rajpoot, H. ElDaly, and A. Khan, “A Gamma-Gaussian mixturemodel for detection of mitotic cells in breast cancer histopathology im-ages,” J. Pathol. Inform., vol. 4, no. 1, p. 11, 2013.
[102] M. Veta, P. J. van Diest, and J. P. W. Pluim, “Detecting mitotic figures inbreast cancer histopathology images,” in Proc. SPIE Med. Imag., 2013,vol. 8676, pp. 867607-1–867607-7.
[103] J. P. Bulte, L. Polman, M. Schlooz-Vries, A. Werner, R. Besselink,K. Sessink, R. Mus, S. Lardenoije, M. Imhof-Tas, J. Bulten, A. C. H. vanEngen-van Grunsven, E. Schaafsma, L. J. A. Strobbe, P. Bult, andJ. H. W. De Wilt, “One-day core needle biopsy in a breast clinic: 4 yearsexperience,” Breast Cancer Res. Treat., vol. 137, no. 2, pp. 609–616,Jan. 2013.
[104] A. Chekkoury, P. Khurd, J. Ni, C. Bahlmann, A. Kamen, A. Patel,L. Grady, M. Singh, M. Groher, N. Navab, E. Krupinski, J. Johnson,A. Graham, and R. Weinstein, “Automated malignancy detection in breasthistopathological images,” in Proc. SPIE Med. Imag., 2012, vol. 8315,pp. 831515-1–831515-13.
[105] L. E. Boucheron, B. S. Manjunath, and N. R. Harvey, “Use of imperfectlysegmented nuclei in the classification of histopathology images of breastcancer,” in Proc. IEEE Int. Conf. Acoust. Speech Signal Process., 2010,pp. 666–669.
[106] J.-R. Dalle, W. K. Leow, D. Racoceanu, A. E. Tutac, and T. C. Putti,“Automatic breast cancer grading of histopathological images,” inProc. IEEE Eng. Med. Biol. Soc., 2008, vol. 2008, pp. 3052–3055.
[107] A. Basavanhally, S. Ganesan, M. Feldman, N. Shih, C. Mies,J. Tomaszewski, and A. Madabhushi, “Multi-field-of-view framework fordistinguishing tumor grade in ER+ breast cancer from entire histopathol-ogy slides,”. (2013, Aug.). IEEE T. Biomed. Eng., vol. 60, no. 8, pp. 3052–3055, 2013.
[108] S. Petushi, F. U. Garcia, M. M. Haber, C. Katsinis, and A. Tozeren,“Large-scale computations on histology images reveal grade-differentiating parameters for breast cancer,” BMC Med. Imag., vol. 6,p. 14, Oct. 2006.
[109] A. Madabhushi, S. Agner, A. Basavanhally, S. Doyle, and G. Lee,“Computer-aided prognosis: Predicting patient and disease outcome viaquantitative fusion of multi-scale, multi-modal data,” Comp. Med. Imag.Grap., vol. 35, no. 7–8, pp. 506–514, Dec. 2011.

VETA et al.: BREAST CANCER HISTOPATHOLOGY IMAGE ANALYSIS: A REVIEW 1411
[110] A. Basavanhally, M. Feldman, N. Shih, C. Mies, J. Tomaszewski,S. Ganesan, and A. Madabhushi, “Multi-field-of-view strategy for image-based outcome prediction of multi-parametric estrogen receptor-positivebreast cancer histopathology: Comparison to oncotype dx,” J. Pathol.Inform., vol. 2, Jan. 2012.
[111] M. Veta, R. Kornegoor, A. Huisman, A. H. J. Verschuur-Maes,M. A. Viergever, J. P. W. Pluim, and P. J. van Diest, “Prognostic valueof automatically extracted nuclear morphometric features in whole slideimages of male breast cancer,” Mod. Pathol., vol. 25, no. 12, pp. 1559–1565, Dec. 2012.
[112] M. Tambasco and A. M. Magliocco, “Relationship between tumor gradeand computed architectural complexity in breast cancer specimens,”Hum. Pathol., vol. 39, no. 5, pp. 740–746, May 2008.
[113] M. Tambasco, M. Eliasziw, and A. M. Magliocco, “Morphologic com-plexity of epithelial architecture for predicting invasive breast cancersurvival,” J. Transl. Med., vol. 8, p. 140, Dec. 2010.
[114] A. H. Beck, A. R. Sangoi, S. Leung, R. J. Marinelli, T. O. Nielsen,M. J. van de Vijver, R. B. West, M. van de Rijn, and D. Koller, “Sys-tematic analysis of breast cancer morphology uncovers stromal featuresassociated with survival,” Sci. Trans. Med., vol. 3, no. 108, pp. 108ra113–108ra113, Nov. 2011.
[115] Y. Yuan, H. Failmezger, O. M. Rueda, H. R. Ali, S. Graf, S.-F. Chin,R. F. Schwarz, C. Curtis, M. J. Dunning, H. Bardwell, N. Johnson,S. Doyle, G. Turashvili, E. Provenzano, S. Aparicio, C. Caldas, andF. Markowetz, “Quantitative image analysis of cellular heterogeneity inbreast tumors complements genomic profiling,” Sci. Trans. Med., vol. 4,no. 157, p. 157ra143, Oct. 2012.
[116] C. Wang, T. Pecot, D. L. Zynger, R. Machiraju, C. L. Shapiro, andK. Huang, “Identifying survival associated morphological features oftriple negative breast cancer using multiple datasets,” J. Amer. Med. In-form. Assoc., vol. 20, no. 4, pp. 680–687, Aug. 2013.
[117] C.-H. Huang, A. Veillard, L. Roux, N. Lomenie, and D. Racoceanu,“Time-efficient sparse analysis of histopathological whole slide images,”Comp. Med. Imag. Grap., vol. 35, no. 7–8, pp. 579–591, Dec. 2011.
Authors’ photographs and biographies not available at the time of publication.