13th world electronic forum israel 4-8 november 2007 elisha yanay- chairman iaesi – israel...
TRANSCRIPT

13thWorld Electronic Forum
Israel 4-8 November 2007
Elisha Yanay- ChairmanIAESI – Israel Association of Electronics &
Software Industries

WORLD ELECTRONICS

RFID for MfgWebinar in a box
Warehouse SDMDirect MailManufacturing
Sequential DPMGoogle ad words
Teleseminar in a boxLunch &
LearnRFID
Healthcare
USA
JAPAN
CHINA
TAIWAN
HONG KONG PHILIPPINES THAILAND
INDIA
SOUTH AFRICA
BRASIL
FRANCE
SLOVAKIA
GERMANYISRAEL
WORLD ELECTRONICSAUSTRALIA
EUROPE

October 2007
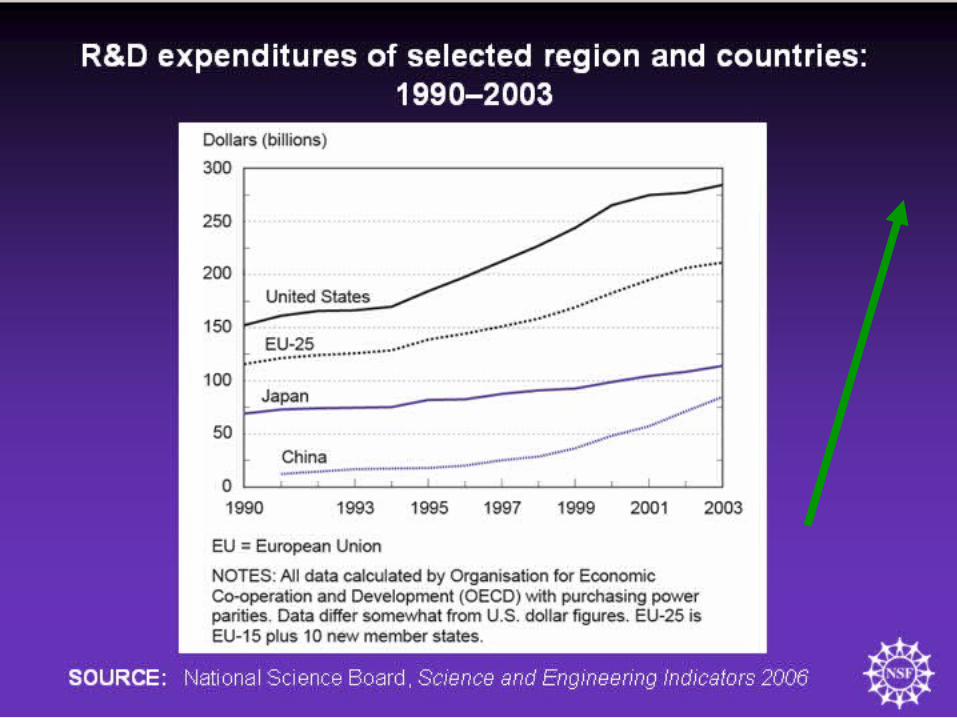
Worldwide Economic and Market Conditions

-20
-10
0
10
20
30
1989 1991 1993 1995 1997 1999 2001 2003 2005 2007 2009
ELECTRONICS
0
1
2
3
4
5
REAL GDP
World Electronics & Economic Growth(Year-Over-Year % Change)
Blue - Elec., Green - GDP
Economics Matters…
GDP
Electronics
-30
-15
0
15
30
45
60
1995 1996 1997 1998 1999 2000 2001 2002 2003 2004 2005 2006 2007
PERCENT
-30
-15
0
15
30
45
60
PERCENT
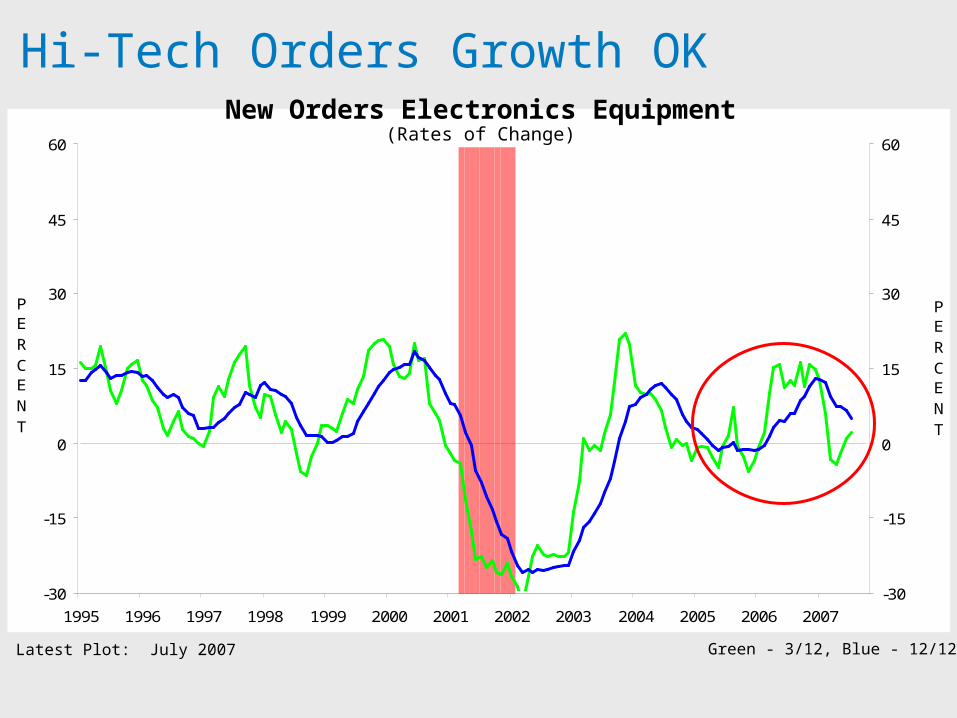
New Orders Electronics Equipment(Rates of Change)
Latest Plot: July 2007 Green - 3/12, Blue - 12/12
Hi-Tech Orders Growth OK
For 2007 - World Expansion Continues• 2007 will be a good (but not great) year
• World growth will remain uneven
• U.S. economy weakening; Asia charges ahead
• Expansion in broad hi-tech industries continues
• Double-digit sales upside for 2007 – weaker U.S. consumer may impact handset sales
• Plan for other contingencies
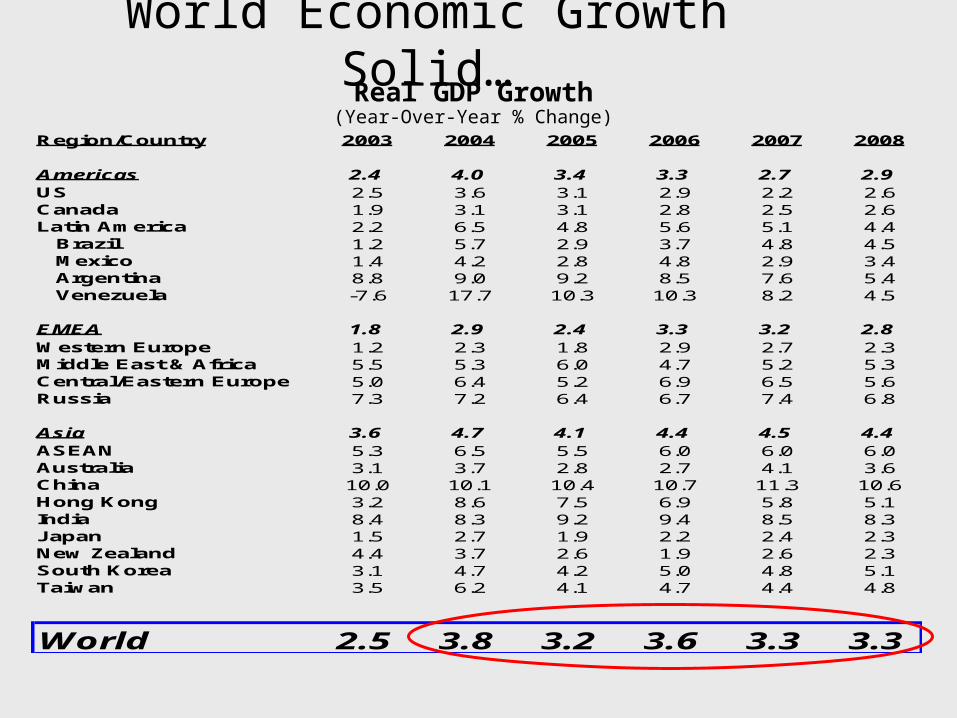
Region/Country 2003 2004 2005 2006 2007 2008
Americas 2.4 4.0 3.4 3.3 2.7 2.9US 2.5 3.6 3.1 2.9 2.2 2.6Canada 1.9 3.1 3.1 2.8 2.5 2.6Latin America 2.2 6.5 4.8 5.6 5.1 4.4 Brazil 1.2 5.7 2.9 3.7 4.8 4.5 Mexico 1.4 4.2 2.8 4.8 2.9 3.4 Argentina 8.8 9.0 9.2 8.5 7.6 5.4 Venezuela -7.6 17.7 10.3 10.3 8.2 4.5
EMEA 1.8 2.9 2.4 3.3 3.2 2.8Western Europe 1.2 2.3 1.8 2.9 2.7 2.3Middle East & Africa 5.5 5.3 6.0 4.7 5.2 5.3Central/Eastern Europe 5.0 6.4 5.2 6.9 6.5 5.6Russia 7.3 7.2 6.4 6.7 7.4 6.8
Asia 3.6 4.7 4.1 4.4 4.5 4.4ASEAN 5.3 6.5 5.5 6.0 6.0 6.0Australia 3.1 3.7 2.8 2.7 4.1 3.6China 10.0 10.1 10.4 10.7 11.3 10.6Hong Kong 3.2 8.6 7.5 6.9 5.8 5.1India 8.4 8.3 9.2 9.4 8.5 8.3Japan 1.5 2.7 1.9 2.2 2.4 2.3New Zealand 4.4 3.7 2.6 1.9 2.6 2.3South Korea 3.1 4.7 4.2 5.0 4.8 5.1Taiwan 3.5 6.2 4.1 4.7 4.4 4.8
World 2.5 3.8 3.2 3.6 3.3 3.3
World Economic Growth Solid…Real GDP Growth
(Year-Over-Year % Change)
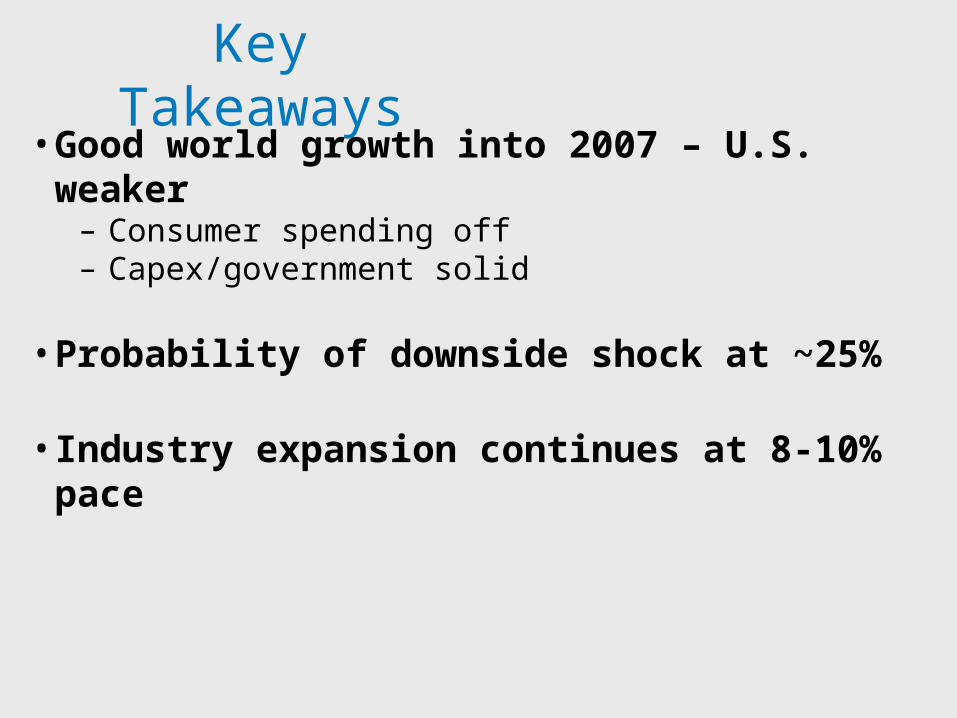
Key Takeaways• Good world growth into 2007 – U.S. weaker
– Consumer spending off– Capex/government solid
• Probability of downside shock at ~25%
• Industry expansion continues at 8-10% pace
The Electronic Industry Is The Locomotive Of The Economy
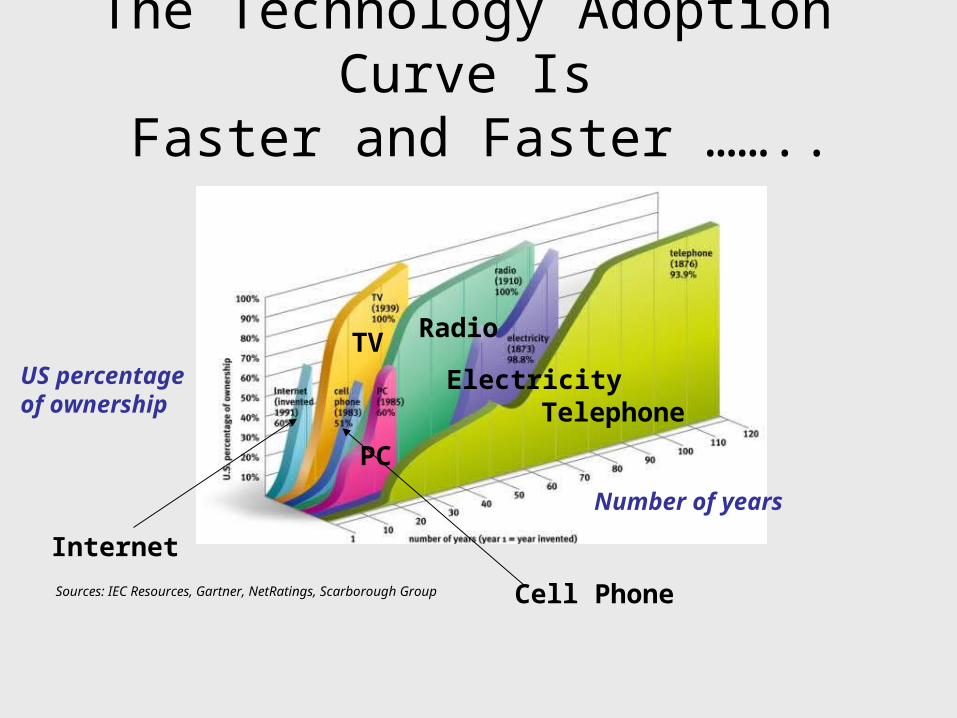
The Technology Adoption Curve Is Faster and Faster ……..
Sources: IEC Resources, Gartner, NetRatings, Scarborough Group
Number of years
US percentageof ownership Telephone
Electricity
Radio
PC
TV
Cell Phone
Internet
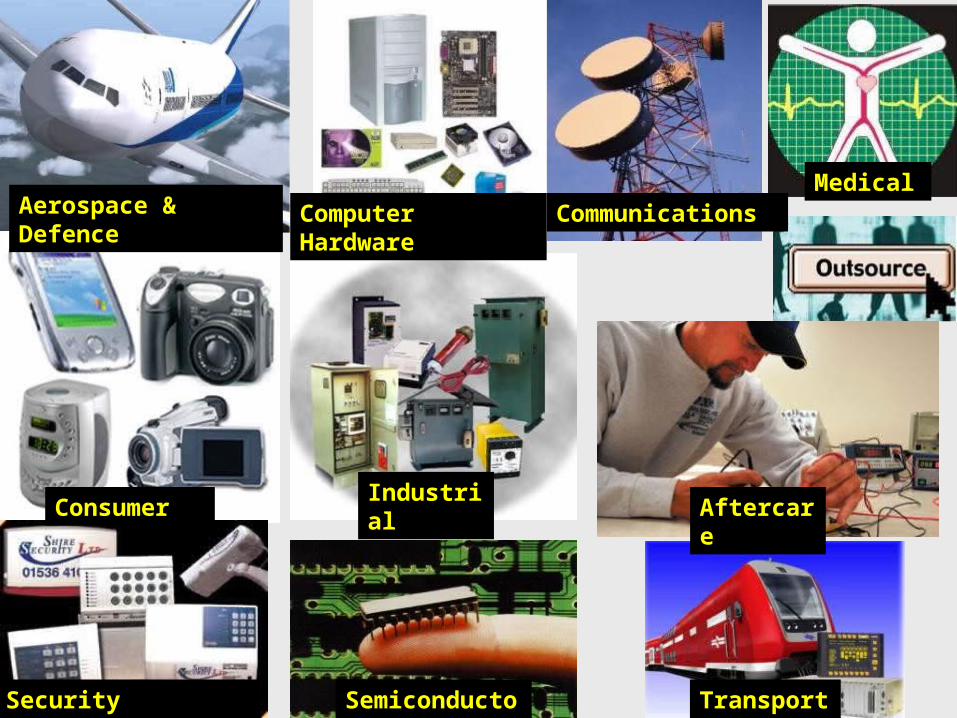
Aerospace & Defence
IndustrialConsumer
CommunicationsComputer Hardware
Security Applications Semiconductor Transport
Aftercare
Medical
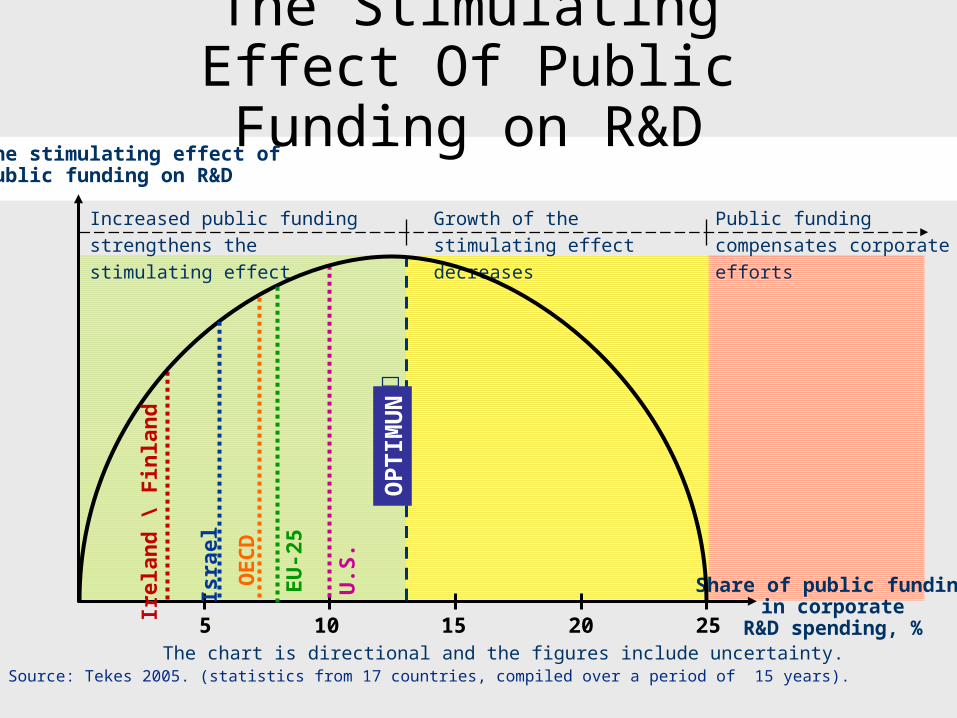
The Stimulating Effect Of Public Funding on R&D
5 10 15 20 25
OEC
D
םמו
טיפ
או
U.S
.
Increased public funding
strengthens the stimulating effect
Growth of the stimulating effect
decreases
Public funding compensates
corporate efforts
The chart is directional and the figures include uncertainty.
Share of public fundingin corporate
R&D spending, %
The stimulating effect ofpublic funding on R&D
Source: Tekes 2005. (statistics from 17 countries, compiled over a period of 15 years).
Isra
el
EU
-25
Irel
and
\ F
inla
nd
OP
TIM
UN
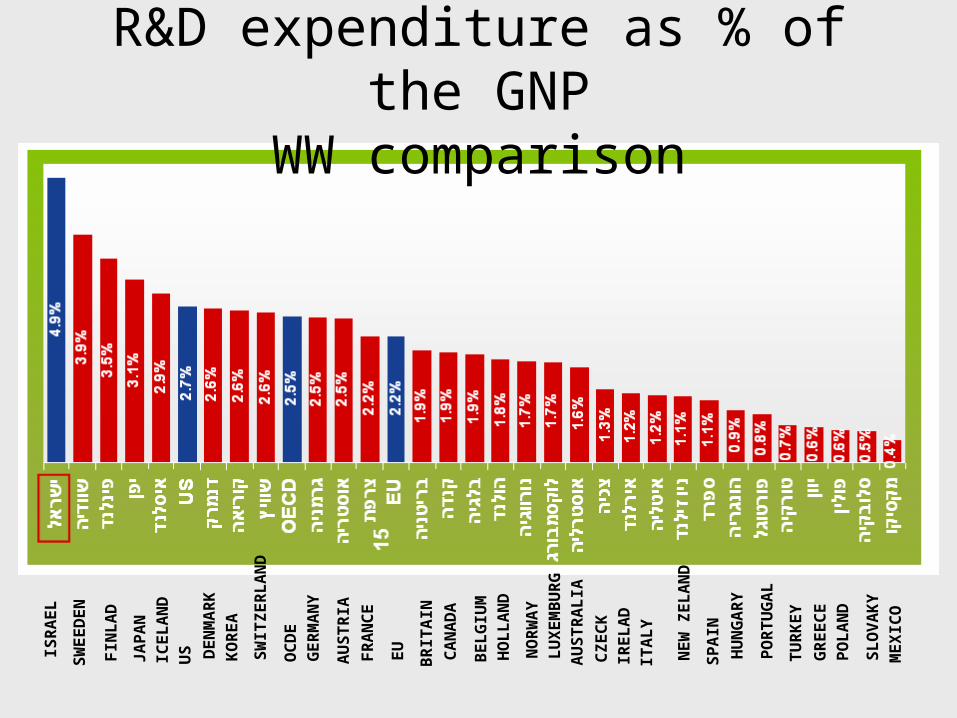
R&D expenditure as % of the GNPWW comparison
ISR
AE
L
SW
EE
DE
N
FIN
LA
D
JA
PA
N
ICE
LA
ND
US
DE
NM
AR
K
KO
RE
A
SW
ITZ
ER
LA
ND
OC
DE
GE
RM
AN
Y
AU
ST
RIA
FR
AN
CE
EU
BR
ITA
IN
CA
NA
DA
BE
LG
IUM
HO
LL
AN
D
NO
RW
AY
LU
XE
MB
UR
G
AU
ST
RA
LIA
CZ
EC
K
IRE
LA
D
ITA
LY
NE
W Z
EL
AN
D
SP
AIN
HU
NG
AR
Y
PO
RT
UG
AL
TU
RK
EY
GR
EE
CE
PO
LA
ND
SL
OV
AK
Y
ME
XIC
O
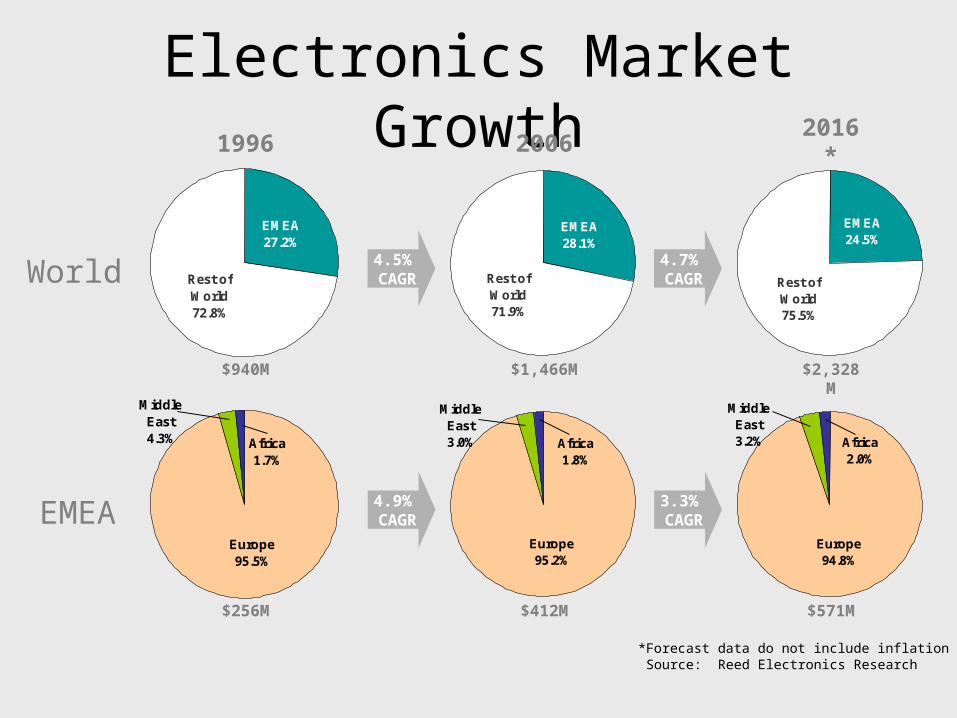
Africa2.0%
Middle East3.2%
Europe94.8%
Africa1.8%
Middle East3.0%
Europe95.2%
Africa1.7%
Middle East4.3%
Europe95.5%
Rest of World75.5%
EMEA24.5%
Electronics Market Growth
Rest of World72.8%
EMEA27.2%
Rest of World71.9%
EMEA28.1%
World
3.3% CAGR
4.9% CAGR
4.7% CAGR
4.5% CAGR
1996 2006 2016*
$940M $1,466M $2,328M
EMEA
$256M $412M $571M
*Forecast data do not include inflation Source: Reed Electronics Research
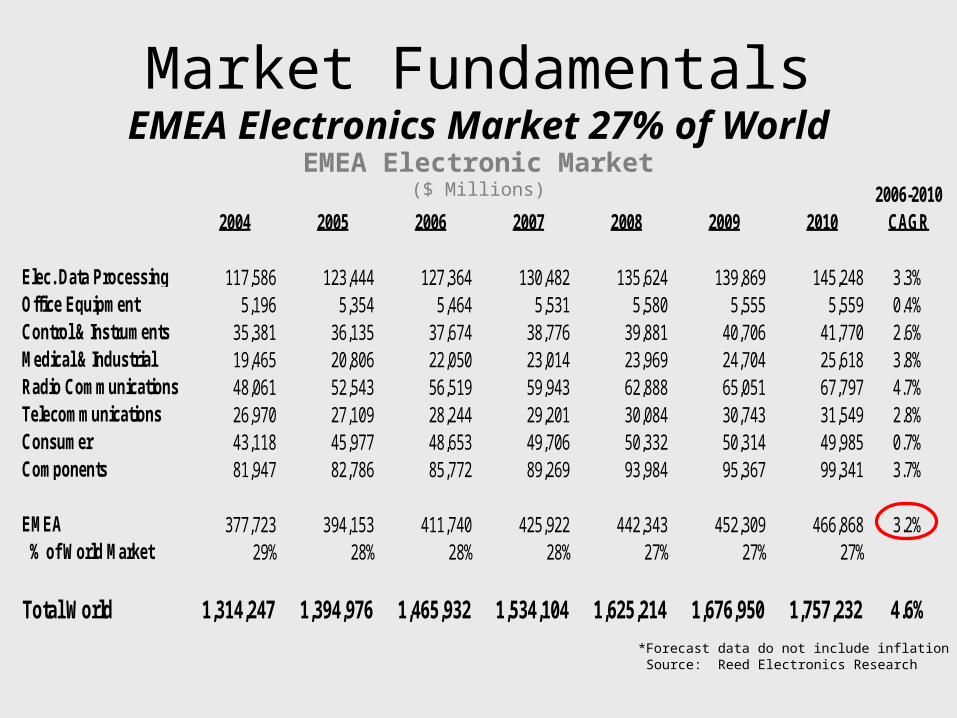
2006-20102004 2005 2006 2007 2008 2009 2010 CAGR
Elec. Data Processing 117,586 123,444 127,364 130,482 135,624 139,869 145,248 3.3%Office Equipment 5,196 5,354 5,464 5,531 5,580 5,555 5,559 0.4%Control & Instruments 35,381 36,135 37,674 38,776 39,881 40,706 41,770 2.6%Medical & Industrial 19,465 20,806 22,050 23,014 23,969 24,704 25,618 3.8%Radio Communications 48,061 52,543 56,519 59,943 62,888 65,051 67,797 4.7%Telecommunications 26,970 27,109 28,244 29,201 30,084 30,743 31,549 2.8%Consumer 43,118 45,977 48,653 49,706 50,332 50,314 49,985 0.7%Components 81,947 82,786 85,772 89,269 93,984 95,367 99,341 3.7%
EMEA 377,723 394,153 411,740 425,922 442,343 452,309 466,868 3.2% % of World Market 29% 28% 28% 28% 27% 27% 27%
Total World 1,314,247 1,394,976 1,465,932 1,534,104 1,625,214 1,676,950 1,757,232 4.6%
EMEA Electronic Market($ Millions)
Market FundamentalsEMEA Electronics Market 27% of World
*Forecast data do not include inflation Source: Reed Electronics Research
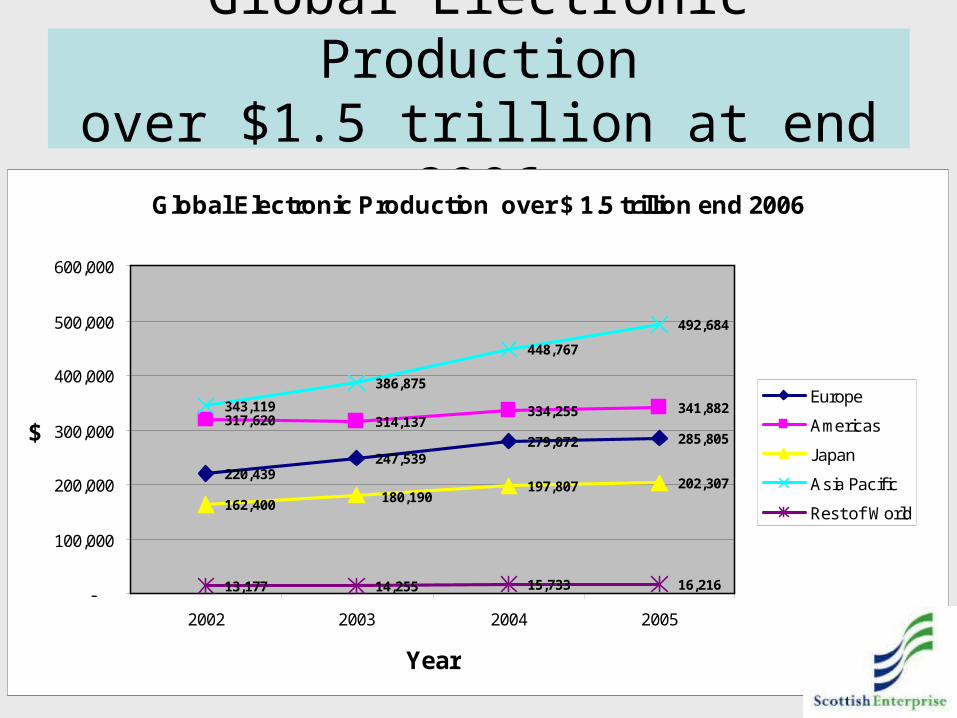
Global Electronic Productionover $1.5 trillion at end 2006Global Electronic Production over $ 1.5 trillion end 2006
220,439247,539
279,072 285,805317,620 314,137
334,255 341,882
162,400197,807 202,307
343,119
386,875
448,767
492,684
13,177 14,255 15,733 16,216
180,190
-
100,000
200,000
300,000
400,000
500,000
600,000
2002 2003 2004 2005
Year
$
Europe
Americas
Japan
Asia Pacif ic
Rest of World
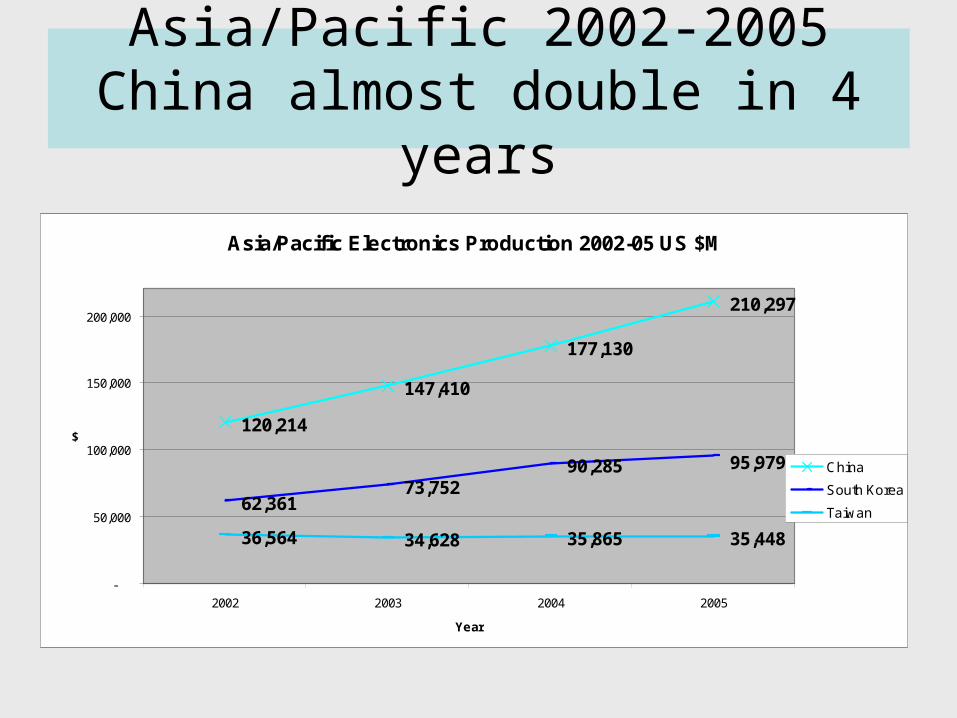
Asia/Pacific 2002-2005China almost double in 4 years
Asia/Pacific Electronics Production 2002-05 US $M
120,214
147,410
177,130
210,297
62,36173,752
90,285
36,564 34,628 35,865 35,448
95,979
-
50,000
100,000
150,000
200,000
2002 2003 2004 2005
Year
$
China
South Korea
Taiwan
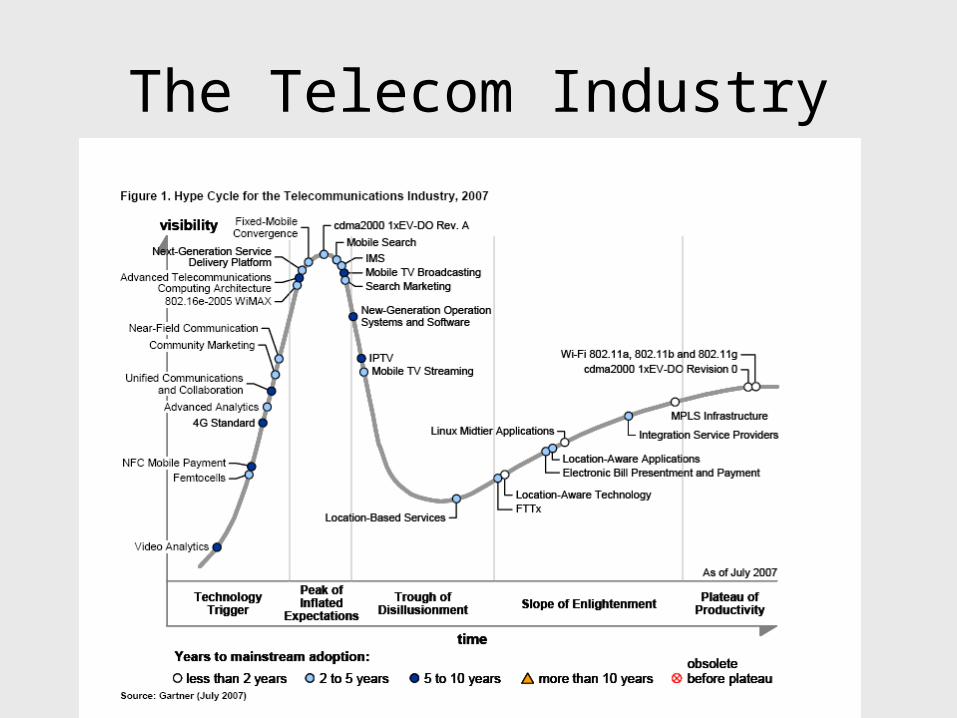
The Telecom Industry
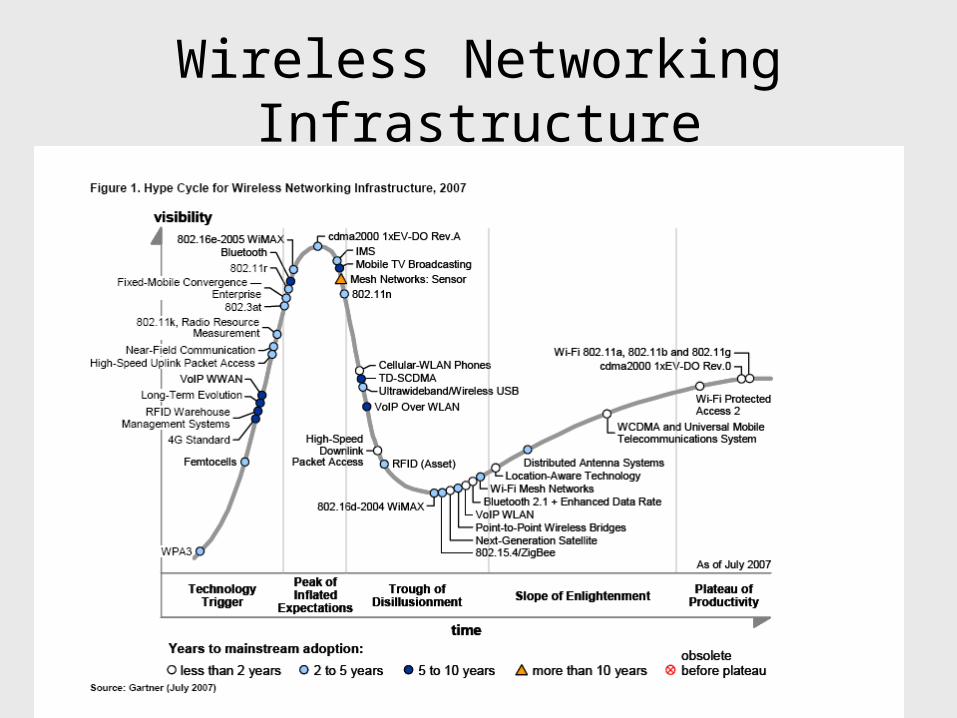
Wireless Networking Infrastructure
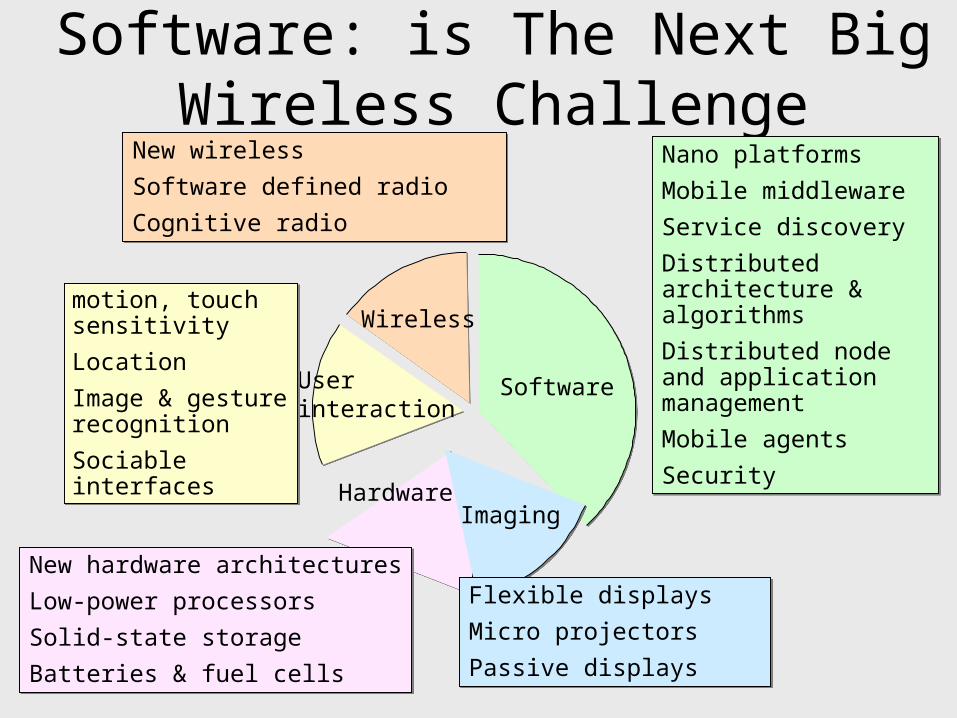
Software: is The Next Big Wireless Challenge
Software
Hardware
Wireless
Imaging
Userinteraction
Nano platforms
Mobile middleware
Service discovery
Distributed architecture & algorithms
Distributed node and application management
Mobile agents
Security
Nano platforms
Mobile middleware
Service discovery
Distributed architecture & algorithms
Distributed node and application management
Mobile agents
Security
New wireless
Software defined radio
Cognitive radio
New wireless
Software defined radio
Cognitive radio
motion, touch sensitivity
Location
Image & gesture recognition
Sociable interfaces
motion, touch sensitivity
Location
Image & gesture recognition
Sociable interfaces
New hardware architectures
Low-power processors
Solid-state storage
Batteries & fuel cells
New hardware architectures
Low-power processors
Solid-state storage
Batteries & fuel cells
Flexible displays
Micro projectors
Passive displays
Flexible displays
Micro projectors
Passive displays

Ready for Take-Off