138 alternative materials for subgrade modification · alternative materials for subgrade...
TRANSCRIPT

138
Alternative Materials forSubgrade ModificationFinal Report
PHYSICAL RESEARCH REPORT NO. 138October 2001

TECHNICAL REPORT STANDARD TITLE PAGE1. Report No.
IL-PRR-138
2. Government Accession No. 3. Recipient's Catalog No.
5. Report Date
October 2001
4. Title and Subtitle
Alternative Materials for Subgrade Modification6. Performing Organization Code
7. Author(s)
Greg Heckel
8. Performing Organization Report No.
Physical Research Report 13810. Work Unit No.9. Performing Organization Name and Address
Illinois Department of Transportation District 6126 E. Ash StreetSpringfield, Illinois 62704
11. Contract or Grant No.
13. Type of Report and Period Covered
Final ReportJan. 1995 to Dec. 2000
12. Sponsoring Agency Name and Address
Illinois D.O.T. Bureau of Materials and Physical Research126 E. Ash StreetSpringfield, Illinois 62704 14. Sponsoring Agency Code
15. Supplementary Notes
16. Abstract
This study examines the laboratory and field performance of two alternative materials used for themodification of unstable (CBR<6) subgrade soils. Modification is temporarily enhancing subgradestability to improve the constructability of successive pavement layers. The alternative materialsincluded a by-product hydrated lime (BHL) and a Class C fly ash (CCFA) meeting the requirements ofAASHTO M 295. Three experimental projects were constructed incorporating these materials with avariety of soil types. The performance of sections treated with these materials was compared to thatof control sections treated with a high calcium lime kiln dust (LKD) or dense graded aggregate,depending on site conditions. Information presented in this study includes laboratory background andmix design data, construction procedure evaluation, bearing value and subgrade rut depth data,pavement performance data, and recommended mix design procedures and specifications. Theresults indicate that BHL and CCFA are acceptable materials for subgrade modification.
17. Keywords
lime, fly ash, stabilization, modification,subgrade, waste utilization, case study,construction
18. Distribution Statement
No restrictions. This document is available to thepublic from the sponsoring organization.
19. Security Classification (of this report)
Unclassified20. Security Classification (of this page)
Unclassified21. No. of Pages
6422. Price

ALTERNATIVE MATERIALS FOR SUBGRADE MODIFICATION
Experimental Features Project IL96-02
Final Report
October 2001
Greg Heckel, P.E.Geotechnical Engineer
Illinois Department of Transportation District 6
in cooperation with
Illinois Department of TransportationBureau of Materials and Physical Research

This study was supported by the Illinois Department of Transportation Bureau of Materials andPhysical Research (BMPR). Laboratory testing was conducted at the BMPR Soils Laboratory.Deflection testing was performed by the BMPR Pavement Technology Unit. Experimental andcontrol sections were constructed using Federal funding according to the requirements of theFederal Highway Administration’s Experimental Features program. The assistance and supportfrom Materials and Construction personnel in IDOT Districts 4 and 6 during field test planningand construction is greatly appreciated. Experimental and control sections were constructed bythe Dunn Company of Decatur, Illinois. Their cooperation during construction and qualityworkmanship contributed to the success of this project. Discussions with Riyad Wahab,Geotechnical Engineer at the Bureau of Materials and Physical Research, are also greatlyappreciated.
COVER
Spreading, processing, and compacting CCFA section on US 67 near Jacksonville, Illinois.Photographed by Greg Heckel on October 23, 1997.
UNITS
Projects constructed as part of this study were constructed using either English or Metric units.Metric units are used except where English units are required. Some useful conversions areshown below.
1 inch = 25 mm 1 gal./yd² = 4.5 L/m²3.3 ft = 1 m 1 lb/yd² = 0.54 kg/m²1 yd² = 0.84 m² 1 pcf = 16.02 kg/m³1 kip = 4.4 kN 1 psi = 6.89 kPa(F°-32)/1.8 = C° 1 ksi = 6.89 MPa
COMMON ABBREVIATIONS
LKD = Lime Kiln Dust BHL = By-Product Hydrated LimeCCFA = Class C Fly Ash DCP = Dynamic Cone PenetrometerIBV = Immediate Bearing Value* COV = Coefficient of VariationFWD = Falling Weight Deflectometer
*IBV is assumed equivalent to the unsoaked CBR (AASHTO T 193) in a laboratory context or the field CBR (ASTM D4429) when testing in-place subgrade.
The contents of this Report reflect the views of the author, who is responsible for the facts andaccuracy of the data presented herein. The contents do not necessarily reflect the official viewsor policies of IDOT. This report does not constitute a standard, specification, or regulation atIDOT. Manufacturers’ names appear in this report because they are considered essential to theobject of this report. They do not constitute an endorsement by IDOT.
TABLE OF CONTENTS
I. INTRODUCTION.............................................................................................................................1
I.1 PROJECT OVERVIEW ....................................................................................................................1I.2 FIELD TEST LOCATIONS ................................................................................................................1I.3 MATERIALS.................................................................................................................................2
II. LABORATORY TESTING AND MIX DESIGN..................................................................................4
II.1 PHASE ONE LABORATORY TESTING ...............................................................................................4II.2 MIX DESIGN PROCEDURES ...........................................................................................................4II.3 MIX DESIGN RESULTS .................................................................................................................5
III. TEST SECTION CONSTRUCTION ................................................................................................8
III.1 GENERAL.................................................................................................................................8III.2 SUBGRADE PREPARATION...........................................................................................................8III.3 MATERIAL HANDLING..................................................................................................................9III.4 SPREADING MATERIAL................................................................................................................9III.5 PROCESSING ..........................................................................................................................11III.6 COMPACTION..........................................................................................................................11III.7 FINISHING AND CURING.............................................................................................................12III.8 CLIMATIC CONDITIONS ..............................................................................................................13III.9 PAVEMENT..............................................................................................................................13
IV. TEST SECTION PERFORMANCE...............................................................................................14
IV.1 GENERAL...............................................................................................................................14IV.2 IMPROVED SUBGRADE QUALITY .................................................................................................14
IV.2.1 Constructability...............................................................................................................14IV.2.2 Moisture Content.............................................................................................................15IV.2.3 Density...........................................................................................................................17IV.2.4 Bearing Values ...............................................................................................................17IV.2.5 Visual Observations and Rutting ......................................................................................21IV.2.6 Project 3 Remedial Action and Analysis of Unsatisfactory Performance..............................22
IV.3 PAVEMENT PERFORMANCE .......................................................................................................23
RECOMMENDATIONS .....................................................................................................................24
REFERENCES .................................................................................................................................25
APPENDICES
LOCATION INFORMATION ............................................................................................................ A
MIX DESIGN DATA ........................................................................................................................ B
SELECTED PHOTOGRAPHS ......................................................................................................... C
INDIVIDUAL DCP TEST DATA....................................................................................................... D
FWD TEST DATA............................................................................................................................E
RECOMMENDED MIX DESIGN PROCEDURES AND SPECIFICATIONS ..........................................F

LIST OF TABLES
TABLE 1. CHEMICAL AND PHYSICAL PROPERTIES OF THE ALTERNATIVE MATERIALS........................................2TABLE 2. CHEMICAL AND PHYSICAL PROPERTIES OF INDIVIDUAL BHL SAMPLES.............................................3TABLE 3. AVERAGE PHYSICAL PROPERTIES OF SOILS ................................................................................3TABLE 4. AS-BUILT TREATMENT RATES .................................................................................................10TABLE 5. PAVEMENT INFORMATION.......................................................................................................13TABLE 6. SUMMARY OF BHL MOISTURE DATA........................................................................................15TABLE 7. SUMMARY OF CCFA MOISTURE DATA .....................................................................................16
LIST OF FIGURES
FIGURE 1. PROJECT 1 IBV PROFILE.......................................................................................................6FIGURE 2. PROJECT 3 IBV PROFILE.......................................................................................................7FIGURE 3. RS-500 PROCESSING OPERATION.........................................................................................11FIGURE 4. PROJECT 1 AVERAGE IBV VS. DAYS AFTER COMPACTION: 0 TO 150 MM. ....................................18FIGURE 5. PROJECT 1 AVERAGE IBV VS. DAYS AFTER COMPACTION: 150 TO 300 MM. ................................18FIGURE 6. PROJECT 1 COV VS. DAYS AFTER COMPACTION: 0 TO 150 MM. ................................................18FIGURE 7. PROJECT 1 COV VS. DAYS AFTER COMPACTION: 150 TO 300 MM. ............................................18FIGURE 8. PROJECT 2 AVERAGE IBV VS. DAYS AFTER COMPACTION: 0 TO 150 MM. ....................................19FIGURE 9. PROJECT 2 AVERAGE IBV VS. DAYS AFTER COMPACTION: 150 TO 300 MM. ................................19FIGURE 10. PROJECT 2 COV VS. DAYS AFTER COMPACTION: 0 TO 150 MM. ..............................................19FIGURE 11. PROJECT 2 COV VS. DAYS AFTER COMPACTION: 150 TO 300 MM. ..........................................19FIGURE 12. PROJECT 3 AVERAGE IBV VS. DAYS AFTER COMPACTION FOR CCFA TREATED SUBGRADE. ........20FIGURE 13. PROJECT 3 COV VS. DAYS AFTER COMPACTION FOR CCFA TREATED SUBGRADE. ....................20FIGURE 14. PROJECT 3 IBV OF THE TOP 150 MM OF TREATED SOIL AFTER 7 DAYS.....................................20FIGURE 15. AREAS SHOWING UNSATISFACTORY STABILITY ON PROJECT 3. ................................................22

1
I. Introduction
I.1 Project Overview
For nearly two decades, the Illinois Department of Transportation (IDOT) has routinely usedhigh calcium lime kiln dust (LKD) to improve the stability of subgrades during construction. In1994, a major supplier of LKD announced that they would no longer reclaim material from minestorage. Consequently, only the LKD resulting directly from current production was availablefrom that source. Since that time, the price of LKD has more than doubled. Additionally, thesupply of LKD has become more restricted while demand continues to increase. The AlternativeMaterials for Subgrade Modification project was initiated in 1995 to examine alternatives to LKDthat may be used to improve subgrade stability.
The work associated with this project was conducted in two phases. Phase One consisted of anin-depth laboratory testing program. The performance of soils treated with the alternativematerials was compared to that of corresponding soils treated with LKD. The testing includeddetermining moisture-density relationships, bearing values, compressive strengths, swellpotential, and plasticity indices of treated and untreated soils. IDOT Physical Research ReportNo. 125 (Heckel, 1997) presents the findings of the laboratory study phase of this project.
Phase Two of this project includes the performance evaluations of selected materials in avariety of construction situations. These field evaluations compare experimental sectionstreated with the alternative materials to control sections treated using standard materials.Phase Two also examines the effectiveness of laboratory mix design procedures in predictingfield performance. The treated subgrades have been evaluated based on constructability,bearing values, subgrade rutting, and pavement performance.
This report primarily focuses on the results of Phase Two of this study. The results of the PhaseOne portion of this study are summarized in Section II.1 of this report.
I.2 Field Test Locations
Three experimental projects were constructed between June of 1997 and April of 1998. Thesedates reflect when the subgrade was treated and do not reflect when subsequent pavementlayers were placed.
Project 1 was constructed in June 1997 on Veteran’s Parkway (IL 4) on the north side ofSpringfield, Illinois. The experimental and control sections are located in the northbound andsouthbound lanes between J. David Jones Parkway (IL Route 29) and Browning Road.
Project 2 was constructed in October 1997 on the US 67 Expressway west of Jacksonville,Illinois. The experimental and control sections are located in the southbound lanes between theMorton Avenue Interchange (old US 36) and the Liberty Road (Township Road 157) overpass.
Project 3 was constructed in April 1998 on US 34 between Carman Road and the town ofGulfport in western Henderson County, Illinois. The experimental and control sections werelocated in the westbound lanes.

2
Maps showing the general locations and details showing the layout of each project are includedin Appendix A.
I.3 Materials
Two alternative materials were selected for field evaluation based on their Phase Onelaboratory performance. One material, by-product hydrated lime (BHL), is the coarse residuewhich has been separated from the pure, fine hydrated lime during production, commonly called“hydrator tailings.” BHL is essentially dirty, coarse hydrated lime. The other material is a ClassC fly ash (CCFA) meeting the requirements of AASHTO M 295. The control materials consistedof LKD or dense-graded aggregate (IDOT gradation CA 06) depending on specific siteconditions. BHL was provided by the Mississippi Lime Company in Ste. Genevieve, Missouri.CCFA was provided by American Fly Ash from the Commonwealth Edison Will County Stationand Iowa-Illinois G & E Louisa Station. Table 1 shows the range of chemical and physicalproperties of the alternative materials selected for field evaluation. The data ranges shown inTable 1 are based on samples tested during Phase One, during the mix design process, andduring test section construction.
Table 1. Chemical and Physical Properties of the Alternative Materials
LKD Control BHL CCFAChemical Properties
CaO + MgO, % 81 – 87 94 – 114 27 – 35Ca(OH)2, % (Rapid Sugar) 38 – 49 55 – 91 NT
SO3, % NT NT 1 – 3SiO2, % NT NT 31 – 39Al2O3, % NT NT 18 – 23Fe2O3, % NT NT 5 – 6
SiO2+Al2O3+Fe2O3, % NT NT 55 – 69Loss on Ignition (LOI), % 16 – 21 15 – 24 0.2 – 0.6
Physical PropertiesSpecific Gravity (G) 2.87 – 2.91 2.31 – 2.75 2.65 – 2.81
+ 4.75 mm, % 0 0 NT+ 600 µm, % 3 – 5 1 – 9 NT+ 150 µm, % 12 – 22 46 – 74 NT+ 75 µm, % NT NT 6 – 11
Number of Samples 4 6 7NT = Not Tested
The data in Table 1 shows that BHL has the highest variation in overall material properties andis considerably coarser than LKD or CCFA. Table 2 shows the test results from individual BHLsamples obtained during lab testing and test section construction.

3
Table 2. Chemical and Physical Properties of Individual BHL Samples
Phase One Project 1Mix Design
Project 1Construction
Project 2Construction
Chemical PropertiesCaO + MgO, % 94 95 114 99 98 92
Ca(OH)2, % (Rapid Sugar) 83 91 87 55 70 77Loss on Ignition (LOI), % 19 23 24 15 23 17
Physical PropertiesSpecific Gravity (G) 2.46 2.31 2.35 2.75 2.48 2.50
+ 4.75 mm, % 0 0 0 0 0 0+ 600 µm, % 4 2 2 1 3 9+ 150 µm, % 54 47 52 50 59 74
The data in Table 2 indicates that the BHL received during construction was not consistent.Data presented later in this Report indicates that this variation did not have a measurable effecton the performance of the test sections evaluated. However, significant variability couldpotentially be detrimental.
Each field test location featured a different soil type. Both a clay and a silt were treated withBHL and CCFA with LKD used as a control. A sand was treated with CCFA, with a dense-graded aggregate used in the corresponding control section. Table 3 shows the averagephysical properties of the soils treated in the field test sections.
Table 3. Average Physical Properties of Soils
Project 1 Project 2 Project 3
AASHTO Classification A-6 A-4 A-3IDOT TexturalClassification Clay Silt Sand
Liquid Limit, % 39.0 29.7 NTPlasticity Index 19.6 8.0 NP
Sand, % 0.0 0.9 97.3Silt, % 45.6 85.0 0.8Clay, % 54.4 14.2 1.9
- 75 µm, % 100.0 NT 1.9NT = Not Tested NP = Non-Plastic
The data shown in Table 3 demonstrates that a wide variety of soil types were tested in thefield.

4
II. LABORATORY TESTING AND MIX DESIGN
II.1 Phase One Laboratory Testing
The Phase One laboratory testing focused on two alternative lime by-products and two flyashes. The performance of each material was compared to that of LKD. The lime by-productsconsisted of a dried lime kiln sludge (DLKS) and BHL. DLKS is produced from a wet kilnexhaust effluent which is ponded as an inert sludge. The effluent is collected, press-dried, andthen further dried by activating it with 15% CaO (quicklime). Two Class C fly ashes were used.One ash met the requirements of AASHTO M 295. The other ash had a loss on ignition andsulfate content outside the limits required by AASHTO M 295.
The lime by-products were mixed with three typical Illinois soils in addition to a commerciallyavailable, dry-milled Fire Clay. The Fire Clay was included as a readily available, uniformreference soil. Soils were generally treated with 5% lime by-product and 10% fly ash based onthe dry weight of soil. Because they were added late in the laboratory study, the fly ashes wereonly mixed with the Fire Clay.
Laboratory test results indicated that the DLKS and BHL reduced the maximum dry density andplasticity index of the soils in the same manner as the LKD. They also increased the optimummoisture contents, the compressive strengths, immediate bearing values, and the IllinoisBearing Ratio. The tests indicated that DLKS and BHL would perform well as soil modifiers.Test results also indicated that both fly ashes increased the bearing value, compressivestrength, and plasticity index of the Fire Clay. Fly ash treatment had no consistent effect onmaximum dry density and optimum moisture content. The high sulfate fly ash treated Fire Clayexhibited a tendency to swell when soaked during the Illinois Bearing Ratio test. Curing prior tosoaking significantly reduced swelling.
The Phase One study recommended that DLKS, BHL, and Class C fly ash meeting AASHTOM 295 requirements be evaluated in the field. Prior to initiating field tests, the producer of DLKSwithdrew the material from consideration due to the high costs associated with production.These production costs would not have made DLKS a competitive alternative to LKD. Completelaboratory test data and analyses are included in Physical Research Report No. 125 (Heckel,1997).
II.2 Mix Design Procedures
Prior to construction, a project-specific determination of the optimum treatment rate for eachalternative material was made by IDOT’s Bureau of Materials and Physical Research (BMPR).In general, representative samples of soils from the three field test locations were taken to theBMPR soils laboratory along with samples of each alternative material to be used. A separatemix design was not performed for specific LKD control sections. Mix designs for LKD modifiedsoils are based on overall project soil conditions. Additionally, IDOT has adequate experiencewith LKD, lessening the need for mix designs.
Mix design procedures involved developing a moisture-density-immediate bearing value (IBV)relationship over a range of moisture contents for each trial treatment rate. Individual batches oftreated soil at specific moisture contents were prepared by mixing dry soil, BHL or CCFA, andthe water required to obtain the desired moisture content. Each batch of BHL treated soil was

5
allowed to mellow in a sealed container for one hour prior to compaction. Compaction of eachbatch of CCFA treated soil was also delayed for one hour to simulate the maximum allowablefield compaction delay. After one hour, the treated soil was compacted in a 100 mm diametermold according to AASHTO T 99 Method C.
After compaction and prior to removing the compacted specimen from the mold, the treated soilwas penetrated using a standard CBR piston according to AASHTO T 193. The load at apenetration of 5 mm was used to determine the CBR. The CBR obtained using theseprocedures is considered equivalent to the IBV. After penetration, the treated soil was removedfrom the mold and oven dried to determine actual moisture content.
After recording the appropriate data, plots of dry density vs. moisture content and IBV vs.moisture content were prepared at each trial treatment rate for each alternative material. Thetreatment rate that indicated a minimum IBV of 10 at the anticipated field moisture contents wasselected. The actual field treatment rate was generally increased by 1% to offset constructionloss.
The mix design procedure for fly ash modified soils included an optional provision for curing upto 48 hours. The curing could be used in lieu of adding additional fly ash to obtain the requiredIBV. Curing was done at room temperature by sealing the compacted specimen in the moldand delaying penetration.
In addition to curing, the fly ash mix design included special procedures for granular soils.Instead of relying on IBV tests for evaluating fly ash treated granular soils, compressive strengthtesting was considered more effective (refer to Section II.3, Project 3 for a discussion aboutgranular soil mix design). Cylindrical samples were prepared at standard dry density andoptimum moisture content for each trial fly ash content. They were allowed to cure for 24 hoursat room temperature and were then tested according to AASHTO T 208. The treatment ratewhich resulted in a minimum compressive strength of 310 kPa was selected.
An effective moisture content range was also determined. The minimum effective moisturecontent is equal to the optimum moisture content of the treated soil. The maximum effectivemoisture content is the highest moisture content that can sustain a minimum IBV of 10.
II.3 Mix Design Results
The results from each project’s mix designs are summarized below. Appendix B contains thecomplete test data obtained during each mix design. All treatment rates shown in the followingsections are percentages based on the maximum dry density of the untreated soil.
Project 1 – Clayey Soil
The mix design performed for Project 1 determined that 3% BHL and 10% CCFA treatmentrates would meet stability requirements. An additional 0.5% of BHL and 1.0% of CCFA wasadded to offset construction losses. Figure 1 shows the IBV profile determined during the mixdesign.

6
0
5
10
15
20
25
30
35
13 15 17 19 21 23 25 27 29
Moisture Content, %Untreated 3% BHL10% CCFA 15% CCFA
Figure 1. Project 1 IBV Profile
The IBV data plotted in Figure 1 shows that the addition of 3% BHL provided the greatestbenefit. The BHL increased the IBV over a wider range of moisture contents than the CCFA.Figure 1 also shows that 15% CCFA produced a slight increase in IBV over the 10% CCFA atmoisture contents less than about 20%. Beyond that, there was virtually no change in the IBV-moisture content relationship for the soil treated with 10% and 15% CCFA.
Project 2 – Silty Soil
A comprehensive mix design was not completed for Project 2. The location of the test sectionwas changed approximately one month prior to construction. A mix design had already beencompleted using soil from the originally planned location. The soil at the new location had ahigher silt fraction and less than half the PI of the soil at the original location (Appendix Bincludes soil properties). Additionally, the original test plan did not include the use of BHL. BHLwas added to the plan at the same time the location was changed.
Construction scheduling required a treatment rate recommendation before a new,comprehensive mix design could be completed. The recommendation for a 15% CCFAtreatment rate and 48 hour curing period was based on the original mix design, and therecommendation for a 4% BHL treatment rate was based on previous laboratory testing andfield experience. The CCFA treatment rate was increased from 15% to 16% to offsetconstruction variances. No allowance for construction variance was added for the BHL.
Project 3 – Sandy Soil
The mix design for Project 3 determined that a 12% CCFA treatment rate would provideadequate subgrade stability in conjunction with a 24 hour curing period. Figure 2 shows the IBVprofile obtained from the Project 3 mix design.

7
0
5
10
15
20
25
4 6 8 10 12 14 16 18
Moisture Content, %Untreated 12% CCFA15% CCFA
Figure 2. Project 3 IBV Profile
The data in Figure 2 shows a significant increase in IBV at optimum moisture content (9.3%) forthe soil treated with 15% CCFA. After reducing the treatment rate to 12%, the IBV decreased tobelow that of the natural soil. Such a decrease in IBV is contrary to expected behavior. Anadditional IBV sample of soil treated with 12% fly ash was prepared at optimum moisturecontent. This sample was allowed to cure in a plastic bag at room temperature for 24 hours.Curing the sample resulted in an IBV equal to 45.
The atypical IBV test results for the soil treated with 12% fly ash shown in Figure 2 and theunreasonably high cured IBV cast doubt on the validity of an IBV based mix design process forsandy soils. Therefore, compressive strength tests were performed to confirm IBV test results.According to a correlation between IBV and cohesion commonly used by IDOT (IDOT, 1982),an IBV of 10% is approximately equal to an unconfined compressive strength of 310 kPa.Samples of fly ash treated soil were compacted at standard dry density and optimum moistureand allowed to cure in plastic bags at room temperature for 24 hours, 48 hours, and 7 days.The soil treated with 12% fly ash achieved an average compressive strength of 396 kPa after 24hours. This strength corresponded to an IBV of 13.
The recommended application rate of 12%, with a minimum 24 hour curing period, was basedon the compressive strength. The effective moisture content range of 9.2% to 10.2% wasbased on the moisture-density relationship of the treated soil. No IBV data was used todetermine the recommended application rate or effective moisture content range.

8
III. TEST SECTION CONSTRUCTION
III.1 General
An Experimental Feature Work Plan was prepared and approved as required by the FederalHighway Administration prior to construction. The Work Plan was amended as additional testsections were added. Test section locations were selected based, primarily, on the availabilityof suitable construction projects planned within two years of Work Plan approval.
On each project, samples of soil were obtained from random locations over the length and widthof the untreated test and control sections for laboratory classification. The classification testresults were used to confirm the uniformity of soil types within the control and experimentalsections.
The experimental and control modified subgrade sections on Project 1 were constructed June 3-5, 1997. On Project 2, the sections were constructed October 23-24, 1997. On Project 3, theexperimental section was constructed on April 21, 1998. Project 3’s dense-graded aggregatecontrol section was constructed at the end of April 1998. Subsequent pavement layers wereconstructed as shown in Section III.9, Table 5.
Selected photographs of construction operations are included in Appendix C.
III.2 Subgrade Preparation
Subgrade modification generally does not require extensive subgrade preparation, beyondcompleting construction to the approximate required plan and grade. Current IDOTspecifications require lightly scarifying or disking the surface prior to distributing material.Scarification enables the equipment used to mix the soil and modifier to more easily break downcohesive soils to a suitable size. Most contractors, however, find it more practical to distributematerial prior to scarifying or disking. Distributing material prior to scarification enablesspreading equipment to more easily traverse the area to be treated, resulting in a more uniformdistribution of material.
Experimental and control sections on Projects 1 and 2, consisting of clays and silts, werescarified to a depth of 150 mm following the distribution of LKD and BHL. The CCFA section onProject 1 was scarified in conjunction with the addition of water approximately 18 hours prior toCCFA distribution. Scarification was accomplished with a Caterpillar 140G motor grader with afive tooth scarifier. The CCFA section on Project 2, which consisted of silt, was not scarifiedbecause distribution had to be accomplished using the two-step process described in SectionIII.4. The CCFA section on Project 3, which consisted of sand, was not scarified.
Modification often requires more water for a chemical reaction than what is available in thesubgrade prior to treatment. In these cases, the contractor may elect to add water either beforeor after material distribution. When water is added after CCFA distribution, it should be donedirectly in front of the mixing equipment. On Project 1, water was added 18 hours prior to CCFAdistribution to allow the water to soak into the cohesive soil. On Project 3, water was added tothe sandy soil approximately four hours prior to CCFA distribution.

9
III.3 Material Handling
On Project 1, BHL and CCFA were delivered to the project site in pneumatic tank trailers.Material was blown from pneumatic tanks into a portable, covered hopper. From the hopper,the material was transferred into spreader trucks using an auger-type conveyor system. Thehopper had its own air filtration system to control the amount of dust lost to blowing. However,blowing dust was generated by the free-fall of material from the auger outlet to the bed of thespreader truck. LKD was delivered to the Project 1 site in covered dump-bed trailers. LKD wasdumped in piles directly on the subgrade and was transferred to spreader trucks using a wheelloader.
On Project 2, LKD and CCFA were delivered to the project site in covered dump-bed trailers.The materials were dumped in piles directly onto the subgrade and were transferred to spreadertrucks using a wheel loader. BHL was delivered in pneumatic tank trailers and was placed ontothe subgrade directly from the pneumatic tank.
On Project 3, CCFA was delivered to the site in pneumatic tank trailers. CCFA was stockpiledin a staging area located away from the test section. CCFA was transferred from the stockpileto the spreader trucks using a wheel loader.
In general, the use of BHL caused personnel safety concerns for the contractor. The high CaOcontent of BHL causes a burning sensation when the dust comes in contact with skin and eyes.Breathing can also be difficult and painful. The contractor’s personnel covered their skin withclothing and gloves to minimize skin contact. They also made use of simple dust masks.Respirators were tried, but were not used because the dust would accumulate at the sealbetween the skin and the mask causing irritation. The personnel were also instructed to keepaway from the dust as much as possible. The workers on-site said that working with LKD, whilecausing some discomfort, does not have the same severe problems with personal contact.
III.4 Spreading Material
With the exception of Project 2’s BHL section, material was spread using modified tandemtrucks. The truck bed consisted of an elongated hopper with a conveyor system at the base.The conveyor fed material at a constant rate from the hopper into a baffle system mounted tothe back of the truck. The baffles evenly distributed material over the width of the truck (about2.4 m). The correct application rate was obtained by spreading a known quantity over a knownarea.
The existing subgrade conditions on Project 1 did not impact spreading operations. Spreadertrucks were able to distribute material without excessive rutting or mobility problems.
On Project 2, existing subgrade conditions varied from firm and moist on the LKD and BHLsections to weak and wet on the CCFA section. BHL was spread directly onto the subgradefrom pneumatic tanker trucks. A motor grader was then used to uniformly distribute the BHLover the surface of the subgrade. Spreader trucks were used to distribute the LKD and CCFA.No problems were experienced during the BHL or LKD spreading operations.

10
The large quantity of CCFA on Project 2 required that spreading and mixing operations be intwo stages, to ensure a homogeneous mixture of soil and fly ash. Thirty percent or 36 kg/m² ofthe total CCFA quantity was initially distributed using spreader trucks. The CCFA test sectioncontained a 50 m long soft, wet area. The initial spreading operation resulted in extensive,severe rutting within this area. The rut depth was measured as much as 380 mm. A motorgrader was used twice to pull out stuck spreader trucks. Due to the excessive rutting andmobility difficulties, obtaining a uniform initial distribution of CCFA was not possible. Aftermixing the initial CCFA quantity and smoothing the surface with a motor grader, the remainingCCFA was spread using the spreader trucks. The trucks did not experience significantproblems during stage two spreading, resulting in a uniform distribution of the remainingquantity of CCFA.
On Project 3, the spreader trucks had extreme difficulty spreading CCFA. The trucks losttraction on the sand before completely spreading their loads. The rotary speed mixer wasfrequently used to rescue spreader trucks, greatly reducing productivity. Severe subgraderutting prevented a uniform distribution of CCFA. After spreading CCFA over 20% of the testsection area, the contractor altered spreading procedures in an effort to increase productivityand minimize disturbance of the subgrade. The contractor used the rotary speed mixer to pullthe spreader trucks over the length of the test section. Instead of one truck spreading therequired quantity of CCFA over a small area, five spreader trucks distributed their loads in a 2.4m wide strip over the length of the test section. This was repeated until the entire width of thetest section was treated. Additional fly ash was spread in the areas damaged by the initialspreading operation to offset the poor uniformity.
Table 4 shows the as-built treatment rates. The data is based on the total quantity of materialdelivered, the area treated, and the maximum dry density of the untreated soil. The dataassumes a uniform distribution was obtained and there were no losses. It is estimated between0.5 and 1.0% of material was not incorporated as a result of material handling or minor over-spreading outside the required treatment area.
Table 4. As-Built Treatment Rates
LKD BHL CCFA
Project 1 – Clay 4% 21 kg/m² 3% 17 kg/m² 11% 57 kg/m²Project 2 – Silt 7%a 37 kg/m² 5%a 26 kg/m² 20%a 107 kg/m²
Project 3 - Sand - - - - 13% 66 kg/m²Treatment rate is shown as a percent of the untreated soil dry weight and as kg of material added per squaremeter of subgrade.a Approximate rate based on maximum dry density of a similar soil outside the test area.

11
III.5 Processing
The contractor used a CMI RS-500 rotary speed mixer to process the modifier and subgradesoil on all three projects. The RS-500 is configured with a 2.4 m wide mixing drum in the centerof the machine. The mixing drum is fitted with rows of teeth and can rotate over a range ofspeeds. The size of the mixing chamber can also be adjusted to achieve the desired processedmaterial size. The mixing drum can be raised and lowered depending on the desired depth ofprocessing. Figure 3 depicts the operation of the RS-500 rotary speed mixer.
MixingDrumUnprocessed
Soil
ProcessedMixture
Figure 3. RS-500 Processing Operation
LKD, BHL, and CCFA were mixed to a depth between 300 and 350 mm. Approximately 18 L/m²of water was spread directly in front of the RS-500 for LKD and BHL treated soils. The BHLsection of Project 1 required an additional 27 L/m² of water to offset dry subgrade conditions.Additional water was also distributed directly in front of the RS-500 on the Project 1 CCFAsection.
A homogeneous mixture of modifier and soil was generally obtained after one pass of the RS-500. The rotational speed of the RS-500 mixing drum was set between 170 and 200 rpmdepending on site conditions. The contractor varied the forward speed of the RS-500 in aneffort to maintain a homogeneous mixture. Generally, faster drum speeds and slower forwardspeeds were required to sufficiently mix treated cohesive soils. The contractor allowed BHLtreated soils on Project 1 to mellow for 24 hours after initial mixing. The contractor thenreprocessed and compacted the BHL treated soil. The contractor also elected to use a forwardand reverse pass of the RS-500 on LKD and BHL treated soils on Project 2.
III.6 Compaction
Compaction was performed using one Hyster C850B or C852B vibratory roller. These modelsare equipped with a single smooth or sheep’s foot drum. The sheep’s foot drum was used oncohesive soils on Projects 1 and 2, and the smooth drum was used to compact the sand-CCFAmixture on Project 3. The rollers’ vibratory mode was used on all three projects.
BHL treated soil required a minimum 24 hour mellowing period between initial processing andcompaction. The 24 hour mellowing period allows the coarse BHL particles sufficient time tocompletely hydrate. This is especially important in situations where the existing subgrade ismoist or dry and additional water needs to be added. Laboratory testing indicated thatinsufficient hydration prior to compaction may cause excessive drying of the treated soil(Heckel, 1997). The excessive drying may cause the treated soil to lose cohesion and increasethe percentage of unbound, silt sized particles. As a result, there can be an increased potential

12
for frost heave. The BHL-soil mixture was compacted 36 hours after initial processing onProject 1. On Project 2, the BHL-soil mixture was compacted three hours after mixing. The 24hour mellowing period was not completed because wet subgrade conditions along with theforecast for rain were thought to be sufficient to completely hydrate the BHL.
CCFA treated soils required compaction to be completed within one hour of mixing. Thislimitation is due to the “flash set” characteristics of the cementitious reaction between CCFA andwater. Compaction after 1 hour can begin to break down the cementitious bonds developing inthe CCFA-soil mixture. The longer compaction is delayed, the lower the resulting strength(Ferguson and Zey, 1990). The roller generally began compaction directly behind the RS-500.The forward speed of the RS-500 was about the same as that of the roller, but the roller made 6to 8 vibratory passes and 1-3 static passes over a given section depending on projectconditions. Periodically, the RS-500 had to briefly stop and wait for the roller to catch up tomaintain a satisfactory compaction delay. The time between the completion of mixing and thecompletion of compaction ranged from 20 to 45 minutes for all three projects. An additionalsmooth drum vibratory roller was used on Project 3 to increase productivity. The requirement tocompact treated soils within one hour of mixing did not significantly reduce productivity or causea hardship for the contractor.
LKD treated soils were compacted immediately following mixing.
III.7 Finishing and Curing
Following compaction, a motor grader smoothed and shaped the LKD and BHL sections to sealthe surface and promote drainage. Based on the contractor’s previous experience on privatesector CCFA modification projects, no construction equipment was allowed on the section for 18to 24 hours following compaction. CCFA sections on Projects 1 and 2 were rough graded in thesame manner as the LKD and BHL sections.
Project 2’s CCFA section required 48 hours of curing. Due to a poor weather forecast andcontractor scheduling conflicts, rough grading was attempted prior to the end of the curingperiod. While grading the CCFA treated section about 18 hours after compaction, small surfacecracks began to form under the weight of the grader. Grading was stopped, and after about 6hours the contractor attempted grading again. This time while the grader was working, a 15 mmwide longitudinal crack formed between the rear wheels of the grader. The crack was probablyformed by tensile forces created as the soil heaved up between the wheel loads of the grader.The grading operation was stopped to avoid further damage. The contractor was not requiredto finish grading after the curing period. Enough grading had been completed to allow water todrain off of a majority of the CCFA modified soil.
Project 3 required a 24 hour curing period following compaction of CCFA treated soils based onthe mix design. No water was added during the curing period due to precipitation. The surfaceof the treated subgrade was moist with isolated dry spots 17 hours after compaction.Construction equipment was not allowed on the section during the curing period. The CCFAsection did not require rough grading because a smooth drum roller was used for compaction.
13
III.8 Climatic Conditions
The chemical reactions required to achieve satisfactory performance are dependent upontemperature. For lime treated soils, the soil temperature must be above freezing. The effects oftemperature are more critical for CCFA treated soils. A low temperature slows CCFA hydrationand higher temperatures may cause “flash set” conditions. For CCFA treated soils, otherresearch [Ferguson, 1990; Glogowski et al, 1992; McManis, 1988] has identified 4.5°C as alower limit for soil temperature. Projects 2 and 3 were constructed at average soil temperaturesof 8°C and 9°C, respectively.
The ambient air temperature during curing CCFA modified soils is also an importantconsideration. On Project 2, temperatures fluctuated between 16°C and 4°C, with an averagetemperature of 10.5°C. On Project 3, temperatures fluctuated between 20°C and 6.7°C, with anaverage temperature of 12°C.
Precipitation during construction is also a concern for CCFA modification. If a significant rainfallevent occurs after the CCFA has been spread, but before it has been processed, the CCFA willhydrate prematurely. Wetting CCFA prior to processing causes hydration and cementation tooccur before any benefits are realized.
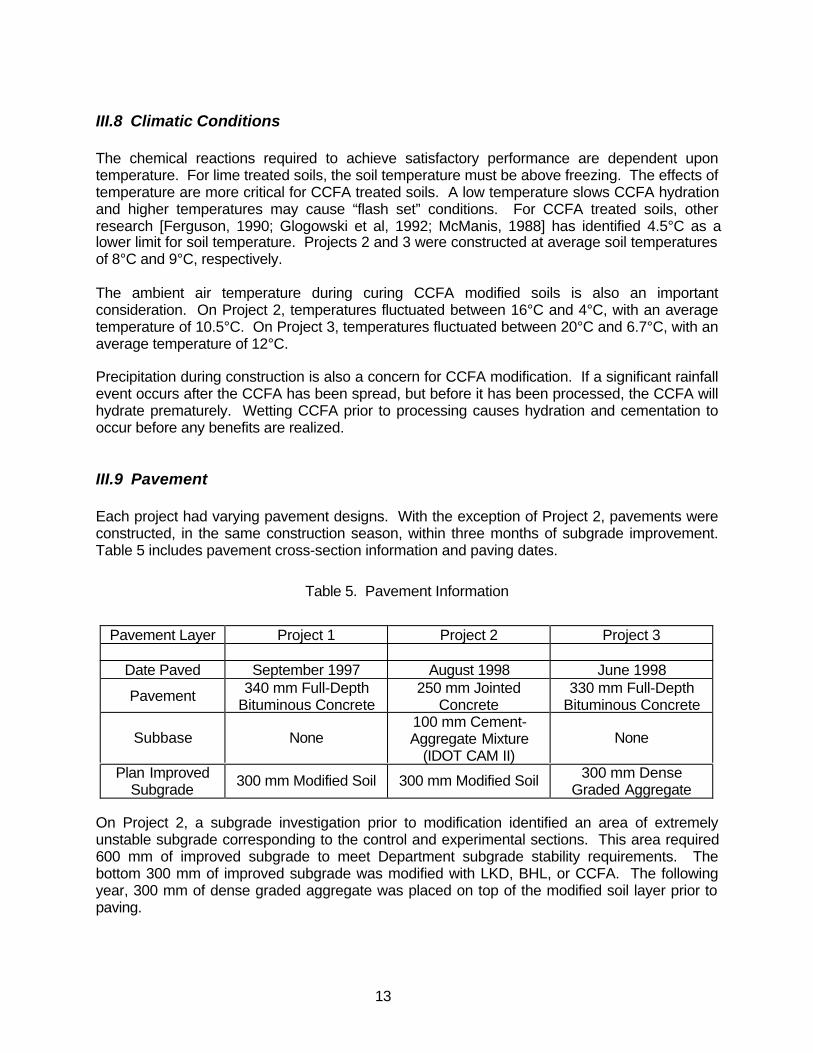
III.9 Pavement
Each project had varying pavement designs. With the exception of Project 2, pavements wereconstructed, in the same construction season, within three months of subgrade improvement.Table 5 includes pavement cross-section information and paving dates.
Table 5. Pavement Information
Pavement Layer Project 1 Project 2 Project 3
Date Paved September 1997 August 1998 June 1998
Pavement 340 mm Full-DepthBituminous Concrete
250 mm JointedConcrete
330 mm Full-DepthBituminous Concrete
Subbase None100 mm Cement-Aggregate Mixture
(IDOT CAM II)None
Plan ImprovedSubgrade 300 mm Modified Soil 300 mm Modified Soil 300 mm Dense
Graded Aggregate
On Project 2, a subgrade investigation prior to modification identified an area of extremelyunstable subgrade corresponding to the control and experimental sections. This area required600 mm of improved subgrade to meet Department subgrade stability requirements. Thebottom 300 mm of improved subgrade was modified with LKD, BHL, or CCFA. The followingyear, 300 mm of dense graded aggregate was placed on top of the modified soil layer prior topaving.

14
IV. TEST SECTION PERFORMANCE
IV.1 General
The primary purpose of the treated subgrade layer is to provide a uniformly stable constructionplatform. The subgrade must not rut more than about 12 mm under construction traffic. It mustalso provide a solid platform onto which successive layers of paving materials may be placedand adequately compacted when required. The treated subgrade layer is not considered in thepavement design. The pavement is designed based on untreated subgrade conditions.Therefore, a treatment that provides long-term stability after construction is not required.
The material or method used to treat the subgrade should not create a situation where thetreated subgrade becomes a detriment to pavement performance. Such situations can includecreating a frost susceptible material or initiating a chemical reaction that creates expansive by-products.
The performance evaluation for the three projects has been separated into two sections. Thefirst section discusses the quality of the improved subgrade as a stable construction platform.The second section discusses the performance of the finished pavement over a period ofapproximately three years.
Every reasonable effort was made to maintain the integrity of the results obtained during fieldtesting. The stability of the subgrade prior to and after construction was determined using thesame methods for each experimental and LKD treated control section. Initial and subsequenttesting was performed at the same locations, where possible. Variations in climatic conditionsbetween projects that may affect performance were recorded. Random samples of LKD, BHL,and CCFA were obtained and analyzed for each project to verify the quality of the materialsused.
IV.2 Improved Subgrade Quality
IV.2.1 Constructability
The experimental sections were constructed using equipment that is typically used to constructLKD treated subgrades throughout Illinois. There are no significant differences in materialhandling procedures, except for the concern regarding the irritation caused by BHL dust.According to the Contractor’s personnel, BHL causes significantly more irritation than LKD orCCFA. The construction methods for LKD and BHL treatment are nearly identical, except forthe BHL using a larger quantity of water and needing a conditioning period prior to compaction.The construction methods for CCFA and LKD treated soils are generally similar, except for acompaction delay limitation, two stage spreading and processing for large CCFA quantities, anda 24-hour curing period. With the differences in construction methods, productivity was notgreatly impacted. Productivity can be improved for CCFA treatment by adding a second roller.This enables the rotary speed mixer to maintain standard productivity without needing to wait forcompaction.

15
Using a rotary speed mixer to process soil, modifier, and water achieves a high quality,homogeneous mixture. This is especially important for CCFA treated soils, which depend on agood distribution of CCFA particles throughout the soil matrix to achieve adequate cementation.
IV.2.2 Moisture Content
Each material used to treat the subgrade depends on water to initiate a chemical reaction thatimproves the stability of the treated soil. The CaO present in lime-products reacts with water toform Ca(OH)2. The Ca(OH)2 creates free cations which fuels the cation exchange necessary forthe immediate flocculation and agglomeration of clay particles within the soil matrix. TheCa(OH)2 also combines with clay silicas and aluminas to fuel a pozzolanic reaction whichcements soil particles (TRB, 1987). The higher percentage of CaO present in the BHLincreases the amount of water needed to completely hydrate the material. CCFA is a self-cementing material, which means it does not depend on a reaction with any particularconstituent of the soil. The immediate strength gain in fly ash can be attributed to the reactionof tricalcuim aluminate (Ferguson 1985) and the portion of CaO existing as tricalcium silicates(McManis, 1988), similar to portland cement. If there is an insufficient amount of water availableto completely hydrate the CCFA, cementation may not be complete enough to provide thedesired results.
Because of the importance of having a sufficient amount of water available to completelyhydrate the treated materials, field moisture contents were obtained before, during, and aftertreatment. These moisture contents were compared to the effective moisture content rangedetermined during the mix design process. Samples of soil were obtained at depths between75 and 150 mm and were transported to the lab in sealed plastic bags. Tables 6 and 7summarize BHL and CCFA moisture content data. The effective moisture ranges shown in thetables are based on mix design data. All moisture contents shown in this report weredetermined in the laboratory according to AASHTO T 265. Moisture content data was obtainedfrom LKD treated soils 4 to 7 days after compaction. These LKD moisture contents wereapproximately equal to the BHL moisture contents obtained at the same time.
Table 6. Summary of BHL Moisture Data
Project 1- Clay Project 2 - SiltMoisture Content Moisture Content
Effective Moisture Range 24 – 27 % Not DeterminedUntreated 20.2 % 24.1 %
After Processing 25.2 % 18.9 %After Compaction – Same Day No Sample 16.9 %4 – 7 Days After Compaction 23.0 % 23.7a %
a There was 18 mm of precipitation ± 3 days prior to sampling.

16
The data in Table 6 indicates the BHL was generally within the effective moisture content rangeafter processing. The effective moisture content range for Project 2, although not determined ina laboratory, probably consisted of lower moisture contents based on previous experience withsilty soils. After compaction, moisture contents were below the effective moisture content rangefor the clay soil on Project 1, indicating hydration was probably still occurring after compaction.On Project 2, precipitation elevated the post compaction moisture content, but the moisturecontent immediately after compaction shows a moisture content that is probably below theeffective range. Additional water should probably have been added on Project 2 duringprocessing.
Table 7. Summary of CCFA Moisture Data
Project 1 - Clay Project 2 - Silt Project 3 - SandMoisture Content Moisture Content Moisture Content
Effective Moisture Range 20 – 24 % 18 – 24 %a 9.2 – 10.2 %Untreated 22.9 %b 24.1 % 10.7 %b
After Processing No Sample 20.5 %c 7.2 %After Compaction – Next Day No Sample 12.3 % 7.4 %4 – 7 Days After Compaction 20.0 % 21.1 %d No Sample
a Based on mix design for a soil similar to that treated.b Does not include water added to the subgrade before spreading CCFA.c Moisture content after stage 1 processing. No sample was obtained after stage 2 processing.d There was 18 mm of precipitation approximately 3 days prior to sampling.
The data in Table 7 indicates that the addition of CCFA at the required treatment ratessignificantly reduces the water available for hydration. Actual reductions ranged from 3.5% onProject 3 to 11.8% on Project 2. The theoretical amount of reduction was determined usingsimplified weight-volume relationships. The untreated weight of water and solids at standarddry density and optimum moisture content were held constant. The weight of CCFA was addedto the weight of solids and the moisture content was recalculated. The resulting predictedreduction in moisture contents ranged from 1.5% to 2.6%, much less than what actuallyoccurred. The actual average moisture reduction was 3.2 times the predicted reduction. Thefollowing equation has been developed to estimate the actual moisture reduction on a givenproject. Because the equation is based on only three projects with significant data scatter,moisture loss error limits of about 2% should be applied to the results.
Moisture Loss, % = 3.2 x {OMC – [100Ww / (Ws + WCCFA)]}
Where: OMC = Optimum moisture content of the untreated soil in percent.Ww = OMC/100 multiplied by the standard dry density in kg/m³ (pcf)Ws = Standard dry density in kg/m³ (pcf) / 1 m³ (1 ft³)WCCFA = Treatment rate per m³ in kilograms (rate per ft³ in pounds)
The equation may be used as a guideline to determine how much additional water, if any, isrequired to keep the CCFA-soil mixture within its effective range. Low moisture contents onProject 3 may have contributed to the poor performance discussed in Section IV.2.6.
Nuclear density gages were also used to determine moisture contents. Samples of soil werealways obtained at nuclear test locations for laboratory moisture determination. The moisture

17
contents from nuclear testing were an average of 3.7% lower than the laboratory moisturecontents, which are shown in this report. Therefore, laboratory moisture content determinationsshould always be made to identify the appropriate correction factor to apply to the nuclearmoisture content data.
IV.2.3 Density
Compacted moisture content and density were determined using either a Troxler Model 3401 or3440 nuclear gage capable of 300 mm direct transmission. The tests were performed accordingto AASHTO T 310. Samples of soil were taken from a depth of 75 to 150 mm at each testlocation for laboratory moisture determination according to AASHTO T 265. The laboratorymoisture tests were used to check moisture contents and correct the density obtained using thenuclear gage, if necessary.
The compacted density of the treated subgrade is not generally a good indicator of subgradestability. Density requirements may be met, but stability may still be poor. For example, Project3 densities were generally greater than 98% of standard dry density, but stability was notsatisfactory as discussed in Section IV.2.6. The compaction methods employed by thecontractor generally achieved a minimum density of 95% of the standard dry density of thetreated soil, as required by IDOT Standard Specifications, with one area on Project 3 achieving93% compaction. The area corresponded to the area of lowest moisture content.
IV.2.4 Bearing Values
The dynamic cone penetrometer (DCP) was used to determine the IBV of the treated anduntreated soils. The number of blows required to advance the DCP cone in increments of150 mm was recorded. The DCP test was not conducted on frozen soils. The IBV wasdetermined based on the South African correlation between field CBR and DCP penetration rate(Mauer and deBeer, 1988). For field subgrade evaluation purposes, IBV is assumed to beequivalent to the field CBR.
The IBV was generally obtained to a depth of 450 mm. Data corresponding to the top 300 mmare included in this report. DCP tests were generally obtained at 50 meter intervals along eachcontrol and test section. On Project 1, DCP tests were typically located on the centerline of thenorthbound or southbound lanes. On Projects 2 and 3, a DCP test was conducted in theapproximate center of both the driving and passing lane. Additional tests were conducted asneeded to more accurately characterize the subgrade performance. IDOT subgrade stabilitypolicy requires a minimum IBV of 8 prior to placing subsequent pavement layers.
Average IBV data for each section within each project is summarized in Figures 4 through 13.The graphs plot average IBV and the coefficient of variation (COV) versus the number of daysafter compaction. IBV and COV data from the top 150 mm and the bottom 150 mm of thetreated subgrade have been separated. The COV is a measure of the variability of the datarelative to the average value. The average COV of the overall DCP results is 0.47. COVsgreater than 0.47 indicate above average variability, and COVs less than 0.47 indicate belowaverage variability. Appendix D includes the results of individual DCP tests.

18
Figures 4 –7 show Project 1 IBV and COV results.
515
2535
4555
0 10 20 30 40 50 60 70 80
Days After Compaction
LKD BHL CCFA
Figure 4. Project 1 Average IBV vs. DaysAfter Compaction: 0 to 150mm.
5
10
15
20
0 10 20 30 40 50 60 70 80
Days After Compaction
LKD BHL CCFA
Figure 5. Project 1 Average IBV vs. DaysAfter Compaction: 150 to 300 mm.
0.2
0.3
0.4
0.5
0.6
0 10 20 30 40 50 60 70 80
Days After Compaction
LKD BHL CCFA
Figure 6. Project 1 COV vs. Days AfterCompaction: 0 to 150 mm.
0.2
0.3
0.4
0.5
0.6
0 10 20 30 40 50 60 70 80
Days After Compaction
LKD BHL CCFA
Figure 7. Project 1 COV vs. Days AfterCompaction: 150 to 300 mm.
Figure 4 shows that the top 150 mm of treated subgrade meets requirements after one day forall materials. However, Figure 5 shows the IBV of the bottom 150 mm of treated subgradeactually declines or stays the same after treatment. For the bottom 150 mm, the IBV of the LKDtreated soils shows no improvement for four days, while the IBV of BHL and CCFA treated soilsrequire approximately six days to regain their untreated IBV. Figures 4 and 5 also show thatIBV increases in the first 10-30 days after compaction before leveling off. CCFA treated soilsappear to reach peak IBV sooner than LKD and BHL treated soils. Over time, however, IBVs ofeach section tended to decline. The last test series, approximately 77 days after compaction,indicates LKD, BHL, and CCFA treated soils exhibit nearly the same IBV. Overall, the IBV dataindicates that BHL and CCFA treated soils demonstrate performance comparable to that of LKDtreated soils.
The COV data shown in Figures 6 and 7 indicates that all materials produce roughly equivalentvariability. The COV for the top 150 mm shown in Figure 6 shows lower variability betweenproducts relative to the COV data for the bottom 150 mm shown in Figure 7.
19
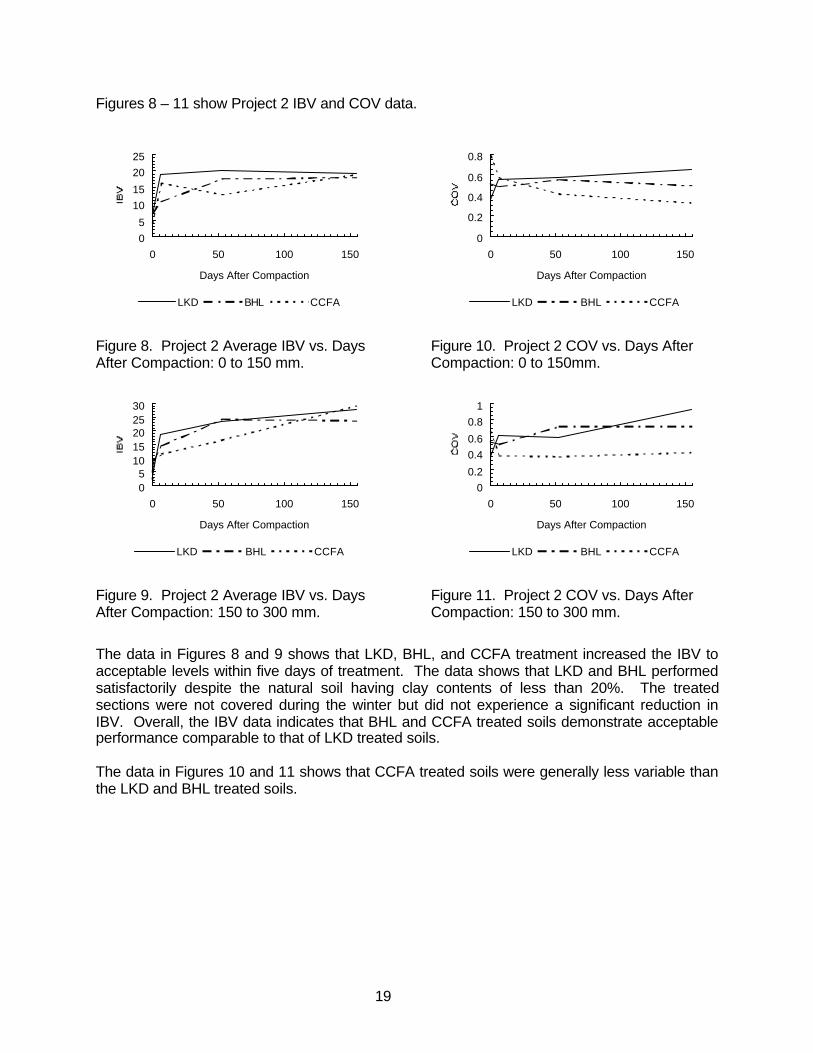
Figures 8 – 11 show Project 2 IBV and COV data.
05
1015
2025
0 50 100 150
Days After Compaction
LKD BHL CCFA
Figure 8. Project 2 Average IBV vs. DaysAfter Compaction: 0 to 150 mm.
05
1015202530
0 50 100 150
Days After Compaction
LKD BHL CCFA
Figure 9. Project 2 Average IBV vs. DaysAfter Compaction: 150 to 300 mm.
0
0.2
0.4
0.6
0.8
0 50 100 150
Days After Compaction
LKD BHL CCFA
Figure 10. Project 2 COV vs. Days AfterCompaction: 0 to 150mm.
00.2
0.40.6
0.81
0 50 100 150
Days After Compaction
LKD BHL CCFA
Figure 11. Project 2 COV vs. Days AfterCompaction: 150 to 300 mm.
The data in Figures 8 and 9 shows that LKD, BHL, and CCFA treatment increased the IBV toacceptable levels within five days of treatment. The data shows that LKD and BHL performedsatisfactorily despite the natural soil having clay contents of less than 20%. The treatedsections were not covered during the winter but did not experience a significant reduction inIBV. Overall, the IBV data indicates that BHL and CCFA treated soils demonstrate acceptableperformance comparable to that of LKD treated soils.
The data in Figures 10 and 11 shows that CCFA treated soils were generally less variable thanthe LKD and BHL treated soils.

20
Figures 12 and 13 show Project 3 IBV and COV data.
05
10152025
0 4 8 12 16 20
Days After Compaction
IBV
Top 150 mm 150-300 mm
Figure 12. Project 3 Average IBV vs. DaysAfter Compaction for CCFA TreatedSubgrade.
0
0.2
0.4
0.6
0.8
1
0 4 8 12 16 20
Days After Compaction
CO
V
Top 150 mm 150-300 mm
Figure 13. Project 3 COV vs. Days AfterCompaction for CCFA Treated Subgrade.
The data in Figure 12 seems to indicate that CCFA treatment achieved satisfactory IBVs afterabout four days. However when the data from Figure 13 is examined, the COV for the top 150mm of treated subgrade is the highest of any section within this study. Figure 14 shows an IBVprofile that separates the IBV data into single data points to clarify variability.
101+850 101+900 101+950 102+000 102+050048
121620242832364044
3.5 m South Centerline 3.5 m North
Figure 14. Project 3 IBV of the Top 150 mm of Treated Soil after 7 Days
The data in Figure 14 shows that CCFA treated soils beneath the proposed passing lane did notattain satisfactory IBVs. The combination of exceptionally good and exceptionally poorperformance causes the misleading representation of results shown in Figure 12. The cause ofthe poor CCFA performance and the required remedial action is discussed in Section IV.2.6.

21
IV.2.5 Visual Observations and Rutting
Project 1
No direct observations of rutting were made for Project 1 as part of this study. However, IDOTDistrict 6 Resident Engineer, Mark Riegel, indicated that subgrade problems were notencountered during construction of the full-depth bituminous pavement.
Project 2
Rutting observations on Project 2 were made on May 13, 1998. Rutting of the BHL and LKDsections was observed using a loaded tractor-trailer truck weighing 323.5 kN. The truck turned,backed, and moved forward to simulate movements expected during paving. The truck alsomade four straight passes in the same wheel-path. The resulting rut depths ranged from 0 to25 mm.
Rutting of the CCFA section was observed using a loaded tandem axle truck weighingapproximately 240 kN. The truck was unable to simulate paving movements because thecontractor placed ditch debris down the center of the CCFA section. The truck made 10 straightpasses in the same wheel path. Generally rut depths ranged from 0 to 75 mm with isolatedlocations with up to 150 mm ruts. Appendix C includes selected photographs of rutting onProject 2.
The apparent excessive rut depths probably resulted from leaving the treated subgradeunprotected during the winter. Frost action resulted in a density reduction of the top 25 to50 mm of subgrade. The isolated deep ruts on the CCFA section may have also beeninfluenced by the presence of wet ditch debris. A bulldozer was pushing the debris around onthe CCFA section prior to testing, disturbing the surface of the treated subgrade.
Overall, the performance of treated soils under load confirmed the DCP data which indicatedthat satisfactory IBVs had been maintained below the material affected by frost action. Therutting that did occur was probably a result of frost action and the presence of wet ditch material.It is not a reflection of poor performance.
Project 3
Seven days after compaction, visual observations of the condition of the CCFA treatedsubgrade indicated variable performance over the length of the section. Some areas performedextremely well. These areas were visibly cemented. Other areas did not show visibleimprovement. These areas were characterized by loose sand, no apparent cementation, andisolated areas with no visible fly ash.
Rutting of the treated subgrade was observed seven days after compaction using a loadedtandem axle truck weighing approximately 230 kN. The truck turned, backed, and movedforward to simulate movements expected during paving. Rut depths ranged between 0 and75 mm. The rut depth data, along with the DCP data summarized in Section IV.2.4, indicateshigh variability. Appendix C includes selected photographs of rutting on Project 3. Figure 15combines the IBV data and rutting observations showing the areas not meeting minimumstability requirements over the 12 m wide and 300 m long CCFA test section.

22
101+850 101+900 101+950 102+000 102+050101+800 102+100
Unsatisfactory Stability Based on IBV
Unsatisfactory Stability Based on Rutting Observations
Unsatisfactory Stability Based on both IBV and Rutting
Figure 15. Areas Showing Unsatisfactory Stability on Project 3.
The subgrade rutting data shown in Figure 15 verifies the unsatisfactory DCP results along thecenterline. The data also verifies the acceptable DCP results at locations offset 3.5 m fromcenterline. The data shows areas that obtained acceptable DCP IBVs did not necessarilyperform well under load. The inability of a practical DCP test program to identify allunsatisfactory locations within an area subject to variable performance may have contributed tothis inconsistency.
IV.2.6 Project 3 Remedial Action and Analysis of Unsatisfactory Performance
The CCFA treated sand on Project 3 did not uniformly meet minimum IBV and ruttingrequirements as discussed in Sections IV.2.4 and IV.2.5. The areas which performed welldemonstrated that CCFA can be used successfully to modify a sand. However, the overallunsatisfactory performance of this section required remedial action to improve IBVs tosatisfactory levels.
The top 150 mm of CCFA treated subgrade was removed over the full width and length of theexperimental section. The CCFA treated subgrade was replaced with 150 mm of dense gradedaggregate. The bottom 150 mm of CCFA treated subgrade was left in place.
An unpublished report (Heckel, 1998) examines the field data and construction procedures forProject 3 in detail. The report includes a determination of the approximate CCFA content of thetreated sand. The difference between the gradation of the sand and fly ash made it possible todetermine the approximate amounts of fly ash added. The untreated soil was well gradedmedium to fine sand with an average of 1.9 % material finer than 0.075 mm. The COV of theuntreated sand finer than 0.075 mm data was 0.37, indicating good uniformity. The fly ashcontained an average of 91% material finer than 0.075 mm.
The estimated fly ash contents were calculated by subtracting the average untreated percentfiner than 0.075 mm from the total percent finer than 0.075 mm. Since fly ash is finer than 0.075mm, the additional fines should correspond to the approximate amount of fly ash added.Locations that performed well contained 12 to 14 percent CCFA. Locations that performedpoorly contained 6 to 8 percent CCFA.
The report finds that the most likely primary cause of the test section’s poor performance wasnon-uniform distribution of CCFA. Due to the large amount of CCFA being spread, a visualevaluation of uniformity is difficult. A non-visual method of checking uniformity would be more

23
appropriate. For example, a lath could be used as a probe to randomly check the depth ofdistributed CCFA. Low moisture content and variable density may have had a minor role incausing the poor performance. The method of estimating moisture loss described in SectionIV.2.2 should be used to ensure that an adequate quantity of water is available for hydration.
IV.3 Pavement Performance
The performance of the finished pavement was monitored for approximately three years. Themonitoring focused on determining if the alternative materials had an adverse effect onpavement performance. Annual pavement distress surveys were performed on each project.The final surveys were conducted in October 2000. The only distress identified was in the BHLsection of Project 1. At Station 209+30 NB, an area approximately 4 meters long and 1.5meters wide was milled shortly after paving to remove an uneven section of pavement. Thedefect was not attributed to the BHL treatment. There was no difference in ride quality betweenthe control and test sections.
The falling weight deflectometer (FWD) was used on Projects 1 and 3 to identify the modulus ofsubgrade reaction (ERI). The testing was performed by the Bureau of Materials and PhysicalResearch using a Dynatest 8000 FWD. The ERI was calculated using the University of Illinoisprocedure. Deflections were normalized to a 40 kN load. Tests were conducted atapproximately 15 – 20 meter intervals in both the control and experimental sections. The FWDwas not used on Project 2 because 300 mm of dense graded aggregate was placed on top ofthe modified soil prior to constructing the jointed concrete pavement. The resulting depth tosubgrade would have made characterization with the FWD uncertain. Figures 16 and 17summarize the FWD data.
6575
8595
105
50 300 550 800
Days After Paving
BHL NB LKD
CCFA SB LKD
Figure 16. Project 1 ERI vs. Number ofDays after Paving.
75
85
95
0 250 500 750
Days After Paving
Control CCFA
Figure 17. Project 3 ERI vs. Number ofDays after Paving.
The data in Figures 16 and 17 show that the BHL, CCFA, and control sections performedsimilarly. Based on available empirical correlations, an ERI of 60 MPa is equivalent to an IBV ofabout six. The first data point shown on Figure 17 was obtained during the summer. The highpavement temperature (45°C) of the full depth bituminous pavement had a significant effect onthe normalized deflections used to calculate ERI. All other test data was obtained in the fall orspring months with the highest pavement temperature being 22°C. Appendix E includes acomplete FWD data summary.
The distress surveys and FWD data indicate that the use of BHL and CCFA did not compromisepavement performance.

24
RECOMMENDATIONS
The field and laboratory testing results indicate that BHL and CCFA are acceptable alternativesto LKD for subgrade modification. BHL and CCFA increase subgrade IBV and decrease ruttingduring construction. Pavements with subgrades modified with LKD, BHL, and CCFA showed nomeasurable difference in performance over the three year monitoring period.
Although it performs well with clayey soils, CCFA modification is more appropriate for soil types,such as silt and sand, that do not respond to lime treatment. CCFA modification wouldgenerally be less expensive than removing and replacing these soils with dense gradedaggregate. For clayey soils, the CCFA treatment rate will be approximately two to three timesthe corresponding LKD treatment rate. In these situations, the material and transportation costdifferences between CCFA and LKD (or BHL) are likely to significantly influence the productselection.
Because of its coarse particle size, BHL requires a significant amount of water to completelyhydrate. Ideally, BHL should be used where the existing subgrade is extremely wet to minimizethe amount of water the contractor is required to add.
The high treatment rates required for successful CCFA modification make it difficult to visuallyassess the uniformity of CCFA application. A probe should be used to randomly measure thedepth of CCFA during spreading. This is especially important for granular soils which dependsolely on the cementitious properties of the CCFA. The performance of CCFA treated granularsoils is also dependent on the availability of a sufficient amount of water to complete hydration.The empirical formula shown in Section IV.2.2 may be used to estimate the amount of moisturereduction resulting from the addition of CCFA.
BHL modification mix designs may be performed according to existing IDOT LKD modificationmix design procedures. The use of BHL requires a new material specification and minorrevisions to IDOT’s existing Standard Specification for Lime Modified Soils. New mix designprocedures and construction specifications have been developed for Fly Ash Modified Soils.
CCFA experimental sections used fly ash that met AASHTO M 295 requirements for use inconcrete. Certain chemical and physical requirements for fly ash when used in concrete maynot apply when it is used as a soil modifier. For example, available alkalies, strength activityindex, and soundness may have no bearing on the performance of fly ash modified soil.Additionally, the maximum limits for loss-on-ignition (LOI), MgO, and material retained on the0.045 mm sieve may be too restrictive. The use of Class C fly ash that does not meet theseAASHTO requirements could potentially reduce material costs and increase the number of flyash sources available. Additional lab testing or field trials should be conducted to characterizethe effects, if any, of modifying soil with Class C fly ash that does not meet AASHTO M 295 LOI,MgO, or fineness requirements.
Recommended mix design procedures, material specifications, and construction specificationsare included in Appendix F.

25
REFERENCES
Furguson, G. (1985). “Fly Ash Stabilization of Soils.” Proceedings of the Seventh InternationalAsh Utilization Symposium and Exposition – Volume 2. Orlando, FL. pp. 560-574.
Furguson, G. and Zey, J.J. (1990). “Stabilization of Pavement Subgrade with Class C Fly Ash.”Proceedings of the Ninth International Coal Ash Utilization Symposium. Orlando, FL.pp. 42-1 to 42-14.
Glogowski, P.E., Kelly, J. M., McLaren, R.J. and Burns, D.L. (1992). Fly Ash Design Manual forRoad and Site Applications. Volume 1. Electric Power Research Institute. Palo Alto,CA. EPRI Report No. TR-100472.
Heckel, G. (1997). “Alternative Materials for the Modification and Stabilization of UnstableSubgrade Soils.” IDOT Bureau of Materials and Physical Research Report No. 125.Springfield, Illinois.
Heckel, G. (1998). “Alternative Materials for Subgrade Modification – Field Report.”Unpublished Report. IDOT Bureau of Materials and Physical Research. Springfield ,Illinois.
IDOT (1982). Subgrade Stability Manual. IDOT Bureau of Materials and Physical Research.Springfield, Illinois.
IDOT (1999). Geotechnical Manual. IDOT Bureau of Materials and Physical Research.Springfield, Illinois.
Mauer, M.C., and de Beer, M. (1988). “Computer Programs to Plot DCP Data – User’s Manual.”Division of Roads and Transport Technology, Pretoria, South Africa.
McManis, K.L. (1988). “Laboratory Evaluation of Fly Ash Treated Embankment and BaseMaterials.” FHWA/LA-87/204. Louisiana Transportation Research Center, BatonRouge.
Transportation Research Board (1987). “Lime Stabilization.” State of the Art Report 5.Washington D.C.

A-1
Appendix A
Project Location and Section Layout Information

A-2
GENERAL PROJECT LOCATIONS
Project 1Project 2
Project 3

A-3
TEST SECTION LAYOUTS
Not to Scale.
North Bound
South Bound
Median
LKDTCFA
LKD
HLB
Project 1
Mor
ton
Ave
nue
Inte
rcha
nge
Ram
p"A
" T
aper
Beg
ins
at S
TA
24+
500
HLB LKD TCFA
ST
A 2
4+52
5
ST
A 2
4+74
0
ST
A 2
4+94
0
ST
A 2
5+15
0
12 m
Not to Scale
N
South Bound Lanes
Project 2
ControlTCFA
NN.T.S.
West Bound Lanes
Project 3
CCFABHL
CCFA
CCFA
BHL
Westbound Lanes
Southbound Lanes

B-1
Appendix B
Mix Design Information

B-2
Project 1 Mix Design
Moisture-Density-IBV Relationships and IBR Data
1600161016201630164016501660167016801690170017101720
17 18 19 20 21 22 23
Moisture Content, %
Dry
Den
sity
, ρd,
kg/
m³
0
5
10
15
20
25
Imm
edia
te B
earin
g V
alue
, IB
V, %
Dry Density IBV
SDD = 1711 kg/m³ (106.8 pcf) @ 20.9% OMC
Untreated Clay
1500
1510
1520
1530
1540
1550
1560
1570
1580
1590
1600
18 20 22 24 26 28
Moisture Content, %
Dry
Den
sity
, ρd,
kg/
m³
0
5
10
15
20
25
30
35
Imm
edia
te B
earin
g V
alue
, IB
V, %
Dry Density IBV
SDD = 1568 kg/m³ (97.9 pcf) @ 24.0% OMC
Clay Treated with 3% BHL
1550
1560
1570
1580
1590
1600
1610
1620
1630
1640
13 15 17 19 21 23 25
Moisture Content, %
Dry
Den
sity
, ρd,
kg/m
³
0
5
10
15
20
25
30
35
40
Imm
edia
te B
earin
g V
alue
, IB
V, %
Dry Density IBV
SDD = 1626 kg/m³ (101.5 pcf)@ 20.7% OMC
Clay Treated with 10% CCFA
1560
1570
1580
1590
1600
1610
1620
1630
1640
15 17 19 21 23 25
Moisture Content, %
Dry
Den
sity
, ρd,
kg/
m³
0
5
10
15
20
25
30
35
40
Imm
edia
te B
earin
g V
alue
, IB
V, %
Dry Density IBV
SDD = 1629 kg/m³ (101.7 pcf) @ 21.5% OMC
Clay treated with 15% CCFA
Illinois Bearing Ratio Test ResultsIBR, % Swell, % Molded Dry
Density,kg/m³
MoldedMC, %
Change inDry Density,
kg/m³
Changein MC, %
Untreated 2.3 2.6 1689 21.2 -40 +2.13% BHL 16.1 1.3 1586 22.8 -21 +2.5
10%CCFA
8.3 3.7 1616 21.0 -64 +4.9

B-3
Project 2 Mix Design
A complete CCFA mix design was performed in June 1997. Prior to construction, the testsection was moved to another location on the same project. A new complete mix design wasnot performed, but a new moisture-density-IBV relationship was developed for the newconditions. No mix design was performed for BHL treated soils. The original mix design data isincluded below along with the moisture-density-IBV relationship representing actual fieldconditions.
OriginalLocation
FinalLocation
TexturalClass.
SiCL Silt
AASHTOClassification
A-6(11) A-4
LL 38.2 27.6PI 17.4 4.9
Sand, % 0.5 1.5Silt, % 77.2 87.8Clay, % 22.2 10.8
-75 µm, % 99.5 -SpG 2.707 -
Untreated Soil Classification Data
1580
15901600
16101620
1630
16401650
16601670
1680
6 8 10 12 14 16 18
Moisture Content, %
Dry
Den
sity
, ρd,
kg/
m³
0
5
10
15
20
25
Imm
edia
te B
earin
g V
alue
, IB
V,
%
Dry Density IBV
SDD = 1669 kg/m³ (104.2 pcf) @ 13.2% OMC
Original Location Untreated SiCL
1750176017701780179018001810182018301840185018601870
5 6 7 8 9 10 11 12 13 14
Moisture Content, %
Dry
Den
sity
, ρd,
kg/
m³
0
5
10
15
20
25
Imm
edia
te B
earin
g V
alue
, IB
V,
%
Dry Density IBV
SDD = 1850 kg/m³ (115.5 pcf)@ 9.7% OMC
Original Location SiCL Treatedwith 10% CCFA
1750
17651780
17951810
1825
18401855
18701885
1900
4 5 6 7 8 9 1011 1213 14
Moisture Content, %
Dry
Den
sity
, ρd,
kg/
m³
0
5
10
15
20
25
30
Imm
edia
te B
earin
g V
alue
, IB
V,
%
Dry Density IBV
SDD = 1886 kg/m³ (117.7 pcf) @ 9.3% OMC
Original Location SiCL Treatedwith 15% CCFA

B-4
0
5
10
15
20
25
30
35
40
7 9 11 13 15 17 19 21 23
Moisture Content, %Untreated 10% CCFA15% CCFA
Original Location SiCL IBV Profile
Original Location SiCL Cured IBV at a24% Moisture Content
CuringTime
10% CCFAIBV, %
15% CCFAIBV, %
24 hours 6.0 8.748 hours 7.4 10.6
1500
1550
1600
1650
1700
1750
1800
11 13 15 17 19 21 23
Moisture Content, %
Dry
Den
sity
, kg/
m³
0
10
20
30
40
50
60
70
Imm
edia
te B
earin
g V
alue
, IB
V, %
Dry Density IBV
SDD = 1740 kg/m³ @ 14.0% OMC
Final Location Silt Treated with 15%CCFA
Original Location SiCL Illinois Beaing Ratio Test Results
IBR,%
Swell,%
Molded DryDensity,kg/m³
MoldedMC, %
Change inDry Density,
kg/m³
Changein MC,
%
Untreated 6.9 0.1 1742 16.8 -11 +2.615%
CCFA32.1 0.0 1690 17.9 -3 +2.4
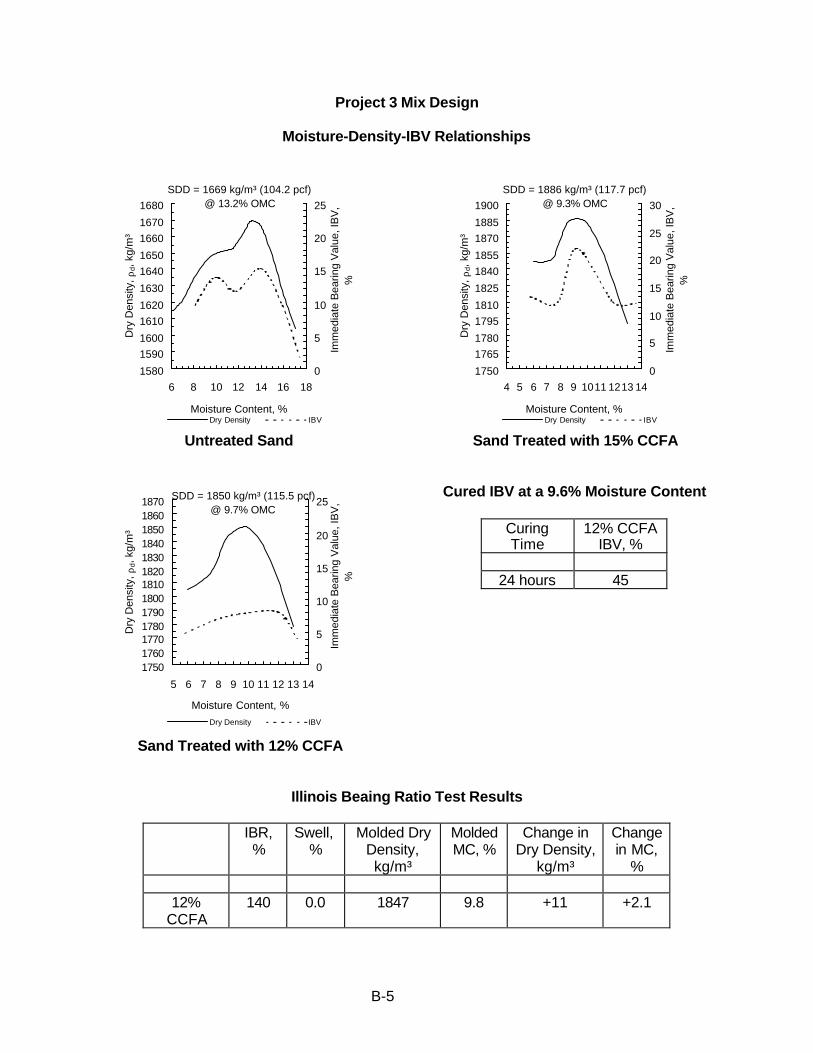
B-5
Project 3 Mix Design
Moisture-Density-IBV Relationships
1580
15901600
16101620
1630
16401650
16601670
1680
6 8 10 12 14 16 18
Moisture Content, %
Dry
Den
sity
, ρd,
kg/
m³
0
5
10
15
20
25
Imm
edia
te B
earin
g V
alue
, IB
V,
%
Dry Density IBV
SDD = 1669 kg/m³ (104.2 pcf) @ 13.2% OMC
Untreated Sand
1750176017701780179018001810182018301840185018601870
5 6 7 8 9 10 11 12 13 14
Moisture Content, %
Dry
Den
sity
, ρd,
kg/
m³
0
5
10
15
20
25
Imm
edia
te B
earin
g V
alue
, IB
V,
%
Dry Density IBV
SDD = 1850 kg/m³ (115.5 pcf)@ 9.7% OMC
Sand Treated with 12% CCFA
1750
17651780
17951810
1825
18401855
18701885
1900
4 5 6 7 8 9 1011 1213 14
Moisture Content, %
Dry
Den
sity
, ρd,
kg/
m³
0
5
10
15
20
25
30
Imm
edia
te B
earin
g V
alue
, IB
V,
%
Dry Density IBV
SDD = 1886 kg/m³ (117.7 pcf) @ 9.3% OMC
Sand Treated with 15% CCFA
Cured IBV at a 9.6% Moisture Content
CuringTime
12% CCFAIBV, %
24 hours 45
Illinois Beaing Ratio Test Results
IBR,%
Swell,%
Molded DryDensity,kg/m³
MoldedMC, %
Change inDry Density,
kg/m³
Changein MC,
%
12%CCFA
140 0.0 1847 9.8 +11 +2.1

B-6
Compressive Strength Test Results
TREATMENT CURINGqu,kPa εu, %
DryDensity,ρ, kg/m3 MC, %
% ofρdmax
% ofOMC
12% CCFA 24 Hours 448 1.4 1866 9.5 100.1 98.0347 1.0 1836 9.4 99.2 97.0389 1.3 1850 9.6 100.0 99.0402 1.4 1846 9.6 99.8 99.0
12% CCFA 48 Hours 453 1.4 1862 9.3 100.1 95.9412 1.4 1841 9.9 99.5 102.1378 1.3 1836 9.7 99.2 100.0
- - - - - -12% CCFA 7 Days 486 1.2 1855 8.8 100.3 90.7
377 1.4 1825 9.2 98.6 94.8543 1.6 1850 9.9 100.0 102.1423 1.7 1860 9.6 100.5 99.0
15% CCFA 24 Hours 661 1.1 1902 9.3 100.8 100.0435 1.1 1842 9.3 97.7 100.0599 0.9 1894 9.4 100.4 101.1504 1.3 1862 9.0 98.7 96.8
15% CCFA 48 Hours 615 1.5 1878 9.2 99.6 98.9673 1.5 1895 9.3 100.5 100.0552 2.0 1882 8.9 99.8 95.7505 1.1 1846 9.1 97.9 97.8
15% CCFA 7 Days 618 1.5 1865 8.5 98.9 91.4599 1.5 1873 8.5 99.3 91.4813 1.9 1913 8.1 101.4 87.1755 1.8 1903 8.1 100.9 87.1

C-1
Appendix C
Selected Photographs
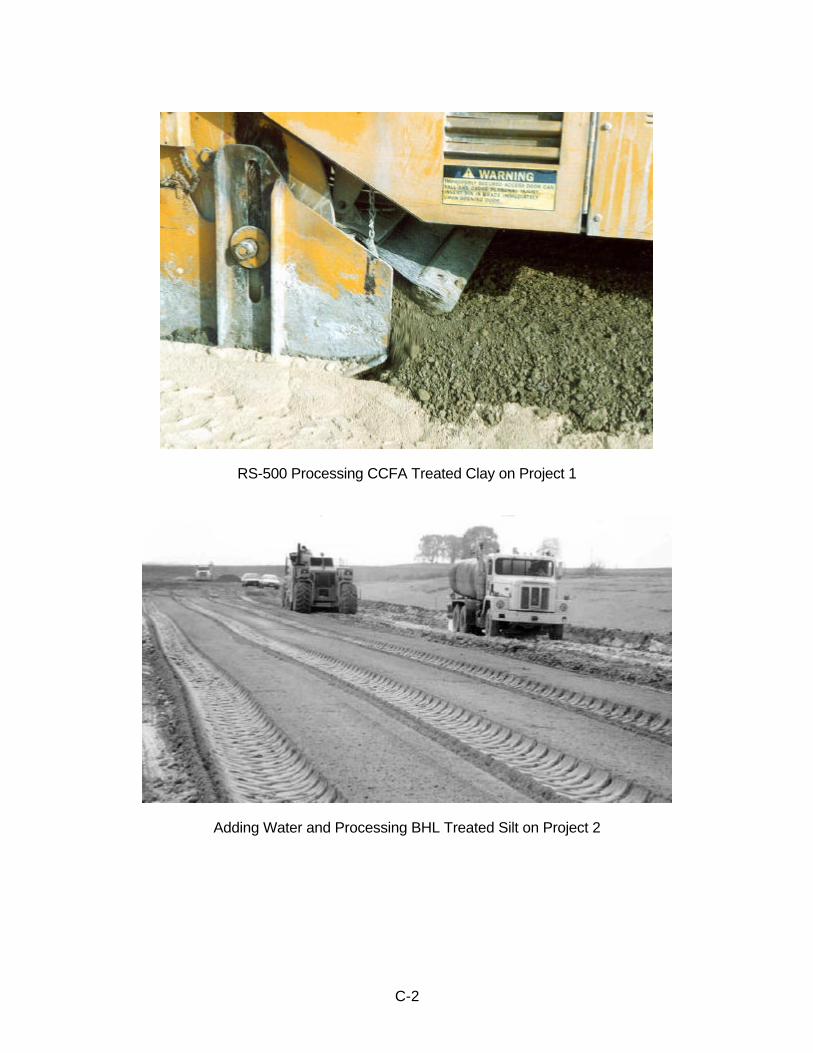
C-2
RS-500 Processing CCFA Treated Clay on Project 1
Adding Water and Processing BHL Treated Silt on Project 2

C-3
Spreading of Stage I CCFA on Project 2
Subgrade Rutting While Spreading Stage I CCFA on Project 2

C-4
Spreading, Processing, and Compacting Stage II CCFA on Project 2
Tandem Axle Truck Loading CCFA Treated Soil on Project 2

C-5
Tractor-Trailer Truck Loading LKD Section on Project 2
Spreader Truck Stuck While Spreading CCFA on Project 3

C-6
Processing and Compacting CCFA Treated Sand on Project 3
Tandem Axle Truck Loading CCFA Treated Subgrade with Resulting Ruts on Project 3

D-1
Appendix D
Individual DCP Test Data

D-2
Project 1 DCP Test Summary
Control Section
StationApproximateTest Location
Test Date DescriptionIBV
0-150 mmIBV
150-300 mm
203+00 SB CL 6-2-97 Untreated 20 19205+00 SB CL 6-2-97 Untreated 11 12205+00 SB 3 m LT 6-2-97 Untreated 9 9207+00 SB CL 6-2-97 Untreated 12 10207+00 SB 3 m RT 6-2-97 Untreated 8 6209+00 SB CL 6-2-97 Untreated 8 10209+00 SB 3 m RT 6-2-97 Untreated 7 10207+00 SB CL 6-6-97 4 Days A.C. 14 8213+00 NB CL 6-5-97 4 Days A.C. 35 15215+00 NB CL 6-6-97 4 Days A.C. 23 7217+00 NB CL 6-6-97 4 Days A.C. 13 10219+00 NB CL 6-6-97 4 Days A.C. 23 14203+00 SB CL 7-8-97 33 Days A.C. 38 23207+00 SB CL 7-8-97 33 Days A.C. 65 13203+00 SB CL 8-20-97 77 Days A.C. 17 10205+00 SB CL 8-20-97 77 Days A.C. 22 15207+00 SB CL 8-20-97 77 Days A.C. 15 10
SB = Southbound Lanes NB = Northbound Lanes CL = Centerline A.C. = After Compaction
BHL Section
StationApproximateTest Location Test Date Description
IBV0-150 mm
IBV150-300 mm
203+00 NB CL 6-2-97 Untreated 5 6205+00 NB CL 6-2-97 Untreated 9 14207+00 NB CL 6-2-97 Untreated 14 9209+00 NB CL 6-2-97 Untreated 11 7203+00 NB CL 6-6-97 1 Day A.C. 8 5203+00 NB 3 m LT 6-6-97 1 Day A.C. 8 5205+00 NB CL 6-6-97 1 Day A.C. 11 8207+00 NB CL 6-6-97 1 Day A.C. 8 6209+00 NB CL 6-6-97 1 Day A.C. 10 5203+00 NB CL 6-12-97 7 Days A.C. 13 7205+00 NB CL 6-12-97 7 Days A.C. 28 14207+00 NB CL 6-12-97 7 Days A.C. 17 7209+00 NB CL 6-12-97 7 Days A.C. 22 13203+00 NB CL 7-8-97 33 Days A.C. 36 15207+00 NB 3 m RT 7-8-97 33 Days A.C. 9 9207+00 NB 3 m LT 7-8-97 33 Days A.C. 36 15209+00 NB CL 7-8-97 33 Days A.C. 23 13203+00 NB CL 8-20-97 77 Days A.C. 32 17205+00 NB CL 8-20-97 77 Days A.C. 12 12207+00 NB CL 8-20-97 77 Days A.C. 26 8209+00 NB CL 8-20-97 77 Days A.C. 22 5

D-3
Project 1 DCP Test Summary (cont.)
CCFA Section
StationApproximateTest Location
Test Date DescriptionIBV
0-150 mmIBV
150-300 mm
213+00 SB CL 6-2-97 Untreated 7 11213+00 SB 3 m RT 6-2-97 Untreated 5 8215+00 SB CL 6-2-97 Untreated 9 9215+00 SB 3 m RT 6-2-97 Untreated 10 10217+00 SB CL 6-2-97 Untreated 7 9217+00 SB 3 m RT 6-2-97 Untreated 9 9219+00 SB CL 6-2-97 Untreated 9 10219+00 SB 3 m LT 6-2-97 Untreated 8 13213+00 SB CL 6-4-97 A.C. 9 3213+00 SB 3 m LT 6-4-97 A.C. 16 7217+00 SB CL 6-4-97 A.C. 8 6217+00 SB 3 m RT 6-4-97 A.C. 7 4219+00 SB CL 6-4-97 A.C. 22 6213+00 SB CL 6-5-97 1 Day A.C. 10 5213+00 SB 3 m LT 6-5-97 1 Day A.C. 17 10215+00 SB CL 6-5-97 1 Day A.C. 15 7215+00 SB 3 m RT 6-5-97 1 Day A.C. 8 7217+00 SB CL 6-5-97 1 Day A.C. 16 5217+00 SB 3 m RT 6-5-97 1 Day A.C. 7 5219+00 SB CL 6-5-97 1 Day A.C. 28 12213+00 SB CL 6-6-97 2 Days A.C. 11 6215+00 SB CL 6-6-97 2 Days A.C. 11 10217+00 SB CL 6-6-97 2 Days A.C. 11 7219+00 SB CL 6-6-97 2 Days A.C. 17 10213+00 SB CL 6-12-97 8 Days A.C. 26 13215+00 SB CL 6-12-97 8 Days A.C. 24 6217+00 SB CL 6-12-97 8 Days A.C. 43 19219+00 SB CL 6-12-97 8 Days A.C. 31 19213+00 SB CL 7-8-97 34 Days A.C. 26 17215+00 SB CL 7-8-97 34 Days A.C. 22 12217+00 SB CL 7-8-97 34 Days A.C. 53 6213+00 SB CL 8-20-97 78 Days A.C. 18 15215+00 SB CL 8-20-97 78 Days A.C. 13 8217+00 SB CL 8-20-97 78 Days A.C. 26 10219+00 SB CL 8-20-97 78 Days A.C. 15 8
SB = Southbound Lanes CL = Centerline A.C. = After Compaction

D-4
Project 2 DCP Test Summary
Control Section
Station Test Location Test Date DescriptionIBV
0-150 mmIBV
150-300 mm
24+800 RT 10-23-97 Untreated 4 224+800 LT 10-23-97 Untreated 5 424+850 RT 10-23-97 Untreated 8 224+850 LT 10-23-97 Untreated 5 424+900 RT 10-23-97 Untreated 7 524+900 LT 10-23-97 Untreated 10 424+800 RT 10-30-97 6 Days A.C. 17 2824+800 LT 10-30-97 6 Days A.C. 6 324+850 RT 10-30-97 6 Days A.C. 7 724+850 LT 10-30-97 6 Days A.C. 26 2624+900 RT 10-30-97 6 Days A.C. 28 2924+900 LT 10-30-97 6 Days A.C. 29 1824+800 RT 12-6-97 52 Days A.C. 13 1224+800 LT 12-6-97 52 Days A.C. 11 1024+850 RT 12-6-97 52 Days A.C. 18 3624+850 LT 12-6-97 52 Days A.C. 40 4024+900 RT 12-6-97 52 Days A.C. 18 1924+800 RT 3-27-98 154 Days A.C. 5 324+800 LT 3-27-98 154 Days A.C. 10 1524+850 RT 3-27-98 154 Days A.C. 13 1124+850 LT 3-27-98 154 Days A.C. 33 6524+900 RT 3-27-98 154 Days A.C. 36 5624+900 LT 3-27-98 154 Days A.C. 19 1724+800 RT 5-13-98 201 Days A.C. 18 2624+800 LT 5-13-98 201 Days A.C. 15 1324+850 RT 5-13-98 201 Days A.C. 18 2024+850 LT 5-13-98 201 Days A.C. 29 6524+900 RT 5-13-98 201 Days A.C. 32 2324+900 LT 5-13-98 201 Days A.C. 18 33
RT or LT = 2-3 meters right or left of centerline A.C. = After Compaction

D-5
Project 2 DCP Test Summary (cont.)
BHL Section
Station Test Location Test Date DescriptionIBV
0-150 mmIBV
150-300 mm
24+550 RT 10-23-97 Untreated 2 224+550 LT 10-23-97 Untreated 6 324+650 RT 10-23-97 Untreated 5 424+650 LT 10-23-97 Untreated 10 824+700 RT 10-23-97 Untreated 7 424+700 LT 10-23-97 Untreated 12 824+550 RT 10-24-97 1 Day A.C. 14 624+550 LT 10-24-97 1 Day A.C. 15 524+650 RT 10-24-97 1 Day A.C. 13 1324+650 LT 10-24-97 1 Day A.C. 18 1324+700 RT 10-24-97 1 Day A.C. 16 824+700 LT 10-24-97 1 Day A.C. 21 1124+550 RT 10-30-97 7 Days A.C. 8 924+550 LT 10-30-97 7 Days A.C. 6 924+650 RT 10-30-97 7 Days A.C. 17 2524+650 LT 10-30-97 7 Days A.C. 5 924+700 RT 10-30-97 7 Days A.C. 16 2224+700 LT 10-30-97 7 Days A.C. 11 1324+550 RT 12-6-97 53 Days A.C. 10 824+550 LT 12-6-97 53 Days A.C. 6 724+650 RT 12-6-97 53 Days A.C. 32 4924+650 LT 12-6-97 53 Days A.C. 24 2624+700 RT 12-6-97 53 Days A.C. 20 4024+700 LT 12-6-97 53 Days A.C. 13 1524+550 RT 3-27-98 155 Days A.C. 10 1024+550 LT 3-27-98 155 Days A.C. 8 1024+650 RT 3-27-98 155 Days A.C. 32 5324+650 LT 3-27-98 155 Days A.C. 20 2924+700 RT 3-27-98 155 Days A.C. 15 1124+700 LT 3-27-98 155 Days A.C. 22 2924+550 RT 5-13-98 202 Days A.C. 15 1324+550 LT 5-13-98 202 Days A.C. 13 1324+650 RT 5-13-98 202 Days A.C. 20 2824+650 LT 5-13-98 202 Days A.C. 40 5324+700 RT 5-13-98 202 Days A.C. 18 2624+700 LT 5-13-98 202 Days A.C. 40 44
RT or LT = 2-3 meters right or left of centerline A.C. = After Compaction

D-6
Project 2 DCP Test Summary (cont.)
CCFA Section
Station Test Location Test Date DescriptionIBV
0-150 mmIBV
150-300 mm
25+000 RT 10-23-97 Untreated 1 225+000 LT 10-23-97 Untreated 1 125+025 RT 10-23-97 Untreated 3 225+025 LT 10-23-97 Untreated 7 325+050 RT 10-23-97 Untreated 2 225+050 LT 10-23-97 Untreated 7 325+100 RT 10-23-97 Untreated 3 125+100 LT 10-23-97 Untreated 5 225+125 RT 10-23-97 Untreated 1 125+125 LT 10-23-97 Untreated 10 625+000 RT 10-24-97 18 Hours A.C. 10 525+000 LT 10-24-97 18 Hours A.C. 20 1425+025 RT 10-24-97 18 Hours A.C. 28 1125+025 LT 10-24-97 18 Hours A.C. 15 1125+050 RT 10-24-97 18 Hours A.C. 17 1125+050 LT 10-24-97 18 Hours A.C. 11 725+100 RT 10-24-97 18 Hours A.C. 28 1525+100 CL 10-24-97 18 Hours A.C. 7 425+100 LT 10-24-97 18 Hours A.C. 4 325+125 RT 10-24-97 18 Hours A.C. 19 1225+125 LT 10-24-97 18 Hours A.C. 18 825+000 RT 10-30-97 7 Days A.C. 5 1125+000 LT 10-30-97 7 Days A.C. 24 1725+025 RT 10-30-97 7 Days A.C. 8 1325+025 LT 10-30-97 7 Days A.C. 32 1525+050 RT 10-30-97 7 Days A.C. 11 825+050 LT 10-30-97 7 Days A.C. 24 -25+100 RT 10-30-97 7 Days A.C. 4 425+100 LT 10-30-97 7 Days A.C. 17 1125+125 RT 10-30-97 7 Days A.C. 15 1525+125 LT 10-30-97 7 Days A.C. 21 925+000 RT 12-16-97 53 Days A.C. 6 1225+000 LT 12-16-97 53 Days A.C. 21 2525+025 RT 12-16-97 53 Days A.C. 17 1725+025 LT 12-16-97 53 Days A.C. 7 1425+050 RT 12-16-97 53 Days A.C. 10 1625+050 LT 12-16-97 53 Days A.C. 10 2725+100 RT 12-16-97 53 Days A.C. 11 1125+100 LT 12-16-97 53 Days A.C. 9 925+125 RT 12-16-97 53 Days A.C. 18 1825+125 LT 12-16-97 53 Days A.C. 17 17
RT or LT = 2-3 meters right or left of centerline CL = Centerline A.C. = After Compaction
CCFA Section Continued on Next Page

D-7
Project 2 DCP Test Summary
CCFA Section (cont.)
Station Test Location Test Date DescriptionIBV
0-150 mmIBV
150-300 mm
25+000 RT 3-27-98 155 Days A.C. 17 2425+000 LT 3-27-98 155 Days A.C. 20 4925+025 RT 3-27-98 155 Days A.C. 8 825+025 LT 3-27-98 155 Days A.C. 26 3325+050 RT 3-27-98 155 Days A.C. 20 4225+050 LT 3-27-98 155 Days A.C. 22 3625+100 RT 3-27-98 155 Days A.C. 17 2025+100 LT 3-27-98 155 Days A.C. 20 2225+125 RT 3-27-98 155 Days A.C. 15 2925+125 LT 3-27-98 155 Days A.C. 26 29
25+000 LT 5-13-98202 Days A.C.After Loading 22 28
25+000 RT 5-13-98 202 Days A.C. 33 40
25+025 LT 5-13-98202 Days A.C.After Loading 8 7
25+025 RT 5-13-98 202 Days A.C. 24 33
25+050 LT 5-13-98202 Days A.C.After Loading
13 15
25+050 RT 5-13-98 202 Days A.C. 17 53
25+100 LT 5-13-98202 Days A.C.After Loading 13 7
25+100 RT 5-13-98 202 Days A.C. 22 18RT or LT = 2-3 meters right or left of centerline A.C. = After Compaction

D-8
Project 3 DCP Test Summary
CCFA Section
StationApproximateTest Location Test Date Description
IBV0-150 mm
IBV150-300 mm
101+850 3.5 m LT 4-20-98 Untreated 1 8101+850 3.5 m RT 4-20-98 Untreated 2 7101+900 3.5 m LT 4-20-98 Untreated 2 8101+900 3.5 m RT 4-20-98 Untreated 4 5101+950 3.5 m LT 4-20-98 Untreated 1 8101+950 3.5 m RT 4-20-98 Untreated 1 5102+000 3.5 m LT 4-20-98 Untreated 2 9102+000 3.5 m RT 4-20-98 Untreated 3 8102+050 3.5 m LT 4-20-98 Untreated 2 5102+050 3.5 m RT 4-20-98 Untreated 2 6101+848 CL 4-22-98 18 Hours A.C. 13 24101+850 3.5 m LT 4-22-98 18 Hours A.C. 2 8101+850 3.5 m RT 4-22-98 18 Hours A.C. 3, 5 17, 20101+875 3.5 m LT 4-22-98 18 Hours A.C. 7 11101+875 3.5 m RT 4-22-98 18 Hours A.C. 5 17101+900 3.5 m LT 4-22-98 18 Hours A.C. 4 17101+900 3.5 m RT 4-22-98 18 Hours A.C. 4 17101+950 3.5 m LT 4-22-98 18 Hours A.C. 5 9101+950 3.5 m RT 4-22-98 18 Hours A.C. 5 17102+000 3.5 m LT 4-22-98 18 Hours A.C. 4 10102+000 3.5 m RT 4-22-98 18 Hours A.C. 4 15102+050 3.5 m LT 4-22-98 18 Hours A.C. 4 10102+050 3.5 m RT 4-22-98 18 Hours A.C. 11 10101+850 3.5 m LT 4-28-98 7 Days A.C. 17 18101+850 CL 4-28-98 7 Days A.C. 4 11101+850 3.5 m RT 4-28-98 7 Days A.C. 17 40101+900 3.5 m LT 4-28-98 7 Days A.C. 42 32101+900 CL 4-28-98 7 Days A.C. 3 8101+900 3.5 m RT 4-28-98 7 Days A.C. 20 42101+950 3.5 m LT 4-28-98 7 Days A.C. 29 36101+950 CL 4-28-98 7 Days A.C. 2 10101+950 3.5 m RT 4-28-98 7 Days A.C. 8, 4 28, 15102+000 3.5 m LT 4-28-98 7 Days A.C. 33 26102+000 CL 4-28-98 7 Days A.C. 4, 3 13, 13102+000 3.5 m RT 4-28-98 7 Days A.C. 5 10102+050 3.5 m LT 4-28-98 7 Days A.C. 20 18102+050 CL 4-28-98 7 Days A.C. 26 18102+050 3.5 m RT 4-28-98 7 Days A.C. 8 8101+850 CL 5-11-98 20 Days A.C. 5 20101+900 CL 5-11-98 20 Days A.C. 15 32101+950 CL 5-11-98 20 Days A.C. 5 20102+000 CL 5-11-98 20 Days A.C. 8 26102+000 3.5 m RT 5-11-98 20 Days A.C. 5 15102+050 CL 5-11-98 20 Days A.C. 32 40102+050 3.5 m LT 5-11-98 20 Days A.C. 36 33
CL = Centerline A.C. = After Compaction

E-1
Appendix E
Falling Weight Deflectometer Data

E-2
Project 1 Deflection Statistics
Section Test DatePavementTemp. °C D0*, µm Area, mm ERI, MPa
Average COV Average COV Average COV
BHL 11/20/97 3 86 0.11 724 0.03 103 0.03BHL 4/21/98 6 107 0.09 709 0.02 93 0.05BHL 3/25/99 7 107 0.10 734 0.02 89 0.05BHL 5/11/00 22 160 0.13 688 0.03 71 0.08
NB LKD 11/20/97 3 89 0.12 724 0.04 101 0.06NB LKD 4/21/98 6 102 0.13 709 0.04 96 0.07NB LKD 3/25/99 7 104 0.15 732 0.03 92 0.07NB LKD 5/11/00 22 157 0.13 678 0.04 75 0.07CCFA 11/20/97 3 89 0.07 721 0.02 101 0.04CCFA 4/21/98 6 104 0.08 714 0.01 94 0.05CCFA 3/25/99 7 112 0.06 724 0.02 88 0.05CCFA 5/11/00 22 163 0.06 665 0.02 74 0.06
SB LKD 11/20/97 3 86 0.12 714 0.05 105 0.06SB LKD 4/21/98 6 104 0.08 714 0.02 94 0.04SB LKD 3/25/99 7 112 0.08 734 0.02 86 0.06SB LKD 5/11/00 22 175 0.08 676 0.02 68 0.07
D0* = Deflection below the load plate normalized to a 40 kN load.
Project 3 Deflection Statistics
Section Test DatePavementTemp. °C
D0*, µm Area, mm ERI, MPa
Average COV Average COV Average COV
Control 7/20/98 45 357 0.09 483 0.03 75 0.05Control 4/6/99 11 124 0.11 689 0.03 92 0.04Control 5/10/00 18 130 0.10 663 0.03 87 0.04CCFA 7/20/99 45 323 0.06 483 0.04 75 0.05CCFA 4/6/99 11 120 0.08 698 0.02 92 0.03CCFA 5/10/00 18 120 0.05 682 0.02 88 0.03
D0* = Deflection below the load plate normalized to a 40 kN load.

F-1
Appendix F
Recommended Mix Design Procedures and Specifications

F-2
RECOMMENDED LABORATORY DESIGN PROCEDURESFor
FLY ASH MODIFIED SOILS
Scope These methods describe the preparation and testing of fly ash - soil mixtures for thepurpose of recommending a design fly ash content for construction and also for evaluating theproperties of the mixture.
Apparatus Equipment and materials required to perform Methods A (except for the oven) and Bof the Department’s “Laboratory Design Procedures for Lime Stabilized/Lime Modified Soils”outlined in the Geotechnical Manual. Method A equipment is used to evaluate granular soil – flyash mixtures. Method B equipment is used to evaluate cohesive soil – fly ash mixtures.
Samples Samples of soil and fly ash shall be provided as specified in the Specification for “FlyAsh Modified Soils.”
Method A - Granular Soils
1. Dry Preparation of Soil - The soil, as received, shall be prepared for test according toAASHTO T 87.
2. Compaction - Obtain the standard dry density and optimum moisture content of the natural
soil and soil fly-ash mixtures according to AASHTO T 99, Method C. 3. Soil - Fly Ash Mixtures
Add increments of 5 percent fly ash to the soil on a dry weight basis. The fly ash content
shall not exceed 20% by dry weight. Dry mix enough fly ash and soil for one AASHTO T 99 compaction sample until a
homogeneous mixture is obtained. Gradually add the compaction water. Continuemixing for 2 minutes. Place the resulting mixture in a covered pan. Prepare a new soil -fly ash mixture for each sample.
Compact the soil-fly ash mixture one hour after mixing. Repeat the compaction procedures, for each sample, until the moisture-density relationships
are obtained for a series of at least three fly ash contents.
5. Preparation of Test Specimens – Four test specimens at each trial fly-ash content shall bemolded at OMC and SDD using the mixing procedures described above. Each specimenshall be compacted dynamically, in the 51 mm x 102 mm mold, in three equal layers. Thenumber of blows per layer, with the sliding hammer, shall be adjusted to obtain the SDD. Itis important that each of the first two lifts be scarified to promote bonding. The compactedsample is then trimmed, extracted, weighed, and the mass is recorded.
6. Curing of Specimens – Place the fly-ash treated soil specimens in sealed containers andcure at room temperature for a minimum of 24 hours. A 48 hour curing period may also beused depending on mix design objectives.

F-3
7. Compression Testing – Test each specimen to failure, at a constant rate of 1.27 mm perminute. The compressive strength shall be determined according to AASHTO T 208.Obtain a moisture sample from each failed specimen. The resulting moisture content shallbe used to calculate the actual dry density of each specimen. The moisture content shall bedetermined according to AASHTO T 265.
8. Determine the Design Fly Ash Content – The minimum fly ash content shall be designatedas the fly ash content which provides a minimum compressive strength of 310 kPa or more.Increase the minimum fly ash content by 1 percent to obtain the design fly ash content tooffset blowing, uneven distribution, and other factors.
Method B – Cohesisve Soils
1. Dry Preparation of Soil - The soil, as received, shall be prepared for testing according toAASHTO T 87.
2. Compaction – Obtain the standard dry density and optimum moisture content of the naturalsoil and soil fly-ash mixtures according to AASHTO T 99, Method C.
3. IBV Testing – Immediately after compaction, the IBV test shall be conducted according toGeotechnical Manual Attachment II-A Section 2. After the IBV test, the sample shall beextracted from the mold and a specimen taken for moisture content determination accordingto AASHTO T 99.
4. Soil - Fly Ash Mixtures Add increments of 5 percent fly ash to the soil on a dry weight basis. The fly ash content
shall not exceed 20% by dry weight. Dry mix enough fly ash and soil for one AASHTO T 99 compaction sample until a
homogeneous mixture is obtained. Gradually add the compaction water. Continuemixing for 2 minutes. Place the resulting mixture in a covered pan. Prepare a new soil -fly ash mixture for each sample.
Compact the soil-fly ash mixture one hour after mixing, and perform the IBV test. Repeat the compaction and IBV testing procedures, for each sample, until the moisture-
density-IBV relationships are obtained for a series of at least three fly ash contents.
5. Evaluation of Test Results - Plot the dry density and IBV versus moisture content for the soil,and for each level of soil-fly ash content investigated.
6. Determine the Design Fly Ash Content - The minimum fly ash content shall be designated
as the fly ash content which provides an IBV of 10.0 percent or more, for the anticipatedfield moistures. Increase the minimum fly ash content by 1 percent to obtain the design flyash content to offset blowing, uneven distribution, and other factors.
NOTE: For silty soils with a clay content less than approximately 15%, Method B mix design procedures may yield artificiallyhigh IBVs. Method A compressive strength test procedures should be used to verify IBV results at the design fly ash contentdetermined using Method B. If a significant discrepancy between IBV and compressive strength results exists, Method A mixdesign procedures should be used to determine the design fly ash content.

F-4
7. IBR (soaked) Test - Obtain the bearing value and percent swell according to Geotechnical
Manual Attachment II-A Section 1. Conduct the test with the minimum fly ash content atstandard dry density and optimum moisture content. The amount of swell, after soaking for96 hours, shall not be greater than 4.0%.
8. Cured Bearing Value (optional) - Curing of the compacted fly ash - soil mixture may be
required to obtain the minimum 10.0 percent IBV value. Compact a sample with a moisturecontent close to anticipated field conditions according to AASHTO T 99. The compactedsample shall be sealed in the mold to prevent moisture loss during the curing period. After acuring period of 48 hours, penetrate the sample and obtain a moisture content.
Determining Minimum Construction Moisture Requirements
The addition of fly ash at the required treatment rates reduces the net amount of water availablefor hydration. This reduction in moisture content shall be estimated using the followingequation:
Moisture Reduction, % = 3.2 x {OMC – [100Ww / (Ws + WCCFA)]}
Where: OMC = Optimum moisture content of the untreated soil in percentWw = OMC/100 multiplied by the untreated soil standard dry density in kg/m³ (pcf)Ws = Standard dry density of the untreated soil in kg/m³ (pcf) / 1 m³ (1 ft³)WCCFA = Design treatment rate per cubic meter in kilograms (rate per ft³ in pounds)
The minimum moisture content requirement shall be determined by adding the moisturereduction calculated above to the optimum moisture content of the treated soil at the design flyash content.
Report
The report shall contain the information required by Method A or B of the Department’s“Laboratory Design Procedures for Lime Stabilized/Lime Modified Soils.” The minimummoisture content requirement shall also be reported. Cured IBV and curing period shall bereported when optional cured IBV testing is performed. The curing period for compressivestrength test shall be reported where applicable.

F-5
Recommended Material Specificationsfor By-Product Hydrated Lime for Lime Modified Soils
1012.0x. By-Product Hydrated Lime for Lime Modified Soils. When used in limemodified soils, by-product hydrated lime (hydrator tailings) shall conform to the followingrequirements:
(a) Total calcium and magnesium oxides (nonvolatile basis) min. percent 90
(b) Available calcium hydroxide (rapid sugar test, ASTM C 25) plus totalMgO content calculated to be equivalent Ca(OH)2 min. percent 70
(c) As received loss on ignition (carbon dioxide plus moisture,combined and free), max. percent 25
(d) Free water (as-received basis), max. percent 4
(e) Residue – The sieve analysis shall be as follows
Sieve Maximum Percent Retained
4.75 mm (No. 4) 0600 µm (No. 30) 10150 µm (No. 100) 60
Recommended Revisions to Section 302 of the Standard Specifications to Include BHL
Article 302.02 – Add “By-Product Hydrated Lime for Lime Modified Soils.”
Article 302.08 – Add “Note 3: Compaction of soils treated with By-Product Hydrated Lime shallbe delayed a minimum of 24 hours.” after the first paragraph.
Recommended Revisions to Section 1010 of the Standard Specificationsto Include Soil Modification with CCFA
Add Article 1010.0X “Modified Soils. The fly ash shall meet the requirements of AASHTO M295, Class C except for the following:
(a) Loss-on-Ignition shall be less than or equal to 10 percent.(b) Supplementary Optional Chemical Requirements shall not apply.(c) Physical Requirements shall not apply.(d) The material retained on the 0.150 mm sieve shall not exceed 15%.
Fly ash shall not be dampened for the purpose of transportation.”

F-6
RECOMMENDED SPECIFICATIONfor
FLY ASH MODIFIED SOILS
x.01 Description. This work shall consist of the construction of a fly ash modified soillayer composed of soil, fly ash, and water.
x.02 Materials. Materials shall meet the requirements of the following Articles ofSection 1000 - Materials:
Item Article/Section
(a) Water ..............................................................................................1002(b) Fly Ash............................................................................................1010.0X
x.03 Equipment. Equipment shall meet the requirements of the following Articlesof Section 1100 - Equipment:
Item Article/Section
(a) Rollers (Note 1)................................................................................1101.01(b) Distributor (Note 2)(c) Rotary Speed Mixer ........................................................................1101.06(d) Disk Harrow ....................................................................................1101.02(e) Subgrade Planer .............................................................................1103.08(f) Subgrade Machine ..........................................................................1103.09(g) Heavy Subgrade Template .............................................................1103.10(h) Water Supply Equipment ................................................................1103.11
Note 1. Three-wheel rollers and tandem rollers, when used, shall weigh not less than5.5 metric tons (6 tons) nor more than 11 metric tons (12 tons) and shall have acompression on the drive wheels of not less than 35 N/mm (190 lbs. per inch) normore than 70 N/mm (400 lbs. per inch) width of roller.
Note 2. Distributor shall capable of spreading fly ash uniformly over the area to bemodified as approved by the Engineer.
CONSTRUCTION REQUIREMENTS
x.04 General. The fly ash modified soil shall be constructed only when thetemperature of the soil, measured 150 mm (6 inches) below the surface, is above 7 °C (45 °F),and the ambient air temperature is above 4 °C (40 °F). Fly ash shall not be applied to or mixedwith frozen soil. The amount of fly ash modified soil constructed shall be limited to that whichcan be covered with subbase, base or pavement within the same construction season, unlessotherwise permitted by the Engineer.

F-7
x.05 Proportioning.
(a) Samples. The Contractor, at his/her own expense, shall provide a minimum of 7 kg(15 lb.) of fly ash and 45 kg (100 lb.) of soil proposed to be used at least 30 days priorto the construction of the fly ash modified soils.
(b) Mix Design. Fly ash will be proportioned within a range of 10 - 20 percent of soil (ovendry basis). The required proportion of fly ash will be established by the Engineer priorto construction, using samples of the proposed soil and fly ash, and the Department's“Laboratory Design Procedures for Fly Ash Modified Subgrade.” The Engineerreserves the right to make such adjustments of fly ash proportioning as are considerednecessary during the progress of the work within the range specified, withoutadditional compensation to the Contractor.
The source of fly ash shall not be changed during the progress of the work withoutpermission of the Engineer.
x.06 Spreading of Fly Ash. The fly ash shall be distributed uniformly over thesubgrade surface. A probe shall be used to randomly check the thickness of fly ash. TheEngineer may reject any procedure which does not provide even distribution of fly ash. TheEngineer may require additional fly ash to be spread to correct uneven distribution at no cost tothe Department.
Fly ash shall not be applied when wind conditions are such that blowing fly ash becomesobjectionable to adjacent property owners or creates a hazard to traffic on adjacent highways.
The spreading of fly ash shall be limited to that amount which can be incorporated into thesoil within the same working day. In the event that rain wets fly ash prior to mixing, theEngineer may require additional fly ash to be spread at no cost to the Department.
The surface of the grade shall be scarified or disked to a minimum depth of 150 mm (6inches) following fly ash distribution. Disking or scarification is not required for granular soils.
x.07 Mixing. The fly ash, soil, and water (if necessary) shall be thoroughly blendedby a rotary speed mixer. Water shall be added prior to the mixing operation in a sufficientquantity to bring the moisture content of the soil-fly ash mixture to the minimum determinedduring the mix design. Water shall be added either 24 hours prior to spreading fly ash, ordirectly in front of the rotary speed mixer.
If more than one pass of the rotary speed mixer is required to obtain a homogenousmixture, 25 percent of the specified fly ash quantity shall be spread and mixed as a preparationfor the final pass of the rotary speed mixer. The remaining specified quantity of fly ash shall bespread prior to the final pass of the rotary speed mixer. Mixing shall continue untilapproximately 75 percent of the mixture is smaller than 25 mm (1 inch). The loose thickness ofa single fly ash modified layer shall not exceed 350 mm (14 inches).
x.08 Compaction. Compaction shall be completed no later than 1 hour after mixingbegins.
Compaction shall be continued until the fly ash modified layer has a density of not lessthan 95 percent of the standard dry density of the fly ash treated soil. The standard dry density
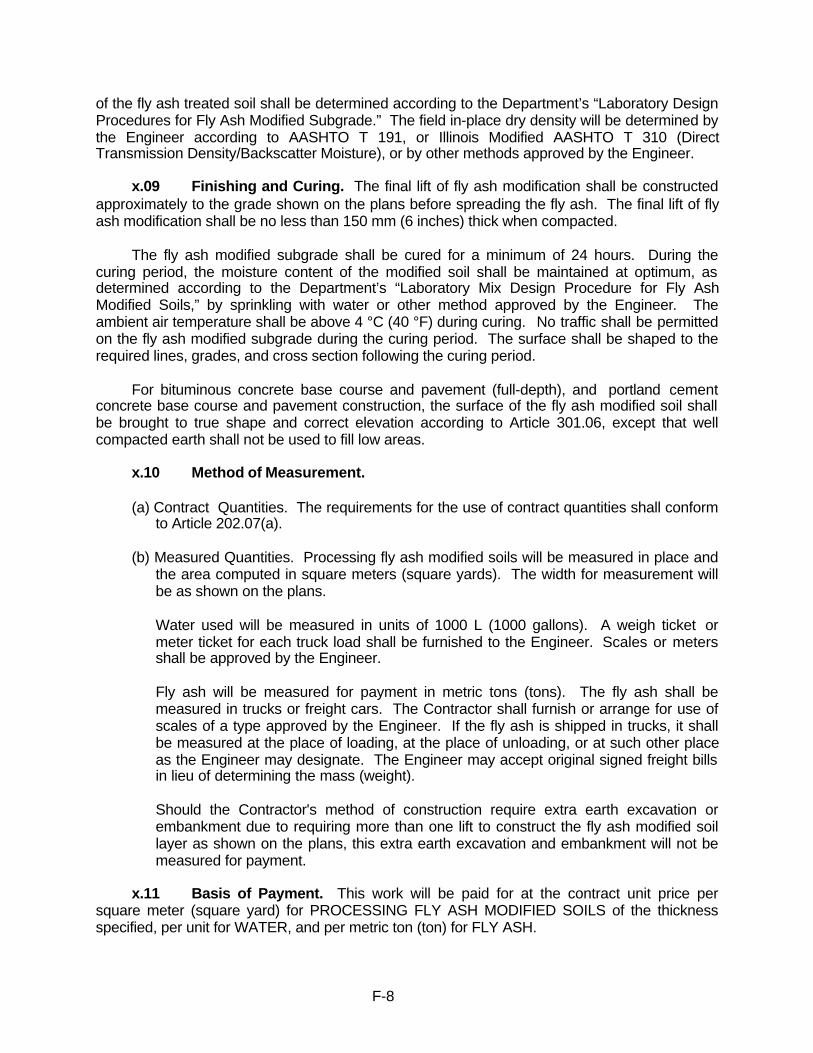
F-8
of the fly ash treated soil shall be determined according to the Department’s “Laboratory DesignProcedures for Fly Ash Modified Subgrade.” The field in-place dry density will be determined bythe Engineer according to AASHTO T 191, or Illinois Modified AASHTO T 310 (DirectTransmission Density/Backscatter Moisture), or by other methods approved by the Engineer.
x.09 Finishing and Curing. The final lift of fly ash modification shall be constructedapproximately to the grade shown on the plans before spreading the fly ash. The final lift of flyash modification shall be no less than 150 mm (6 inches) thick when compacted.
The fly ash modified subgrade shall be cured for a minimum of 24 hours. During thecuring period, the moisture content of the modified soil shall be maintained at optimum, asdetermined according to the Department’s “Laboratory Mix Design Procedure for Fly AshModified Soils,” by sprinkling with water or other method approved by the Engineer. Theambient air temperature shall be above 4 °C (40 °F) during curing. No traffic shall be permittedon the fly ash modified subgrade during the curing period. The surface shall be shaped to therequired lines, grades, and cross section following the curing period.
For bituminous concrete base course and pavement (full-depth), and portland cementconcrete base course and pavement construction, the surface of the fly ash modified soil shallbe brought to true shape and correct elevation according to Article 301.06, except that wellcompacted earth shall not be used to fill low areas.
x.10 Method of Measurement.
(a) Contract Quantities. The requirements for the use of contract quantities shall conformto Article 202.07(a).
(b) Measured Quantities. Processing fly ash modified soils will be measured in place andthe area computed in square meters (square yards). The width for measurement willbe as shown on the plans.
Water used will be measured in units of 1000 L (1000 gallons). A weigh ticket ormeter ticket for each truck load shall be furnished to the Engineer. Scales or metersshall be approved by the Engineer.
Fly ash will be measured for payment in metric tons (tons). The fly ash shall bemeasured in trucks or freight cars. The Contractor shall furnish or arrange for use ofscales of a type approved by the Engineer. If the fly ash is shipped in trucks, it shallbe measured at the place of loading, at the place of unloading, or at such other placeas the Engineer may designate. The Engineer may accept original signed freight billsin lieu of determining the mass (weight).
Should the Contractor's method of construction require extra earth excavation orembankment due to requiring more than one lift to construct the fly ash modified soillayer as shown on the plans, this extra earth excavation and embankment will not bemeasured for payment.
x.11 Basis of Payment. This work will be paid for at the contract unit price persquare meter (square yard) for PROCESSING FLY ASH MODIFIED SOILS of the thicknessspecified, per unit for WATER, and per metric ton (ton) for FLY ASH.