1308-jonathanbakerca-summerposter
TRANSCRIPT

Jonathan Baker, Tulane University
Nancy A. Schulte
1, Debra J. Romberger 2, and M
yron L. Toews
1
1Pharmacology and Experim
ental Neuroscience
2Internal Medicine and VA
Calcium M
obilization by an Aqueous Hogbarn Dust Extract in Airw
ay Epithelial Cells and Lung Fibroblasts
University of N
ebraska Medical C
enter

METHODSCell culture: BEAS-2B cells were grown in LHC-9:RPMI (50:50) medium in 96-well plates with black sides and clear bottoms until confluent.HDE preparation and fractionation: An aqueous extract of hog barn dust (HDE) was prepared by dissolving 1 g of settled dust from Nebraska hog barns in 10 ml of HBSS by shaking at room temperature for 1 hr. The mixture was centrifuged, and the supernate was collected and filter-sterilized before use.Cell Treatments: Cells were treated for the indicated times with the indicated concentrations of complete HDE or the indicated gel filtration fractions to assess the various HDE responses detailed below. Ca2+ mobilization assays: Cells were assayed for intracellular Ca2+
changes with the FLIPR Calcium 4 Assay Kit using the FlexStation II instrument and FlexStation II accessories (Molecular Devices, Sunnyvale, CA). In brief, the dye reagent was prepared in 1X HBSS buffer + 20 mM HEPES buffer pH 7.4 plus 2.5 mM probenecid. Each well with cells in 50 μl of starvation medium (RPMI) was treated with 50 μl of dye reagent. For inhibitor studies, the inhibitor or vehicle was added to the starvation medium before exposing the cells to the dye. The dye reagent-treated cells were incubated in a CO2-free incubator for 1 hr and then stimulated with HDE in the FlexStation II instrument by adding 25 μl per well of 5X stock solutions of the compounds. Ca2+ mobilization was recorded continuously for 120 seconds, with one column of 8 wells measured at a time. Peak values for each well in a column were normalized to the value for LPA (10 μM) stimulation in the corresponding column.Inhibitors: Inhibitors were acquired from various UNMC colleagues for from commercial sources. Amiloride and pertussis toxin (PTx) were dissolved in water, and all other inhibitors were dissolved in DMSO, with the corresponding amount of solvent added to the control non-stimulated wells during the assays.Data analysis: Data analysis, curve fitting, and graphing were all done with GraphPad Prism.

ABSTRACTRATIONALE. Workers in swine confinement facilities are susceptible to development of chronic inflammatory lung disease, and an aqueous hog-barn dust extract (HDE) stimulates release of cytokines TNF-α, IL6 and IL8 from cultured BEAS-2B human airway epithelial cells. This response involves activation of the Ca2+-dependent protein kinase C-alpha isozyme, and previous studies have shown that HDE increases intracellular Ca2+ in these cells. The source and pathways for this Ca2+
increase have not been established. We hypothesized that G protein-mediated regulation of IP3 receptor Ca2+ channels and/or TrpV Ca2+
channels would be involved.METHODS. Intracellular Ca2+ concentration changes in confluent BEAS-2B cells were monitored fluorometrically with a Flex Station II Ca2+-monitoring system.RESULTS. HDE caused a concentration-dependent increase in Ca2+ mobilization, though with lower potency than in previous studies. Nifedipine and amiloride failed to alter the response to HDE, suggesting that L- and T-type channels are not involved. Though components in HDE can bind to ryanodine receptors in muscle cells, ryanodine neither induced responses on its own nor blocked responses to HDE in BEAS-2B cells. The Gi/o inactivator pertussis toxin, the phospholipase C inhibitor U73122, and the IP3 receptor blocker 2-APB all clearly inhibited HDE responses. The TrpV blocker capsazepine also markedly inhibited the response to HDE.CONCLUSIONS. These data point to Gi/o-mediated activation of PLC and subsequent release of Ca2+ from IP3-sensitive intracellular stores as one pathway, and opening of plasma membrane TrpV channels to allow influx of extracellular Ca2+ as another component. Further studies are needed to confirm the involvement of each of these identified components and to test for the likely interactions among these pathways. An additional critical need is to identify the components of HDE responsible for these cell signaling responses, which may point to ways to prevent or limit their deleterious effects on the lungs. Supported by NIH 1-R01-OH008539 to HDE.

HOGBARN DUSTand AIRWAY DISEASE
• Workers in swine confinement facilities (enclosed hog barns) experience increased incidence of airflow obstruction and respiratory symptoms of chronic cough and sputum production (1).
• An aqueous extract of settled dust collected from these hog barns (HDE, hogbarn dust extract) mimics human disease-relevant responses when administered to animals (2).
• HDE also stimulates relevant responses in isolated airway epithelial cells in culture, including release of inflammatory cytokines TNF-α , IL-6 and IL-8 (3,4).

REFERENCES1. Von Essen SG and Romberger DJ. National Agriculture Safety
Database, 2001.2. Poole JA et al. Am. J. Physiol.-Lung Cell. Mol. Biol. 296:L1085-
1095, 2009.3. Romberger DJ et al. J. Appl. Physiol. 93:289-296, 2002.4. Mathisen T et al. J. Appl. Physiol. 96:1738-1744, 2004.5. Wyatt TA et al. Am. J. Respir. Cell Mol. Biol. 42:706-715, 2010.6. Dodmane PR et al. Am J. Respir. Cell Mol. Biol. 45:882-888,
2011.
RATIONALE forCURRENT STUDIES
• Activation of the Ca2+-dependent protein kinase C (PKC) isozyme PKC-α is required for HDE stimulation of release of the inflammatory cytokines IL-6, IL-8, and TNF-α from airway epithelial cells (4,5).
• Previous studies from our laboratory showed that HDE does in fact stimulate an elevation of intracellular Ca2+ (6), presumably contributing to the activation of PKC-α.
• The specific mediators in the HDE fractions and the mechanisms by which they increase intracellular Ca2+ have not been established.

HYPOTHESES• HDE will utilize two distinct pathways for Ca2+ mobilization in airway
epithelial cells.
• G protein-mediated stimulation of phospholipase C (PLC) and subsequent activation of IP3 receptor Ca2+ channels is one likely pathway, based on the known PKC-α involvement.
• TRP-V Ca2+ channels are another likely pathway, based on their role in mediating cytokine release in response to particular matter (2 refs!)
REMAINING/NEW QUESTIONS1. Does HDE stimulate PLC activity and IP3 formation in a PTx-sensitive manner?
2: Does HDE directly activate TrpV channels, or is TrpV activation mediated by Gi/o-dependent mechanisms?
3. Is part of the response dependent on extracellular Ca2+ (TrpV) and part from intracellular Ca2+ (IP3R)?
4: What are the components of HDE that activate Gi/o, PLC, IP3Rs, and TrpV channels?

•
FIG. 1. HDE DRC
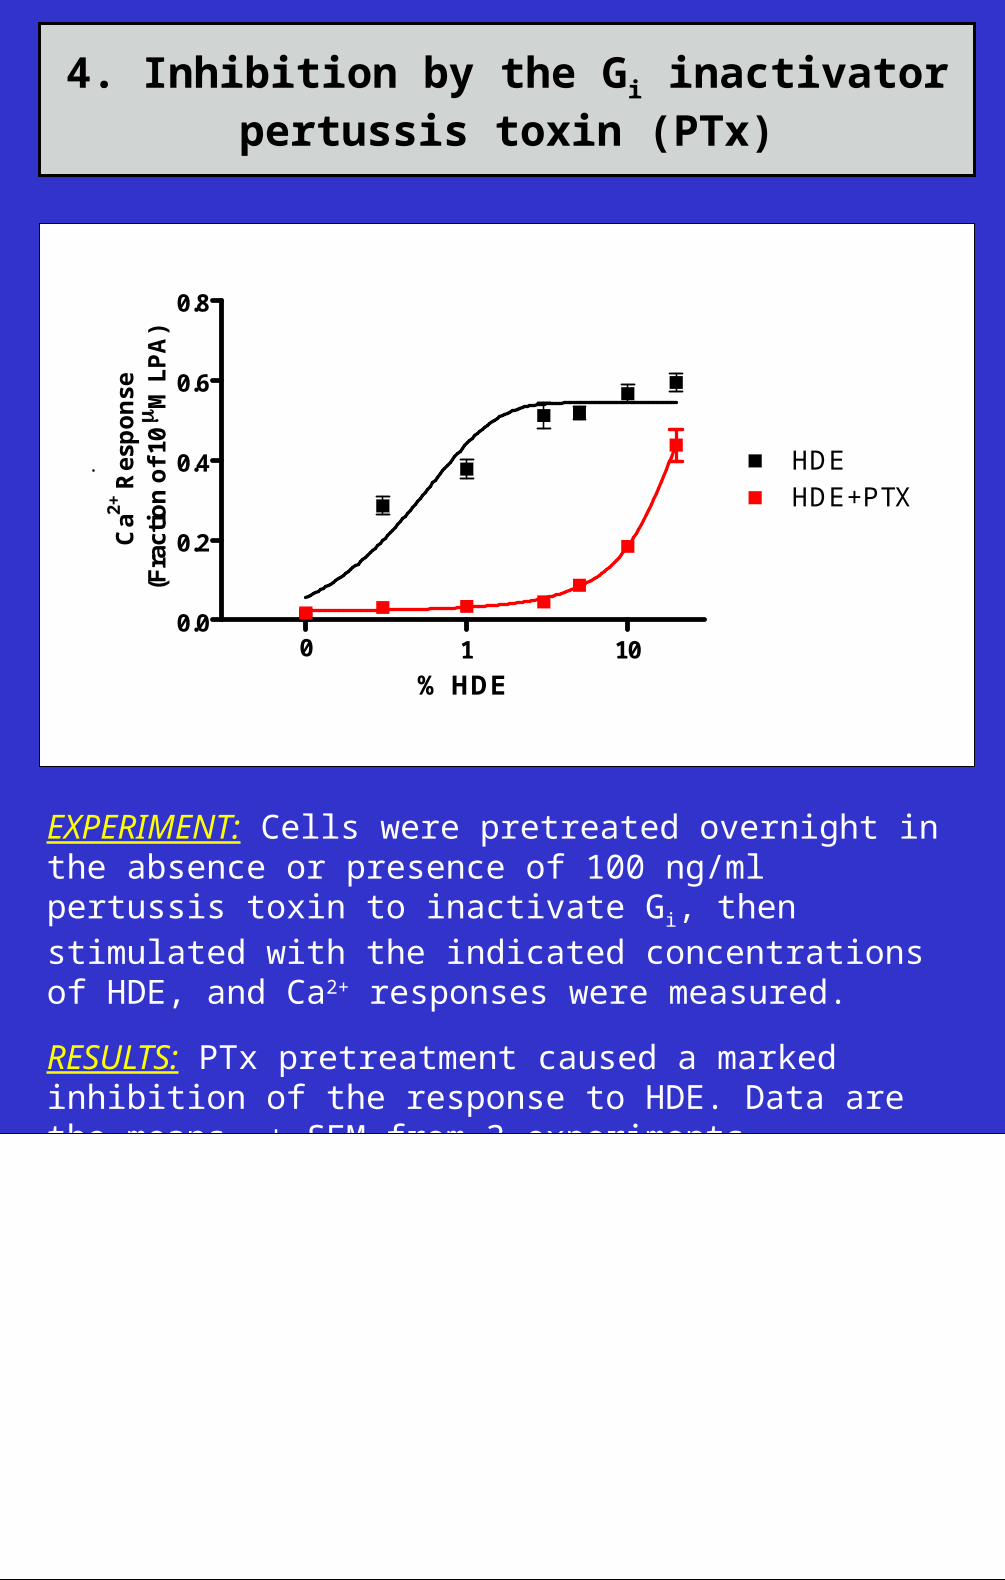
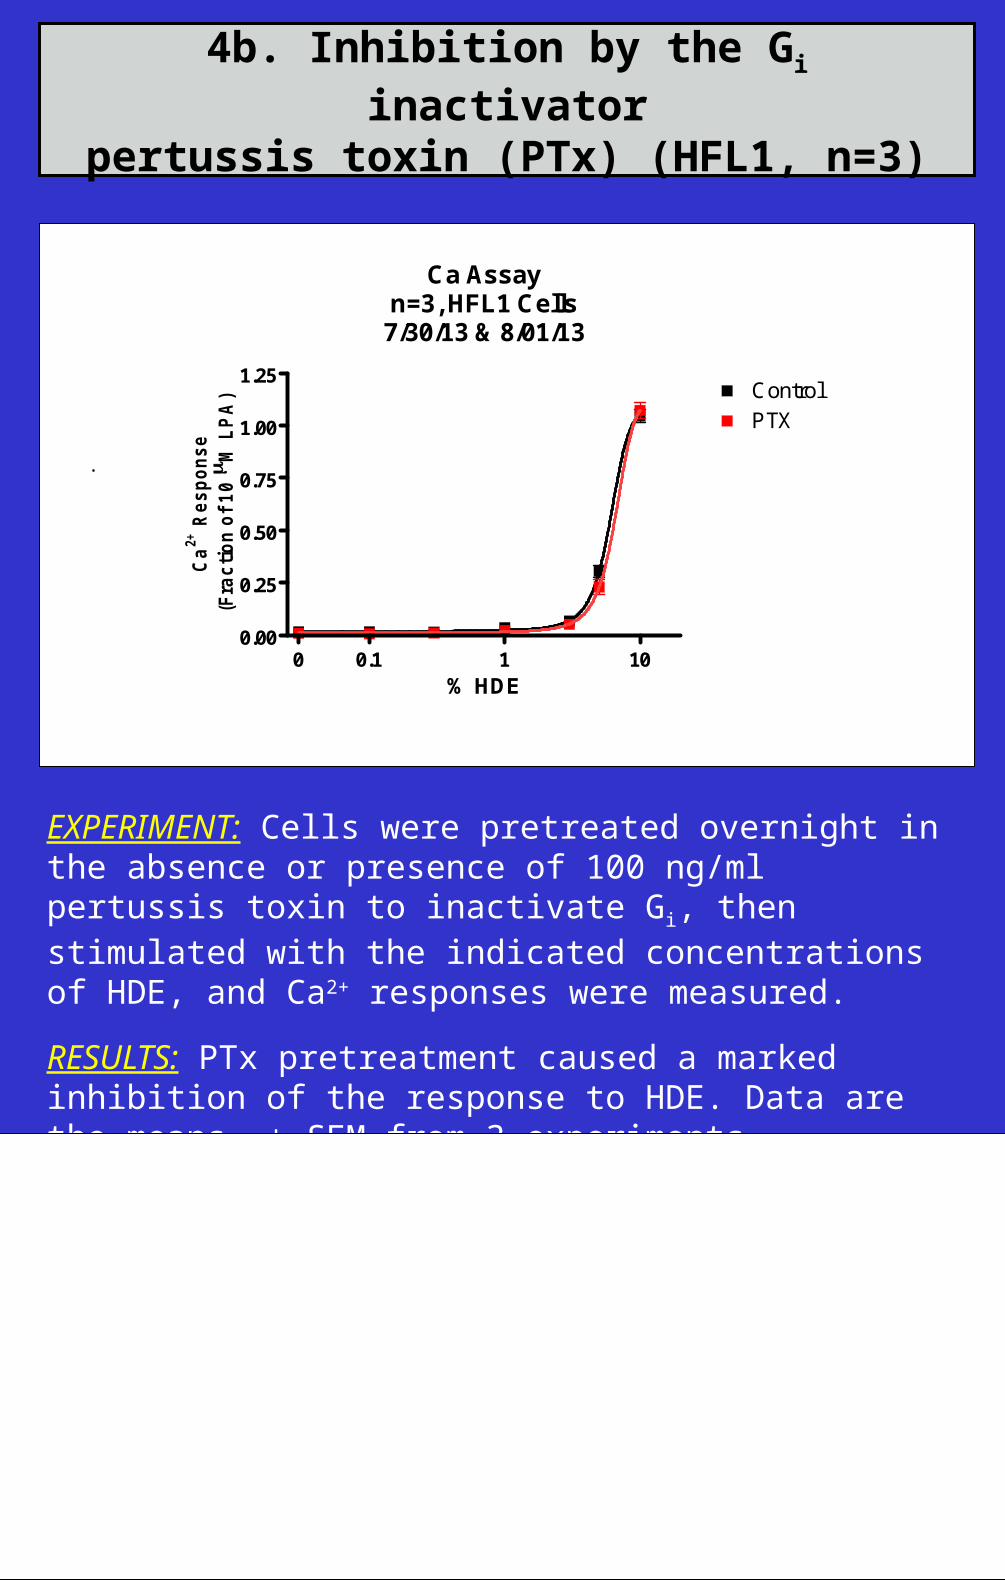
EXPERIMENT: Cells were pretreated overnight in the absence or presence of 100 ng/ml pertussis toxin to inactivate Gi, then stimulated with the indicated concentrations of HDE, and Ca2+ responses were measured.
RESULTS: PTx pretreatment caused a marked inhibition of the response to HDE. Data are the means ± SEM from 3 experiments.
4. LPA Response in B2B vs. HFL1
Ca Assayn=2 LPA
7/24/13 & 8/06/13
-10 -9 -8 -7 -6 -50-100000
100002000030000400005000060000700008000090000
B2BHFL1
[M] LPA
Ca2+
Res
pons
e(R
aw D
ata)

•
FIG. 1. HDE DRC
EXPERIMENT: Cells were pretreated overnight in the absence or presence of 100 ng/ml pertussis toxin to inactivate Gi, then stimulated with the indicated concentrations of HDE, and Ca2+ responses were measured.
RESULTS: PTx pretreatment caused a marked inhibition of the response to HDE. Data are the means ± SEM from 3 experiments.
4. HDE Response in B2B vs. HFL1
Ca Assayn=2 HDE
7/24/13 & 8/06/13
0.1 1 1000
10000
20000
30000
40000
50000
60000
70000B2BHFL1
% HDE
Ca2+
Res
pons
e(R
aw D
ata)
•
FIG. 1. HDE DRC
EXPERIMENT: Cells were pretreated overnight in the absence or presence of 100 ng/ml pertussis toxin to inactivate Gi, then stimulated with the indicated concentrations of HDE, and Ca2+ responses were measured.
RESULTS: PTx pretreatment caused a marked inhibition of the response to HDE. Data are the means ± SEM from 3 experiments.
4. Inhibition by the Gi inactivatorpertussis toxin (PTx)
1 100.0
0.2
0.4
0.6
0.8
HDEHDE+PTX
0% HDE
Ca2+
Res
pons
e(F
ract
ion
of 1
0 M
LPA
)
•
FIG. 1. HDE DRC
EXPERIMENT: Cells were pretreated overnight in the absence or presence of 100 ng/ml pertussis toxin to inactivate Gi, then stimulated with the indicated concentrations of HDE, and Ca2+ responses were measured.
RESULTS: PTx pretreatment caused a marked inhibition of the response to HDE. Data are the means ± SEM from 3 experiments.
4b. Inhibition by the Gi inactivatorpertussis toxin (PTx) (HFL1, n=3)
Ca Assayn=3, HFL1 Cells
7/30/13 & 8/01/13
0.1 1 1000.00
0.25
0.50
0.75
1.00
1.25ControlPTX
% HDE
Ca2+
Res
pons
e(F
ract
ion
of 1
0
M L
PA)

FIG. 1. HDE DRC
EXPERIMENT: Cells were pretreated with the indicated concentrations of 2-APB for 1 hr, then with the indicated concentrations of HDE, and Ca2+ responses were measured.
RESULTS: 2-APB caused a modest inhibition of the response to HDE at 100 µM. Data are the means ± SEM from 3-5 experiments.
5.Inhibition bythe IP3R Ca2+ channel inhibitor 2-APB
3 100.0
0.2
0.4
0.6
0.8
1.0
Control-6 2-APB-5 2-APB-4 2-APB
0% HDE
Ca2+
Res
pons
e(F
ract
ion
of 1
0 M
LPA
)

FIG. 1. HDE DRC
EXPERIMENT: Cells were pretreated with the indicated concentrations of 2-APB for 1 hr, then with the indicated concentrations of HDE, and Ca2+ responses were measured.
RESULTS: 2-APB caused a modest inhibition of the response to HDE at 100 µM. Data are the means ± SEM from 3-5 experiments.
5.Inhibition bythe IP3R Ca2+ channel inhibitor 2-APB (HFL1, HDE,
n=1)
Ca AssayHFL1 Cells
7/08/13
1 100.0
0.5
1.0
1.5
2.0
2.5Control-6 2-APB-5 2-APB-4 2-APB
0% HDE
Ca2+
Res
pons
e(F
ract
ion
of 1
0 M
LPA
)

FIG. 1. HDE DRC
EXPERIMENT: Cells were pretreated with the indicated concentrations of 2-APB for 1 hr, then with the indicated concentrations of HDE, and Ca2+ responses were measured.
RESULTS: 2-APB caused a modest inhibition of the response to HDE at 100 µM. Data are the means ± SEM from 3-5 experiments.
5.Inhibition bythe IP3R Ca2+ channel inhibitor 2-APB (HFL1, LPA,
n=1)
Ca AssayHFL1 Cells
7/08/13
-10 -9 -8 -7 -6 -50.0
0.5
1.0
1.5Control-6 2-APB-5 2-APB-4 2-APB
0[M] LPA
Ca2+
Res
pons
e(F
ract
ion
of 1
0 M
LPA
)

FIG. 1. HDE DRC
EXPERIMENT: Cells were pretreated with the indicated concentrations of capsazepine for 1 hr, then with the indicated concentrations of HDE, and Ca2+ responses were measured.
RESULTS: Capsazepine caused a strong and concentration-dependent inhibition of the response to HDE at 100 µM. Data are the means ± SEM from 2 experiments.
6. Inhibition of HDE stimulation bythe TrpV Ca2+ channel inhibitor capsazepine
0.1 1 100.0
0.2
0.4
0.6
Control-6 Capsazepine-5 Capsazepine-4 Capsazepine
% HDE
Ca2+
Res
pons
e(F
ract
ion
of 1
0 M
LPA
)

FIG. 1. HDE DRC
EXPERIMENT: Cells were pretreated with the indicated concentrations of capsazepine for 1 hr, then with the indicated concentrations of HDE, and Ca2+ responses were measured.
RESULTS: Capsazepine caused a strong and concentration-dependent inhibition of the response to HDE at 100 µM. Data are the means ± SEM from 2 experiments.
6b. Inhibition of HDE stimulation bythe TrpV Ca2+ channel inhibitor capsazepine (HFL1,
n=2)
Ca Assayn=2 HFL1 Cells7/10/13, 7/12/13
0.1 1 100.0
0.1
0.2
0.3
0.4
0.5Control-6 Capsazepine-5 Capsazepine-4 Capsazepine
0% HDE
Ca2+
Res
pons
e(F
ract
ion
of 1
0 M
LPA
)

FIG. 1. HDE DRC
EXPERIMENT: Cells were pretreated with the indicated concentrations of capsazepine for 1 hr, then with the indicated concentrations of HDE, and Ca2+ responses were measured.
RESULTS: Capsazepine caused a strong and concentration-dependent inhibition of the response to HDE at 100 µM. Data are the means ± SEM from 2 experiments.
6b. Fraction Comparison
Calcium AssayB2B Cells
6/24/13
P3 P8 P130.00
0.05
0.10
0.15
0.20
0.25
0.30
0.35B2B 10/19/09HFL1 10/19/09
Norm
aliz
ed

FIG. 1. HDE DRC
EXPERIMENT: Cells were pretreated with the indicated concentrations of capsazepine for 1 hr, then with the indicated concentrations of HDE, and Ca2+ responses were measured.
RESULTS: Capsazepine caused a strong and concentration-dependent inhibition of the response to HDE at 100 µM. Data are the means ± SEM from 2 experiments.
6b. Fraction Comparison (B2B, HFL1)
Calcium AssayB2B Cells
6/24/13
Cont
rol
3% H
DE -P2
-P1 P1 P2 P3 P4 P5 P6 P7 P8 P9 P10
P11
P12
P13
P14
P15
0.00
0.05
0.10
0.15
0.20
0.25
0.30
0.35HFL1 10/19/09B2B 10/19/09
Norm
aliz
ed

FIG. 1. HDE DRCWORKING MODELBASED ON NEW DATA
ER Ca2+
HDEFactor 1
PLC IP3
Gi/o
DAG
IP3R
Ca2+
HDEFactor 2 Extracellular
Ca2+
PKC
GPCR TrpV
PTx
U73122
Capsazepine2-APB