1308 ieee/acm transactions on networking, …mshafiq/files/crowdedevents-ton2016.pdf ·...
TRANSCRIPT
1308 IEEE/ACM TRANSACTIONS ON NETWORKING, VOL. 24, NO. 3, JUNE 2016
Characterizing and Optimizing Cellular NetworkPerformance During Crowded EventsM. Zubair Shafiq, Lusheng Ji, Senior Member, IEEE, Alex X. Liu, Jeffrey Pang,
Shobha Venkataraman, and Jia Wang
Abstract— During crowded events, cellular networks face voiceand data traffic volumes that are often orders of magnitudehigher than what they face during routine days. Despite the use ofportable base stations for temporarily increasing communicationcapacity and free Wi-Fi access points for offloading Internettraffic from cellular base stations, crowded events still presentsignificant challenges for cellular network operators looking toreduce dropped call events and improve Internet speeds. For aneffective cellular network design, management, and optimization,it is crucial to understand how cellular network performancedegrades during crowded events, what causes this degradation,and how practical mitigation schemes would perform in real-lifecrowded events. This paper makes a first step toward this end bycharacterizing the operational performance of a tier-1 cellularnetwork in the U.S. during two high-profile crowded eventsin 2012. We illustrate how the changes in population distribution,user behavior, and application workload during crowded eventsresult in significant voice and data performance degradation,including more than two orders of magnitude increase in con-nection failures. Our findings suggest two mechanisms that canimprove performance without resorting to costly infrastructurechanges: radio resource allocation tuning and opportunisticconnection sharing. Using trace-driven simulations, we show thatmore aggressive release of radio resources via 1–2 s shorterradio resource control timeouts as compared with routine dayshelps to achieve better tradeoff between wasted radio resources,energy consumption, and delay during crowded events, andopportunistic connection sharing can reduce connection failuresby 95% when employed by a small number of devices in eachcell sector.
Index Terms— Cellular network, crowded events, performance.
Manuscript received March 25, 2014; revised October 18, 2014; acceptedDecember 17, 2014; approved by IEEE/ACM TRANSACTIONS ON NET-WORKING Editor S. Chong. Date of publication April 20, 2016; dateof current version June 14, 2016. This work was supported in partby the National Science Foundation under Grant CNS-1318563 andGrant CNS-1524698, the National Natural Science Foundation of China underGrant 61472184 and Grant 61321491, the Jiangsu Future Internet Programunder Grant BY2013095-4-08, and the Jiangsu High-Level Innovation andEntrepreneurship (Shuangchuang) Program. The preliminary version of thispaper, titled “A First Look at Cellular Machine-to-Machine Traffic—LargeScale Measurement and Characterization,” was published in the Proceed-ings of the ACM International Conference on Measurement and Modelingof Computer Systems (SIGMETRICS), Pittsburgh, PA, USA, June 2013.(Corresponding author: Alex X. Liu.)
M. Z. Shafiq was with Michigan State University, East Lansing,MI 48824 USA. He is now with the Department of Computer Sci-ence, The University of Iowa, Iowa City, IA 52242 USA (e-mail:[email protected]).
L. Ji, J. Pang, S. Venkataraman, and J. Wang are withAT&T Laboratories—Research, Bedminster, NJ, USA (e-mail:[email protected]; [email protected]; [email protected];[email protected]).
A. X. Liu is with the Department of Computer Science and Engineer-ing, Michigan State University, East Lansing, MI 48824 USA (e-mail:[email protected]).
Color versions of one or more of the figures in this paper are availableonline at http://ieeexplore.ieee.org.
Digital Object Identifier 10.1109/TNET.2016.2533612
I. INTRODUCTION
CROWDED events, such as football games, publicdemonstrations, and political protests, put an extremely
high demand for communication capacity on cellular networksaround the duration of the events [1]. Cellular networks arefacing unprecedent challenges in dealing with such spikydemand. First, cellular network utilization has already beenrapidly approaching its full capacity throughout the world dueto the increasing prevalence of cellular devices such as smart-phones, tablets, and Machine-to-Machine (M2M) devices.Even in the United States, cellular network usage is at anall-time high even under normal operating conditions andprojections show that traffic volume will further increase by26 times by 2015 as compared to 2010 [2], [3]. Second, thespiky demand caused by crowded events is often extremelyhigh because there maybe a large number (often tens ofthousands) of users gathered in a small region (such as afootball stadium) that is covered by only a small number of celltowers. Even worse, people tend to use their cellular devicesmore than usual during the events to either talk with theirfriends or access the Internet (such as uploading a photo toFacebook or a video clip to YouTube during a football game).Third, it is critical for cellular networks to cope with suchhigh demand during crowded events because poor performancewill affect a large number of people and cause widespreaduser dissatisfaction. Although cellular network operators havedeployed remediation solutions, such as portable base stationscalled Cells on Wheels (COWs) for temporarily increasingcommunication capacity and free Wi-Fi access points foroffloading Internet traffic from cellular base stations, crowdedevents still remain a major challenge for cellular networkoperators.
To the best of our knowledge, this paper presents the firstthorough investigation of cellular network performance duringcrowded events. Based on the real-world voice and data tracesthat we collected from a tier-1 cellular network in the UnitedStates during two high-profile crowded events in 2012, we aimto answer the following three key questions.
How does cellular network performance degrade duringcrowded events as compared to routine days? To answer thisquestion, we characterize cellular network performance duringboth the pre- and post-connection phases (i.e., before or afterradio access bearer assignment), which helps us to understanduser experience before and after acquiring radio resources.For pre-connection phase, we find that pre-connection failuresdramatically increase during the crowded events by 100-5000times as compared to their average on routine days. Thesefailures occur because when too many users attempt to acquireradio resources at the same time, they exhaust the limited
1063-6692 © 2016 IEEE. Personal use is permitted, but republication/redistribution requires IEEE permission.See http://www.ieee.org/publications_standards/publications/rights/index.html for more information.

SHAFIQ et al.: CHARACTERIZING AND OPTIMIZING CELLULAR NETWORK PERFORMANCE DURING CROWDED EVENTS 1309
bandwidth of the signaling channel resulting in connectiontimeouts and failures. We find that this resource exhaustionoccurs not only at the event venue, but also as far as 10miles around the event as users arrive and depart. Moreover,some failures, such as dropped and blocked voice calls, aremost likely to occur in bursts just before, after, and duringevent intermissions. For post-connection phase, we find thatvoice network performance in terms of dropped and blockedcalls degrades during crowded events by 7-30 times, anddata network performance in terms of packet loss ratio andround trip time (RTT) degrades during crowded events by 1.5-7 times, compared to their average on routine days.
What causes the performance degradation? To answer thisquestion, we analyze user traffic patterns in terms of bothaggregate network load and user-level session characteristics.For aggregate network load, we find that uplink traffic volumeincreases by 4-8 times, and both downlink traffic volumeand the number of users increase by 3 times, during thecrowded events as compared to their average on routinedays. We conclude that the large number of users trying toaccess radio resources at the same time is a major cause ofthe observed excessive pre-connection failures. For user-levelsession characteristics, we find that the average byte volumeper session decreases by 0.5 times during the events eventhough the average session length increases. Our investigationin Section IV-B suggests that this change in workload is dueto a change in application usage during these events, such asthe increased use of online social networks. We conclude thatlower byte volume per session, despite an increase in averagesession length, is a major cause of the waste of radio resourcesin the post-connection phase.
How would practical mitigation schemes perform inreal-life? To answer this question, we investigate two practicalmitigation schemes that do not require making significantchanges to the cellular infrastructure: radio resource allo-cation tuning and opportunistic connection sharing. Radioresource allocation tuning addresses the issue of inefficientradio resource allocation in the post-connection phase byadjusting cellular network resource allocation parameters.Cellular networks allocate resources to each user using aRadio Resource Control (RRC) state machine, which is syn-chronously maintained by the network and devices. Dif-ferent states of the RRC state machine correspond to dif-ferent amount of radio resources allocated by the networkand energy consumption by cellular devices. Since a largenumber of users contend for limited radio resources duringcrowded events, we show that more aggressive release ofradio resources via 1-2 seconds shorter RRC timeouts helpsto achieve a better tradeoff between wasted radio resources,energy consumption, and delay during crowded events.Note that cellular network operators often know the timeand location of large crowded events beforehand; thus, it ispractical for them to adjust cellular network parameters beforeevents and restore them after events. In practice, networkoperators can automatically tune RRC timeouts based onnetwork load measurements.
Opportunistic connection sharing addresses increasedpre-connection failures (due to poor RF quality, interference,or radio resource exhaustion, etc.) by aggregating trafficfrom multiple devices into a single cellular connection. That
Fig. 1. Cellular network architecture.
is, by having some devices share their cellular connectionwith nearby devices over their Wi-Fi or Bluetooth interface(i.e., “tethering”), opportunistic connection sharing shouldreduce the number of overall cellular connection requests,thereby reducing request congestion and connection failures.Using trace-driven simulations, we show that connectionsharing can reduce connection failures by more than 95%when employed by a small number of devices in each cellsector. Although much work has been done on opportunisticconnection sharing to address issues such as mobility, energyuse, and incentives [4]–[6], no prior work has demonstratedthe significant benefit that such connection sharing can achievebased on real-life cellular network data.
The rest of this paper is organized as follows. In Section II,we present details of the data collection process. Section IIIpresents the characterization of performance issues duringthe crowded events and Section IV presents various aspectsof user traffic patterns to study the underlying causes ofperformance issues. We conduct trace-driven simulations toevaluate radio network parameter tuning and opportunisticconnection sharing in Section V. Section VI reviews relatedwork and the paper is concluded in Section VII.
II. DATA SET
A. BackgroundA typical 3GPP Universal Mobile Telecommunications
System (UMTS) cellular network, shown in Figure 1, consistsof two components: Radio Access Network (RAN) and CoreNetwork (CN). RAN consists of NodeBs and Radio NetworkControllers (RNCs). Each NodeB has multiple antennas, whereeach antenna corresponds to a different cell sector. CN consistsof Serving GPRS Support Nodes (SGSNs) facing the user andGateway GPRS Support Nodes (GGSNs) facing the Internetand other external networks. A user via user equipment (UE)connects to one or more cell sectors in the RAN. The trafficgenerated by a UE is sent to the corresponding NodeB bycell sectors. Each RNC controls and exchanges traffic withmultiple NodeBs, each of which serves many users in itscoverage area. RNCs manage control signaling such as RadioAccess Bearer (RAB) assignments, transmission scheduling,and handovers. RNCs send traffic from NodeBs to SGSNs,which then send it to GGSNs. GGSNs eventually send trafficto external networks, such as the Internet.
RAN dynamically allocates resources to a UE. Specifically,every UE negotiates allocation of radio resources with theRAN based on a wide range of factors, such as availableradio resources and signal strength [7]. Every UE followsthe RRC protocol for dynamic acquisition and dropping ofradio resources. The RRC state machine of each user is

1310 IEEE/ACM TRANSACTIONS ON NETWORKING, VOL. 24, NO. 3, JUNE 2016
Fig. 2. RRC protocol state transitions.
synchronously maintained by the UE and network. Differentstates in the RRC state machine correspond to differentamounts of allocated radio resources by the network andenergy consumption by UEs. In this paper, we are onlyconcerned about UE energy consumption at the radio interface.Thus, we do not account for other types of UE energyconsumption, e.g., computation, screen-on, etc. Figure 2 showsall RRC protocol state transitions. According to RRC protocol,a UE transitions to Dedicated Channel (DCH) state or ForwardAccess Channel (FACH) state for uplink or downlink datatransfer. RAN assigns a dedicated or shared channel for DCHand FACH states, respectively. If a UE does not have any datato transfer, it transitions to Paging Channel (PCH) state beforethe transition to IDLE state. Generally, state promotions arecontrolled by data buffer size thresholds and state demotionsare controlled by inactivity timeouts. Furthermore, the energyconsumption by a UE is roughly inversely proportional to theamount of allocated radio resources. The energy consumptionby a UE is maximum in DCH state, which is about halvedwhen it transitions to FACH state, and is reduced to less than1/100th in PCH and IDLE states [8]. Moreover, given stablesignal strength, a UE’s energy consumption from its radiointerface is generally stable regardless of type of transmissions(e.g., uplink vs. downlink) or throughput.
B. Data CollectionThe data set used in this study contains anonymized logs
collected from RAN and CN of a tier-1 UMTS cellularnetwork in the United States serving over 100 million cus-tomers. The cellular network employs High Speed PacketAccess (HSPA) technology. Our data set consists of twoseparate collections, each covering a metropolitan area duringa high-profile event in 2012. The collections include infor-mation from hundreds of thousands of users and thousandsof cell locations over multiple days including the event days.The first event, referred to as Event A hereafter, is an outdoorsporting event that consists of two segments of activitiesseparated by an intermission. The second event, referred to asEvent B hereafter, is an indoor professional conference eventthat consists of multiple segments of activities separated byintermissions of varying lengths. In terms of publicly availableattendance statistics, event A is roughly twice the size ofevent B. Both events attracted on the order of tens of thousandsof users. At peak usage during event A, more than fiftythousand users were connected to the cellular network. Theactivity segments in both events are illustrated by gray bars inall timeseries figures presented in this paper. Furthermore, itis noteworthy that free Wi-Fi service was provided to all usersduring both of the events to offload as much cellular network
traffic as possible. The free Wi-Fi service was intended tooffload data traffic and cannot offload voice calls. However,we do not have measurements on the network traffic that wasoffloaded to these Wi-Fi services; thus, we acknowledge thatour results may be biased by this offloading. For instance,users are likely to prefer Wi-Fi over cellular connectivity forhigh bandwidth activity (e.g., audio/video streaming) due todata caps. Therefore, aggregate traffic volume statistics maybe dampened and certain application types may be over- orunder-represented in our data set.
The anonymized logs collected at an RNC in RAN containthroughput and RRC protocol request/response information.Using RRC requests from UEs and responses from the RNC,the RAB status of all UEs can be monitored. The anonymizedlogs collected from the CN contain TCP header informationof IP flows carried in PDP context tunnels. They are col-lected from the Gn interfaces between SGSNs and GGSNsin the core network. They contain timestamp, per-flow trafficvolume, content publisher, RTT computed during TCP hand-shake [9], and estimated packet loss ratio for each TCP flowaggregated in 5 minute bins. All device and user identifiers(e.g., IMSI, IMEI) are anonymized to protect privacy withoutaffecting the usefulness of our analysis. The data set does notpermit the reversal of the anonymization or re-identificationof users. We note that logs collected at RNCs encompassboth voice and data traffic, whereas logs collected from theCN contain only data traffic information. The voice trafficvolume is almost an order of magnitude less than the datatraffic volume. This trend is inline with recent usage reportsand surveys [10].
Before we delve into the performance and workloadcharacterization, we analyze the aggregate movement ofuser population during the event and routine days for bothevents. In Figure 3, we plot the cumulative distributionfunctions (CDFs) of the number of users connected to the cel-lular network as a function of distance from venue. ComparingCDF plots for the event and routine days for both events,we observe that CDF curves rise faster for the event dayas compared to the routine day. This observation highlightsthat user population is located closer to the venues on theevent day. For example, during 9 pm−12 am interval forevent A, 40% and 70% of the user population is located within1 mile radius from the venue on the routine and event day,respectively. Comparing different time intervals, we observethat users’ proximity to the venue gradually increases onthe event days. For example, the fraction of user populationlocated within 1 mile radius from the venue for event A is50%, 60%, and 70% for 9 am−12 pm, 3 pm−6 pm, and9 pm−12 am, respectively. These findings indicate that cellularinfrastructure likely faces higher load and performance issuesat the cell sectors that are situated closer the venue on the eventdays.
Next, we characterize performance issues during the afore-mentioned two high-profile events in Section III. To studythe underlying causes of the identified performance issues,we then correlate network performance with various aspectsof user traffic patterns in Section IV. It is noteworthy thatthe while our study uses logs from a UMTS cellular network(with HSPA), the analysis and findings about traffic patternsare generalizable to networks that use other cellular technolo-

SHAFIQ et al.: CHARACTERIZING AND OPTIMIZING CELLULAR NETWORK PERFORMANCE DURING CROWDED EVENTS 1311
Fig. 3. CDF of number of users as a function of distance. (a) Event A. (b) Event B.
gies (e.g., LTE, WiMAX). Although the network parametersand performance metric are specific to the technology, ouranalysis and findings (e.g., reliability, inactivity timers) qual-itatively hold for types of cellular technologies. Throughout,we present results of the event day in relation to a routine dayfor baseline comparison. We normalize the actual measure-ment values by their mean values on the routine day (unlessstated otherwise); our results thus effectively represent howthe event differs from routine conditions. We omit absolutenumbers from some non-normalized plots due to proprietaryreasons.
III. CHARACTERIZING PERFORMANCE ISSUES
Generally speaking, a user’s experience about network per-formance can be divided into two phases. The pre-connectionphase is characterized by the UE attempting to establisha connection with the cellular network, or in other wordsestablishing a RAB. In this phase, the user waits for connectionestablishment, while not being able to exchange traffic at thistime. The post-connection phase starts after a RAB is assigned.In this phase, user experience is related to more traditionalvoice call performance metrics such as call drop and blockrate or end-to-end TCP performance metrics, such as delay andpacket loss. Below, we separately discuss both pre- and post-connection network performance experienced by users duringboth events.
A. Pre-Connection Network Performance
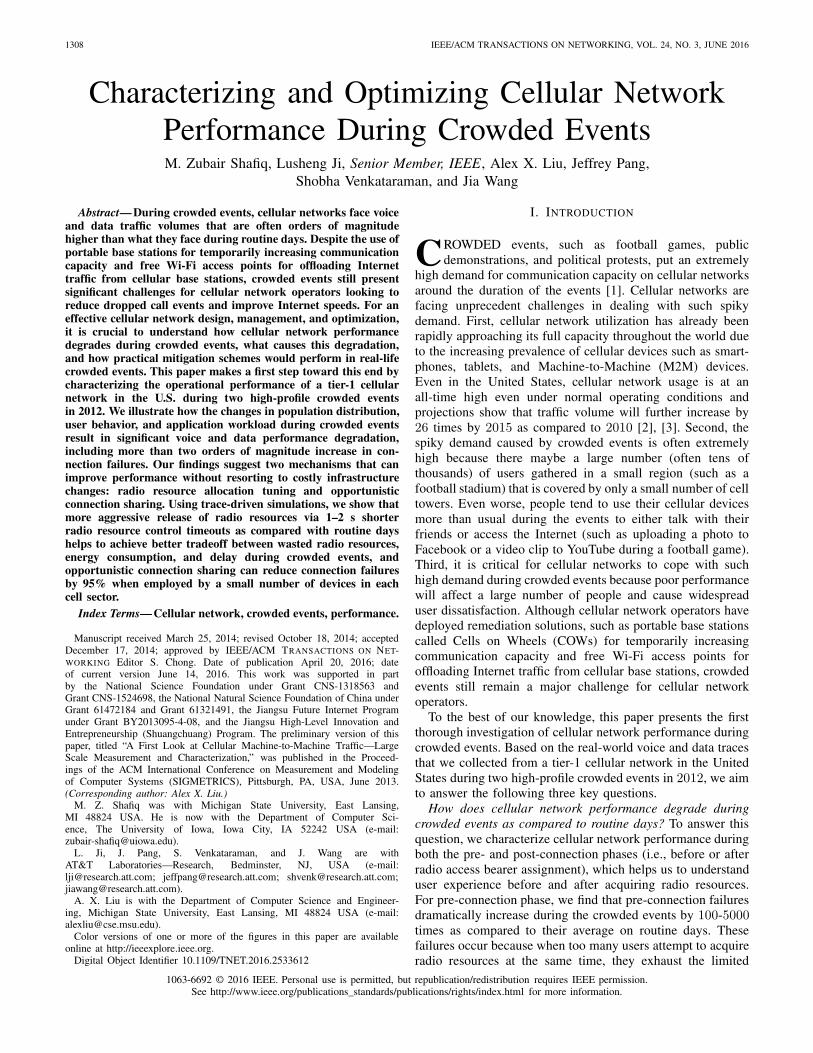
Users may experience difficulty in establishing RABs in thepre-connection phase due to a wide variety of reasons. Everytime a request to allocate more radio resources is denied bythe RNC, a RRC failure and its underlying reason is logged byour measurement apparatus. In our analysis, we study the logsof various types of RRC failures that are collected at the RNC.Each type of RRC failure corresponds to a specific problem
in the cellular network operation. The 3 most common typesof failures observed in our data set are the following.
1) Radio link setup failures occur when a user’s request tosetup a radio link is not served due to poor RF channelquality, which is often caused by increased interference.
2) Radio link addition failures occur when a user’s requestto add a radio link to an existing radio connection forsoft handovers is denied.
3) Too many serving cell users indicates blocking for newusers which results when all available RABs are occu-pied by existing users. For example, our data shows thata cell sector simultaneously supports around 32 userswith DCH assignments (for downlink HSPA). If a lotmore users try to connect and request DCH assignment,their RAB requests will be blocked.
Figure 4 plots the timeseries of the most common types ofRRC failures on the event and routine days for both events.We observe that RRC failures increase sharply on the eventdays, whereas they are negligible (and steady) on the routinedays for both events. For both events, RRC failures startoccurring around noon and generally reach their peak eitherjust before or during the event. Specifically, radio link additionfailures peak at more than 700× their average on the routineday for event A and too many serving cell users peak at morethan 5000× their average on the routine day for event B.
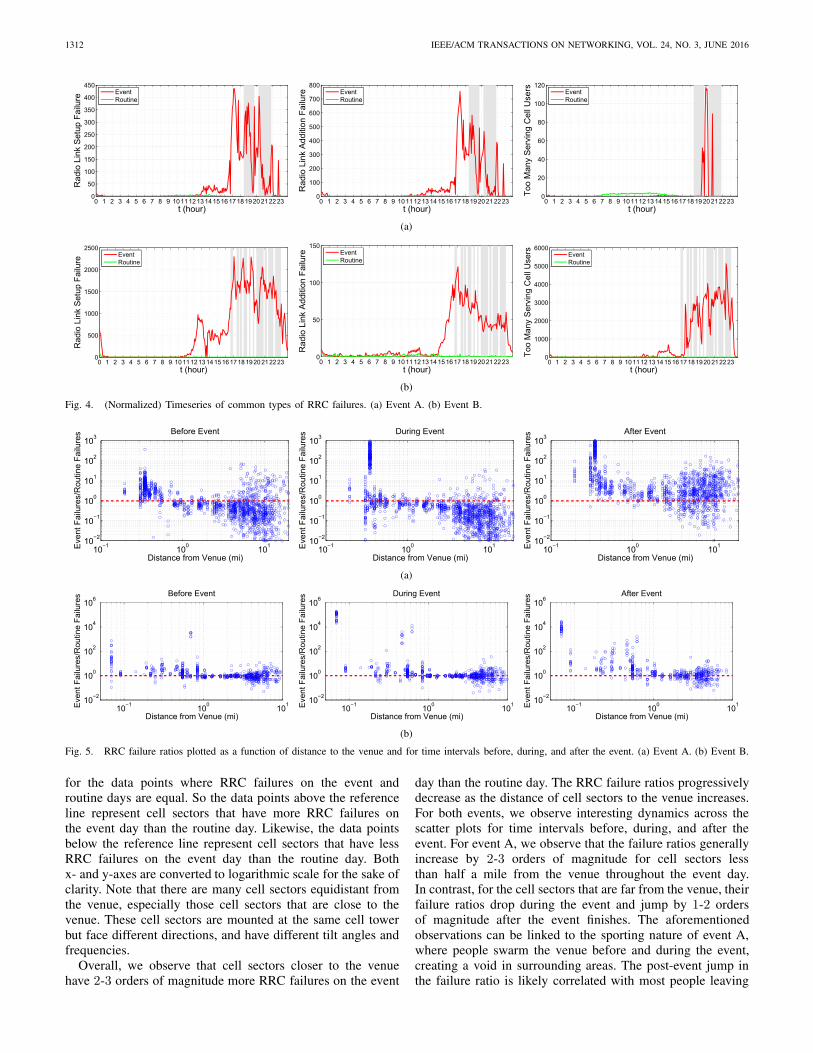
The nature of RRC failures for both events indicates thattheir potential root cause is high network load and congestiondue to a large number of competing users at cell sector level.Therefore, we next analyze RRC failures at cell sector levelbefore, during, and after the events as a function of distancefrom the venue. Figure 5 shows the scatter plots between thedistance of cell sectors from the venue (in miles) and the ratioof the number of RRC failures on the event day to that on theroutine day. The horizontal dashed line at y = 1 is a reference
1312 IEEE/ACM TRANSACTIONS ON NETWORKING, VOL. 24, NO. 3, JUNE 2016
Fig. 4. (Normalized) Timeseries of common types of RRC failures. (a) Event A. (b) Event B.
Fig. 5. RRC failure ratios plotted as a function of distance to the venue and for time intervals before, during, and after the event. (a) Event A. (b) Event B.
for the data points where RRC failures on the event androutine days are equal. So the data points above the referenceline represent cell sectors that have more RRC failures onthe event day than the routine day. Likewise, the data pointsbelow the reference line represent cell sectors that have lessRRC failures on the event day than the routine day. Bothx- and y-axes are converted to logarithmic scale for the sake ofclarity. Note that there are many cell sectors equidistant fromthe venue, especially those cell sectors that are close to thevenue. These cell sectors are mounted at the same cell towerbut face different directions, and have different tilt angles andfrequencies.
Overall, we observe that cell sectors closer to the venuehave 2-3 orders of magnitude more RRC failures on the event
day than the routine day. The RRC failure ratios progressivelydecrease as the distance of cell sectors to the venue increases.For both events, we observe interesting dynamics across thescatter plots for time intervals before, during, and after theevent. For event A, we observe that the failure ratios generallyincrease by 2-3 orders of magnitude for cell sectors lessthan half a mile from the venue throughout the event day.In contrast, for the cell sectors that are far from the venue, theirfailure ratios drop during the event and jump by 1-2 ordersof magnitude after the event finishes. The aforementionedobservations can be linked to the sporting nature of event A,where people swarm the venue before and during the event,creating a void in surrounding areas. The post-event jump inthe failure ratio is likely correlated with most people leaving
SHAFIQ et al.: CHARACTERIZING AND OPTIMIZING CELLULAR NETWORK PERFORMANCE DURING CROWDED EVENTS 1313
Fig. 6. (Normalized) Voice performance measurements. (a) Event A. (b) Event B.
the venue and using their devices to share their experience withothers via voice calls or social network posts (we show laterin this section that the observed user activity supports thishypothesis). We observe similar trends for event B as well;however, the post-event jump in the failure ratio is clearlyvisible only for cells within 1 mile of the venue. For thesereasons, while characterizing user network traffic in the nextsection, we focus our attention on the cell sectors that arewithin 1 mile radius of the venues for both events.
Summary: Pre-connection failures (especially those pertain-ing radio link addition and indicating too many serving cellusers) peak by a factor of 700 (for event A) and 5000 (forevent B) relative to their average on the routine days. Thesefailures increase by 2-3 orders of magnitude in cell sectorsvery close to the venues before and during the events, butonly increase in cell sectors further away after the venues.
B. Post-Connection Network Performance
As discussed in Section II, during the RAB setup phase, theRNC verifies that the needed radio resource for the requestactually exists before it assigns a RAB. In other words, if adevice has successfully acquired a RAB for communication,its performance should theoretically remain acceptable peroperator’s configuration even if the overall network demandlevel exceeds network capacity. This is because excessivedemand requests will get blocked off by the RNC fromacquiring any RAB. However, network conditions can quicklychange even for UEs that have already acquired a RABbecause of factors such as interference, mobility, etc. Suchdynamic network conditions can force UEs to request a changein current RAB status, initiating a series of RRC failures whichcould in turn result in degraded voice and data performance.Below, we separately discuss voice and data performance.
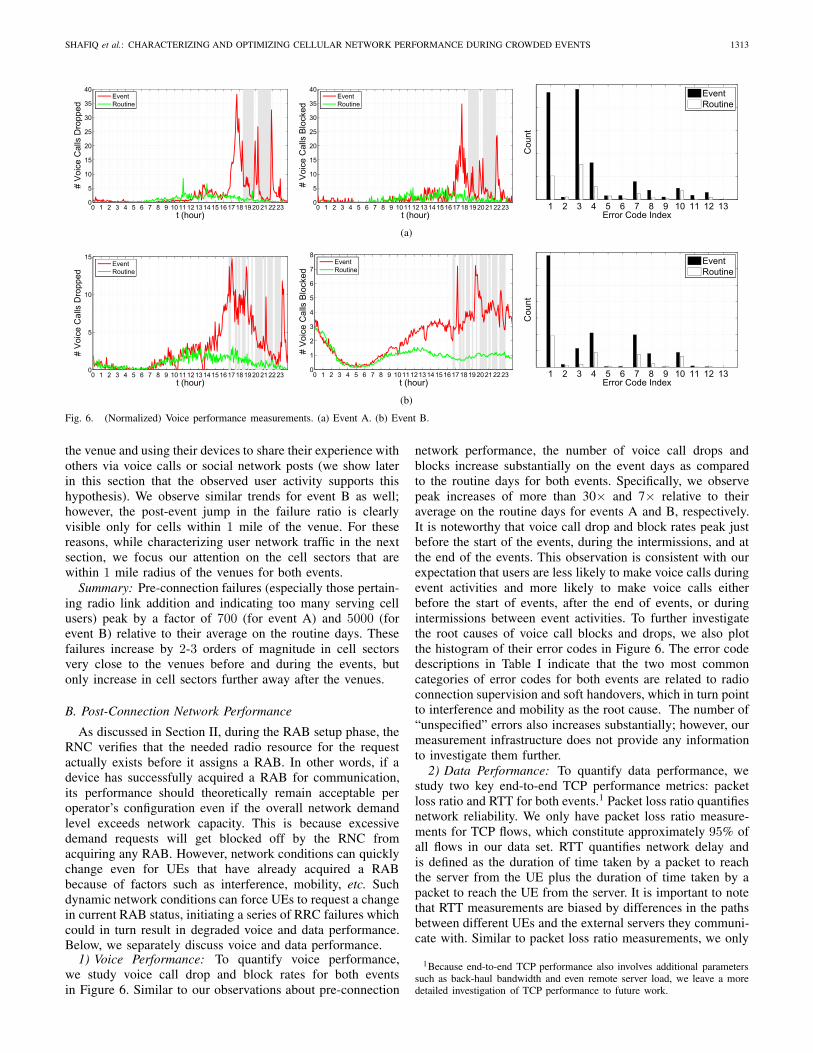
1) Voice Performance: To quantify voice performance,we study voice call drop and block rates for both eventsin Figure 6. Similar to our observations about pre-connection
network performance, the number of voice call drops andblocks increase substantially on the event days as comparedto the routine days for both events. Specifically, we observepeak increases of more than 30× and 7× relative to theiraverage on the routine days for events A and B, respectively.It is noteworthy that voice call drop and block rates peak justbefore the start of the events, during the intermissions, and atthe end of the events. This observation is consistent with ourexpectation that users are less likely to make voice calls duringevent activities and more likely to make voice calls eitherbefore the start of events, after the end of events, or duringintermissions between event activities. To further investigatethe root causes of voice call blocks and drops, we also plotthe histogram of their error codes in Figure 6. The error codedescriptions in Table I indicate that the two most commoncategories of error codes for both events are related to radioconnection supervision and soft handovers, which in turn pointto interference and mobility as the root cause. The number of“unspecified” errors also increases substantially; however, ourmeasurement infrastructure does not provide any informationto investigate them further.
2) Data Performance: To quantify data performance, westudy two key end-to-end TCP performance metrics: packetloss ratio and RTT for both events.1 Packet loss ratio quantifiesnetwork reliability. We only have packet loss ratio measure-ments for TCP flows, which constitute approximately 95% ofall flows in our data set. RTT quantifies network delay andis defined as the duration of time taken by a packet to reachthe server from the UE plus the duration of time taken by apacket to reach the UE from the server. It is important to notethat RTT measurements are biased by differences in the pathsbetween different UEs and the external servers they communi-cate with. Similar to packet loss ratio measurements, we only
1Because end-to-end TCP performance also involves additional parameterssuch as back-haul bandwidth and even remote server load, we leave a moredetailed investigation of TCP performance to future work.
1314 IEEE/ACM TRANSACTIONS ON NETWORKING, VOL. 24, NO. 3, JUNE 2016
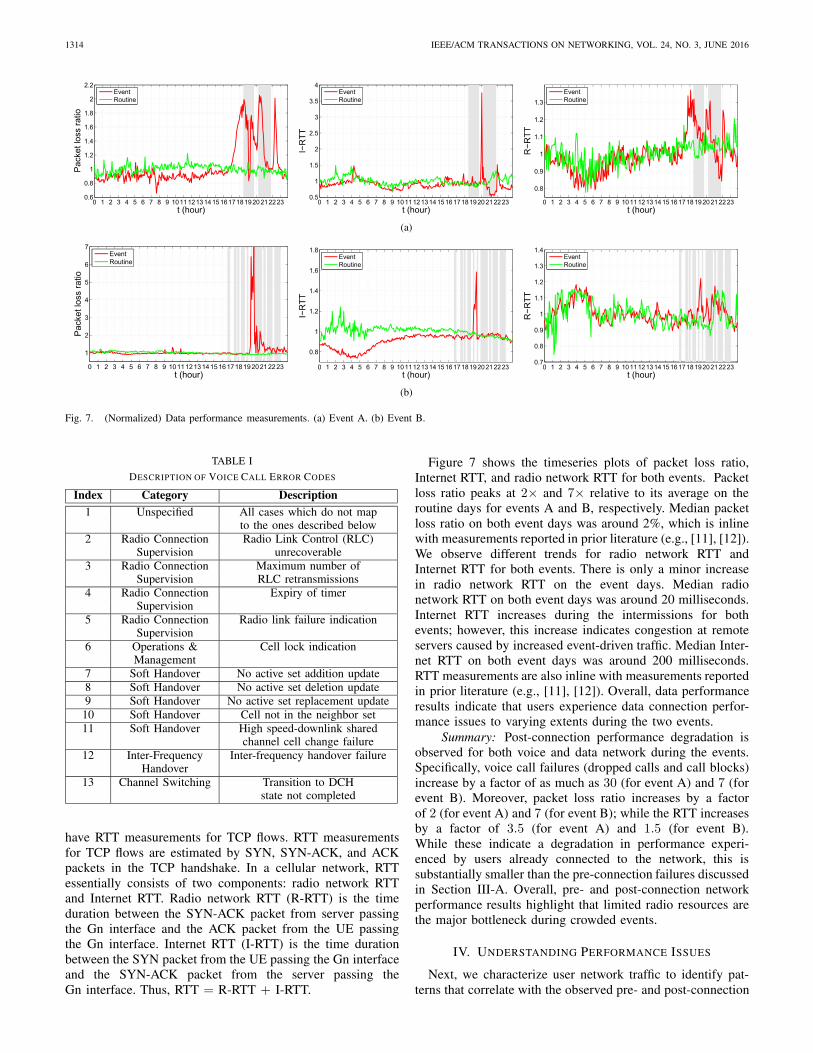
Fig. 7. (Normalized) Data performance measurements. (a) Event A. (b) Event B.
TABLE I
DESCRIPTION OF VOICE CALL ERROR CODES
have RTT measurements for TCP flows. RTT measurementsfor TCP flows are estimated by SYN, SYN-ACK, and ACKpackets in the TCP handshake. In a cellular network, RTTessentially consists of two components: radio network RTTand Internet RTT. Radio network RTT (R-RTT) is the timeduration between the SYN-ACK packet from server passingthe Gn interface and the ACK packet from the UE passingthe Gn interface. Internet RTT (I-RTT) is the time durationbetween the SYN packet from the UE passing the Gn interfaceand the SYN-ACK packet from the server passing theGn interface. Thus, RTT = R-RTT + I-RTT.
Figure 7 shows the timeseries plots of packet loss ratio,Internet RTT, and radio network RTT for both events. Packetloss ratio peaks at 2× and 7× relative to its average on theroutine days for events A and B, respectively. Median packetloss ratio on both event days was around 2%, which is inlinewith measurements reported in prior literature (e.g., [11], [12]).We observe different trends for radio network RTT andInternet RTT for both events. There is only a minor increasein radio network RTT on the event days. Median radionetwork RTT on both event days was around 20 milliseconds.Internet RTT increases during the intermissions for bothevents; however, this increase indicates congestion at remoteservers caused by increased event-driven traffic. Median Inter-net RTT on both event days was around 200 milliseconds.RTT measurements are also inline with measurements reportedin prior literature (e.g., [11], [12]). Overall, data performanceresults indicate that users experience data connection perfor-mance issues to varying extents during the two events.
Summary: Post-connection performance degradation isobserved for both voice and data network during the events.Specifically, voice call failures (dropped calls and call blocks)increase by a factor of as much as 30 (for event A) and 7 (forevent B). Moreover, packet loss ratio increases by a factorof 2 (for event A) and 7 (for event B); while the RTT increasesby a factor of 3.5 (for event A) and 1.5 (for event B).While these indicate a degradation in performance experi-enced by users already connected to the network, this issubstantially smaller than the pre-connection failures discussedin Section III-A. Overall, pre- and post-connection networkperformance results highlight that limited radio resources arethe major bottleneck during crowded events.
IV. UNDERSTANDING PERFORMANCE ISSUES
Next, we characterize user network traffic to identify pat-terns that correlate with the observed pre- and post-connection

SHAFIQ et al.: CHARACTERIZING AND OPTIMIZING CELLULAR NETWORK PERFORMANCE DURING CROWDED EVENTS 1315
Fig. 8. (Normalized) Network load measurements. (a) Event A. (b) Event B.
performance degradation during the events. Using the insightsobtained from this characterization, we aim to identify net-work optimization opportunities that can potentially improveend-user experience in crowded locations. We characterizenetwork traffic in terms of both aggregate network load anduser-level session characteristics.
A. Aggregate Network Load
We quantify aggregate network load in terms of thefollowing two metrics: data traffic throughput and user coun-ters. Throughput or bit-rate is sampled for all UEs at the RNCevery couple of seconds. Based on the direction of traffic,we can split the throughput into uplink throughput (Tup) anddownlink throughput (Tdown). Figure 8 plots the timeseries ofuplink and downlink throughput on the event and routine daysfor both events. For the routine days, both uplink and downlinkthroughput peak around the noon time and decline steadilyafterwards, reaching the bottom during late night and earlymorning. We observe a different trend for uplink throughputon the event days. For instance, the peak uplink throughput onthe event day is more than 8x and 4x the average throughputon the routine day for events A and B, respectively. We alsoobserve that the uplink throughput peaks and event activitiesare approximately aligned. For instance, uplink throughputsharply increases at the start and end of the second segmentfor event A. Similar, though less pronounced, patterns are alsoobservable for event B. In contrast to the uplink throughput,increases in the downlink throughput timeseries are steadierfor both events.
To further analyze traffic volume characteristics, we plotthe traffic flow count histograms for top content publishersin Figure 9. We focus on flows rather than bytes to avoid biastowards high volume applications, such as video streaming.We observe that flow counts of social networking contentpublishers more than double on the event day as compared
Fig. 9. Flow count histograms for top content publishers in our data set.(a) Event A. (b) Event B.
to the routine day for event A. Likewise, social networkingcontent accounts for most flows on the event day for event B.Our further investigation (not shown here) revealed that socialnetworking content is at least 2× more upstream heavy ascompared to other content types, which explains the increasein uplink throughput during both events.
We also analyze user counters for the event and routinedays for both events. Users are classified into the followingoverlapping categories based on their RRC states: admissioncontrol (AC), radio access bearer (RAB), and dedicated

1316 IEEE/ACM TRANSACTIONS ON NETWORKING, VOL. 24, NO. 3, JUNE 2016
Fig. 10. (Normalized) Session Count, Average Length, Average Inter-arrival Time. (a) Event A. (b) Event B.
channel (DCH). AC category includes the users who havecompleted the admission control procedure. RAB categoryincludes the users who have been assigned a RAB afteradmission control. Such users are typically in either FACHor DCH state. Finally, DCH category only includes the userswho are in DCH state. Let U denote the number of users, alsolet UAC , URAB , and UDCH denote the number of users in theaforementioned categories. As a general rule, UAC ≥ URAB ≥UDCH . Figure 8 plots the timeseries of number of users inAC, RAB, and DCH categories. These timeseries show a trendsimilar to the throughput measurements. All user counters havehigher values on the events days as compared to the respectiveroutine days for both events. Specifically, the number of userswith admission control peaks at more than 3× during theevents as compared to its average on the routine days.
Summary: Both aggregate uplink and downlink throughputincrease during the event days; uplink throughput increasesby a factor of as much as 8 and 4 (for events A and Brespectively), while downlink throughput increases by a factorof 3 (for both events). Moreover, there is a substantial increasein the traffic volume of social networking content during theevents, which is relatively more upstream heavy. Likewise,number of users with admission control increase by a factorof 3 for both event days. Overall, our aggregate networkload characterization shows that increased user activity duringthe events, specifically in terms of uplink throughput anduser counters, is correlated with increased pre-connectionfailures. To reduce the impact of increased network loadduring crowded events, we will investigate the effectivenessof opportunistic connection sharing in Section V-B.
B. User-Level Sessions
We now analyze characteristics of user-level traffic sessionsfor both events. A session consists of consecutive time inter-vals with uplink or downlink byte transfer and its end ismarked by an inactivity timeout of τ seconds. The resultspresented in this section are computed for τ = 5 seconds.
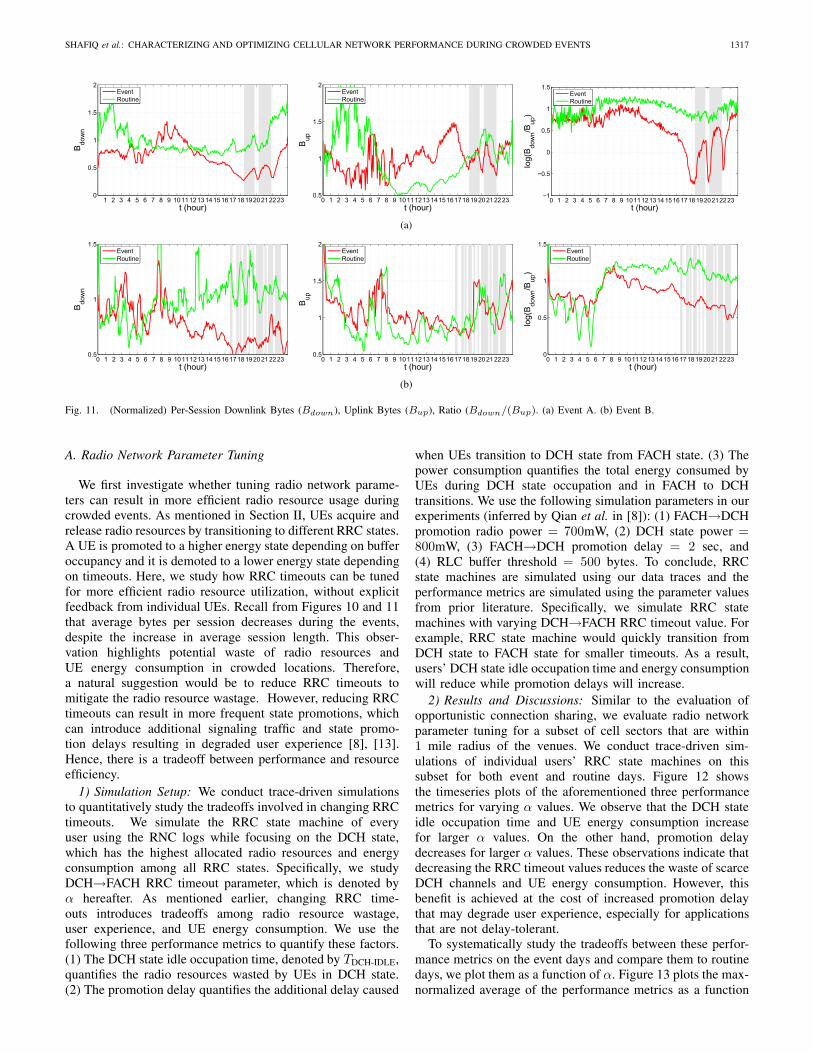
Changing the value of τ does not qualitatively affect theanalysis results. Figure 10 shows the timeseries of sessioncount, average session length, and average session inter-arrivaltime for both events. Session count follows a similar trend tothe earlier aggregate network load metrics – at peak, there ismore than 3.5× increase relative to the average on the routinedays for both events. Furthermore, we observe an increasein average session length on the event days as compared tothe routine days, e.g., there is more than 1.4× increase forevent A. On the contrary, average session inter-arrival timedecreases sharply on the event days as compared to the routinedays – this indicates that users are initiating sessions muchmore frequently during the events. To further investigate thenature of changing session patterns, we plot the timeseries ofaverage downlink bytes per session (Bdown), average uplinkbytes per session (Bup), and the average ratio of downlinkbytes to uplink bytes per session in Figure 11. We observethat average downlink bytes per session sharply decreases upto 0.5x during the event days; whereas, average uplink bytesper session exhibits a mixed trend. The ratio (Bdown/Bup)also sharply decreases during the events, which is due to theincreased traffic volume of upstream-heavy social networkingcontent.
Summary: User sessions are on average longer duringboth events (by a factor of as much as 1.4) – as well asmore numerous and more frequently initiated. However, usersexchange only as much as half the bytes per session onaverage. This change in workload is due to a change inthe application usage during these events, such as greaterproportion of social networking flows observed earlier. Thesetrends point to potential waste of radio resources by UEs,which can be mitigated by tuning radio network parameters.Towards this end, we will investigate the effectiveness ofvarying RRC timeouts in Section V-A.
V. EVALUATING MITIGATION SCHEMES
In this section, we evaluate two proposals to mitigate cellu-lar network performance degradation during crowded events.
SHAFIQ et al.: CHARACTERIZING AND OPTIMIZING CELLULAR NETWORK PERFORMANCE DURING CROWDED EVENTS 1317
Fig. 11. (Normalized) Per-Session Downlink Bytes (Bdown), Uplink Bytes (Bup), Ratio (Bdown/(Bup). (a) Event A. (b) Event B.
A. Radio Network Parameter Tuning
We first investigate whether tuning radio network parame-ters can result in more efficient radio resource usage duringcrowded events. As mentioned in Section II, UEs acquire andrelease radio resources by transitioning to different RRC states.A UE is promoted to a higher energy state depending on bufferoccupancy and it is demoted to a lower energy state dependingon timeouts. Here, we study how RRC timeouts can be tunedfor more efficient radio resource utilization, without explicitfeedback from individual UEs. Recall from Figures 10 and 11that average bytes per session decreases during the events,despite the increase in average session length. This obser-vation highlights potential waste of radio resources andUE energy consumption in crowded locations. Therefore,a natural suggestion would be to reduce RRC timeouts tomitigate the radio resource wastage. However, reducing RRCtimeouts can result in more frequent state promotions, whichcan introduce additional signaling traffic and state promo-tion delays resulting in degraded user experience [8], [13].Hence, there is a tradeoff between performance and resourceefficiency.
1) Simulation Setup: We conduct trace-driven simulationsto quantitatively study the tradeoffs involved in changing RRCtimeouts. We simulate the RRC state machine of everyuser using the RNC logs while focusing on the DCH state,which has the highest allocated radio resources and energyconsumption among all RRC states. Specifically, we studyDCH→FACH RRC timeout parameter, which is denoted byα hereafter. As mentioned earlier, changing RRC time-outs introduces tradeoffs among radio resource wastage,user experience, and UE energy consumption. We use thefollowing three performance metrics to quantify these factors.(1) The DCH state idle occupation time, denoted by TDCH-IDLE,quantifies the radio resources wasted by UEs in DCH state.(2) The promotion delay quantifies the additional delay caused
when UEs transition to DCH state from FACH state. (3) Thepower consumption quantifies the total energy consumed byUEs during DCH state occupation and in FACH to DCHtransitions. We use the following simulation parameters in ourexperiments (inferred by Qian et al. in [8]): (1) FACH→DCHpromotion radio power = 700mW, (2) DCH state power =800mW, (3) FACH→DCH promotion delay = 2 sec, and(4) RLC buffer threshold = 500 bytes. To conclude, RRCstate machines are simulated using our data traces and theperformance metrics are simulated using the parameter valuesfrom prior literature. Specifically, we simulate RRC statemachines with varying DCH→FACH RRC timeout value. Forexample, RRC state machine would quickly transition fromDCH state to FACH state for smaller timeouts. As a result,users’ DCH state idle occupation time and energy consumptionwill reduce while promotion delays will increase.
2) Results and Discussions: Similar to the evaluation ofopportunistic connection sharing, we evaluate radio networkparameter tuning for a subset of cell sectors that are within1 mile radius of the venues. We conduct trace-driven sim-ulations of individual users’ RRC state machines on thissubset for both event and routine days. Figure 12 showsthe timeseries plots of the aforementioned three performancemetrics for varying α values. We observe that the DCH stateidle occupation time and UE energy consumption increasefor larger α values. On the other hand, promotion delaydecreases for larger α values. These observations indicate thatdecreasing the RRC timeout values reduces the waste of scarceDCH channels and UE energy consumption. However, thisbenefit is achieved at the cost of increased promotion delaythat may degrade user experience, especially for applicationsthat are not delay-tolerant.
To systematically study the tradeoffs between these perfor-mance metrics on the event days and compare them to routinedays, we plot them as a function of α. Figure 13 plots the max-normalized average of the performance metrics as a function

1318 IEEE/ACM TRANSACTIONS ON NETWORKING, VOL. 24, NO. 3, JUNE 2016
Fig. 12. Experimental results for radio network parameter tuning. (a) Event A. (b) Event B.
of α for the event and routine days. In theory, we wantto select a value of α which simultaneously minimizes thevalues of all performance metrics. In this case, the crossoverpoints (highlighted by black circles in Figure 13) and their cor-responding α values represent suitable performance tradeoff.We find that these crossover points shift to smaller α values –by 1-2 seconds – on the event days as compared to the routinedays. It is noteworthy that the type of normalization doesnot qualitatively affect the analysis results. In practice, α istypically set to achieve a target delay or resource overhead.In this case, as observable from Figure 13, we can tune α tosmaller values to achieve the same targets and achieve strictlybetter performance during crowded events.
B. Opportunistic Connection Sharing
We now evaluate a simple opportunistic connection sharingscheme to reduce the network load at individual cell sectorsfor eradicating RRC failures observed in Section III-A. Thebasic idea is that users can share their connection to NodeBswith other users to reduce the overall network load in terms ofoccupied radio channels. In this scheme, a selected set of UEsact as Wi-Fi hotspots for other UEs in their vicinity. There-fore, other UEs, instead of wastefully establishing separateconnections, can connect to NodeBs via the UEs acting asWi-Fi hotspots. Using this approach, we aim to reduce thenumber of UEs that are directly connected to NodeBs to freeup channels, although the overall throughput carried by thenetwork remains the same.
1) Simulation Setup: To evaluate the potential benefit ofthe opportunistic connection sharing scheme, we conduct cellsector level trace-driven simulations. We assume that usersare static within 1 minute time bins. This is a reasonableassumption for crowded events in stadiums, auditoriums, andconference rooms. We do not have fine-grained location infor-mation of users in our data set; therefore, we have to simulate
Fig. 13. Tradeoff between performance metrics for varying RRC timeout (α)values. Y-axis is max-normalized for each metric. α values corresponding toblack circles achieve better performance tradeoff. (a) Event A. (b) Event B.
the locations of users. In this paper, we aim to generate thelocations of users in a grid-like scenario – similar to how peo-ple are typically seated in stadiums and conferences. Towardsthis end, we use Complete Spatial Randomness (CSR) pointgeneration model with hard-core inhibition [14]. CSR withhard-core inhibition does not allow neighbors within a pre-defined radius around the randomly generated points, resultingin a grid-like setting. The points in the realizations denotethe locations of users in our simulations. In our simulations,

SHAFIQ et al.: CHARACTERIZING AND OPTIMIZING CELLULAR NETWORK PERFORMANCE DURING CROWDED EVENTS 1319
Fig. 14. Experimental results for opportunistic connection sharing.(a) Event A. (b) Event B.
Wi-Fi hotspots are randomly selected among UEs becausewe do not have access to other relevant information, such asbattery life and signal strength, that may be used to optimizethis selection. Once a UE connects to a Wi-Fi hotspot, it isdisconnected after 1 minute of inactivity. The locations ofinactive users are updated using the above CSR model. In oursimulations, the cell sectors are set to have 2, 250, 000 ft2
coverage area, the inhibition radius is set to 2 ft, the hotspotWi-Fi range is simulated as N ∼ (200 ft, 20 ft), and the upperlimit on the number of simultaneous connections for eachWi-Fi hotspot is set to 5. The cell sector coverage area isin typical range for crowded urban locations, the inhibitionradius is set to be reasonably large, and the Wi-Fi rangeand the maximum number of simultaneous connections areconservatively set. The range of a Wi-Fi hotspot, once ran-domly selected, is kept fixed. We minimize adjacent-channelinterference by selecting only a few Wi-Fi hotspots percell sector that can choose non-overlapping Wi-Fi channelsin 2.4 GHz and 5 GHz bands. Moreover, we neglect co-channelinterference because the number of simultaneous connectionsfor each Wi-Fi hotspot is limited to 5. We assess the benefitof the connection sharing scheme in terms of the followingmetrics: the number of users in DCH state (UDCH) and thenumber of RRC failures. The performance metrics (numberof users in DCH state and RRC failures) are simulated usingRNC logs. Specifically, we exclude a user from DCH stateoccupation and corresponding RRC failures if she/he is in therange and served by a nearby Wi-Fi hotspot in our simulationinstead of cellular connectivity.
2) Results and Discussions: Since we are primarily inter-ested in deploying this scheme in congested locations, wefocus our evaluations on a subset of cell sectors in our dataset that are within 1 mile radius of the venues. We evalu-ate the opportunistic connection sharing scheme using trace-driven simulations on this subset on the event days. Theresults plotted in Figure 14 are the average of 1000 indepen-dent simulation runs. We plot the timeseries of the numberof occupied DCH channels (UDCH) for varying number ofWi-Fi hotspots per cell sector (denoted by N ). As expected,we observe that UDCH values become smaller for larger values
of N , freeing up DCH channels that are now available for UEsunable to transition to the DCH state due to RRC failures.We also plot the number of RRC failures for varying valuesof N in Figure 14. Again, as expected, we observe that RRCfailures decrease for increasing values of N . Consequently,based on instantaneous load conditions, the cellular networkcan dynamically vary the required number of users actingas Wi-Fi hotspots to minimize RRC failures. We note thatthis connection sharing scheme successfully eradicates morethan 95% RRC failures for both events when N = 10.This substantial reduction in the number of RRC failures incongested cell sectors will likely result in improved perfor-mance for users.
3) Practical Issues: Below, we discuss some practical issuesof opportunistic connection sharing.
a) Wi-Fi hotspot selection: The selection of Wi-Fihotspots can be mediated by the cellular network based ona variety of factors, such as battery life and signal strength.UEs acting as Wi-Fi hotspots may experience high energydrain and may run out of battery power. To address thisissue, the role of Wi-Fi hotspot can be periodically rotatedamong the user pool by the cellular network. The cellularnetwork should prefer UEs with better signal strength becauseUEs consume significantly more energy and suffer reducedeffective bit rate when the signal strength is poor [15]. On theother hand, the UEs that are unable to get RAB assignmentscan discover Wi-Fi hotspots in their range using the stan-dard Wi-Fi discovery methods. In case of multiple options,UEs should prefer hotspots with better signal strength.
b) Initial connection delay: After a device connects to aWi-Fi hotspot, similar to RRC protocol, it disconnects after apre-defined inactivity timer expires. However, the value of thistimer should be set much higher than the corresponding RRCtimers so that the device does not have to incur initial delay,which is up to several seconds, for every data transfer. In oursimulations, the inactivity timer was set to be 1 minute.
c) Out of range: A device has to request RAB assignmentwhen it moves out of a hotspot’s Wi-Fi range. If it is unable toget a RAB due to congestion then the RNC can dynamicallyassign more Wi-Fi hotspots in the cell sector to provideconnectivity to more users.
d) Radio technologies: Opportunistic connection sharingis only usable when a majority of devices in the cellularnetwork have built-in Wi-Fi capability. In our simulations,we assume that all devices have Wi-Fi capability. In caseWi-Fi is not available, other technologies such as Bluetoothcan also be used. Bluetooth has lower power consumption,smaller radio range, and supports less data rate as compared toWi-Fi. Consequently, it can be used as a low power alternativefor small transmissions such as tweets.
e) Wi-Fi-cellular handovers: Working extensions to theWi-Fi standard already address the issue of smooth han-dovers between Wi-Fi and cellular networks, including 3GPPAccess Network Discovery and Selection Function (ANDSF),Hotspot 2.0 initiative [16], and other techniques [17].
f) Voice traffic offloading: In this opportunistic connec-tion sharing scheme, voice traffic can be tunneled via the Wi-Ficonnection using the well-known Voice over Wi-Fi solutions,such as Wi-Fi certified Voice-Enterprise [18].

1320 IEEE/ACM TRANSACTIONS ON NETWORKING, VOL. 24, NO. 3, JUNE 2016
g) Incentives: Cellular network operators may providebilling based incentives to users for participating in thisopportunistic connection sharing scheme.
C. LimitationsBelow, we briefly mention two limitations of our trace-
driven simulation evaluations. First, our simulation basedevaluations cannot account for changes in traffic workloadresulting from different network conditions due to our pro-posed mitigation schemes. Second, they also cannot accountfor low-level dependencies between performance metrics andnetwork load. For example, some types of RRC failures areimpacted by interference, which in turn is a function of net-work load. Addressing these limitations requires experimentson operational cellular networks, which are beyond the scopeof this work. However, despite these limitations, we believethat the sheer magnitude of the improvements observed in oursimulations indicates that the mitigation schemes discussed inthis paper would accrue some benefit in practice.
VI. RELATED WORK
Cellular Performance Characterization: Cellular perfor-mance characterization have recently received much attentionby the research community. For example, small-scale studieshave characterized application performance [11], [19] andfairness [7]. Large-scale studies have characterized throughputand airtime [20], smartphone traffic [21], M2M device traffic[22], smartphone app traffic [23], [24], and heavy users [25].In contrast to these studies, we believe that we are the firstto analyze cellular performance changes specifically duringcrowded events. Erman and Ramakrishnan studied traffic char-acteristics of LTE cellular network of a large network operatorduring the 2013 Super Bowl [26]. Similar to our findings,they observed a spike in LTE traffic volume during the event.While they did not evaluate opportunistic connection sharingor radio network parameter tuning, they studied the feasibilityof trading-off delay for delay-tolerant applications to mitigatepeak congestion. Their results showed that 5 minute delaytolerance can achieve 25% reduction in peak usage.
Radio Network Parameter Tuning: Prior work on radionetwork parameter tuning study the impact of RRC timerson network performance and smartphone energy consumption.Most prior work is based on user-end measurements performedusing a few cellular devices. For instance, Liu et al. character-ized performance in a 1xEV-DO network using measurementsobtained from two laptops equipped with Sierra Wirelessdata cards [27]. Balasubramanian et al. proposed a UE basedapproach, called TailEnder, to alter traffic patterns based onthe prior knowledge of RRC state machine [28]. Some studiesare based on theoretical analysis and simulation. For instance,Liers et al. proposed a scheme to adaptively tune RRC timeoutparameters based on the demand and load situation, andvalidated it using simulations [29]. Yeh et al. proposed ascheme to tune RRC timeout parameters using analytical mod-els based on available radio resources, energy consumption,quality of service, and processing overheads of the radio accessnetwork [30]. Athivarapu et al. proposed a client-side solutionto mine program execution for optimizing radio state transitionparameters [31]. Qian et al. conducted trace-driven RRCstate machine simulations using network-end measurementsto investigate the optimality of RRC timeout parameters [8].
Furthermore, they proposed a client-side, application-awaretail optimization protocol to simultaneously optimize radioand energy resources [32]. Client-side solutions have accessto fine-grained information and are profiled for individualusers, thus they may achieve better performance. However,their implementation requires OS modification at clients andcooperation from cellular carriers, which may be prohibitivefor wide-scale adoption. In contrast to client-side solutions(e.g., [8], [28], [31], [32]), we focus on network-end tuningof RRC timeouts without any cooperation from UEs.
Opportunistic Connection Sharing: We build on exist-ing work on opportunistic traffic offloading [4], [5].Luo et al. proposed a unified architecture, where mobileclients use both 3G cellular link and Wi-Fi based peer-to-peer links for routing packets via peer-to-peer links to theappropriate destinations [4]. Han et al. proposed content-specific opportunistic communication scheme to offload cellu-lar traffic via Wi-Fi or Bluetooth [5]. However, neither of theseproposals were evaluated using real-world traces, and bothapproaches require architectural changes to network protocolsand hardware. Our work complements these proposals byshowing that their simplest and most practical instantiation —a simple one-hop connection sharing scheme that does notrequire architectural changes — can be very effective in real-life crowded events. To the best of our knowledge, this paperis the first to evaluate practical connection sharing techniqueson real-world traces.
VII. CONCLUSION
This paper presents the first performance characterizationof an operational cellular network during crowded events.We make three key contributions in this study based onthe real-world voice and data traces that we collected froma tier-1 cellular network in the United States during twohigh-profile crowded events in 2012. First, we measured howcellular network performance degrades during crowded eventsas compared to routine days. Second, we analyzed what causesthe observed performance degradation. Third, we evaluatedhow practical mitigation schemes for the observed perfor-mance degradation would perform in real-life crowded eventsusing trace-driven simulations. Our findings from this studyare crucial for cellular design, management, and optimizationduring crowded events. The measurement and modeling tech-niques developed in this paper are potentially useful for otherapplications as well [33]–[36].
REFERENCES
[1] (Jun. 2012). Actix Press Release. [Online]. Available:http://www.actix.com/sites/www.actix.com/files/Actix_Hotspots_Study_Findings.pdf.
[2] S. Lawson, Wireless Networks Are Near Capacity, accessed onJul. 2011. [Online]. Available: http://www.pcworld.com/businesscenter/article/235964/survey_wireless_networks_are_near_capacity.html.
[3] “Cisco visual networking index: Global mobile data traffic forecastupdate, 2010–2015,” Cisco, San Jose, CA, USA, White Paper, Feb. 2011.
[4] H. Luo, R. Ramjee, P. Sinha, L. Li, and S. Lu, “UCAN: A unifiedcellular and ad-hoc network architecture,” in Proc. ACM MobiCom,2003, pp. 353–367.
[5] B. Han et al., “Cellular traffic offloading through opportunistic commu-nications: A case study,” in Proc. 5th ACM Workshop Challenged Netw.,2010, pp. 31–38.
[6] Architecture Enhancements for Non-3GPP Accesses, accessed onSep. 2012. [Online]. Available: http://www.3gpp.org/ftp/Specs/html-info/23402.htm.

SHAFIQ et al.: CHARACTERIZING AND OPTIMIZING CELLULAR NETWORK PERFORMANCE DURING CROWDED EVENTS 1321
[7] V. Aggarwal, R. Jana, K. K. Ramakrishnan, J. Pang, andN. K. Shankaranarayanan, “Characterizing fairness for 3G wirelessnetworks,” in Proc. 18th IEEE Workshop LANMAN, Oct. 2011, pp. 1–6.
[8] F. Qian et al., “Characterizing radio resource allocation for 3G net-works,” in Proc. 10th ACM IMC, 2010, pp. 137–150.
[9] H. Jiang and C. Dovrolis, “Passive estimation of TCP round-trip times,”ACM SIGCOMM Comput. Commun. Rev., vol. 32, no. 3, pp. 75–88,2002.
[10] (Jun. 2013). Ericsson Mobility Report. [Online]. Available:http://www.ericsson.com/mobility-report.
[11] J. Huang et al., “Anatomizing application performance differences onsmartphones,” in Proc. ACM MobiSys, 2010, pp. 165–178.
[12] J. Sommers and P. Barford, “Cell vs. WiFi: On the performance of metroarea mobile connections,” in Proc. ACM IMC, 2012, pp. 301–314.
[13] P. P. C. Lee, T. Bu, and T. Woo, “On the detection of signaling DoSattacks on 3G wireless networks,” in Proc. IEEE INFOCOM, May 2007,pp. 1289–1297.
[14] R. S. Bivand, E. Pebesma, and V. Gómez-Rubio, Applied Spatial DataAnalysis With R. New York, NY, USA: Springer-Verlag, 2008.
[15] A. Schulman et al., “Bartendr: A practical approach to energy-awarecellular data scheduling,” in Proc. ACM MobiCom, 2010, pp. 85–96.
[16] B. Orlandi and F. Scahill, “Wi-Fi roaming—Building on ANDSF andHotspot2.0,” Alcatel-Lucent, Boulogne-Billancourt, France, Tech. Rep.,2012.
[17] Offload Service, accessed on Apr. 2016. [Online]. Available:http://www.devicescape.com/offload-service.
[18] “Wi-Fi CERTIFIED Voice-Enterprise: Delivering Wi-Fi voice to theenterprise,” Wi-Fi Alliance, White Paper, May 2012.
[19] M. P. Wittie, B. Stone-Gross, K. C. Almeroth, and E. M. Belding,“MIST: Cellular data network measurement for mobile applications,”in Proc. IEEE BROADNETS, Sep. 2007, pp. 743–751.
[20] U. Paul, A. P. Subramanian, M. M. Buddhikot, and S. R. Das, “Under-standing traffic dynamics in cellular data networks,” in Proc. IEEEINFOCOM, Apr. 2011, pp. 882–890.
[21] M. Z. Shafiq, L. Ji, A. X. Liu, and J. Wang, “Characterizing andmodeling Internet traffic dynamics of cellular devices,” in Proc. ACMSIGMETRICS, 2011, pp. 305–316.
[22] M. Z. Shafiq, L. Ji, A. X. Liu, J. Pang, and J. Wang, “A first lookat cellular machine-to-machine traffic: Large scale measurement andcharacterization,” in Proc. ACM SIGMETRICS/PERFORMANCE, 2012,pp. 65–76.
[23] M. Z. Shafiq, L. Ji, A. X. Liu, J. Pang, and J. Wang, “Characterizinggeospatial dynamics of application usage in a 3G cellular data network,”in Proc. IEEE INFOCOM, Mar. 2012, pp. 1341–1349.
[24] Q. Xu et al., “Identifying diverse usage behaviors of smartphone apps,”in Proc. ACM IMC, 2011, pp. 329–344.
[25] A. Botta, A. Pescape, G. Ventre, E. Biersack, and S. Rugel, “Perfor-mance footprints of heavy-users in 3G networks via empirical measure-ment,” in Proc. 8th Int. Symp. Modeling Optim. Mobile, Ad Hoc WirelessNetw. (WiOpt), May/Jun. 2010, pp. 330–335.
[26] J. Erman and K. K. Ramakrishnan, “Understanding the super-sizedtraffic of the super bowl,” in Proc. ACM IMC, 2013, pp. 353–360.
[27] X. Liu, A. Sridharan, S. Machiraju, M. Seshadri, and H. Zang, “Expe-riences in a 3G network: Interplay between the wireless channel andapplications,” in Proc. ACM MobiCom, 2008, pp. 211–222.
[28] N. Balasubramanian, A. Balasubramanian, and A. Venkataramani,“Energy consumption in mobile phones: A measurement study andimplications for network applications,” in Proc. ACM IMC, 2009,pp. 280–293.
[29] F. Liers and A. Mitschele-Thiel, “UMTS data capacity improvementsemploying dynamic RRC timeouts,” in Proc. IEEE 16th Int. Symp. Pers.,Indoor Mobile Radio Commun. (PIMRC), Sep. 2005, pp. 2186–2190.
[30] J.-H. Yeh, J.-C. Chen, and C.-C. Lee, “Comparative analysis of energy-saving techniques in 3GPP and 3GPP2 systems,” IEEE Trans. Veh.Technol., vol. 58, no. 1, pp. 432–438, Jan. 2009.
[31] P. K. Athivarapu et al., “RadioJockey: Mining program executionto optimize cellular radio usage,” in Proc. ACM MobiCom, 2012,pp. 101–112.
[32] F. Qian et al., “TOP: Tail optimization protocol for cellular radioresource allocation,” in Proc. 18th IEEE ICNP, Oct. 2010, pp. 285–294.
[33] Z. Pan, Y. Zhang, and S. Kwong, “Efficient motion and disparityestimation optimization for low complexity multiview video coding,”IEEE Trans. Broadcast., vol. 61, no. 2, pp. 166–176, Jun. 2015.
[34] X. Wen, L. Shao, Y. Xue, and W. Fang, “A rapid learning algorithm forvehicle classification,” Inf. Sci., vol. 295, no. 1, pp. 395–406, 2015.
[35] J. Qiao et al., “Enabling device-to-device communications in millimeter-wave 5G cellular networks,” IEEE Commun. Mag., vol. 53, no. 1,pp. 209–215, Jan. 2015.
[36] W. Du, W. Jia, G. Wang, and W. Lu, “Analysis of channel allocationscheme for wireless cellular networks,” Int. J. Ad Hoc UbiquitousComput., vol. 4, nos. 3–4, pp. 201–209, 2009.
M. Zubair Shafiq received the Ph.D. degree fromMichigan State University in 2014. He is cur-rently an Assistant Professor of Computer Sciencewith The University of Iowa. His research inter-ests include networking, security, and privacy.He received the 2012 IEEE ICNP Best Paper Awardand the 2013 Fitch-Beach Outstanding GraduateResearch Award at Michigan State University.
Lusheng Ji received the Ph.D. degree in computerscience from the University of Maryland, CollegePark, in 2001. He is currently a Principal TechnicalStaff Member with AT&T Laboratories–Research,Bedminster, NJ, USA. His research interests includewireless networking, mobile computing, wirelesssensor networks, and networking security. He is aSenior Member of the IEEE.
Alex X. Liu received the Ph.D. degree in computerscience from The University of Texas at Austinin 2006. His research interests focus on network-ing and security. He received the IEEE and IFIPWilliam C. Carter Award in 2004, the National Sci-ence Foundation CAREER Award in 2009, and theMichigan State University Withrow DistinguishedScholar Award in 2011. He also received bestpaper awards from ICNP-2012, SRDS-2012, andLISA-2010. He is an Associate Editor of theIEEE/ACM TRANSACTIONS ON NETWORKING, an
Editor of the IEEE TRANSACTIONS ON DEPENDABLE AND SECURE COM-PUTING, and an Area Editor of Computer Communications.
Jeffrey Pang received the Ph.D. degree in com-puter science from Carnegie Mellon Universityin 2009. He is currently a Researcher with AT&TLaboratories–Research. He builds systems to mea-sure and optimize cellular networks. His researchinterests include networking, mobile systems,distributed systems, and privacy.
Shobha Venkataraman received the Ph.D. degreein computer science from Carnegie Mellon Univer-sity in 2008. She is currently a Researcher withAT&T Laboratories–Research. Her main researchinterests span computer security, networking, andsystems problems using techniques from machinelearning, data mining, and algorithm design.
Jia Wang received the Ph.D. degree in computerscience from Cornell University in 2001. She hasbeen with AT&T Laboratories–Research since 2001,where she is currently a Principal Technical StaffMember with the Network Measurement and Engi-neering Research Department. Her research inter-ests focus on network measurement and manage-ment, network security, performance analysis andtroubleshooting, IPTV, social networks, and cellularnetworks.