13 solar performance mapping and operational yield forecasting, patrick sachon
TRANSCRIPT
© Crown copyright Met Office
Solar Performance Mapping and Operational Yield Forecasting
Supported by Innovate UK
The thing is that

Commercial-in-confidence
Project Overview
Virtual Met Mast™report for
Greater Knoll
August 2011
• A collaborative project led by the BRE National Solar Centre, partnering with Met Office and Exeter University, commenced in Summer 2014.
• This project is using meteorological and satellite data from the Met Office in combination with electricity generation data from UK wide solar photovoltaic (PV) installations from the NSC to develop:
• accurate geographical representations of solar generation across the UK (performance mapping) • short term forecasting of UK radiation levels and solar generation from utility scale solar plants (operational yield forecasting).
• The project is combining environmental data sets with recent UK solar generation data to enable these services.

Commercial-in-confidence
Solar Performance Mapping
Virtual Met Mast™report for
Greater Knoll
August 2011
• Current performance mapping outputs available to the industry use differing data sets, some contain old data and are lacking in granularity. Therefore estimates of solar resource differ widely.
• Most of the industry is seeing better performance of panels in comparison with estimates of resource.
• This project is using live generation data from solar parks and roofs in a number of regions to compare with estimates of solar radiation derived from observations, models and satellites.
• The project will provide information about accuracy of existing datasets and potentially new mapping methodology.

Commercial-in-confidence
Solar Performance Mapping
Virtual Met Mast™report for
Greater Knoll
August 2011
Currently Available Maps

Commercial-in-confidence
Solar Performance Mapping
Virtual Met Mast™report for
Greater Knoll
August 2011
Project focussed on historic data collection from predominantly large solar farms in three main regions:
- Cornwall- Oxfordshire:-Norfolk

Commercial-in-confidence
Solar Performance Mapping
Virtual Met Mast™report for
Greater Knoll
August 2011
Data Analysis
• Initial comparison of satellite and surface irradiance maps indicates:
• a range of measurements between 25% lower and 55% higher than the surface measurements • on average 8% higher values given by the Satellite dataset.
• The next stage will be to analyse the data provided via the project contributors and compare to the outputs shown to the right.

Commercial-in-confidence
Operational Yield Forecasting
Virtual Met Mast™report for
Greater Knoll
August 2011
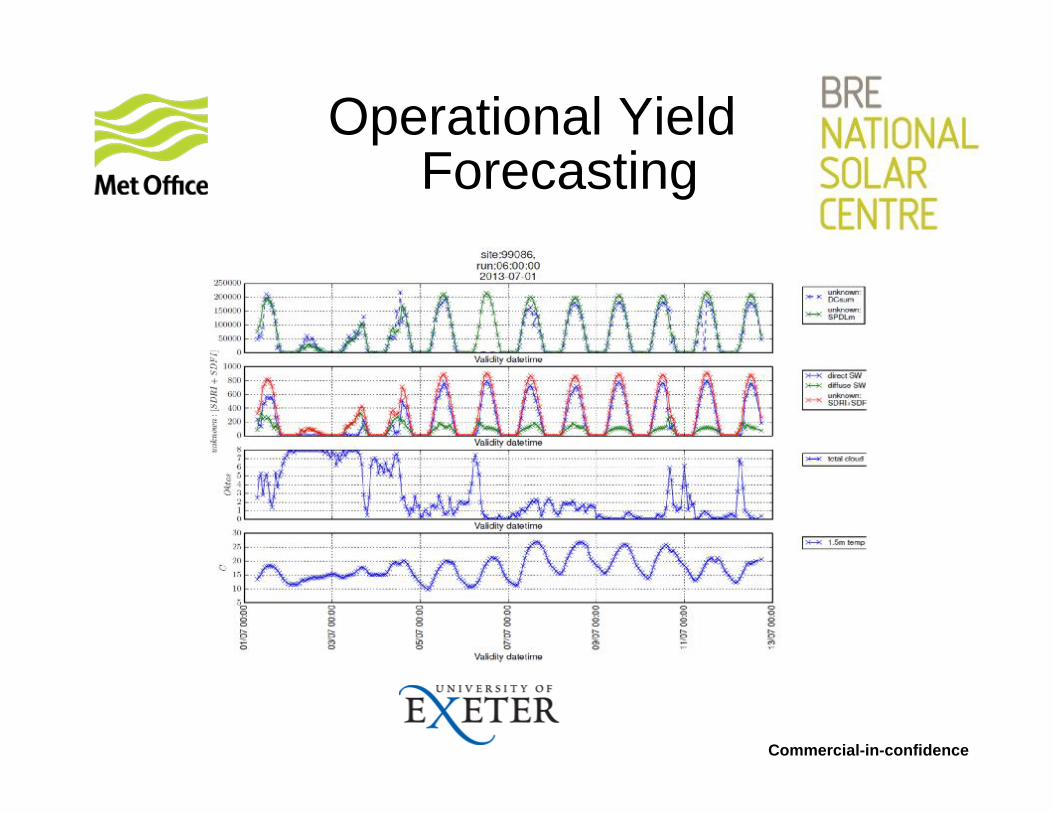
• Existing numerical weather prediction models include radiation modelling but are not tuned well to fit with solar industry needs.
• Accurate short term solar forecasting is becoming of increasing importance for accurate yield estimate and prediction.
• This project will aim to develop accurate solar forecasts by using numerical weather prediction models to produce accurate solar generation forecasts. Live solar panel data will be used in conjunction with the forecast information to produce predictions in the 0-36 hour range.
• Improved numerical weather prediction outputs will be beneficial to all providers of forecast information.
• Trial forecasts will be made available to project participants for the duration of the project.

Commercial-in-confidence
Operational Yield Forecasting
Virtual Met Mast™report for
Greater Knoll
August 2011
Global– 25km 70 Levels – 48hr forecast twice/day– 144hr forecast twice/day
UKV– 1.5km 70 Levels – 36hr forecast eight times/day
Euro4– 4km 70 Levels– 60hr forecast twice/day– 120hr forecast twice/day

With Met Office and University of ExeterOutput B) Short term yield forecasting
IEA PVPS (2013) Photovoltaic and Solar Forecasting: State of the Art
Operational Yield Forecasting
Commercial-in-confidence
Operational Yield Forecasting
Virtual Met Mast™report for
Greater Knoll
August 2011
Commercial-in-confidence
Current Analysis Ongoing
Virtual Met Mast™report for
Greater Knoll
August 2011
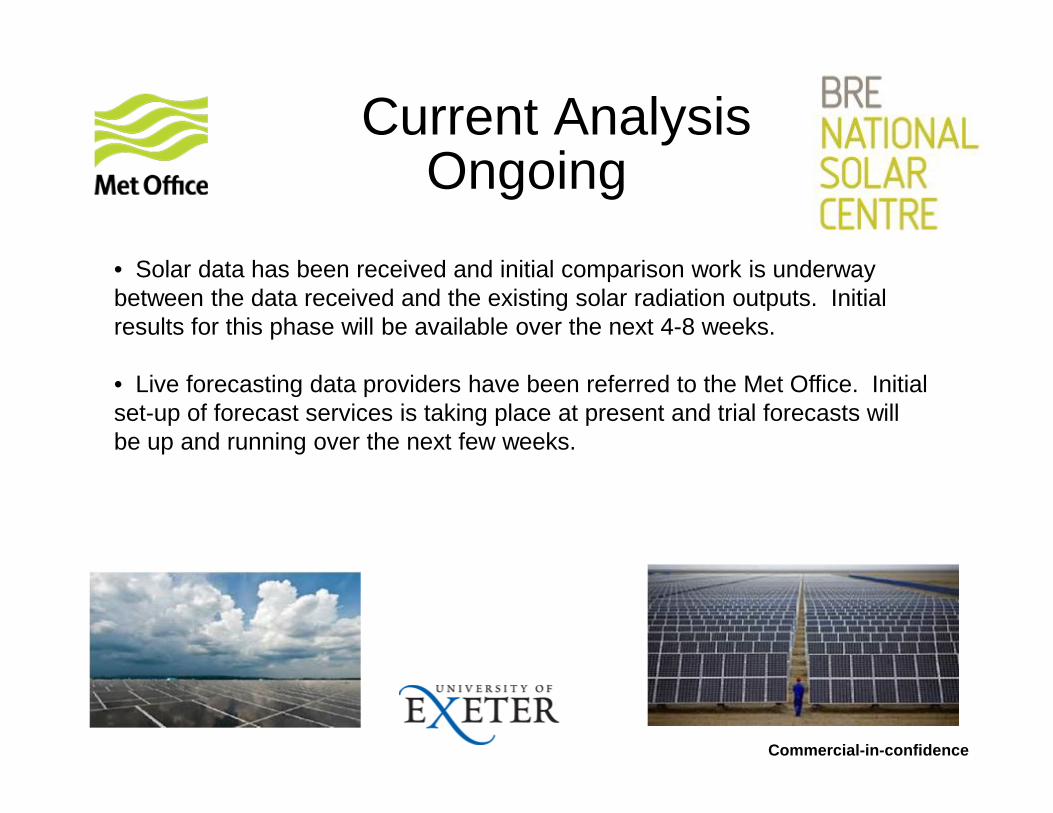
• Solar data has been received and initial comparison work is underway between the data received and the existing solar radiation outputs. Initial results for this phase will be available over the next 4-8 weeks.
• Live forecasting data providers have been referred to the Met Office. Initial set-up of forecast services is taking place at present and trial forecasts will be up and running over the next few weeks.

Commercial-in-confidence
Next Steps . . .
Virtual Met Mast™report for
Greater Knoll
August 2011
• Project will run for 12 months until June 2015.
• Initial results will shortly be available.
• We are very keen to hear from those with solar assets, either farms, or rooftop generation sites and is also keen to understand your needs right across the solar industry. Today’s workshop is a key part of that.
• Further projects and funding streams are being investigated to extend the capability further.
For more information please come and talk to us.
Solar Performance Mapping and Operational Yield Forecasting
Supported by Innovate UK

© Crown copyright Met OfficeSolar Workshop
-Patrick Sachon
© Crown copyright Met Office
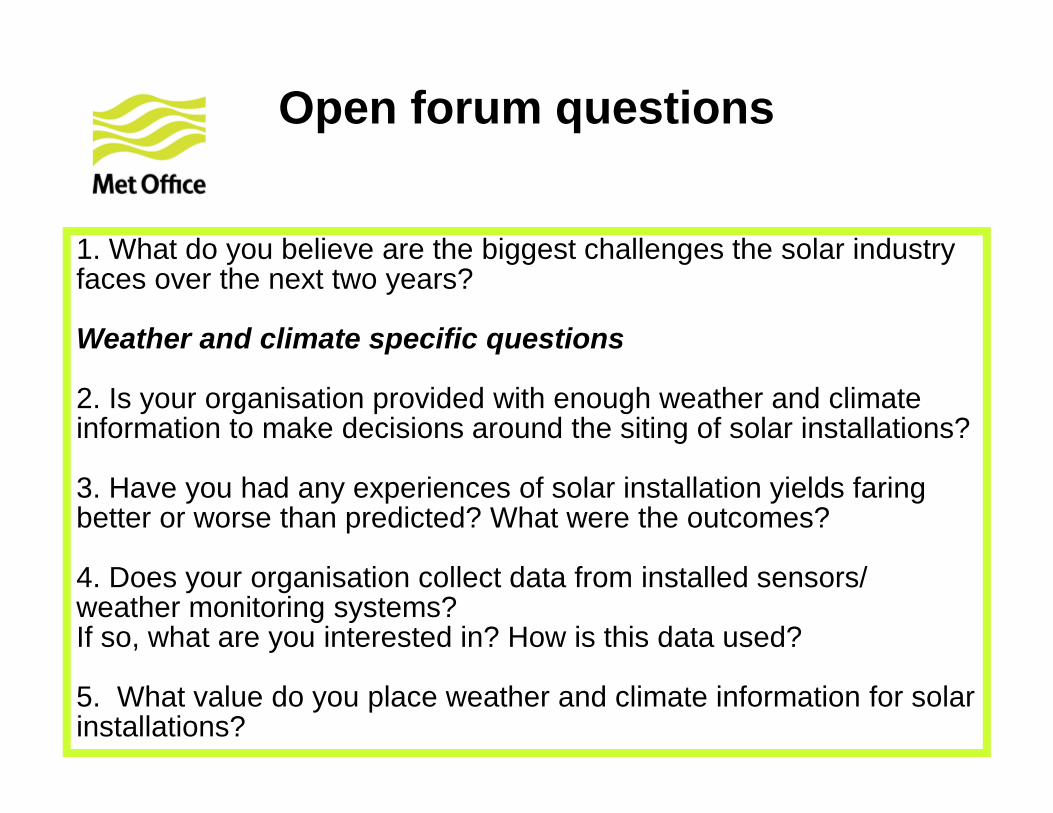
Open forum questions
1. What do you believe are the biggest challenges the solar industry faces over the next two years?
Weather and climate specific questions
2. Is your organisation provided with enough weather and climate information to make decisions around the siting of solar installations?
3. Have you had any experiences of solar installation yields faring better or worse than predicted? What were the outcomes?
4. Does your organisation collect data from installed sensors/ weather monitoring systems? If so, what are you interested in? How is this data used?
5. What value do you place weather and climate information for solar installations?