12/21/2013 evidence that you can get rich through stock investing by shawn allen, cfa, cma, mba,...
TRANSCRIPT

12/21/201312/21/2013
Evidence That You Can Get Rich Through Stock Investing
By Shawn Allen, CFA, CMA, MBA, P.Eng.President, InvestorsFriend Inc.

12/21/201312/21/2013
Growth of $1000
Return 10 years 20 years 30 years 40 years 50 years
-2.0% 817 668 545 446 364
0.0% 1,000 1,000 1,000 1,000 1,000
2.0% 1,219 1,486 1,811 2,208 2,692
4.0% 1,480 2,191 3,243 4,801 7,107
6.0% 1,791 3,207 5,743 10,286 18,420
8.0% 2,159 4,661 10,063 21,725 46,902
10.0% 2,594 6,727 17,449 45,259 117,391
12.0% 3,106 9,646 29,960 93,051 289,002
14.0% 3,707 13,743 50,950 188,884 700,233

12/21/201312/21/2013
Growth of $6000 per year
Return 10 years 20 years 30 years 40 years 50 years
-2.0% 54,878 99,718 136,355 166,290 190,749
0.0% 60,000 120,000 180,000 240,000 300,000
2.0% 65,698 145,784 243,408 362,412 507,476
4.0% 72,037 178,668 336,510 570,153 916,003
6.0% 79,085 220,714 474,349 928,572 1,742,015
8.0% 86,919 274,572 679,699 1,554,339 3,442,621
10.0% 95,625 343,650 986,964 2,655,555 6,983,451
12.0% 105,292 432,315 1,447,996 4,602,549 14,400,109
14.0% 116,024 546,150 2,140,721 8,052,151 29,967,128

12/21/201312/21/2013
Stocks, Bonds, Bills, Gold and Inflation
Historic Real (After Inflation) Returns

12/21/201312/21/2013
19
25
19
28
19
31
19
34
19
37
19
40
19
43
19
46
19
49
19
52
19
55
19
58
19
61
19
64
19
67
19
70
19
73
19
76
19
79
19
82
19
85
19
88
19
91
19
94
19
97
20
00
20
03
20
06
20
09
$0
$50
$100
$150
$200
$250
$300
$350
Total Real Returns, Large Stocks, Long Treasuries, T-Bills, The Dollar and Gold 1926 - 2011
Large Stocks
Long Treasury Bonds
T-Bills
The Dollar
Gold

12/21/201312/21/2013
19
25
19
28
19
31
19
34
19
37
19
40
19
43
19
46
19
49
19
52
19
55
19
58
19
61
19
64
19
67
19
70
19
73
19
76
19
79
19
82
19
85
19
88
19
91
19
94
19
97
20
00
20
03
20
06
20
09
0.0
0.1
1.0
10.0
100.0
1,000.0
Total Real Returns, Large Stocks, Long Treasuries, T-Bills, The Dollar and Gold 1926 - 2011
Large Stocks Long Treasury Bonds T-Bills The Dollar
Gold
12/21/201312/21/2013
19
25
19
26
19
27
19
28
19
29
19
30
19
31
19
32
19
33
19
34
19
35
19
36
19
37
19
38
19
39
19
40
19
41
19
42
19
43
19
44
19
45
$0.00
$1.00
$2.00
$3.00
$4.00
$5.00
$6.00
$7.00
$8.00
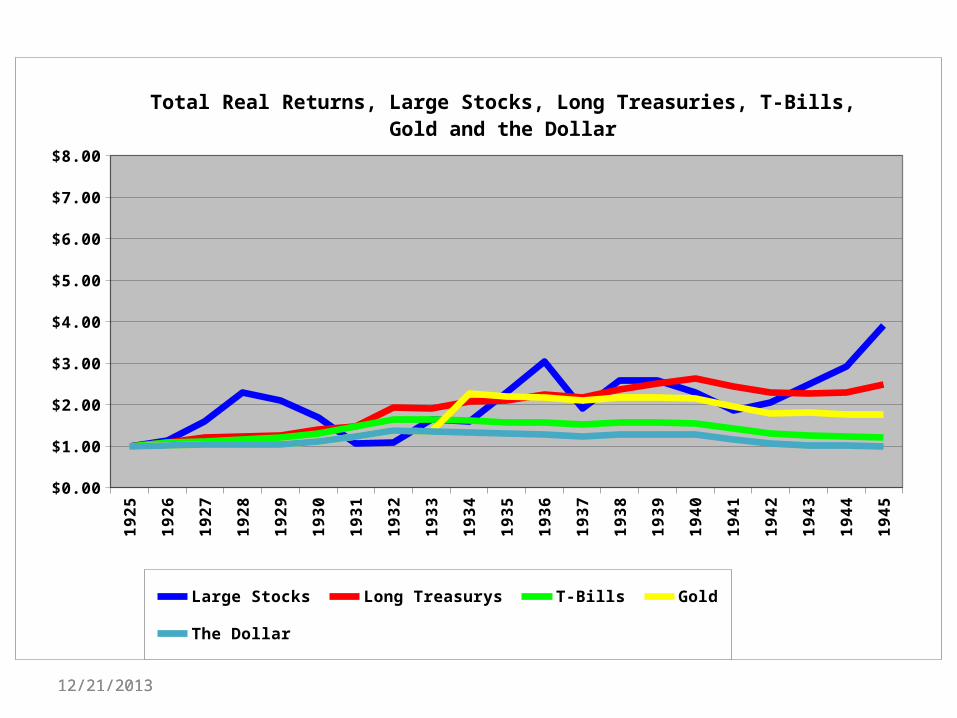
Total Real Returns, Large Stocks, Long Treasuries, T-Bills, Gold and the Dol-lar
Large Stocks Long Treasurys T-Bills Gold The Dollar

12/21/201312/21/2013
19
45
19
46
19
47
19
48
19
49
19
50
19
51
19
52
19
53
19
54
19
55
19
56
19
57
19
58
19
59
19
60
19
61
19
62
19
63
19
64
19
65
$0.00
$1.00
$2.00
$3.00
$4.00
$5.00
$6.00
$7.00
$8.00
Total Real Returns, Large Stocks, Long Treasuries, T-Bills, Gold and the Dol-lar
Large Stocks Long Treasurys T-Bills Gold
The Dollar

12/21/201312/21/2013
19
65
19
66
19
67
19
68
19
69
19
70
19
71
19
72
19
73
19
74
19
75
19
76
19
77
19
78
19
79
19
80
19
81
19
82
19
83
19
84
19
85
$0.00
$1.00
$2.00
$3.00
$4.00
$5.00
$6.00
$7.00
$8.00
Total Real Returns, Large Stocks, Long Treasuries, T-Bills, Gold and the Dollar
Large Stocks Long Treasurys T-Bills Gold
The Dollar

12/21/201312/21/2013
19
85
19
86
19
87
19
88
19
89
19
90
19
91
19
92
19
93
19
94
19
95
19
96
19
97
19
98
19
99
20
00
20
01
20
02
20
03
20
04
20
05
$0.00
$1.00
$2.00
$3.00
$4.00
$5.00
$6.00
$7.00
$8.00
Total Real Returns, Large Stocks, Long Treasuries, T-Bills, Gold and the Dollar
Large Stocks Long Treasurys T-Bills Gold
The Dollar

12/21/201312/21/2013
19
99
20
00
20
01
20
02
20
03
20
04
20
05
20
06
20
07
20
08
20
09
20
10
20
11
$0.00
$1.00
$2.00
$3.00
$4.00
$5.00
$6.00
$7.00
$8.00
Total Real Returns, Large Stocks, Long Treasuries, T-Bills, Gold and the Dol-lar
Large Stocks Long Treasurys T-Bills Gold
The Dollar

12/21/201312/21/2013
1955
1957
1959
1961
1963
1965
1967
1969
1971
1973
1975
1977
1979
1981
1983
1985
1987
1989
1991
1993
1995
1997
1999
2001
2003
2005
2007
2009
2011
-4%
-2%
0%
2%
4%
6%
8%
10%
12%
30 Year Compounded Annual Real Returns - For 30 Year Periods Ending 1955 Through 2011
Large Stock Return Long Treasury Total Return T-Bills

12/21/201312/21/2013
Stocks Returns Over 30 Years
• Real Returns, after 30 years, over and above inflation, were always over 4% and sometimes over 8%.
• At 4% real, purchasing power doubles every 18 years (quadruples in 36 years). At 8% it doubles every 9 years (16 times in 36 years).
• But what about volatility along the way?• The returns were NOT steady year after year.

12/21/201312/21/2013
100% equities $6000 per year invested

12/21/201312/21/2013
Balanced 60% equities, 35% Corporate Bonds, 5% Cash $6000 per year invested
1 2 3 4 5 6 7 8 9 10 11 12 13 14 15 16 17 18 19 20 21 22 23 24 25 26 27 28 29 30$0
$200,000
$400,000
$600,000
$800,000
$1,000,000
$1,200,000
$1,400,000
Real Dollar Growth of $6000 per year savings (inflation adjusted)57 30-year scenarios starting in 1926 through1982
Year After Start of Savings

12/21/201312/21/2013
30 Year Ending Portfolio Values
26
27
28
29
30
31
32
33
34
35
36
37
38
39
40
41
42
43
44
45
46
47
48
49
50
51
52
53
54
55
56
57
58
59
60
61
62
63
64
65
66
67
68
69
70
71
72
73
74
75
76
77
78
79
80
81
82
$0
$200,000
$400,000
$600,000
$800,000
$1,000,000
$1,200,000
$1,400,000
Ending Portfolio Value for All 30-year savings scenarios beginning in 1926, '27 etc. to '82
6k per year all equity 6k per year 100% Bonds 6k per year 60/35/5
Year Savings Started

12/21/201312/21/2013
40 Year Ending Portfolio Values
2627282930313233343536373839404142434445464748495051525354555657585960616263646566676869707172$0
$500,000
$1,000,000
$1,500,000
$2,000,000
$2,500,000
Ending Portfolio Value for All 40-year savings scenarios beginning in 1926, '27 etc. to '72
6k per year all equity 6k per year 60/35/5 6k per year 100% Bonds
Year Savings Started

12/21/201312/21/2013
50 Year Ending Portfolio Values
26 27 28 29 30 31 32 33 34 35 36 37 38 39 40 41 42 43 44 45 46 47 48 49 50 51 52 53 54 55 56 57 58 59 60 61 62$0
$500,000
$1,000,000
$1,500,000
$2,000,000
$2,500,000
$3,000,000
$3,500,000
$4,000,000
$4,500,000
$5,000,000
Ending Portfolio Value for All 50-year savings scenarios beginning in 1926, '27 etc. to '62
6k per year all equity 6k per year 60/35/5 6k per year 100% Bonds
Year Savings Started

12/21/201312/21/2013
4% Withdrawal from $1 million portfolio over 30 years
The Safe Withdrawal Rate

12/21/201312/21/2013
100% equities, $40,000 per year withdrawn from $1 million to start

12/21/201312/21/2013
60% equities, 35% Corporate Bonds, 5% Cash $40,000 per year withdrawn

12/21/201312/21/2013
Retirement Ending Portfolio Values
26
27
28
29
30
31
32
33
34
35
36
37
38
39
40
41
42
43
44
45
46
47
48
49
50
51
52
53
54
55
56
57
58
59
60
61
62
63
64
65
66
67
68
69
70
71
72
73
74
75
76
77
78
79
80
81
82
$0
$1,000,000
$2,000,000
$3,000,000
$4,000,000
$5,000,000
$6,000,000
$7,000,000
$8,000,000
Ending Portfolio Value for All 30-year $ 1 million retirement scenarios beginning in 1926, '27 etc. to '82
All equity, $40k withdrawalBalanced 60/35/5, $40k withdrawal
Year Savings Started

12/21/201312/21/2013
19
55
19
57
19
59
19
61
19
63
19
65
19
67
19
69
19
71
19
73
19
75
19
77
19
79
19
81
19
83
19
85
19
87
19
89
19
91
19
93
19
95
19
97
19
99
20
01
20
03
20
05
20
07
20
09
20
11
0%
2%
4%
6%
8%
10%
12%
14%
16%
Rolling 30 Year Returns - Nominal - For 30 Year Periods Ending 1955 Through 2011
Stock Returns Long Government Bond Total Returns

12/21/201312/21/2013
19
55
19
57
19
59
19
61
19
63
19
65
19
67
19
69
19
71
19
73
19
75
19
77
19
79
19
81
19
83
19
85
19
87
19
89
19
91
19
93
19
95
19
97
19
99
20
01
20
03
20
05
20
07
20
09
20
11
0%
2%
4%
6%
8%
10%
12%
14%
16%
Rolling 30 Year Nominal Returns - For 30 Year Periods Ending 1955 Through 2011
Stock Returns Long Gov. Bond Total Returns Starting Bond Yield

12/21/201312/21/2013
19
55
19
57
19
59
19
61
19
63
19
65
19
67
19
69
19
71
19
73
19
75
19
77
19
79
19
81
19
83
19
85
19
87
19
89
19
91
19
93
19
95
19
97
19
99
20
01
20
03
20
05
20
07
20
09
20
11
20
13
20
15
20
17
20
19
20
21
20
23
20
25
20
27
20
29
20
31
20
33
20
35
20
37
20
39
20
41
0%
2%
4%
6%
8%
10%
12%
14%
16%
Rolling 30 Year Nominal Returns - For 30 Year Periods Ending 1955 Through 2041
Stock Returns Long Government Bond Total Returns
Starting Bond Yield

12/21/201312/21/2013
19
45
19
48
19
51
19
54
19
57
19
60
19
63
19
66
19
69
19
72
19
75
19
78
19
81
19
84
19
87
19
90
19
93
19
96
19
99
20
02
20
05
20
08
20
11
20
14
20
17
20
20
20
23
20
26
20
29
20
32
20
35
20
38
20
41
0%
2%
4%
6%
8%
10%
12%
14%
16%
18%
20%
Rolling 20 Year Returns - For 20 Year Periods Ending 1945 Through 2031
Stock Returns Bond Total Returns Starting Bond Yield

12/21/201312/21/2013
Estimating Long Term Stock and Bond Returns
• Long Term Stock Returns approximate:– Real GDP growth, plus inflation, plus Dividend
yield– What is the current estimate of this?
• Long Term Long Bond Returns approximate:– The yield on long term bonds at the start of the
period– What is the current estimate of this?

12/21/201312/21/2013
20
11
20
08
20
05
20
02
19
99
19
96
19
93
19
90
19
87
19
84
19
81
19
78
19
75
19
72
19
69
19
66
19
63
19
60
19
57
19
54
19
51
19
48
19
45
19
42
19
39
19
36
19
33
19
30
$10
$100
$1,000
$10,000
$100,000
$0
$1
$10
$100
$1,000
S&P Earnings $ versus U.S. GDP billions 1929- 2011
US GDP billions $ S&P Annual Earnings $

12/21/201312/21/2013
Will The Stock Market Rise in 2013?
• I don’t know…• Neither does anyone else• It’s not a useful question• Ask instead, is the stock market fairly valued at
this time so that it can rationally be expected to be a good long-term investment?
• Ask instead also if you can find any individual stocks that seem likely to provide a good return

12/21/201312/21/2013
Will Stocks Beat bonds over the next 20 years?
• Almost certainly, yes• A 20-year Canadian government bond purchased
today will earn about 2.2%. • A high grade corporate bond will earn an additional
1.4% or so, for a total 3.6%.• This is before taxation and inflation• Stock indexes will likely earn an amount equal to
their dividend yield plus real GDP plus inflation. Reasonable estimates for this are in the 6 to 7% range as an average, but certainly not every year.

12/21/201312/21/2013
Yield Adj. ROE P/B
Adj. P/E Company
$ CAN Price at this update
Portfolio Percent
2.6% 12.7% 1.3 10.6 Wells Fargo 33.74 12.4%
1.7% 12.0% 1.3 11.2 Canadian Tire 71.79 12.3%
2.8% 8.7% 0.8 10.0 Melcor 15.65 12.1%
0.0% 7.1% 1.2 18.2 Berkshire Hathaway 86.56 8.8%
0.4% 4.3% 0.5 11.1 Bank of America 9.81 7.9%
2.2% 14.0% 1.9 13.8 Canadian Western Bank 29.36 5.0%
4.5% 22.4% 2.7 13.3 Shaw Communications 21.43 5.4%
1.6% 17.8% 2.6 15.1 Stantec 37.11 4.7%
0.0% 2.6% 2.0 79.0 Toll Brothers 32.06 3.4%
6.1% 10.5% 1.9 17.1 Boston Pizza Royalties 19.30 3.1%
3.4% 70.4% 9.6 17.5 Constellation Software 115.49 2.9%
2.7% 117% 18.4 8.6 Bombardier 3.70 0.9%
2.7% 41.7% 3.9 10.7 MicroSoft 29.37 1.7%
Other Equities 1.2%
0.0% 0.0% 1.0 - Cash 1.00 18.1%

12/21/201312/21/2013
Can You and Your Family Get Rich By Investing in Stocks?
Absolutely, yes, but it takes a long time and it requires a reasonable
savings level

12/21/201312/21/2013
When Should You Start a Long-Term Savings Plan?
Best time, about 50 years ago…Best available time… Right Now!