12 - office of the comptroller city of new york · examples of wide disparities among new york city...
TRANSCRIPT

policy report
March 2009 2
www.comptroller.nyc.gov
CONTENTS
Overview . . . . . . . . . . . . . . . . . . . . . . . . . . . . . . . . . . . . . . . . . . . . . . . . . . . . . . . . . . . . . . . . . . . . . . . . . . . . . . . 1
Summary of findings . . . . . . . . . . . . . . . . . . . . . . . . . . . . . . . . . . . . . . . . . . . . . . . . . . . . . . . . . . . . . . . . . . . . . . 1
I. NYPORTS: A Potentially Effective Tool for Patient Safety and Hospital Quality Improvement . . . . . . . . . . . . . . . . . . . . . . . . . . . . . . . . . . . . . . . . . . . . . . . . . . . . . . . . .5
II. Under-Enforcement Has Allowed for Incomplete Reporting. . . . . . . . . . . . . . . . . . . . . . . . . . . . . . . . . . . .7
A. There have been very large reporting disparities among regions and individual hospitals within regions . . . . . . . . . . . . . . . . . . . . . . . . . . . . . . . . . . . . . . . . . .7 B. Reasons for wide NYPORTS reporting disparities . . . . . . . . . . . . . . . . . . . . . . . . . . . . . . . . . . . . . . .12
C. NYPORTS’ scope has been reduced. . . . . . . . . . . . . . . . . . . . . . . . . . . . . . . . . . . . . . . . . . . . . . . . . . 22
III. NYPORTS Can Help Avoid Unnecessary Costs for the Healthcare System. . . . . . . . . . . . . . . . . . . . . . . . . . . . . . . . . . . . . . . . . . . . . . . . . . . . . . . . . . . . . . . . . . . . 24
IV. Recommendations. . . . . . . . . . . . . . . . . . . . . . . . . . . . . . . . . . . . . . . . . . . . . . . . . . . . . . . . . . . . . . . . . . . . 27
Appendix A, Number of NYPORTS Reports by Occurrence Code, 2004 to 2007. . . . . . . . . . . . . . . . . . . . . . . . . . . . i
Appendix B, Evolution of NYPORTS and Current Reporting Requirements . . . . . . . . . . . . . . . . . . . . . . . . . . . . . .iv
Appendix C, Analysis of Reporting by Occurrence Code . . . . . . . . . . . . . . . . . . . . . . . . . . . . . . . . . . . . . . . . . . . vi
Appendix D, Analysis of Medication Error Reporting. . . . . . . . . . . . . . . . . . . . . . . . . . . . . .. . . . . . . . . . . . . . . . xvi
Appendix E, Review of Risk Factors and Code 401, 402, and 808 Reporting Disparities. .. . . . . . . . . . . . . . . . . . .xx
William C. Thompson, Jr. Gayle M. Horwitz Danica Gallagher New York City Comptroller First Deputy Comptroller Assistant Comptroller for Policy & Communications
Glenn von Nostitz Joan Westmeyer Susan Scheer Director of Policy Management Policy Liaison Assistant Director of Policy Management

policy report
March 2009 1
www.comptroller.nyc.gov
Overview
In 1999, a groundbreaking report issued by the Institute of Medicine (IOM) of the National Academies, To Err is Human: Building a Safer Health System, concluded that medical errors in hospitals were responsible for as many as 98,000 deaths annually in the United States. The extra health care cost associated with these medical errors was calculated at $29 billion a year.
To make New York State hospitals safer, in 1998 the New York State Department of Health (DOH) developed a system for reporting and tracking adverse medical events in hospitals, the New York Patient Occurrence and Tracking System (NYPORTS). For purposes of NYPORTS reporting by hospitals, DOH considers an occurrence (also known as an incident or adverse event) to be “an unintended adverse and undesirable development in an individual patient’s condition that was not caused by the natural course of illness, disease or proper treatment.” Occurrences lead to longer hospital stays and higher health care costs, not to mention more suffering for patients.
DOH has emphasized that accurate and complete reporting of occurrences is essential if NYPORTS is to accomplish its goal of improving quality of care. Without the fullest possible reporting, hospitals cannot identify areas where systemic improvement may be needed nor use the NYPORTS web site to compare their performance against their peers. And without full reporting, DOH cannot be assured that it is informed of a wide array of emerging quality and safety issues at individual facilities and across the hospital community. We found that, unfortunately, this assurance cannot be provided.
Summary of findings
• Some hospitals report occurrences at rates up to 20 times greater than rates at comparable hospitals. In 2001, DOH found wide NYPORTS reporting disparities among regions of the State. They concluded that this was due primarily to underreporting by hospitals in some regions, particularly New York City. Notwithstanding promises by DOH to take action against underreporting, regional disparities have continued and there are enormous and inexplicable disparities among individual hospitals. Within New York City, for example, in 2006 one small hospital reported 111.3 occurrences per 10,000 patient discharges, while another comparably sized hospital in the same borough reported only 6.0 occurrences per 10,000 discharges. One of New York City’s major academic medical centers (a major academic medical center is a hospital co-located with a medical school) reported 20.2 occurrences per 10,000 discharges, and a similar size major academic medical center outside of New York City reported at a rate eight times higher—166.3 occurrences per 10,000 discharges.
Examples of wide disparities among New York City hospitals in reporting of individual occurrence codes in 2006 were:
o Reporting of acute myocardial infarctions (heart attacks) unrelated to a cardiac procedure ranged from no reports at 17 hospitals to 13.2 reports per 10,000 discharges (a total of over 40 reports) at another hospital.
o Combined reporting of new acute pulmonary embolism and of new deep vein thrombosis (blood clot) ranged from more than 60 reports per 10,000 discharges at two hospitals (over 260 reports each) to a fraction of this rate, only 2.0 reports per 10,000 discharges, at six others (fewer than 10 reports each).

policy report
March 2009 2
www.comptroller.nyc.gov
o One major academic medical center reported 32.0 post-operative surgical site infections per 10,000 discharges while another reported only 3.6 per 10,000.
Large disparities also were noted in reporting of some of the most serious events—those that must be reported within 24 hours, such as “unexpected death.”
It must be emphasized that hospitals with high NYPORTS reporting rates are not bad hospitals. When informed of some of the reporting disparities identified by Comptroller staff, a DOH official responded: “Some [hospitals] are better reporters than others. Good reporters are not bad hospitals. They are just good reporters.” The hospital with the highest reporting rate in the state is a highly regarded major academic medical center outside of New York City and the hospital with the second highest New York City rate is also a major academic medical center. Both hospitals have been listed among the nation’s “best” hospitals in the U.S. News and World Report annual hospital rankings.
• New York City hospitals reported at a much lower overall rate than did hospitals elsewhere in New York State. In 2006, New York City hospitals reported only 38.9 adverse occurrences per 10,000 discharges, compared to 69.6 per 10,000 north of the City and 63.7 per 10,000 on Long Island. From 2004 to 2006, New York City hospitals accounted for 47.7 percent of patient discharges statewide, but for significantly less than this share of reports for occurrence categories covering nearly 90 percent of NYPORTS reports, ranging from “misadministration of radiation or radioactive material” (only 18.8 percent of reports were from New York City) to “post-operative surgical site infection” (New York City accounted for 29.3 percent of the reports).
• Hospitals have reported medication errors only rarely, notwithstanding a major national study by the Institute of Medicine of the National Academies concluding that at least 400,000 hospital patients nationwide are harmed and 7,000 die because of medication errors annually. Reporting of medication errors that result in death, a near-death event, or permanent patient harm is mandatory under NYPORTS. Yet from 2004 through 2007, New York City hospitals reported only 37 medication errors in all three of these categories combined, and 22 hospitals, including four very large hospitals (at least 30,000 discharges a year), reported no medication errors in any of these three reporting categories.
• Adverse occurrences in hospitals have high financial costs. A significant amount of money can be saved by preventing adverse occurrences in hospitals. For example, based on a 2006 study, the total excess cost to New York State’s health care system of cases of deep vein thrombosis (DVT, a blood clot that can travel to the lungs or heart and become fatal) and acute pulmonary embolism (PE), with which it is often associated, that get reported through NYPORTS is more than $70 million a year. Because there is substantial underreporting, the actual figure is much higher.
• Hospitals are required by law to report specified categories of adverse occurrences, but enforcement has been weak. In 2001, DOH said it would ask the Legislature to increase the fine for an initial NYPORTS violation from $2,000 to $6,000 and for a top fine of $50,000. Fines were not increased at that time. Not until this year did the Legislature finally increase fines for violations by health care facilities, but they still remain at only $2,000 for an initial violation and rise to a ceiling of $10,000 only if there was death or serious injury. These amounts are too low to deter non-reporting. Moreover, fines for non-reporting are very rarely imposed, making this a requirement without teeth.
• Complete reporting is essential for NYPORTS to work as intended and be of practical benefit. One of NYPORTS’ key features is supposed to be the ability of a hospital to log on to a secure internet web site and

policy report
March 2009 3
www.comptroller.nyc.gov
compare its numbers against its peers. If most of a hospital’s peers do not fully report, however, this feature is of limited use. Low reporting by some hospitals is unfair to hospitals that fully report their occurrences.
We recognize that there may be explanations of which we are unaware for some of the smaller disparities among hospitals in reporting certain occurrence codes. Nevertheless, the wider disparities clearly result in large part from differences in levels of diligence of reporting among hospitals.
For example, it is difficult to imagine that the vast difference in reporting rates for “acute myocardial infarction unrelated to a cardiac procedure”—13.2 per 10,000 discharges at one New York City major academic medical center and 0.7 per 10,000 at another—was not due in large part to the first hospital’s being a more thorough reporter than the second, especially considering that the first hospital also reported the highest rate in the City for post-operative surgical infections and among the highest rates for patient falls that cause injury, new acute pulmonary embolism and new documented deep vein thrombosis.
• When implemented a decade ago, NYPORTS was intended to be a broad-based system that covered a wide array of occurrences and fostered higher-quality care. This mission has been lost. The original mission was to improve the overall quality of care and guard patient safety. There was some success at using NYPORTS to improve quality during the system’s first few years (1998 to the early 2000’s). But weak enforcement and flagging commitment to a broad-based effort has compromised the whole program.
The mission of improving quality was eroded when, in 2005, NYPORTS was downsized by discontinuing nearly one half of the reportable occurrence categories. Also in 2005, DOH effectively ended enforcement of five other categories (reporting is still officially required, but there are no consequences if a hospital fails to report them). In addition, the most recently released NYPORTS Annual Report covers a three-year period, 2002-2004, and the NYPORTS Statewide Council has not met in at least two years. According to a DOH representative, lack of staff resources has virtually precluded issuance of in-depth analyses of reporting and feedback to hospitals.
NYPORTS was not intended to focus on just a narrow range of “never events” like leaving a surgical sponge in a patient or on a limited set of other most-serious occurrences. To be sure, there continues to be value in informing DOH of these occurrences, and lessons can still be learned from the “root cause analyses” of causes and planned remedies hospitals are required to include when they submit a report, although such analyses are required for only eight of the occurrence categories.
The original mission of NYPORTS was broader than this. There needs to be reporting for a greater range of occurrence categories, extensive feedback to hospitals, and a renewed commitment to development and implementation of risk reduction strategies.
Summary of recommendations
Many New York City hospitals have in recent years implemented aggressive new quality improvement programs, including collaborative safety and quality projects created jointly by the Greater New York Hospital Association and the United Hospital Fund. In 2005, the State enacted a hospital-acquired infection (HAI) reporting law and has established an HAI reporting system. These are positive developments for the health and safety of patients. However, a reinvigorated NYPORTS remains essential.
In this time of unprecedented financial stress on hospitals, there is another reason to step up efforts to

policy report
March 2009 4
www.comptroller.nyc.gov
improve hospital quality and safety. A robust NYPORTS can help avoid excess costs associated with adverse occurrences—costs paid by everyone with health insurance and by federal, State and local taxpayers through Medicare, Medicaid, government employee health plans and support for municipal hospitals, as well as costs that are not reimbursed and must be absorbed by hospitals themselves, including higher medical malpractice lawsuit payouts and insurance premiums.
Key recommendations are:
• Strengthen enforcement to improve reporting completeness. In 2001, the DOH Commissioner stated that hospital noncompliance with NYPORTS reporting requirements were “unacceptable.” Yet large reporting disparities have persisted. Effectively addressing them will require: o Expanded use of medical records audits and retrospective chart reviews. This need not be costly to DOH. The
expense to DOH can be minimized through smart prioritization; rather than performing broad enforcement sweeps, enforcement can be focused on those hospitals that have been shown by past performance to be at greatest risk of underreporting. Also, instead of searching for non-reporting among the full range of occurrence codes, DOH can periodically select sets of occurrence categories on which to focus, based on assessment of frequency, potential for patient harm, potential to remediate identified deficiencies, and potential financial savings to the health care system.
o Higher fines. The current enforcement system needs to be backed by meaningful monetary sanctions in order to actually deter underreporting.
o Mandatory reporting timeframes and citations for all reportable occurrences. All of the reportable occurrences are important indicators of health care quality.
The high reporting rates by some of the State’s most highly regarded hospitals demonstrate that full reporting is indeed feasible and practicable. In discussions between Comptroller staff and officials of hospitals with high reporting rates, it emerged that a principal reason they reported more occurrences than other hospitals is that they inculcated a “culture” of full reporting and their staffs were very strongly encouraged and well-trained to fully report all occurrences. These hospitals recognize that even a small reduction in adverse occurrences can avoid substantial excess costs.
Effective enforcement will also be needed to ensure complete reporting under the State’s new Hospital-Acquired Infection Reporting System, which after 2006 supplanted NYPORTS reporting of post-operative surgical site infections. In 2006, the numbers of surgical site infections reported through NYPORTS varied dramatically by hospital: for example, two highly respected hospitals reported more than 120 surgical site infections each, while other similar-size hospitals reported only one to two dozen, and a few hospitals did not report any.
• Selectively restore some of the occurrence reporting categories discontinued in 2005 and consider new ones. In 2005, when DOH discontinued 22 of 54 occurrence reporting codes and eliminated defined reporting timeframes for six others, it left enforceable only the “900-series” occurrence codes (21 codes numbered from 914 to 963) and the three medication error codes. These codes tend to deal with the most serious, immediately life-threatening kinds of occurrences, as well as unusual occurrences such as an infant discharged to the wrong family, or with occurrences such as the rape of a patient that are also reportable to other agencies. The changes in 2005 undercut the original mission of NYPORTS, which was to collect information and disseminate analysis and risk-reduction strategies on a broad array of occurrences—additional to occurrences in the 900-series—that directly impact the quality and safety of patient care.
policy report
March 2009 5
www.comptroller.nyc.gov
The Department should consult the results of a RAND Corporation-sponsored expert consensus project conducted in 2008, in which experts in the field of patient safety rated the relative importance of various occurrence reporting categories now in use or being considered around the nation. Several NYPORTS occurrence categories that DOH discontinued in 2005 were deemed by the RAND panel of experts to be of greater importance than some of the occurrences categories that continue to be reported.
I. NYPORTS: A Potentially Effective Tool for Patient Safety and Hospital Quality Improvement
According to DOH in 2001, the primary purpose of NYPORTS was to “improve the overall quality of hospital care by identifying occurrences and developing methods for reducing those occurrences.” This begins with hospitals reporting to DOH through a secure web site all instances of designated medical errors and other specific categories of adverse occurrences. When NYPORTS was implemented in 1998, there were 51 occurrence reporting categories (codes). These were selected after an extensive two-year development and field testing process in which all stakeholders, including hospitals, a consumer representative, and DOH, participated. (See Appendix A for a list of these codes and three more added in 2000, and the numbers of reports filed under each code annually from 2004 to 2007.)
Hospitals submit either a short form or long form report. Long form reports are used for the most serious occurrences and must be accompanied by a Root Cause Analysis completed by the hospital within 30 days. A Root Cause Analysis is supposed to describe in detail what happened, identify a proximate cause, include an interdisciplinary analysis of the occurrence, summarize what was learned, and list specific measurable risk-reduction strategies that will be implemented by the hospital. Examples of occurrences requiring a long form to be submitted are “wrong patient, wrong site surgical procedure” and “unintentionally retained foreign body.”
Although most short form occurrences are considered less serious than long form occurrences, they can nonetheless result in significant and costly medical complications, which, if not adequately treated, can lead to death. For example, “new deep vein thrombosis” is a blood clot that can become fatal if untreated. (Appendix B provides more information on the history of hospital incident reporting in New York, the development of NYPORTS, and reporting requirements.)
Adverse events are common in hospitals.
That adverse events are common in hospitals has been supported by a number of studies, in addition to the IOM study on hospital medical errors mentioned earlier. For example, a study that reviewed incident reports submitted by staff at two hospitals found that nine percent of patients had at least one incident report and 59 percent of these were “preventable”.1 Another study found a 2.9 percent adverse event incidence rate in general hospitals.2 An observational study of patients in a large U.S. urban hospital found a 17.7 percent incidence of
1 T.K. Nuckols, D.S. Bell, and H., Liu, “Rates and Types of Events Reported to Established Incident Reporting Systems in Two U.S. Hospitals,“ Quality & Safety in Health Care, June 2007. Approximately 1,000 internal incident reports per hospital were reviewed involving 16,675 randomly selected patients from an academic and community hospital in 2001. In 20.8 percent the incident reports staff reported that there was “no harm,” in 10.2 percent they reported “minor to moderate” harm, in 1.9 percent they reported “severe” harm, in 2.8 percent they reported death and in 47.9 percent they did not rate whether there was harm or injury. The study’s physicians, who reviewed the reports and assigned a risk-of-harm rating, rated 93.0 percent of the incidents as having, “Medical risks reaching patients,” which was defined as “actual or potential risks of physical harm that were not intercepted before reaching the patient.”
2 E.J. Thomas, D.M. Studdert, H.R. Burstin, et. al., “Incidence and Types of Adverse Events and Negligent Care in Utah and Colorado, Medical Care, 38 (3), 2000.

policy report
March 2009 6
www.comptroller.nyc.gov
serious adverse events that led to longer hospital stays and increased costs to the patient.3
NYPORTS has had some success in reducing adverse events and improving care.
According to a recent study on hospital adverse event reporting by the Office of the Inspector General of the U.S. Department of Health and Human Services, which was based on structured interviews with 85 stakeholders ranging from federal agencies to professional associations, “Stakeholders see routine reporting of adverse events as an important component of improving patient safety.”4
DOH has used NYPORTS reporting results as the basis for in-depth analyses and development of risk-reduction strategies, including for codes 108 to 110 (medication errors), code 911 (wrong patient, wrong site surgical procedure), code 912 (incorrect procedure or treatment-invasive), and code 915 (unexpected death including delay in treatment, diagnosis or an omission of care). Analyses based on NYPORTS data have been disseminated through a variety of channels, including hospital advisories, educational video conferences, regional forums, a patient safety conference, and the periodic NYPORTS News and Alert. NYPORTS data has been used by hospitals for quality improvement, which is one of the main purposes of the system. For example, the NYPORTS 1999 Annual Report reported:
“At a recent regional meeting, local NYPORTS data were reviewed and compared to statewide data. Complications arising from tonsillectomy/adenoidectomy surgery were reviewed due to a higher than statewide incident occurrence rate in their region. It was noted that post-operative bleeding was identified as the most frequent complication. A review of individual cases revealed that post-surgical diet was a critical factor in reducing the risk of post-op bleeds. This led to re-enforcing to local hospitals the message that the importance of dietary restrictions should be re-emphasized….”
The 2000-2001 NYPORTS Annual Report explained that individual hospitals have productively utilized their NYPORTS reporting data:
“NYPORTS reporting and the resultant access to comparative data have prompted individual facilities to conduct their own system studies. Using the information gained through the NYPORTS system, facilities can target areas of concern and perform focus studies. The results of these studies have been significant in improving patient care and safety, as well as reducing hospital costs.”
Individual facilities have used NYPORTS data in efforts to improve medication use, reduce intravascular catheter-related pneumothorax (collapsed lung), reduce returns to operating rooms, and reduce blood clots, among other projects. The 2000-2001 NYPORTS Annual Report provided several examples of how NYPORTS reporting data has improved care at individual hospitals, including:
3 L.B. Andrews, C. Stocking, T. Krizek, et. al., “An Alternative Strategy for Studying Adverse Events in Medical Care,” Lancet, February 1997. According to the article abstract, “Ethnographers trained in qualitative observational research attended day-shift, weekday, regularly scheduled attending rounds, residents’ work rounds, nursing shift changes, case conferences, and other scheduled meetings in three study units as well as various departmental and section meetings…Of the 1,047 patients in the study, 185 were said to have had at least one serious adverse event. The likelihood of experiencing an adverse event increased about 6% for each day of hospital stay…”
4 Office of the Inspector General of the Department of Health and Human Services, Adverse Events in Hospitals: Overview of Key Issues, December 2008.

policy report
March 2009 7
www.comptroller.nyc.gov
“… [T]he medical director of one hospital noticed through NYPORTS reporting that his hospital had a higher incidence of deep venous [vein] thrombosis than was usual in the region, and after further investigation discovered that the hospital’s DVT protocol had not been implemented hospital-wide.”
There has been relatively little such activity in the last several years, however. This is reflected in the NYPORTS section of the DOH web site, for which the most recent entry is the 2002-2004 NYPORTS Annual Report and the suspension of publication of the NYPORTS News and Alert, which disseminated the results of NYPORTS data analyses including risk-reduction strategies.
NYPORTS is also a potentially useful tool for containing hospital costs.
Medical errors and other NYPORTS-reportable occurrences result in substantial additional costs. Each time an occurrence is avoided, thousands of dollars in excess expenditures by private insurers, Medicaid, Medicare, and patients and hospitals themselves are also avoided. As discussed later, for example, the excess cost of a case of post-operative deep vein thrombosis or acute pulmonary embolism, which must be reported through NYPORTS, is nearly $11,000, and the excess costs to the healthcare system of the 6,461 instances of these two types adverse event reported through NYPORTS for 2006 came to over $70 million.
NYPORTS can also play an important role in reducing medical malpractice payouts and insurance costs. The enactment in 1985 of the New York State hospital incident reporting law on which NYPORTS is based was a response to the medical malpractice insurance “crisis” then being experienced in the State. It was hoped that improving hospital quality and reducing medical errors would help ameliorate malpractice insurance costs.
II. Under-Enforcement Has Allowed for Incomplete Reporting
The Office of the Comptroller reviewed the total number of occurrences for which each acute care general hospital in New York State filed reports through NYPORTS for 2004, 2005, 2006, and 2007, and the number of reports each hospital filed by occurrence code for each of these years.
A. There have been very large reporting disparities among regions and among individual hospitals within regions. New York City hospitals have had substantially lower overall reporting rates than hospitals elsewhere in the State.
In 2006, New York City hospitals reported 38.9 occurrences per 10,000 discharges, compared to 69.6 occurrences per 10,000 discharges north of the City and 63.7 occurrences per 10,000 discharges on Long Island.5 Only 17 percent of New York City hospitals reported at least 50 occurrences per 10,000 discharges. In contrast, north of New York City, 56 percent of hospitals, and on Long Island, 74 percent of hospitals, exceeded this benchmark.
New York City accounted for 48.8 percent of acute care general hospital discharges statewide in 2005 and 46.8 percent in 2006. Nevertheless, as shown below, New York City acute care general hospitals reported NYPORTS occurrences at substantially less than their statewide share of discharges would have indicated:
5 If smaller hospitals (those with fewer than 10,000 discharges) are not counted, the north-of-New York City rate increases to 78.7 occurrences per 10,000 discharges and the New York City rate decreases 1.3 percentage points, to 37.6 occurrences per 10,000 discharges.

policy report
March 2009 8
www.comptroller.nyc.gov
Total occurrences NYC Rest of State 2005 18,911 6,384 (33.8%) 12,527 (66.2%)2006 13,982 4,718 (33.8%) 9,264 (66.2%)20076 9,6087 3,360 (35.0%) 6,248 (65.0%)
Occurrence reporting rates have varied widely among individual hospitals.
Focusing on 2006,8 we found very large disparities in the total numbers of reported occurrences and reporting rates among individual hospitals.9 Some hospitals reported occurrences at rates up to 20 times higher than other, comparable hospitals in terms of numbers of discharges annually, bed composition (e.g., the proportion of beds that are medical-surgical) and types of procedures conducted. Measured by occurrences per 10,000 discharges, the one dozen highest and lowest reporting rates in New York City for 2006 are shown below, followed by a hospital size category based on the number of patient discharges in 2006. (S, small; M, medium; L, large; VL, very large.)10 Highest rates Lowest rates
111.3, S 20.3, VL 90.7, VL 20.2, VL 90.0, VL 19.7, L 85.9, VL 17.9, L 83.9, L 17.3, M 68.0, L 16.5, VL 57.3, VL 13.8, S 55.7, L 7.2, S 55.6, L 7.2, L 53.8, VL 6.0, M 49.3, VL 5.4, S 48.8, L 4.5, S Six of the 12 highest-rate hospitals listed above filed over 200 occurrences each (one hospital reported 365 occurrences), and all but the smallest hospital on this list reported at least 100 occurrences. In contrast, the lowest 6 Patient discharge numbers were not available for 2007. However, there typically are only slight changes in total discharge numbers from year to year.
7 As explained elsewhere in this report, the decline in the total number of occurrences between 2005 and 2007 was due in large part to the elimination of some of the occurrence codes.
8 NYPORTS data for 2007 was provided to the Office of the Comptroller in June 2008. But for several short-form occurrence codes with no defined reporting timeframes DOH continued to collect reports for 2007 until late 2008. Therefore, comparison of reporting rates among hospitals for these codes has been limited to the 2004 to 2006 period. 9 All the calculations in this report are for acute care general hospitals and exclude specialty hospitals such as cancer hospitals, alcohol/drug detoxification hospitals, and eye and ear-focused hospitals, as well as long-term care/rehabilitation hospitals.
10 We categorized small hospitals as having fewer than 10,000 discharges, medium hospitals as having 10,000 to 19,999 discharges, large hospitals as having 20,000 to 29,999 discharges, and very large hospitals has having 30,000 discharges or more.

policy report
March 2009 9
www.comptroller.nyc.gov
rate hospitals reported as few as three occurrences (two hospitals), and five hospitals reported at most only a dozen occurrences. Overall reporting rates outside of New York City were substantially higher than within the City. Outside of New York City, 14 hospitals had an occurrence reporting rate for 2006 of at least 100 occurrences per 10,000 discharges, compared to only one hospital in New York City. Several hospitals outside of New York City reported at least 300 total occurrences, one hospital reported over 400 occurrences, and another hospital (a major academic medical center) reported well over 600 occurrences, the most in the State. 11
The number of occurrences per 10,000 discharges is the most widely used measure for adverse events. Nonetheless, for 2006 we also compared New York City hospitals by the numbers of occurrences per 10,000 procedures (ambulatory and inpatient). As was the case for occurrences per 10,000 discharges, there were very wide disparities among similar size hospitals.12 Among very large hospitals, the rate per 10,000 procedures ranged from 5.1 to 29.2; among large hospitals, from 5.7 and to 30.2; among medium-large hospitals, from 3.0 to 19.7; among medium hospitals, from 2.4 to 45.8; and among small hospitals, the rate per 10,000 procedures ranged from 3.9 to 132.2.
Virtually every hospital that had a high reporting rate as measured by occurrences per 10,000 discharges also had a high reporting rate when measured by occurrences per 10,000 procedures. Thus, a medium size upstate hospital that had one of the highest reporting rates in the State as measured against discharges had 70.3 occurrences per 10,000 procedures, a higher rate than all but one New York City hospital. Similarly, hospitals with low rates as measured by occurrences per 10,000 discharges also had low rates when measured by occurrences per 10,000 procedures. There have been large reporting disparities among hospitals in occurrence categories covering the vast majority of reported occurrences.
The disparities observed in NYPORTS reporting among regions and/or hospitals within regions occurred primarily in the occurrence codes discussed below. In 2006, these codes accounted for 87.9 percent of all reports submitted for the year; thus the disparities seen within these codes are effectively the disparities for the entire NYPORTS system. • New acute pulmonary embolism (code 401) and new documented deep vein thrombosis (code 402). A
pulmonary embolism (PE) occurs when a blood clot blocks a pulmonary artery or one of its branches. A deep vein thrombosis (DVT), with which a PE is often associated, is a blood clot, typically in the leg or thigh veins. DVTs and PEs usually result in a longer hospital stay and significantly higher costs. The untreated DVT mortality rate is between one percent and five percent.
From 2004 through 2006, the combined code 401/402 reporting rate in New York City was 16.05 per 10,000 discharges, approximately 43 percent below the Long Island rate of 28.90 and the rate of 28.37 north of New
11 The rates per 10,000 discharges for the 14 hospitals outside of New York City with rates of at least 100 occurrences per 10,000 discharges were: 166.3, 166.1, 149.2, 146.9, 127.8, 124.3, 121.2, 120.3, 113.8, 113.7, 113.3, 108.9, 108.4, and 105.1.
12 We categorized hospitals according to the number of procedures from 2006 to 2007: small (fewer than 20,000), medium (20,000 to 49,999), medium-large (50,000 to 79,999), large (80,000 to 99,999) and very large (100,000 and over).
policy report
March 2009 10
www.comptroller.nyc.gov
York City.13 During this period, New York City hospitals accounted for 33.9 percent of code 401/402 reports statewide, which was nearly 14 percentage points below their 47.7 percent share of patient discharges.
Within New York City, there were very large DVT/PE reporting rate disparities among comparable hospitals. For 2006, the combined code 401/402 reporting rate in New York City ranged from a high of over 60 reports per 10,000 discharges at two hospitals to a fraction of this rate, only 2.0 reports per 10,000 discharges, at six hospitals. Four hospitals filed more than 150 reports each, while eight hospitals filed five or fewer. Included among the highest-rate as well as the lowest-rate hospitals were a full range of hospital sizes, from major academic medical centers and other large and very large (at least 30,000 patient discharges a year) hospitals to small community hospitals (fewer than 10,000 discharges).
• Acute myocardial infarction [heart attack] unrelated to a cardiac procedure (code 604). From 2004 through 2006, New York City hospitals submitted 2.05 reports per 10,000 discharges, well below the rate of 3.44 on Long Island and 3.73 north of the City. From 2004 through 2006, New York City hospitals accounted for 33.8 percent of code 604 reports statewide, approximately 14 percentage points below their 47.7 percent share of patient discharges.
For 2006, code 604 reporting rates within New York City ranged widely, from no reports at 17 New York City hospitals to 13.2 reports per 10,000 discharges at one of the City’s major academic medical centers. Two of the City’s very large hospitals discharges were among hospitals that filed no reports, while one of the City’s other major academic medical centers (also a very large hospital) filed more than 40.
• Falls resulting in x-ray proven fractures, subdural or epidural hematoma [types of traumatic brain injury], cerebral contusion, subarachnoid hemorrhage [bleeding between the arachnoid membrane and the innermost membranes surrounding the brain], and/or internal trauma (code 751). From 2004 through 2006, New York City hospitals submitted 3.38 reports per 10,000 discharges, compared to a rate of 4.46 on Long Island and 4.68 north of the City. From 2004 through 2006, New York City hospitals accounted for 40.1 percent of code 751 reports statewide, nearly eight percentage points below their 47.7 percent share of patient discharges.
• Post-operative surgical site infection requiring I & D [incision and drainage], IV antibiotics or inpatient hospital admission within 30 days (code 808). Prior to 2007, hospitals were required to report surgical wound site infections through NYPORTS. Under the State’s new hospital-acquired infection (HAI) reporting law, beginning in February 2007 hospitals began to report a limited set of four specific hospital- acquired infections through a new HAI reporting system, and code 808 was discontinued.14 For 2004 through 2006, New York City hospitals filed 8.8 reports per 10,000 discharges, 52 percent below the Long Island rate of 18.2 and 56 percent below the rate of 20.0 north of the City.
Reporting in New York City was highly concentrated among a handful of hospitals. For 2006, the highest code 808 rate in New York City was 32.0 reports per 10,000 discharges, followed by 29.6 and 25.1 per 10,000 discharges at another hospital. In contrast, ten hospitals reported rates of 3.5 per 10,000 discharges or fewer and four hospitals did not report any code 808 infections. The three highest rate hospitals—two very large
13 Although DOH supplied reporting data for 2007, since 2005 there has been no reporting timeframe for Codes 401/402, 604, 701 and 751 and DOH continued to accept reports for them until later in 2008. Therefore, reporting data for these codes, which was provided in June 2008, may not be entirely complete for all hospitals. We did not include this data in the calculations in this report.
14 Hospital surgical site infections that result in death are still reportable under a 900 series reporting code.

policy report
March 2009 11
www.comptroller.nyc.gov
hospitals (at least 30,000 discharges annually) and one small hospital (fewer than 10,000 discharges)—together filed a total of 236 reports, or 24 percent of the code 808 reports in New York City. In contrast, the seven other very large hospitals together reported a total of only 144 reports.
Reporting rates were higher outside of New York City overall. From 2004 through 2006, New York City hospitals accounted for 29.3 percent of code 808 reports in the State, 18 points below their share of the State’s patient discharges. For 2006, ten hospitals outside New York City reported rates substantially in excess of the highest New York City rate.
In addition to disparities in reporting short form occurrences, there were substantial reporting-rate disparities among regions and/or hospitals within regions for some of the most serious occurrence categories, that is, those that have to be reported within 24 hours, including a subset for which a hospital has to submit a Root Cause Analysis. More specifically, from 2004 to 2006, New York City accounted for 47.7 percent of patient discharges statewide but for only 33.8 percent of reports for occurrences that were required to be reported within 24 hours15 and 39.8 percent of reports that required submission of a Root Cause Analysis.16 (See Appendix C for more details and further analysis of reporting for each of the following 900-series occurrence codes.)
• Wrong patient, wrong site—surgical procedure (code 911). From 2004 through 2006, New York City hospitals accounted for 36.8 percent of code 911 reports statewide, 12 points below their share of statewide patient discharges during this period. For 2007, they accounted for 31.5 percent of code 911 reports statewide. For 2004 to 2006, the New York City rate was 0.06 reports per 10,000 discharges, compared to 0.05 on Long Island and 0.10 north of New York City. 17
• Misadministration of radiation or radioactive material (code 914). From 2004 through 2006, New York City hospitals filed 18.8 percent of reports filed under code 914 statewide, 30 points below their 47.7 percent share of patient discharges. In 2007, they accounted for 12.5 percent. From 2004 to 2006, the New York City reporting rate was 0.06 per 10,000 discharges, compared to 0.16 on Long Island and 0.29 north of New York City.
• Cardiac and/or respiratory arrest requiring ACLS [advanced cardiopulmonary life support] intervention (including delay in treatment, diagnosis or omission of care) (code 916). From 2004 through 2006, New York City hospitals filed 40.6 percent of the 330 reports statewide, approximately seven points below their 47.7 percent share of patient discharges. In 2007, they filed 39.0 percent of the 105 reports submitted that year. For 2004 through 2006, the New York City rate was 0.36 reports per 10,000 discharges, compared to 0.20 on Long Island and 0.59 north of New York City. Large reporting disparities were also observed among similar-size New York City hospitals.
• Impairment of limb, organ or bodily function (including delay in treatment, diagnosis or an omission in care) (code 918). From 2004 through 2006, New York City hospitals accounted for 27.6 percent of the total of 696 code 918 reports, 20 points below their share of statewide discharges. New York City hospitals had a rate of
15 34.6 percent in 2004, 35.9 percent in 2005, 33.4 percent in 2006, 38.9 percent in 2007.
16 Annual breakout as follows: 38.3 percent in 2004, 41.0 percent in 2005, 40.2 percent in 2006, 44.0 percent in 2007.
17 Data DOH provided in mid June for 2007 for Codes 401, 401, 604, 701 and 751 was not necessary complete for all hospitals because DOH accepted additional reports under these codes until late 2008 and the data was provided in June 2008. Therefore, statewide reporting shares for 2007 are presented only for the 900-series codes. However, reporting rate comparisons are limited to 2004-2006 for all codes because patient discharge data was not available for 2007.

policy report
March 2009 12
www.comptroller.nyc.gov
0.34 reports per 10,000 discharges compared to 0.33 on Long Island and 1.00 north of New York City.
• Malfunction of equipment during treatment or diagnosis or a defective product which has a potential for adversely affecting patient or hospital personnel or results in a retained foreign body (code 937). From 2004 through 2006, New York City hospitals accounted for 29.0 percent of the 1,129 reports filed statewide, approximately 18 points below their share of patient discharges. The New York City rate was 0.88 per 10,000 patient discharges, well under the rate of 1.55 on Long Island and 2.12 in the rest of the State. Some Upstate hospitals filed more than a dozen code 937 reports—one hospital filed 29—yet 42 of the 57 New York City hospitals filed no reports at all. Large reporting disparities were also observed among comparable New York City hospitals.
• Unexpected death not directly related to the natural course of illness or underlying condition (including delay in treatment, diagnosis or an omission of care and no life threatening anomalies) (code 915). From 2004 through 2006, New York City hospitals accounted for 41.3 percent of the 2,148 code 915 reports filed statewide. New York City hospitals filed 2.38 reports per 10,000 discharges, compared to 2.23 on Long Island and 3.42 north of the City.
Although New York City’s share of reports was not as far below the City’s share of total patient discharges as the codes discussed above, there were very large reporting disparities among comparable hospitals. For 2005 and 2006 combined, several New York City hospitals filed more than two dozen code 915 reports each, while six hospitals, including very large hospitals (more than 30,000 discharges) and medium-size hospitals (10,000 to 20,000 discharges), filed none.
Very few medication errors have been reported, notwithstanding that at least 400,000 hospital patients nationwide are harmed by medication errors annually.
A major study by the Institute of Medicine of the National Academies determined that at least 400,000 hospital patients are harmed by hospital medication errors in the U.S. each year—1.7 percent of them permanently —and that more than 7,000 hospital patients die as a result of medication errors annually. Reporting of medication errors that result in death (code 110), a near-death event (code 109), or permanent patient harm (code 108) is mandatory under NYPORTS. Yet from 2004 through 2007, New York City hospitals reported a total of only 37 medication errors in all three categories, and 22 New York City hospitals reported none at all, including four of the City’s very large (at least 30,000 discharges) hospitals.
According to the NYPORTS Clinical Definitions Manual (Version 4, 2005), hospitals can submit reports for other kinds of medication errors—those that did not result in death, permanent harm or a near-death event —through code 901. Code 901 is a catch-all code for reporting any “other serious occurrence warranting DOH notification.” However, hospitals report very few code 901 adverse events; in 2006, most hospitals reported five or fewer code 901 and some large hospitals reported none.
Appendix D provides further data and analysis of medication error reporting through NYPORTS.
B. Reasons for wide NYPORTS reporting disparities
Underreporting by some hospitals is the major reason for wide reporting-rate disparities.
There are a number of possible explanations for the wide reporting disparities discussed in this report. These range from differences in patient mixes and age distributions to differences in volumes of certain medical

policy report
March 2009 13
www.comptroller.nyc.gov
procedures performed. However, we observed that among hospitals with high reporting rates as well as among those with low reporting rates, there were large hospitals and small ones, major academic medical centers as well as community hospitals, municipal hospitals and voluntary sector hospitals, hospitals with disproportionately large shares of elderly patients and hospitals with younger patients. The wide diversity of hospitals among both high- and low-rate reporters indicates that factors such as hospital size and types of procedures performed had little bearing on NYPORTS reporting rates.
To be sure, real differences in the quality of care and procedural competence among hospitals may partially explain reporting disparities. But the immensity of reporting-rate disparities among comparable hospitals, and the much lower reporting rate by New York City hospitals overall compared to hospitals elsewhere in the State, also indicate that the main reason for such disparities is that some hospitals have been reporting occurrences more thoroughly than others. As discussed below, DOH itself reached a similar conclusion several years ago. Thus, it is highly improbable that the highly regarded major academic medical center outside of New York City that had the highest reporting rate in the State provided much worse care than the New York City major academic medical center that reported only a small fraction as many occurrences. And it is unlikely that a hospital in Queens truly had ten times as many reportable adverse events (and high reporting rates in occurrence codes ranging from post-operative surgical site infection to acute myocardial infarction unrelated to a cardiac procedure) as another, only slightly larger hospital in the same borough. The conclusion is inescapable that the main reason for large disparities we observed is that some hospitals are much more complete reporters than others.
We also noted that hospitals with high reporting rates tended to have high rates in a number of different reporting categories. Comptroller staff interviews and email exchanges with officials of several of these hospitals revealed that those with high reporting rates had incorporated the importance of occurrence reporting and its connection to process improvement into their cultures. DOH previously attributed wide reporting disparities to underreporting.
An analysis DOH published in the 2001 NYPORTS Annual Report concluded that large regional disparities in NYPORTS reporting were primarily attributable to underreporting.18 The analysis, which examined regional disparities in reporting of code 605 occurrences19 in 1999, found that only 16.2 percent of reportable code 605 occurrences had actually been reported.20 DOH concluded:
“Despite efforts to improve the completeness of reporting in NYPORTS, an analysis of 1999 data continues to show significant underreporting of reportable occurrences. This assessment is based on 1) wide regional variations; 2) a check on reporting accuracy comparing NYPORTS data
18 New York State Department of Health, New York Patient Occurrence and Tracking System – Annual Report, February 2001.
19 Under Code 605, which was discontinued in 2005, a hospital was required to file a report in the event of a patient death occurring within 48 hours of a specified operating room procedure. The list of specified operating procedures ranged from appendectomy and angiography (non-cardiac) to replacement of a joint of lower extremity and spinal fusion.
20 The analysis was done by using the DOH SPARCS (Statewide Planning and Research Cooperative System) database to cross-check hospitals’ NYPORTS reporting. After being adjusted to make them comparable, SPARCS data, which describe patient deaths following surgery, was matched against NYPORTS Code 605 reports. A total of 1,030 cases were identified through SPARCS, but only 167 (16.2 percent) of the cases were reported through NYPORTS. SPARCS data contains a discharge summary for all patients admitted to New York State hospitals.

policy report
March 2009 14
www.comptroller.nyc.gov
with discharge date; and 3) low individual hospital reporting rates that can only be explained by consistent underreporting [emphasis added].”
Then-Health Commissioner Dr. Antonia C. Novello called NYPORTS reporting rates for some of the hospitals “unacceptable” and warned hospitals that fail to report their adverse events: “We will identify you, single you out and sanction you in a public forum.”21
Beyond under-reporting of code 605 occurrences, a federally funded DOH study of NYPORTS reporting for 2001 directly documented serious underreporting of four occurrence categories for which reporting continues to be required in 2008: new deep vein thrombosis/new pulmonary embolism (codes 402 and 401), acute myocardial infarction (AMI) unrelated to a cardiac procedure (code 604), and post-operative surgical site infection (code 808).22 For each of these reportable occurrences, a small group of four or five hospitals of varying sizes was studied. Utilizing SPARCS (Statewide Planning and Research Cooperative System) data, researchers identified cases that were reportable and determined whether or not all of these cases had actually been reported under NYPORTS. Only 24 percent of deep vein thrombosis/acute pulmonary embolism occurrences, 29 percent of AMI occurrences, and 12 percent of post-operative infection occurrences had been reported. Once the participating hospitals were directed by DOH to assess their adverse event detection reporting systems and make improvements, a follow-up study found a dramatic increase in reporting. For example, the completeness of reporting for post-operative surgical site infections increased to 83 percent.
In February 2001, in an effort to encourage more complete reporting, DOH directed hospital administrators to conduct internal reviews to identify unreported events that occurred in 1999 and 2000 and report them to the Department within 60 days. Hospitals were told that there would be no penalty for reporting previously unreported adverse events within this deadline. In response, according to the NYPORTS 2000-2001 Annual Report, “a significant increase in reporting was noted,” although, the report also noted, “it is clear that there are still a large number of cases that remain unreported.”
In the NYPORTS 2002-2004 Annual Report, the Department found that very substantial regional reporting
rate gaps had continued. For instance, the New York City rate was 45 percent below the Finger Lakes rate, 42 percent below the Central rate and 18 percent below the Long Island rate—which echoes our finding that for 2006, the New York City rate was 44 percent below the north-of-New York City rate and 39 percent below the Long Island rate. The NYPORTS 2002-2004 Annual Report noted that quality of care, types of hospital admissions, and procedures performed could explain some of the regional reporting disparities, but concluded: “It is likely that accuracy and completeness of reporting is the reason for most of the differences in the table above [showing regional reporting disparities]. Since over-reporting is unlikely, under-reporting in regions with the lowest reporting rates is likely the cause of variation.”23
21 As reported in the New York Daily News, “19 City Hospitals Hit for Not Airing Errors,” February 13, 2001.
22 In December 2001, the Office of the Governor announced that DOH had received a $5.4 million, three-year grant from the federal Agency for Healthcare Research and Quality in support of the New York State Safety Improvement Demonstration Project. According to a press release, the DOH’s two major initiatives using this funding were: 1) improve the completeness of NYPORTS reporting “so that meaningful data analysis can occur to help identify risk reduction strategies and reduce medical errors,” and 2) sponsor three demonstration projects in the study of specific types of preventable errors“ and the development and testing of interventions to reduce their occurrence.”
23 New York State Department of Health, New York Patient Occurrence and Tracking System – Annual Report, 2002-2004.

policy report
March 2009 15
www.comptroller.nyc.gov
The State Comptroller’s 2004 audit report found flaws in reporting.
In September 2004, the Office of the State Comptroller released an audit of NYPORTS.24 Among the findings of the audit were:
• Incomplete reporting of occurrences. The audit did not specifically attempt to identify or quantify the amount of non-reporting, referring instead to the Department’s own observations—discussed elsewhere in this report—that underreporting was widespread. However, the audit found that insufficient systematic analysis had been done to ascertain underreporting and observed that, “most types of occurrences are not subject to systematic analysis to identify unreported patient incidents.”25
• Late reporting. Eighty-four percent of the deaths and more-serious occurrences that were supposed to be
reported within 24 hours of the occurrence were reported late.
• Minimal enforcement. The audit report found that “only a small number of medical facilities have been sanctioned and a small number of citations have been issued” and stated, “…[W]e question whether the Department’s low level of enforcement activity is sufficient.” During the 29-month period covered by the audit, only two facilities were fined for their failure to report occurrences on NYPORTS and a total of only 20 citations were issued. The audit report observed, “The low number of citations issued and facilities sanctioned does not appear to be consistent with the Commissioner’s statement that the Department ‘stands ready to enforce requirements, and will publicly sanction those facilities that fail to promptly and accurately report incidents.’”
The audit also found that information on the results of investigations of occurrences was frequently incomplete or missing entirely.
The major recommendation to improve reporting completeness was that DOH should expand its efforts to identify unreported occurrences “so that additional types of occurrences… are subject to systematic analysis to identify unreported occurrences.” The audit report also recommended that “consideration be given to using a formal risk assessment process when determining which kinds of occurrences, and which individual hospitals, are to be selected for analysis” and that “…additional types of occurrences, and in particular most serious occurrences, be subject to systematic analysis to identify unreported occurrences.”
In response, DOH announced several reforms. According to a DOH press release, among these were “tighter and more carefully monitored timelines for reporting incidents and analyses of their causes, and increased potential for sanctions against facilities that submit late or incomplete reports.” DOH said it would expand “efforts
24 Office of theNew York State Comptroller, Department of Health, Maintaining Information on Adverse Patient Incidents at Hospitals and Clinics, 2003-S-27.
25 These efforts have consisted largely of analyses conducted by the SUNY Albany School of Public Health and the Island Peer Review Organization. SUNY Albany and IPRO compare NYPORTS reporting data with SPARCS data (e.g. type of treatment or procedure, diagnosis) to identify occurrences that were reported on SPARCS but not NYPORTS. The Comptroller’s audit concluded that the number of unreported occurrences “may be understated because the number of occurrences reviewed is relatively small.” Moreover, as DOH itself noted, comparing SPARCS and NYPORTS data has serious limitations inasmuch as relatively few NYPORTS occurrence codes match well, moderately or even marginally with the SPARCS database. DOH also can identify non-reporting when it investigates patient complaints against hospitals. However, State Comptroller auditors had determined that the Department’s field offices usually do not identify unreported occurrences while investigating complaints.

policy report
March 2009 16
www.comptroller.nyc.gov
to identify unreported occurrences to enable more systematic analysis of the data” and create “a system to identify medical facilities that consistently fail to report occurrences over time.” 26
As discussed elsewhere in this report, another response by DOH was to discontinue 22 of 54 occurrence categories that had to be reported in order to focus on enforcement for those that remained. Yet despite promises for more systematic analysis and the contraction in the scope of NYPORTS, underreporting has persisted, as discussed elsewhere in this report.
Hospital staff turnover rates and training and the utilization of health information technology affect reporting rates.
Hospital staff turnover rate and training
According to an article co-authored in 2005 by individuals involved in the development and administration of NYPORTS, “The turnover of hospital staff affects reporting rates and the quality of the reports submitted.”27
HHC officials told Comptroller staff that the relatively high reporting rates at some of their facilities when compared to voluntary sector hospitals may reflect that a large share of HHC physicians are on hospital staffs. Because there is a relatively low turnover rate among these physicians, they “get to know the people in Quality Management.” In voluntary sector hospitals, a physician may have admitting privileges at more than one hospital “and never know anyone in the quality management office,” Comptroller staff was informed.
In the inaugural annual report on the State’s new Hospital-Acquired Infection Reporting System, DOH recognized the impact of inadequate staff training and high turnover on reporting adverse occurrences—in this instance, three types of hospital-acquired infections. The report noted, “Timely and complete data submission was often affected by infection control staffing turnover, prolonged vacancies and the need for education and training of new personnel in order to comply with the legislative mandate.”28 The report recommended that hospitals “provide back-up personnel to ensure compliance with reporting requirements and patient safety.”
Administrators of several hospitals informed Comptroller staff that training is crucial for complete reporting. Staff must understand what is and what is not reportable. Staff often tend to attribute an occurrence to patient complexity or will not dig deep enough into a patient’s charts to find out whether the occurrence occurred in the hospital or was present upon admission and was therefore not reportable.
Degree of utilization of electronic medical records
As discussed elsewhere in this report, hospitals submitted fewer medication error reports through NYPORTS than national studies would predict. One reason for this may be difficulty in identifying reportable medication errors and in ascribing a bad medical outcome to a particular reportable medication error. (See Appendix D.)
Academic studies have shown, however, that the adoption by hospitals of electronic medical records 26 Press release, New York State Department of Health, “State Health Commissioner Novello, Comptroller Announce Changes in System Tracking Accidental Deaths, Injuries in Hospitals & Clinics,” September 28, 2004.
27 Flink, op. cit.
28 New York State Department of Heath, New York State Hospital-Acquired Infection Reporting System, Pilot Year – 2007, Report to the Governor and Legislature, July 2008.
policy report
March 2009 17
www.comptroller.nyc.gov
(EMR) systems, in place of paper-based systems, can very substantially increase medication error reporting rates. One study found a very substantial increase in medication error reporting when a web-based reporting system was introduced at a major hospital.29 A study on the switch at a major academic medical center from a paper-based system for reporting safety events to an electronic reporting system (ERS), which was accompanied by educational intervention for staff, found a very substantial increase in a range of reported events.30 A total of 2,843 events were reported in 2002, the first year of full ERS implementation, compared to 1,542 paper-based reports in 2000; 2001 was a transitional year.31 The authors concluded, “[W]e were able to increase reporting significantly and improve our employees’ knowledge and use of the ERS.” The report on adverse events reporting in hospitals issued by the Office of the Inspector General of the Department of Health and Human Services in 2008 recommends expanding the use of electronic health records within and among hospitals.32
Surveys have shown, however, that installation and utilization of electronic medical records systems in most U.S. hospitals is still in its early stages. According to HIMSS Analytics,33 as of September 2006, in U.S. hospitals,34 although “[m]ost lab, radiology and pharmacy departments are automated… the key integrated automations that help to prevent or eliminate medical errors—including computerized practitioner order entry (CPOE), pharmacy dispensing and nursing medication administration—are installed in less than 1 percent of U.S. hospitals.”35 As the RAND Corporation report on the adoption of health information technology observed,
29 See, e.g., Brown, Andrew C.; Bailey, Jessica H.; Miller Davis, Margaret E.; Garrett, Paula; and Rudman, William J., “Improving Patient Safety through Information Technology,” Perspectives in Health Information Management 2004, 2:5 (September 27, 2005). The authors reported the impact of the introduction in 2002 of a web-based reporting system at an academic medical center. Occurrence reports were collected through the web site for information on all medication errors or mistakes. Under the former paper-based system, the number of reported medication errors averaged 416.3 per year. In 2003, the first full year of the new system, the number of reports increased to 958 and it continued to increase to 1,892 in 2004. In the first half of 2005, the hospital reported 1,553 medication errors.
30 Tuttle, D; Holloway, R; Baird T; Sheehan, B; Skelton, W K, “Electronic reporting to improve patient safety,” Quality and Safety in Health Care 2004: 13-281-286.
31 Of the 2,843 events reported, 40 percent were medication/infusion events. Patient harm was reported in 22 percent of all events (21 percent temporary harm and one percent permanent harm). If one applies the permanent harm percentage to the 1,126 medication/infusion events, there would have been approximately 11 instances of permanent harm from medication/infusion events during 2002 at the hospital that was the subject of the study. This casts considerable doubt on the completeness of NYPORTS reporting of Code 108 (medication error that results in permanent harm). From 2004 to 2007, a total of only nine Code 108 reports were filed by all hospitals in the State.
32 The report stated: “Stakeholders reported that widespread use of electronic health records would enhance communication, improving continuity of care and potentially reducing the incidence of adverse events,” and, “In general, stakeholders advocate routine monitoring through automated methods to identify adverse events, followed by use of more extensive methods to confirm results and uncover potential causes.” Office of the Inspector General of the Department of Health and Human Services, Adverse Events in Hospitals: Overview of Key Issues, December 2008.
33 Subsidiary of the Healthcare Information and Management Systems Society.
34 HIMSS Analytics White Paper, EMR Sophistication Correlates to Hospital Quality Data, Comparing EMR Adoption to Care Outcomes at UHC Hospitals, Including Davies Awards Winners, Using HIMSS Analytics’ EMR Adoption Model Scores, 2006.
35 HIMSS Analytics has developed an EMR Adoption ModelTM with eight stages of EMR implementation. As of the 2nd quarter of 2007, about 18.3 percent hospitals were still at Stage 0, in which “some clinical automation may be present, but all three of the ancillary department systems (laboratory, pharmacy, and radiology) are not implemented.” 15.6 percent of hospitals were at Stage 1, in which all three of these ancillary systems have been installed, and 39.7 percent of hospitals had achieved

policy report
March 2009 18
www.comptroller.nyc.gov
“Innovations in information technology (IT) have improved efficiency and quality in many industries. Healthcare has not been one of them.”36 Yet the more advanced automations such as CPOE not only reduce errors, they also make them easier to detect and more likely to be reported. The inaugural report by DOH on the State’s new Hospital-Acquired Infection Reporting System discussed above supports the expansion of electronic reporting systems:
“Hospitals need to develop, enhance and integrate electronic information systems to support infection preventing and enforcement efforts. Very few facilities made use of electronic data transfer and therefore relied on cumbersome manual data collection and entry.”
And, of course, extensive implementation of an electronic medical records system can overcome some of the issues arising from staff turnover and inadequate training. By incorporating proper flags into the computer system, it is easier to identify what events need further review and might be reportable.
High-reporting rate hospitals emphasize NYPORTS reporting compliance, according to hospital officials.
Hospitals with high reporting rates are not substandard hospitals. Rather, these hospitals have emphasized NYPORTS compliance. Responding to the wide reporting disparities the Department observed in NYPORTS’ initial year, in the NYPORTS Annual Report 2000/2001 DOH stated, “Therefore, the Department views hospitals with the highest reporting rates as those most keenly aware of occurrences within their facilities and in the best position to bring about systems improvements.”
Indeed, in the 2008 annual U.S. News and World Report rankings of the nation’s 50 “best” hospitals, the hospital with the second highest 2006 NYPORTS reporting rate in New York City was listed as one the nation’s best hospitals in a majority of the services ranked, and the hospital with the City’s third highest reporting rate, as well as the hospital with the State’s highest reporting rate, were listed in previous U.S. News and World Report best hospital listings. In addition, several hospitals with relatively high reporting rates have received high marks from HealthGrades, a group that rates hospitals in a variety of categories.
A number of highly regarded hospitals, both within but mostly outside of New York City, consistently have had high reporting rates in multiple occurrence codes in successive years. Comptroller staff asked officials of several of these hospitals to explain their high reporting rates. Their responses indicate what other hospitals may be failing to do. A common response was that their hospital took NYPORTS reporting very seriously, their staff had received extensive and recurring NYPORTS training, and the hospital had inculcated a “culture of reporting.”
Stage 2, in which “major ancillary clinical systems feed data to a CDR that provides physician access for retrieving and viewing results.” However, only 24.1 percent of hospitals had reached Stage 3 (clinical documentation such as “vital signs, nursing notes, care plan charting and eMAR” and “general order entry are required, and are implemented and integrated with the CDR for at least one service in the hospital…” And scant percentages of hospitals had reached Stages 4 (e.g. computerized practitioner order entry), 5, or 6. No hospital had as of yet reached Stage 7 in which all medical records are fully electronic. According to HIMSS, “The more sophisticated the EMR, the better the results for quality patient care,” and, “There is a fairly dramatic leap in the impact of hospitals EMRs once an institution has achieved Stage 4 status.”
In its Recommendations for the Obama Administration and the 111th Congress (December 17, 2008), HIMSS Analytics stated that with proper incentives and funding, it is “reasonable” to expect that all non-federal hospitals can reach Stage 4 by the end of 2014.
36 Fonkych, Katernya; Taylor, Roger, The State and Pattern of Health Information Technology Adoption, RAND Health, 2005.

policy report
March 2009 19
www.comptroller.nyc.gov
Extensive utilization of electronic reporting systems was another significant factor. • Small New York City hospital. For 2006, this hospital had the highest overall reporting rate in New York
City, including the highest rates relative to their peers for patient falls (code 751), the second highest rate for surgical site infections (code 808), and the fourth highest rate for deep vein thrombosis DVT (code 402). A hospital quality management official explained to Comptroller staff that the hospital has a “good internal system of reporting,” “closely reviews all internal reports,” and “we would have to justify to ourselves why a report would not be submitted.” The hospital “is educating staff on what is reportable and not reportable, and our medical board is also very involved.” The official observed that “some hospitals see [NYPORTS] reporting as punitive,” but their hospital sees NYPORTS as a valuable tool.
• New York City major academic medical center. For 2006, this hospital had the second highest reporting rate in the City, 90.7 reports per 10,000 discharges, the highest reporting rates for code 808 (surgical site infection) and code 604 (acute myocardial infarction unrelated to a cardiac procedure), and the eighth highest rate for codes 401 (new acute pulmonary embolism) and 402 (newly documented deep vein thrombosis).
In a written response to a Comptroller staff query about the reasons for its high reporting rate, the hospital stated: “We believe the higher number of reported errors is an indicator of a safety culture in which staff feels safe to report adverse events and recognize where safety interventions can improve outcomes... This is reflected in an increase in internal error reporting as well as in reportable events to the DOH.”
More specifically, the hospital cited the establishment of a Patient Safety Director position several years ago and coordination with both Risk Management and Clinical Quality Effectiveness, noting, “The first step in establishing a safety culture is an awareness of the potential threats and enhanced reporting of adverse events for remediation.”
• Very large (more than 30,000 discharges annually) New York City medical center. This very large New York City medical center had the third highest overall reporting rate in the City in 2006. The hospital’s Chief Executive Officer told Comptroller staff that the hospital takes NYPORTS very seriously and “very actively encourages staff to report all events.”
• Major academic medical center outside New York City. This medical center reported 166.3 occurrences per 10,000 discharges, the highest rate in the State. Some of the services provided by this hospital have been been listed in U.S. News & World Report annual rankings of the best hospitals. A hospital official told Comptroller staff that the hospital has honed and developed its surveillance and reporting methods and has an electronic event reporting system that emphasizes “real time” reporting. Furthermore, unlike most other hospitals, staff conducts a “data run” for short form incidents and searches for diagnosis codes that match adverse events. These are checked to determine if an adverse event was present upon admission; if it was not, it will likely be reported under NYPORTS if it falls within a reportable code.37
• Medium-sized hospital, small city. For 2006, this hospital had the third highest reporting rate in the State—149.2 reports per 10,000 discharges—and also had among the largest number of reports of any hospital in the State in 2004 and 2005. In 2006, the hospital reported high rates of DVT and PE (74.6 per 10,000 discharges)
37 An article in the Joint Commission Journal on Quality and Patient Safety described how one hospital matched NYPORTS categories to corresponding combinations of inpatient ICD-9-CM diagnosis and procedure codes. This hospital also considered discharge disposition, primary or secondary coding position, readmissions, and NYPORTS exclusions. Tuttle, Deborah; Panzer, Robert J.; Baird, Tracy, “Using administrative data to improve compliance with mandatory state event reporting,” Joint Commission Journal of Quality Improvement, June 2002.

policy report
March 2009 20
www.comptroller.nyc.gov
and acute myocardial infarction unrelated to a cardiac procedure (6.9 reports per 10,000 discharges), and it had the fifth highest surgical wound site infection reporting rate in the State (40.5 reports per 10,000 discharges). Hospital officials told Comptroller staff that extensive implementation of electronic medical records has improved the identification of reportable occurrences. Also, the hospital has “a team” that meets weekly to discuss “things that are potentially reportable, especially in regard to RCA [root cause analysis].”
The National Research Council (NRC) annually issues Consumer Choice Awards for what it terms “the most-preferred hospitals in over 250 U.S. Markets.” The winners are drawn from the NRC Healthcare Market Guide, which is based on consumer surveys from over 200,000 households. The 2008 awards were given to those hospitals that consumers chose as having the highest quality image in the market. Among the 2008 winners are the hospital with the third highest NYPORTS reporting rate in New York City and, outside of the City, the hospital with the highest rate in the State.
Weak enforcement by DOH has allowed underreporting to persist.
The success of NYPORTS is predicated on hospitals fully complying with the mandatory reporting requirement. But, as pointed out in the report on hospital adverse events reporting issued in December 2008 by the Office of the Inspector General of the U.S. Department of Health and Human Services, “Even when reporting is mandatory, [reporting] systems may have little active oversight and enforcement. Hospitals can have few incentives to report adverse events, particularly when reporting involves risks of disclosure and punitive action.”38 Because mandatory reporting has not been strongly enforced in New York, the enormous reporting-rate disparities documented in this report have developed and been allowed to persist.
Insufficient staff to monitor and follow up on reporting data
Arthur A. Levin, MPH, director of the Center for Medical Consumers and consumer member of the NYPORTS Statewide Council, who is now a member of Technology Advisory Board of the State’s new hospital infection reporting system, told Comptroller staff: “Historically, DOH did not assign full time staff to the NYPORTS program and as a result it has suffered in its ability to oversee the accuracy of reporting and perform a level of analysis that could in turn be used to improve safety.” Department officials told Comptroller staff that funding and staff shortages mean all they can do is “just keep the data coming in.”
Low fines, rarely imposed
DOH issues citations (also called Statements of Deficiency) for failure to adhere to required reporting timeframes or failure to report an event at all. A Statement of Deficiency requires the submission by the hospital of a Plan of Correction, which is a description of the steps that a hospital will take to ensure that future occurrences are fully reported. The corrective actions in the Plan of Correction are devised by the hospital. According to DOH, for 2008 (through mid-November), there were 133 NYPORTS-related citations. However, only a “handful” of these resulted from identification of unreported events; primarily they were for late reporting of occurrence codes that still have reporting timeframes, DOH informed Comptroller staff. 39
There is an enforcement process that DOH can turn to in certain instances of late or omitted reporting, failure to produce a required Plan of Correction, or preparation of an inadequate Plan of Correction. This process
38 Op cit.,Office of the Inspector General.
39 The information provided by DOH that only a “handful” of citations had been issued for under-reporting echoes the report of the 2004 State Comptroller audit of NYPORTS. (See page tk.)

policy report
March 2009 21
www.comptroller.nyc.gov
considers the egregiousness of the outcome or repetition of the same reporting failure. Enforcement requires a Stipulation that is signed by the hospital and DOH. The Stipulation could include a fine of $2,000 per violation and DOH-mandated corrective actions. There is also one-year monitoring by DOH of the terms of the Stipulation. Such monitoring is an unwelcome outcome for the hospital.
However, this enforcement process is rarely used in cases of NYPORTS non-reporting. According to the DOH response to a Comptroller staff query, seven NYPORTS cases have been the subject of enforcement in 2008 (through mid-November). However, all seven cases were brought because of reports to DOH of bad care; they were not brought because DOH detected a failure to report an occurrence through NYPORTS. According to the Department, in only “a very few cases over the years” might a NYPORTS reporting citation have “been included in an overall enforcement action.”
Even if a violation for non-reporting leads eventually to a Stipulation and a monetary sanction, the $2,000 fine is so small that it has little deterrent impact. In 2001, DOH announced it would seek legislation to increase the fine for health facility violations to $6,000 for a first violation, $25,000 for a recurrence and $50,000 if the problem is not corrected during a third inspection.40 These increases were never enacted by the Legislature. Legislation that raises fines for violations of State health laws or regulations finally was enacted in the State budget in 2008, but the new fine schedule falls far short of the levels recommended in 2001. The fine remains at $2,000 per violation and is raised to only $5,000 for a subsequent violation within 12 months of the first violation, and to $10,000 if the violation “directly results in serious physical harm to any patient or patients.”
Bad publicity that could result if a hospital’s underreporting is publicized might serve as an incentive to fully report occurrences. However, the last time DOH released the names of hospitals that underreported was in 2001.
“Voluntary” reporting of five occurrence codes
In a letter DOH sent in May 2005, hospitals were informed that there would be no definite timeframe for reporting six occurrence categories, and that failure to report them would not result in a citation. Previously, these occurrences had to be reported within 30 days. The six categories were: new acute pulmonary embolism (code 401), new documented deep vein thrombosis (code 402), acute myocardial infarction unrelated to a cardiac procedure (code 604), 2nd and 3rd degree burns occurring during impatient or outpatient service encounters (code 701), falls resulting in serious injury (code 751), and post-operative site infection (code 808).
Reporting these occurrences is still required.41 In actuality, the elimination of citations for non-reporting has made it virtually impossible for DOH to force hospitals that have not been reporting these occurrences to begin to do so.
Differences among hospitals can affect reporting rates but are not the primary cause of reporting disparities.
One explanation for some of the disparities in NYPORTS occurrence reporting among hospitals is that hospitals with high reporting rates performed greater numbers of certain procedures that are more prone to adverse events than comparably sized hospitals that did not perform these procedures as frequently. Appendix E has
40 Press release, New York State Department of Health, “State Health Department Study Shows that a Majority of New York Hospitals are Not Reporting Adverse Incidents,” February 12, 2001.
41 Except for code 808, as noted previously.

policy report
March 2009 22
www.comptroller.nyc.gov
an analysis and discussion of this explanation, focusing on codes 401, 402 and 808.42 The conclusion is that differences in medical services and procedures were not significant causes of the disparities observed in reporting of these codes.
C. NYPORTS’ scope has been reduced.
Reporting disparities have persisted, even though the number of reportable occurrences was substantially reduced in 2005 in order to allow DOH to focus more systematically on the remaining reportable events.
As previously mentioned, DOH discontinued 22 reporting codes after the State Comptroller audit of NYPORTS in 2004 discussed above. In its response to the audit report’s findings, DOH characterized the processes needed to more fully detect unreported adverse events as “costly” and stated that “as a result, it would reassess the scope of the NYPORTS program. This reassessment may result in the modification or elimination of defined reporting categories or possibly periodic suspension of the obligation of reporting into select categories to focus efforts on others.”43
Arthur A. Levin, the consumer member of the NYPORTS Statewide Planning Council, told Comptroller staff that lack of feedback contributed to the scaling down: “Because of the lack of analysis of the NYPORTS data and as a result of no or little feedback to hospitals to support their own quality improvement programs there was increasing pressure by facilities to reduce the burden of reporting. This had been a longstanding complaint about previous iterations of hospital incident reporting since 1985 and one which NYPORTS was supposed to address.”
This undercut the main mission of NYPORTS: improving patient care. In the face of this failure by DOH, it made little sense to continue requiring hospitals to report all of these occurrences.
Some of the discontinued occurrence categories provided valuable information.
Another factor contributing to the determination to discontinue a number of the occurrence codes was that they were sufficiently ambiguous that it was proving difficult for hospital staff to pinpoint the actual cause of a reportable adverse event and assign a reporting code. Nevertheless, some of the discontinued occurrence reporting codes provided information that can be of potentially enormous value in maintaining and improving quality of care and medical outcomes.44 Each of these codes had been deemed important and useful when NYPORTS was developed and tested in 1996 and 1997. Indeed, a number of discontinued codes generated hundreds of reports for 2004, the last full year for which they were reported:
• Code 303, pneumothorax [collapsed lung, which can occur as part of a medical procedure, such as catheter insertion] regardless of size or treatment, limited to procedures involving an intravascular catheter. 529 reports in 2004.
• Code 501, all unplanned conversions to an open procedure because of an injury and/or bleeding during the 42 Together, for 2006, a total of 9,933 reports were submitted by acute care general hospitals under these three codes, 71.4 percent of all reports submitted.
43 Department of Health Comments on the Office of the State Comptroller’s Draft Audit Report 2003-S-27 Entitled “Maintaining Information on Adverse Patient Incidents at Hospitals and Clinics.”
44 The DOH letter said that facilities “should consider the benefits of continued internal monitoring and tending of selected events [for which reporting was no longer required] for Quality Assurance purposes.”

policy report
March 2009 23
www.comptroller.nyc.gov
laparoscopic procedure. 242 reports in 2004.
• Code 803, post-operative hemorrhage or hematoma. 4,501 reports in 2004.
• Code 804, anastomotic leakage [leakage of gastric or intestinal fluid along a suture line] requiring repair. 318 reports in 2004.
• Code 805, wound dehiscence [rupture or splitting open] requiring repair. 645 reports in 2004.
• Code 806, displacement, migration or breakage of an implant, device, graft, or drain, whether repaired, intentionally left in place, or removed. 682 reports.
RAND Health, a division of the RAND Corporation, issued a working paper 45 in July 2008 for the Agency for Healthcare Research and Quality (AHRQ) that focused on the development of hospital and long-term care patient safety outcomes measures46 that a panel of patient safety experts, using a complex iterative process,47 determined are both “important”48 and “valid” indicators. Three of the measures they considered overlap with NYPORTS occurrence codes discontinued in 2005. Under this process, the experts reached a consensus that all three had significant importance. These are:
• Iatrogenic [caused by action of a health professional] pneumothorax. The median importance score the experts assigned to this indicator was a 7 on a 1-to-9 scale, in which 1 equaled “not important” and 9 equaled “most important.” All of the candidate measures were also assigned a 20th percentile score, which meant that 80 percent or more of the experts gave it that score or higher. The 20th percentile score for iatrogenic pneumothorax was 6, meaning that least 80 percent of the experts rated this measure a 6 or greater. (Discontinued code 303, pneumothorax, regardless of size or treatment.)
• Postoperative wound dehiscence. The experts gave this measure a median importance of 7 and a 20th percentile score of 5. As discussed below, each instance of wound dehiscence requiring repair results in an excess cost of over $20,000 and an additional 9.42 days of hospitalization. (Discontinued code 805, wound dehiscence requiring repair.)
• Post-operative hemorrhage or hematoma received a median score of 7 and a 20th percentile score of 5. 45 Farley, Donna O., Michael D. Greenberg, Amelia M. Haviland, Susan Lovejoy, Prioritizing Patient Safety Outcomes Measures: Results of an Expert Consensus Process, WR-601-AHRQ.
46 The experts considered Patient Safety Indicators developed for NYPORTS as well as by the Agency of Healthcare Research and Quality, National Quality Forum Serious Reportable Events in Healthcare, National Surgical Quality Improvement Program, Medicare Patient Safety Monitoring System, Utah/Missouri Adverse Event Classes, and others.
47 The experts participated in four rounds. In Round 1, 52 participants joined in establishing sets of candidate measures. In Round 2, they rated each candidate measure based solely on the importance of the patient safety issue it represents. The rating was done on a scale of 1 to 9 where 1 = not important and 9 = most important. A total of 47 participants provided ratings. In Round 3, participants rated for validity the measures which were found to be most important in Round 2. In Round 4, a teleconference was held for a group discussion of the resulting ratings.
48 According to the report of the consensus project, “important” outcomes were those that strongly involve some combination of the following features: health care origin (adverse effect or event resulting from health care that should not occur with effective systems and practices); patient harm (a strong likelihood for harm to patients; frequency (an adverse outcome that is at risk of occurring frequently).
policy report
March 2009 24
www.comptroller.nyc.gov
(Discontinued code 803, hemorrhage or hematoma requiring drainage, evacuation or other procedural intervention)
The experts49 rated several NYPORTS occurrence codes retained after 2005 as equally important to or less important than these three that were discontinued.50
A new “near misses” reporting program will be of some, but limited, utility.
In November 2007, DOH and the New York chapter of the American College of Physicians announced an agreement to analyze “near misses” in hospitals in a three-year demonstration program. These are occurrences that could have harmed a patient, but did not. Under the program, DOH will confidentially collect and analyze these occurrences as a “complement” to NYPORTS reporting.51 However, only hospital residents (doctors in training) in internal medicine report near-misses and, since reporting will be voluntary, it is likely to be far from complete. Moreover, reporting covers only “near misses” that present an immediate danger of serious patient harm and not the larger numbers of occurrences that present a potential for serious patient harm.
III. NYPORTS Can Help Avoid Unnecessary Costs to the Healthcare System Adverse occurrences result in longer lengths of hospital stay and/or readmissions, as well as in additional
surgeries or other procedures to reverse or repair the damage. All of this adds to health care costs.
Excess costs and higher mortality rates
An indication of the high excess costs associated with adverse events can be ascertained from an analysis of excess length of stay, charges and mortality attributable to medical injuries during hospitalization published in the Journal of the American Medical Association in 2003.52 The authors used Agency of Healthcare Research and Quality Patient Safety Indicators to identify medical injuries in a large sample of hospitals across the nation. Of 18 different patient safety events analyzed, five were positively correlated at least in part with current NYPORTS reporting codes or one discontinued in 2005. The excess cost per case from this study is shown in the table below.53
49 The participants were the lead researchers for AHRQ-funded patient safety projects.
50 Including: Code 916 (cardiac and/or respiratory arrest requiring advanced cardiac life support, median importance score of 7 and 20th percentile score of 4; Code 918 (impairment of limb, organ, or body function), median score of 7 and 20th percentile score of 2; Code 751 (patient fall), median score of 6 and 20th percentile score of 4; Code 604 (acute myocardial infarction unrelated to a surgical procedure), median score of 6 and a 20th percentile score of 4; and Code 932 (external disaster outside the control of the hospital which affects facility operation), median score 3 and a 20th percentile score of 1.
51 Press release, New York State Department of Health, “Health Department Establishes a Voluntary `Near-Miss’ Hospital Event Reporting System with American College of Physicians,” November 13, 2007.
52 Zhan, Chunliu; Miller, Marlene R., “Excess length of stay, charges and mortality attributable to medical injuries during hospitalization,” Journal of the American Medical Association, October 8, 2003.
53 The article provided the excess charge for each occurrence. The cost figures below are half of the excess charge. As the authors noted in a footnote, one can assume an average cost to charge ratio of 0.5.
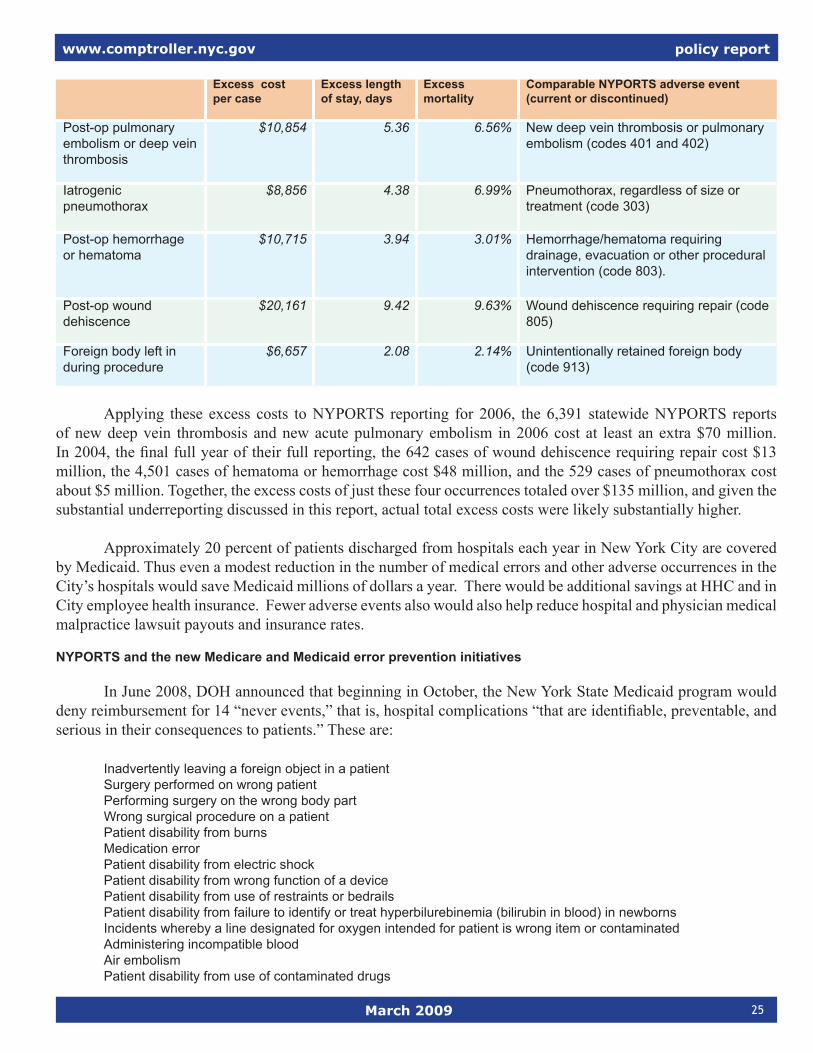
policy report
March 2009 25
www.comptroller.nyc.gov
Excess cost per case
Excess length of stay, days
Excess mortality
Comparable NYPORTS adverse event (current or discontinued)
Post-op pulmonary embolism or deep vein thrombosis
$10,854 5.36 6.56% New deep vein thrombosis or pulmonary embolism (codes 401 and 402)
Iatrogenic pneumothorax
$8,856 4.38 6.99% Pneumothorax, regardless of size or treatment (code 303)
Post-op hemorrhage or hematoma
$10,715 3.94 3.01% Hemorrhage/hematoma requiring drainage, evacuation or other procedural intervention (code 803).
Post-op wound dehiscence
$20,161 9.42 9.63% Wound dehiscence requiring repair (code 805)
Foreign body left in during procedure
$6,657 2.08 2.14% Unintentionally retained foreign body (code 913)
Applying these excess costs to NYPORTS reporting for 2006, the 6,391 statewide NYPORTS reports of new deep vein thrombosis and new acute pulmonary embolism in 2006 cost at least an extra $70 million. In 2004, the final full year of their full reporting, the 642 cases of wound dehiscence requiring repair cost $13 million, the 4,501 cases of hematoma or hemorrhage cost $48 million, and the 529 cases of pneumothorax cost about $5 million. Together, the excess costs of just these four occurrences totaled over $135 million, and given the substantial underreporting discussed in this report, actual total excess costs were likely substantially higher.
Approximately 20 percent of patients discharged from hospitals each year in New York City are covered by Medicaid. Thus even a modest reduction in the number of medical errors and other adverse occurrences in the City’s hospitals would save Medicaid millions of dollars a year. There would be additional savings at HHC and in City employee health insurance. Fewer adverse events also would also help reduce hospital and physician medical malpractice lawsuit payouts and insurance rates.
NYPORTS and the new Medicare and Medicaid error prevention initiatives
In June 2008, DOH announced that beginning in October, the New York State Medicaid program would deny reimbursement for 14 “never events,” that is, hospital complications “that are identifiable, preventable, and serious in their consequences to patients.” These are:
Inadvertently leaving a foreign object in a patient Surgery performed on wrong patient Performing surgery on the wrong body part Wrong surgical procedure on a patient Patient disability from burns Medication error Patient disability from electric shock Patient disability from wrong function of a device Patient disability from use of restraints or bedrails Patient disability from failure to identify or treat hyperbilurebinemia (bilirubin in blood) in newborns Incidents whereby a line designated for oxygen intended for patient is wrong item or contaminated Administering incompatible blood Air embolism Patient disability from use of contaminated drugs

policy report
March 2009 26
www.comptroller.nyc.gov
The first six events on the above list are currently covered by NYPORTS reporting codes. The first five occur relatively rarely. However, as discussed above, the sixth event, medication error, does occur relatively frequently, according to national studies, and appears to have been underreported to NYPORTS.
As of October 2008, the U.S Centers for Medicare and Medicaid Services (CMS) announced that Medicare will no longer pay hospitals at a higher rate for the increased cost of care that results when a patient is harmed by one of ten conditions they did not have when first admitted to the hospital and that was reasonably preventable by following generally accepted guidelines. These are:
Falls and traumaVascular catheter-associated infectionManifestations of poor blood sugar controlCatheter-associated urinary tract infectionDeep vein thrombosis and pulmonary embolism following total hip or knee replacementForeign object retained after surgeryAir embolismBlood incompatibilitySurgical site infection in the chest after coronary artery bypass graft surgery, certain orthopedic and bariatric proceduresStage 3 and 4 pressure ulcers
It is likely that the lack of reimbursement by Medicare and Medicaid for these various events will motivate
hospitals to minimize their occurrence in order to avoid having to render care for which no reimbursement is available. Thus, these changes in the Medicare and Medicaid programs serve as financial sanctions to improve patient care.
However, reporting under NYPORTS, coupled with better monitoring and enforcement by DOH, remains imperative for the following reasons:
• Some adverse events reportable to NYPORTS are not covered by the Medicaid and Medicare non-payment policies. Both the Medicare and Medicaid lists omit a number of occurrences that currently are covered by NYPORTS reporting codes, such as acute myocardial infarction unrelated to a cardiac procedure, or they only partially overlap with a NYPORTS occurrence code; for example, NYPORTS requires reporting of all new documented deep vein thromboses and acute pulmonary embolisms while the Medicare list covers them only when they follow hip or knee replacement.
• Not all patients are covered by the Medicare and Medicare financial disincentives. Medicaid covers those with very low incomes and Medicare is limited to the elderly and the disabled.
• Hospitals will have even greater need for the NYPORTS peer-comparison feature. Hospitals are not able to readily compare their records in critical safety and quality occurrences against their peers except through NYPORTS. Indeed, for this reason it may be advisable to require reporting through NYPORTS of some of the occurrences on the Medicaid and Medicare lists that currently are not NYPORTS-reportable. As noted earlier, the RAND expert consensus project concluded that air embolism—which is on both the Medicaid and Medicare lists—is an important patient safety indicator. Others that were deemed of substantial importance are pressure ulcers and patient disability from use of restraints.

policy report
March 2009 27
www.comptroller.nyc.gov
IV. Recommendations
In recent years, New York hospitals have developed a heightened awareness of quality of care and patient safety. And over the past 15 years, New York State has established several programs aimed at improving hospital outcomes, such as a comparison among hospitals of risk adjusted mortality rates for pediatric congenital heart surgery.
NYPORTS remains potentially the most valuable of these programs. It began on a note of optimism that hospitals would fully disclose to DOH all reportable occurrences, that hospitals would be able to compare their performance against a peer group, and that sufficient resources would be provided for DOH to analyze reporting data and provide useful feedback.
To be sure, NYPORTS has continued to serve a valuable role by bringing to DOH attention certain most-serious “never” events, such as surgery on the wrong part of the patient’s body, and several other occurrences that still require a Root Cause Analysis. The Department continues to review Root Cause Analysis reports, even if the results of these reviews are not disseminated as widely as they might be. However, the ability of NYPORTS to more broadly improve the quality of care and reduce unnecessary costs has been seriously compromised.54 It is time to reinvigorate NYPORTS and return it to its original mission. The Office of the Comptroller therefore recommends:
• DOH should enforce mandatory reporting. The high reporting rates by some of the State’s most highly regarded hospitals demonstrate that much more complete reporting of occurrences is indeed feasible and practical. It is unfair to hospitals that report hundreds of occurrences a year that there are hospitals of comparable size and patient mix that report mere dozens. Underreporting undermines the utility of the entire NYPORTS program.
o DOH should make more use of medical records audits, including comparisons with SPARCS data whenever possible, and of retrospective chart reviews, to check for compliance with NYPORTS reporting requirements. 55 This recommendation echoes a recommendation in the State Comptroller’s audit report in 2004 that “Department-sponsored efforts to identify unreported occurrences be expanded…”
Expanded compliance review need not be costly. An expansive effort that covers all codes at all hospitals is not necessary. Rather, based in large part on review of past reporting rates, individual hospitals could be selected for review according to an assessment of their risk of underreporting. In addition, DOH could periodically select a limited set of reporting categories to receive intensive enforcement. And, rather than
54 NYPORTS regulations (NYCRR 405.8 (b)) clearly do not limit reporting to a short list of statutory events, narrow categories of “never” events, and other immediately serious occurrences. The regulations also more inclusively provide that “injuries and impairments of bodily functions… that necessitate additional or more complicated treatment regimens or that result in a significant change in patient status, shall also be considered reportable under this subdivision”.
55 The report by the Office of Inspector General, U.S. Department of Health and Human Services, Adverse Events in Hospitals: An Overview of Key Issues (December 2008), presents additional means to identify adverse events that should be considered. In addition to medical record review, among these are administrative data screening (“[A]utomated programs can review administrative data, such as payment claims and hospital discharge data, to identify possible adverse events”); electronic medical record surveillance (as discussed elsewhere in this report); and “patient surveys or interviews (“[O]ne study found that patients contacted within 10 days of discharge identified more adverse events than medical record reviewers and hospital incident reports”).

policy report
March 2009 28
www.comptroller.nyc.gov
broadly search for non-reporting among the full range of occurrence codes, DOH can periodically select sets of occurrence categories on which to focus, based on assessment of frequency. Certainly, ensuring reporting of the most serious occurrences in the 900 series of reporting codes should be the first priority, but it is also of great importance for quality of care and cost containment that reporting of other occurrence codes also be enforced.
o Fines should be raised. In 2001, DOH announced that it would seek legislative changes that would increase fines above the maximum of $2,000 per violation. Those hospitals found to be in non-compliance with NYPORTS requirements would be fined $6,000 for the first violation, $25,000 for a recurrence and $50,000 if the problem is not corrected during a third inspection.56 The new fine schedule established in 2008 retains the $2,000 fine for an initial violation, and the maximum possible fine is $10,000, but only if there is a patient death or serious injury. The fine schedule proposed in 2001 should be adopted.
o There should be definite timeframes for reporting of all occurrence codes and citations for non-reporting. The Department’s decision in 2005 not to issue citations for six important occurrence categories rendered meaningless the continued requirement to continue to report the five of these categories that continue to be reportable. Timeframes and citations should be restored.
Past experience shows that it is, indeed, possible to achieve much more complete reporting. As discussed earlier, in 2001 a federally funded study of reporting of four NYPORTS occurrence codes uncovered extremely low reporting rates, ranging from only 12 percent of post-operative surgical site infections to 29 percent of acute myocardial infarctions unrelated to a cardiac procedure. Once the hospitals in the study were asked to reassess their adverse event reporting systems and make improvements, a follow-up study found dramatic increases in reporting rates; 83 percent of post-operative surgical site infections were subsequently reported, for example.
• DOH should selectively restore a number of the occurrence categories that were discontinued in 2005 and should consider new ones. The selection process should consider frequency of the occurrence, potential for patient harm, potential to remediate identified deficiencies, and potential financial savings to the healthcare system. The working paper of the RAND patient safety expert consensus project discussed above could be consulted in choosing which codes to restore, perhaps with adjustments, and new ones to add. Among occurrences the RAND experts considered important that might be made NYPORTS-reportable are:
o Air embolism (a medical condition caused by gas bubbles in the bloodstream). The RAND expert consensus project gave air embolism a high median importance score of 8 (on a 1-to-9 scale) and a 20th percentile score of 5 (at least 80 percent of the experts gave it a 5).
o Severe pressure ulcers (bedsores) acquired within a hospital. The RAND expert consensus project gave this measure a median importance score of 8 and a 20th percentile score of 7. The New Jersey Department of Health and Senior Services requires health facilities to report Stage III or IV pressure ulcers acquired after admission to a health care facility.57
56 Press release, New York State Department of Health, “State Health Department Study Shows that Majority of New York Hospitals Are Not Reporting Adverse Incidents,” February 12, 2001.
57 In addition, the New Jersey 2007 Patient Safety Initiative Summary Report includes a useful analysis of pressure ulcer reporting data. It breaks out pressure ulcers reports by patient average age, the number of days since admission and the impact on patients, such as that 98 percent of pressure ulcer patients required additional monitoring, 34 percent required additional laboratory testing and 28 percent needed minor surgery.
policy report
March 2009 29
www.comptroller.nyc.gov
o Patient harm from use of restraints The RAND expert consensus project gave this measure a median importance score of 8 and a 20th percentile score of 5.
• NYPORTS must be adequately funded. New York State is currently experiencing its most difficult fiscal crisis in decades. However, it has been well documented that reducing medical errors and other adverse events in hospitals saves money. A robust, reinvigorated NYPORTS would be an investment that more than pays for itself.
Arthur A. Levin, MPH, Director of the Center for Medical Consumers and a member of the NYPORTS Advisory Council (an advisory group), told Comptroller staff, “Considering the tens of billions of dollars that the State spends on health care for Medicaid beneficiaries and its employees, using a fraction of a percent of that money to `buy’ safer, higher quality services would produce a substantial increase in current levels of support. The State arguably has a fiduciary responsibility to use the revenues derived from New York taxpayers prudently.”
Levin specifically recommended to Comptroller staff that DOH locate NYPORTS within the newly created Division of Quality and Patient Safety, and that the Department allocate sufficient full-time staff and other resources to: 1) conduct NYPORTS training for hospital staff and technical advisory functions, 2) conduct routine audits of a random sample of hospitals to determine reporting completeness and accuracy; 3) undertake targeted audits of outlier hospitals and initiate an enforcement action if warranted; have the analytic capacity, 4) either on staff or through engagement of external contractors, to convert reported aggregate data into actionable information to inform remediation efforts; 5) commit to timely feedback of comparative incident data to hospitals to support their internal quality improvement efforts; and 6) develop a web-based interactive ability to facilitate statewide improvement through sharing “lessons learned” and best practices.
Levin also urged that NYPORTS “at minimum coordinate with, and to the greatest extent possible, integrate with, other mandated state hospital reporting programs so as to relieve unnecessary and overlapping administrative burdens on hospitals and to create efficiencies of scale for DOH.” He noted, “Accurate comparative information from a revitalized NYPORTS has the potential to make important contributions to ongoing health reform efforts in New York State by providing information about the comparative safety, quality and value of hospital care in NYS.”
• Hospitals need to be adequately funded to fully implement electronic records systems. Such systems will pay for themselves by reducing costs associated with adverse occurrences. If necessary, the State could create a revolving loan fund to assist hospitals with their upfront costs.
• DOH should release annual NYPORTS reports and issue them more promptly. The Department currently is working on a 2005-2006 report. By the time it is released, much of its information will be outdated and two years of potential benefit from any analyses of reporting data will have been lost. The reports should cover one-year periods, as did the report for 1999. DOH also should resume publication of the periodic NYPORTS News and Alert, which has been suspended.
• DOH should very closely monitor reporting completeness under the new Hospital-Acquired Infection
Reporting System. Effective January 1, 2008, New York State established a Hospital-Acquired Infection (HAI) Reporting System. This system supplants NYPORTS for the purposes of hospital acquired infections, which hospitals must report monthly within 60 days after an occurrence.58 The system was begun in 2006, ran
58 In 2007, the HAI required reporting of the following infections: colon surgical site, coronary artery bypass surgical site,

policy report
March 2009 30
www.comptroller.nyc.gov
as a pilot in 2007, and became fully operational for 2008.
The legislation creating the system59 requires DOH to report to the Governor and the Legislature on hospital-acquired infection rates adjusted for the potential differences in risk factors for each reporting hospital, an analysis of trends in the prevention and control of hospital acquired infection rates with State, regional and, if available, national comparisons, and a narrative describing the lessons for safety and quality improvement that can be learned from leadership hospitals and programs.
The statute also directs DOH to develop and implement an audit process to assure the accuracy of the self-reported hospital data. To ensure that hospitals have the resources needed for ongoing staff education and training in hospital-acquired infection prevention and control, DOH may make grants to hospitals within appropriated amounts. In May 2008, DOH selected seven not-for-profit healthcare organizations to share $1.2 million for demonstration projects to reduce hospital-acquired infections.These included the Hospital Association of New York State, the Greater New York Hospital Association, the New York City Health and Hospitals Corporation and four individual hospitals across the State.
While the development of this system is a very significant step toward reducing hospital-acquired infections, DOH must be on guard lest the reporting completeness problems experienced with NYPORTS code 808 (post-operative surgical site infections) affect this system as well. To be sure, between July 2007 and January 2008, on-site visits with chart review were conducted at 183 hospitals.60 However, the effectiveness of these audits could be constrained by a lack of effective sanctions. DOH asserts in its Pilot Year 2007 report on the new HAI System that, “Regulatory action will be taken if hospitals do not report reliable data.” But as explained elsewhere in this report, the ultimate sanction—fines—remains weak. Moreover, DOH is devoting substantial new staff resources to the HAI system, which may not be sustainable in the long term.
Quality of hospital care is a national issue that must be addressed if we are to improve outcomes and lower medical costs. Improving the quality of health care by reducing avoidable medical errors and other adverse events will produce substantial savings.
New York State started out as a bold leader is this area, even before the IOM report gave the high prevalence of medical errors widespread attention. Although advances are being made in areas such as hospital-acquired infection reporting, New York needs to make hospital adverse event reduction a priority again.
central line associated bloodstream infections in adult/pediatric ICUs, central line associated bloodstream infections in neonatal ICUs.
59 Public Health Law Section 2819.
60 According to Report to Hospitals – New York State Department of Health, Hospital-Acquired Infection Reporting System, Pilot Year 2007, issued June 30, 2008.

policy report
March 2009 i
www.comptroller.nyc.gov
Appendix A
Number of NYPORTS Reports by Occurrence Code, 2004 to 2007 61
Note: Codes marked “Na” in 2006 and 2007 were discontinued by DOH in 2005.Occurrence Code 2004 2005 2006 2007Medication error occurred that resulted in permanent patient harm*
108 8 5 2 6
Medication error occurred that resulted in near-death event*
109 24 12 13 11
Medication error occurred that resulted in patient death*
110 12 12 8 9
Aspiration pneumonitis/ pneumonia in a non-intubated pt related to conscious sedation
201 48 18 Na Na
Necrosis or infection requiring repair incision and drainage, debridement or other surgical intervention
301 129 32 Na Na
Volume overload leading to pulmonary edema
302 60 14 Na Na
Pneumothorax, regardless of size or treatment
303 529 205 Na Na
New, acute pulmonary embolism, confirmed, or suspected and treated
401 1,929 2,318 2,273 2,043
New documented deep vein thrombosis at any site62
402 4,262 4,507 4,939 4,420
Unplanned conversion to open procedure because of injury and/or bleeding during laparoscopic procedure
501 242 89 Na Na
Any new central neurological deficit (e.g. TIA, stroke) –excludes deficits due to direct procedures on the central nervous system
601 438 155 Na Na
Any new central neurological deficit (e.g. TIA, stroke, hypoxic/anoxic encephalopathy)
602 155 60 Na Na
Cardiac arrest with successful resuscitation
603 378 144 Na Na
Acute myocardial infarction unrelated to a cardiac procedure.
604 788 819 738 605
Death occurring after a specific procedure (a list of procedures, e.g. appendectomy, was attached in Definitions Manual)
605 362 116 Na Na
61 Totals include all reporting hospitals and diagnostic and treatment centers.
62 Deep vein thrombosis is a blood clot in a major vein, usually in the legs and/or pelvis. It is a complication in patients who have had surgery. It can be fatal if not identified and treated properly.

policy report
March 2009 ii
www.comptroller.nyc.gov
Burns occurring during inpatient or outpatient service encounters
701 136 123 110 84
Falls resulting in x-ray with proven fractures or internal trauma;
751 1,174 1,121 1,138 986
Procedure related injury requiring repair, removal of an organ, or other procedural intervention
801 2,777 943 Na Na
Hemorrhage/hematoma requiring drainage, evacuation or other procedural intervention
803 4,501 1,433 Na Na
Anastomatic leakage requiring repair
804 318 122 Na Na
Wound dehiscence requiring repair
805 642 210 Na Na
Displacement, migration or breakage of an implant, device, graft, or drain, whether repaired, intentionally left in place or removed
806 682 203 Na Na
Thrombosed distal bypass graft requiring repair
807 169 32 Na Na
Post operative surgical site infection performed in the O.R. or surgical suite requiring drainage during the hospital stay or inpatient hospital admission within 30 days
808 3,957 4,476 3,905 69
Any unplanned operation or re-operation related to the primary procedure, regardless of the setting of the primary procedure
819 3,897 1,202 Na Na
Post partum hysterectomy 851 97 42 Na NaInverted uterus 852 7 4 Na NaRuptured uterus 853 44 16 Na NaCircumcision requiring repair 854 0 6 Na NaOther serious occurrence warranting DOH notification
901 374 505 472 369
Specific patient transfers from diagnostic and treatment center to hospital63
902 906 1,180 656 426
Wrong patient, wrong site surgical procedure*
911 20 21 22 20
Incorrect procedure* 912 107 100 95 106Unintentionally retained foreign body*
913 93 95 129 122
Misadministration of radiation or radioactive material
914 39 58 38 38
Unexpected deaths* 915 949 720 751 720Cardiac and/or respiratory arrest requiring ACLS intervention (inc delay in treatment, diagnosis or an omission of care)*
916 118 107 137 127
63 Code 902 is reported by diagnostic and treatment centers, not by hospitals.

policy report
March 2009 iii
www.comptroller.nyc.gov
Loss of limb or organ (including delay in treatment, diagnosis or an omission of care)*
917 23 38 46 45
Impairment of limb or organ (including delay in treatment, diagnosis or an omission of care)*
918 116 218 246 279
Any unexpected adverse occurrence not directly related to the natural course of the patient’s underlying condition resulting in loss of bodily functions, etc.**
919 164 56 Na Na
Error of omission or delay resulting in death/serious injury**
920 122 35 Na Na
Crime resulting in death or serious injury
921 3 1 0 1
Suicides and attempted suicides related to inpatient hospitalization, with serious injury**
922 12 13 16 10
Elopement from hospital resulting in death or serious injury**
923 2 8 7 5
Strike by hospital staff 931 3 4 0 2External disaster outside the control of the hospital resulting in death or serious injury
932 22 41 88 105
Termination of services vital to the continued safe operation of the hospital or to the health and safety of patients and personnel
933 266 290 222 166
Poisoning occurring within the hospital (water, air, food)
934 2 2 7 2
Hospital fire disrupting patient care or causing harm to patients or staff
935 30 32 55 58
Malfunction of equipment during treatment or diagnosis or defect in product which has a potential for adversely affecting a pt or hospital personnel or results in retained foreign body
937 480 427 287 292
Malfunction of equipment during treatment or diagnosis or defect in product which results in death or serious injury*
938 6 5 2 5
Infant abduction** 961 1 1 0 0Infant discharged to wrong family**
962 0 0 0 0
Rape of patient** 963 6 2 0 8TOTAL 31,629 22,398 16,402 11,135
*Always requires a Root Cause Analysis.**Required a Root Cause Analysis; code was discontinued in 2005.
policy report
March 2009 iv
www.comptroller.nyc.gov
Appendix B
Evolution of NYPORTS and Current Reporting Requirements
Reporting requirements
In 1985, with the enactment of Section 2805-l of the Public Health Law, New York State began to mandate reporting to the Department of Health of certain kinds of hospital adverse events. Adverse events, which are referred to as occurrences, are defined as an unintended adverse and undesirable development in an individual patient’s condition,64 such as death or impairment of bodily functions in circumstances other than those related to the natural course of illness, disease or proper treatment.65 The law also lists several specific occurrences that must be reported, such as “fires within the hospital which disrupt the provision of patient care services or cause harm to patients or staff.”
The State’s initial mandatory reporting system, the Hospital Incident Reporting System (HIRS), was paper-based. It provided only minimal potentially useful feedback to hospitals. In 1993, HIRS was replaced by the Patient Event Tracking System (PETS), which was based on e-mail reporting by hospitals. However, there was a great deal of variation in reporting because of wide interpretations in what to report. In 1998, to correct this and other deficiencies, NYPORTS was created. It was the product of several years of development by a working group that included DOH as well as hospital industry representatives and a consumer member.
As described in an article in a compendium on patient safety written by individuals who were involved with the development of NYPORTS and/or help to administer the program today:
“Building on a collaborative model with the workgroup, the NYSDOH and hospital association representatives aimed to produce a system that was simple, clear, and outcomes-driven, providing useful information for hospitals to improve their own care. The New York Patient Occurrence and Tracking System was created to focus on quality improvement in conjunction with simplifying reporting, streamlining occurrence coding, and coordinating with other existing systems.”66
Over four dozen discrete occurrence categories were designated, each with an occurrence code. (See Appendix A for a full listing of codes.) Three codes, relating to medication errors (codes 108, 109 and 110), were added in 2000. There were a total of 54 occurrence reporting codes by 2000. 64 According to the IOM report, To Err is Human, an adverse event (or incident) is an injury or death resulting from medical management, while a medical error is the failure of a planned action to be completed as intended, or use of the wrong plan to achieve an aim. Most adverse events are not medical errors, per se, although they do have the potential to cause serious patient harm or death.
65 In addition to specifically mentioning reportable incidences such as hospital fires, the accompanying regulation, NYCRR 405.8 (b), broadly defines reportable incidents as: “Patients’ deaths in circumstances other than those related to the natural course of illness, disease or proper treatment in accordance with generally accepted medical standards. Injuries and impairments of bodily functions, in circumstances other than those related to the natural course of illness, disease or proper treatment in accordance with generally accepted medical standards that necessitate additional or more complicated treatment regimens or that result in a significant change in patient status, shall also be considered reportable under this subdivision”.
66 Ellen Flink, Lynn C. Chevalier, Angelo Ruperto, Peg Dameron, Frederick J. Heigel, Ruth Leslie, Janet Mannion, Robert J. Panzer, ,“Lessons Learned from the Evolution of Mandatory Adverse Event Reporting,” Advancing Patient Safety: From Research to Implementation, Vol. 3, February 2005. This compendium was sponsored jointly by the Agency for Healthcare Research and Quality (AHRQ) and the Department of Defense (DoD)-Health Affairs.

policy report
March 2009 v
www.comptroller.nyc.gov
The NYPORTS system was extensively field tested and refined in 1997 and 1998. The result, as described in the 2002-2004 NYPORTS Annual Report, is a system “based on objective criteria and [that] provides hospitals with clear definitions of what must be reported.” To help hospitals fully comply with reporting requirements, DOH issued a NYPORTS Users Manual with an “includes/excludes list” specifically describing what should and should not be reported under each occurrence code.
Hospitals submit either a short form or long form report via the secure NYPORTS web site. Long form reports are used for what are considered the most serious occurrences.
900-series reporting codes
Occurrences reportable under the 900-series codes (23 occurrence codes between code 901 and code 963) and the medication error codes, codes 108, 109 and 110, must be reported within 24 hours or one business day of the date of awareness of the event.
Long form reports are used for the following eight 900 series occurrence codes:
Code 911 Wrong patient, wrong site—surgical procedure Code 912 Incorrect procedure or treatment—invasive Code 913 Unintentionally retained foreign body Code 915 Unexpected deaths (including delay in treatment, diagnosis or an omission of care) Code 916 Cardiac and/or respiratory arrest requiring ACLS [advanced cardiopulmonary life support] intervention Code 917 Loss of limb or organ (including delay in treatment, diagnosis or an omission of care) Code 918 Impairment of a limb, organ or body function (including delay in treatment, diagnosis or an omission of care) Code 938 Malfunction of equipment during treatment or diagnosis, or a defective product resulting in death or serious injury
For these occurrences, within 30 days hospitals also must prepare a detailed Root Cause Analysis (RCA), which is supposed to describe in detail what happened, identifies a proximate cause, includes an interdisciplinary analysis of the occurrence, summarizes what was learned, and lists specific measurable risk-reduction strategies that will be followed.
Finally, there are 15 other 900-series codes, ranging from code 901 (other serious occurrence warranting DOH notification) to code 963 (rape of a patient) that also must be reported immediately. Code 902 (specific patient transfers from diagnostic and treatment center to a hospital) are not reported by hospitals.
Other reporting codes
Codes 401 and 402 are for embolitic and related disorders, new acute pulmonary embolism and new documented deep vein thrombosis, respectively. Code 604, acute myocardial infarction unrelated to a cardiac procedure, is the one code remaining under the heading of peri-operative and peri-procedural-related occurrences, code 701 is for patient burns, and code 751 for patient falls. Code 808 covered post-operative wound site infections (code 808 was discontinued in 2007). Only short form reports must be filed for these occurrences. As discussed in the main text, in 2005 reporting timeframes were discontinued and non-reporting citations ended for all of these codes.
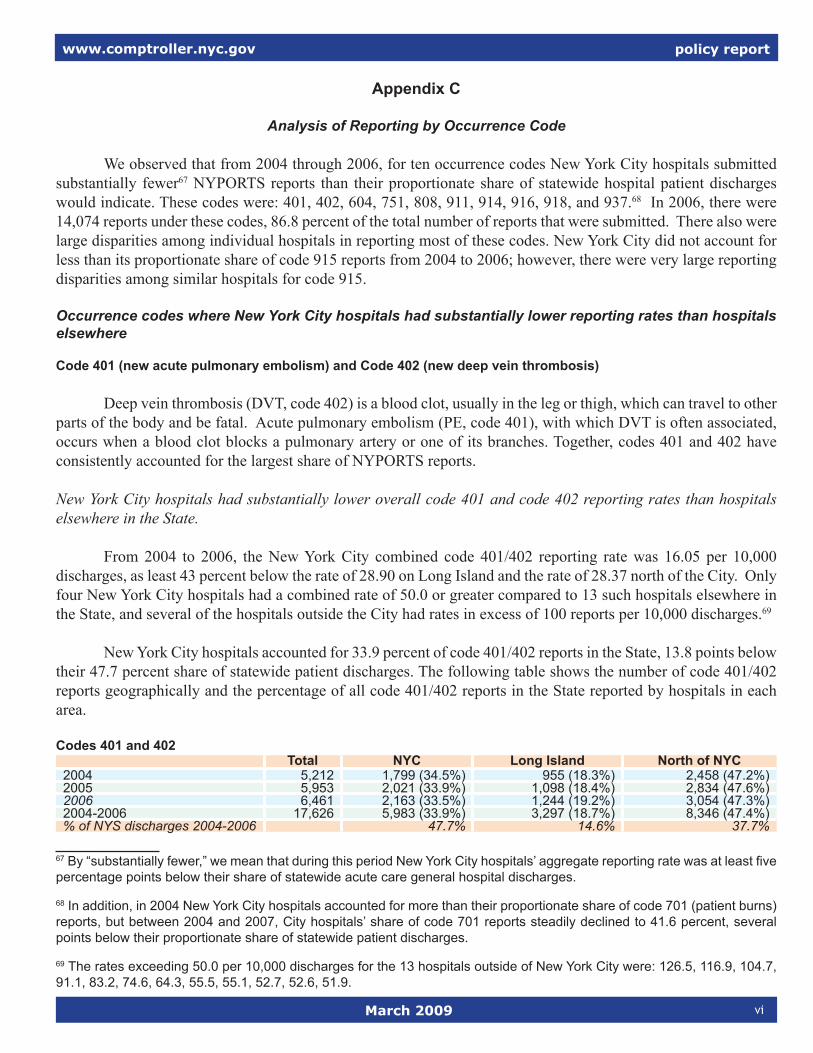
policy report
March 2009 vi
www.comptroller.nyc.gov
Appendix C
Analysis of Reporting by Occurrence Code We observed that from 2004 through 2006, for ten occurrence codes New York City hospitals submitted substantially fewer67 NYPORTS reports than their proportionate share of statewide hospital patient discharges would indicate. These codes were: 401, 402, 604, 751, 808, 911, 914, 916, 918, and 937.68 In 2006, there were 14,074 reports under these codes, 86.8 percent of the total number of reports that were submitted. There also were large disparities among individual hospitals in reporting most of these codes. New York City did not account for less than its proportionate share of code 915 reports from 2004 to 2006; however, there were very large reporting disparities among similar hospitals for code 915. Occurrence codes where New York City hospitals had substantially lower reporting rates than hospitals elsewhere
Code 401 (new acute pulmonary embolism) and Code 402 (new deep vein thrombosis)
Deep vein thrombosis (DVT, code 402) is a blood clot, usually in the leg or thigh, which can travel to other parts of the body and be fatal. Acute pulmonary embolism (PE, code 401), with which DVT is often associated, occurs when a blood clot blocks a pulmonary artery or one of its branches. Together, codes 401 and 402 have consistently accounted for the largest share of NYPORTS reports.
New York City hospitals had substantially lower overall code 401 and code 402 reporting rates than hospitals elsewhere in the State.
From 2004 to 2006, the New York City combined code 401/402 reporting rate was 16.05 per 10,000 discharges, as least 43 percent below the rate of 28.90 on Long Island and the rate of 28.37 north of the City. Only four New York City hospitals had a combined rate of 50.0 or greater compared to 13 such hospitals elsewhere in the State, and several of the hospitals outside the City had rates in excess of 100 reports per 10,000 discharges.69
New York City hospitals accounted for 33.9 percent of code 401/402 reports in the State, 13.8 points below their 47.7 percent share of statewide patient discharges. The following table shows the number of code 401/402 reports geographically and the percentage of all code 401/402 reports in the State reported by hospitals in each area.
Codes 401 and 402Total NYC Long Island North of NYC
2004 5,212 1,799 (34.5%) 955 (18.3%) 2,458 (47.2%)2005 5,953 2,021 (33.9%) 1,098 (18.4%) 2,834 (47.6%)2006 6,461 2,163 (33.5%) 1,244 (19.2%) 3,054 (47.3%)2004-2006 17,626 5,983 (33.9%) 3,297 (18.7%) 8,346 (47.4%)% of NYS discharges 2004-2006 47.7% 14.6% 37.7%
67 By “substantially fewer,” we mean that during this period New York City hospitals’ aggregate reporting rate was at least five percentage points below their share of statewide acute care general hospital discharges.
68 In addition, in 2004 New York City hospitals accounted for more than their proportionate share of code 701 (patient burns) reports, but between 2004 and 2007, City hospitals’ share of code 701 reports steadily declined to 41.6 percent, several points below their proportionate share of statewide patient discharges.
69 The rates exceeding 50.0 per 10,000 discharges for the 13 hospitals outside of New York City were: 126.5, 116.9, 104.7, 91.1, 83.2, 74.6, 64.3, 55.5, 55.1, 52.7, 52.6, 51.9.
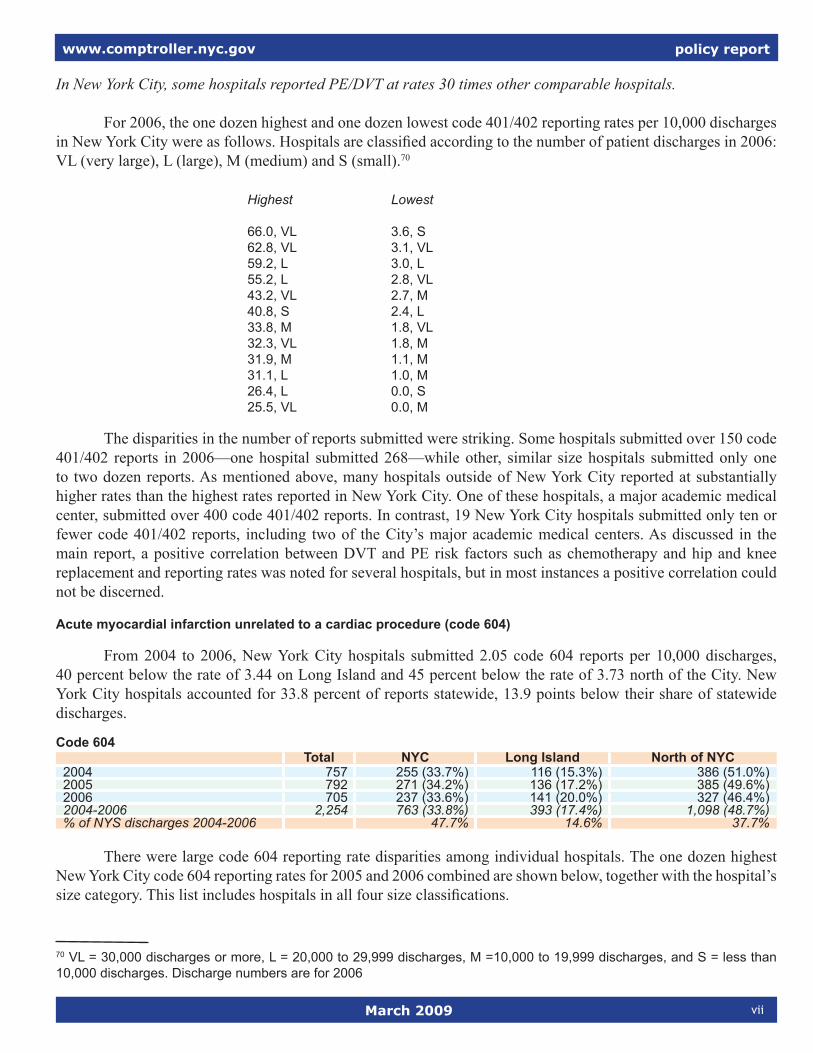
policy report
March 2009 vii
www.comptroller.nyc.gov
In New York City, some hospitals reported PE/DVT at rates 30 times other comparable hospitals.
For 2006, the one dozen highest and one dozen lowest code 401/402 reporting rates per 10,000 discharges in New York City were as follows. Hospitals are classified according to the number of patient discharges in 2006: VL (very large), L (large), M (medium) and S (small).70
Highest Lowest 66.0, VL 3.6, S 62.8, VL 3.1, VL 59.2, L 3.0, L 55.2, L 2.8, VL 43.2, VL 2.7, M 40.8, S 2.4, L 33.8, M 1.8, VL 32.3, VL 1.8, M 31.9, M 1.1, M 31.1, L 1.0, M 26.4, L 0.0, S 25.5, VL 0.0, M
The disparities in the number of reports submitted were striking. Some hospitals submitted over 150 code 401/402 reports in 2006—one hospital submitted 268—while other, similar size hospitals submitted only one to two dozen reports. As mentioned above, many hospitals outside of New York City reported at substantially higher rates than the highest rates reported in New York City. One of these hospitals, a major academic medical center, submitted over 400 code 401/402 reports. In contrast, 19 New York City hospitals submitted only ten or fewer code 401/402 reports, including two of the City’s major academic medical centers. As discussed in the main report, a positive correlation between DVT and PE risk factors such as chemotherapy and hip and knee replacement and reporting rates was noted for several hospitals, but in most instances a positive correlation could not be discerned.
Acute myocardial infarction unrelated to a cardiac procedure (code 604)
From 2004 to 2006, New York City hospitals submitted 2.05 code 604 reports per 10,000 discharges, 40 percent below the rate of 3.44 on Long Island and 45 percent below the rate of 3.73 north of the City. New York City hospitals accounted for 33.8 percent of reports statewide, 13.9 points below their share of statewide discharges.
Code 604Total NYC Long Island North of NYC
2004 757 255 (33.7%) 116 (15.3%) 386 (51.0%)2005 792 271 (34.2%) 136 (17.2%) 385 (49.6%)2006 705 237 (33.6%) 141 (20.0%) 327 (46.4%)2004-2006 2,254 763 (33.8%) 393 (17.4%) 1,098 (48.7%)% of NYS discharges 2004-2006 47.7% 14.6% 37.7%
There were large code 604 reporting rate disparities among individual hospitals. The one dozen highest New York City code 604 reporting rates for 2005 and 2006 combined are shown below, together with the hospital’s size category. This list includes hospitals in all four size classifications.
70 VL = 30,000 discharges or more, L = 20,000 to 29,999 discharges, M =10,000 to 19,999 discharges, and S = less than 10,000 discharges. Discharge numbers are for 2006

policy report
March 2009 viii
www.comptroller.nyc.gov
2005-06 rate, hospital size 12.8, VL 6.2, L 7.1, VL 5.6, S 4.9, VL 4.8, S 4.5, L 4.5, M 3.9, L 3.9, VL 3.0, VL 2.7, VL
There was a wide gap between the highest and lowest rates on this list. This reflects that code 604 reports were concentrated among relatively few hospitals. Several hospitals submitted at least two dozen code 604 reports in 2005-2006 and the hospital with the highest rate above submitted more than 80 reports in those two years. The four hospitals that submitted the most reports for 2005-2006 accounted for 37 percent of the 508 reports submitted by the 57 New York City hospitals. On the other hand, 13 hospitals submitted no code 604 reports in 2005-2006. These 13, together with 11 other hospitals, submitted a total of only 39 reports.
Falls resulting in X-ray proven fractures, subdural or epidural hematoma and/or internal trauma (code 751)
NYC hospitals reported patient falls at an overall lower rate than hospitals elsewhere. From 2004 to 2006, the New York City reporting rate was 3.38 reports per 10,000 discharges, compared to 4.46 on Long Island and 4.68 north of the City. Thus, as shown below, New York City hospitals have consistently accounted for less than their proportionate statewide share of patient discharges.
Code 751Total NYC Long Island North of NYC
2004 1,028 421 (41.0%) 178 (17.3%) 429 (41.7%)2005 1,026 397 (38.7%) 160 (15.6%) 469 (45.7%)2006 1,095 444 (40.5%) 171 (15.6%) 480 (43.8%)2004-2006 3,149 1,262(40.1%) 505 (16.0%) 1,378 (43.8%)% of NYS discharges 2004-2007 47.7% 14.6% 37.7%
Post-operative surgical site infection (code 808)
Until 2007, hospitals were required to report surgical site infections under code 808.71 As of February 2007, surgical site infections were no longer reported through NYPORTS. Instead, hospitals are required to report certain listed infections to DOH through the State’s new Hospital-Acquired Infection Reporting System authorized by statute in 2005.
71 “Following clean or clean/contaminated case performed in the O.R. or surgical suite requiring drainage during the hospital stay or inpatient hospital admission within 30 days.” “Clean” means uninfected operative wounds in which no inflammation is encountered and respiratory, alimentary, genital or uninfected urinary tracts are not entered. Clean/contaminated are operative wounds in which respiratory, alimentary, genital or uninfected urinary tracts are entered under controlled conditions and without unusual contamination. Specifically, operations involving biliary tract, appendix, vagina, and oropharynx were included in this category, provided no evidence of infection or major break in technique were encountered.

policy report
March 2009 ix
www.comptroller.nyc.gov
Reporting rates were substantially lower overall in New York City than elsewhere.
New York City hospitals reported code 808 incidents at substantially lower overall rates than hospitals elsewhere in the State. From 2004 to 2006, New York City hospitals filed 8.8 reports per 10,000 discharges, 52 percent below the Long Island rate of 18.2 and 56 percent below the rate of 20.0 north of the City. During this period, New York City hospitals accounted for only 29.3 percent of code 808 reports statewide, 18.4 points below their share of statewide discharges.
In New York City, only four hospitals submitted at least 20 reports per 10,000 discharges, while outside of New York City, 27 hospitals exceeded this benchmark. For 2006, only one New York City hospital exceeded 30 reports per 10,000 discharges, while outside of New York City, ten hospitals did so. The highest non-New York City rate was 50.6 per 10,000 discharges, compared to 32.0 in New York City. 72
Code 808Total NYC Long Island North of NYC
2004 3,775 1,171 (31.0%) 697 (18.5%) 1,907 (50.5%)2005 4,039 1,143 (28.3%) 747(18.5%) 2,149 (53.2%)2006 3,472 996 (28.7%) 633(18.2%) 1,843 (53.1%)2004-2006 11,286 3,310 (29.3%) 2,077 (18.4%) 5,899 (52.3%)% of NYS discharges 2004-2006 47.7% 14.6% 37.7%
There were large code 808 reporting disparities among New York City hospitals.
Review of code 808 reporting rates in New York City for 2006 found very large disparities among hospitals. These large disparities suggest that DOH will need to be vigilant to ensure complete reporting under the State’s new Hospital-Acquired Infection Reporting System.
For 2006, the dozen highest and lowest New York City reporting rates per 10,000 discharges were as follows. The size of the hospital is indicated as VL (very large), L (large), M (medium) and S (small).
Highest Lowest rates rates
32.0, VL 0.0, S 29.6, S 0.0, S 25.1, VL 0.0, S 20.5, M 0.0, S 15.3, L 0.9, M 13.6, S 1.0, M 12.6, M 1.1, S 12.3, M 1.2, M 11.9, L 1.3, L 11.4, L 2.2, M 11.1, VL 3.6, VL 10.6, M 3.7, L
The hospitals with the highest reporting rates, as well as those with the lowest, include a wide array of hospital types, from community hospitals to major academic medical centers that perform large volumes of the most complex surgeries. Health and Hospitals Corporation hospitals are on both lists. The variety of hospitals on 72 These non-New York City rates per 10,000 discharges were: 50.6, 50.2, 48.1, 47.0, 42.4, 40.5, 39.1, 38.3, 34.2, and 33.4. Three of these hospitals filed more than 100 reports in 2006. (These same three hospitals also filed more than 100 reports in 2005.) This lists counts only hospitals with at least 7,500 discharges in 2006.

policy report
March 2009 x
www.comptroller.nyc.gov
both lists indicates that the size of the hospital and its mix of patients and procedures have borne little relation to its code 808 reporting rate. Indeed, the hospital with the highest reporting rate is a major academic medical center, and the one with the second highest reporting rate is a community hospital discharging approximately one sixth as many patients a year.
The very wide disparity between reporting at the hospitals with the highest reporting rates and the rest of the hospitals in New York City is reflected in the heavy concentration of reports among only a handful of hospitals. The six highest-rate hospitals listed above accounted for 31 percent of the 996 reports from New York City hospitals for 2006. In 2005, these same hospitals accounted for 25 percent of the 1,141 New York City code 808 reports. Two of these hospitals filed over 90 reports each in 2005 and 2006.
Wrong patient, wrong site—surgical procedure (code 911)
Except for 2006, New York City hospitals’ share of code 911 reports has been significantly below their proportionate share of patient discharges. For 2004 to 2006, the New York City rate was 0.06 reports per 10,000 discharges, compared to 0.05 on Long Island and 0.10 north of New York City.
Code 911Total NYC Long Island North of NYC
2004 19 6 (31.6%) 1(5.2%) 12 (63.1%)2005 19 4 (21.0%) 5 (26.3%) 10 (52.6%)2006 19 11 (57.9%) 0 (0%) 8 (42.1%)2004-2006 57 21 (36.8%) 6 (10.5%) 30(52.6%)200773 16 5 (31.5%) 2 (12.5%) 9 (56.2%)% of NYS discharges 2004-2006 47.7% 14.6% 37.7%
Misadministration of radiation or radioactive material (code 914)74
From 2004 to 2006, New York City hospitals submitted 0.06 code 914 reports per 10,000 discharges, compared to 0.16 on Long Island and 0.29 north of New York City. During this period, New York City hospitals accounted for 18.2 percent of code 914 reports statewide, 29.5 points below their share of statewide discharges.
Code 914Total NYC Long Island North of NYC
2004 38 5 (13.1%) 5 (13.1%) 28 (73.7%)2005 56 13 (23.2%) 11(19.6%) 33 (58.9%)2006 33 6 (18.2%) 3 (9.0%) 24 (72.7%)2004-2006 127 24 (18.8%) 19 (15.0%) 85 (66.9%)2007 37 8 (21.6%) 7 (18.9%) 22 (59.4%)% of NYS discharges 2004-2006 47.7% 14.6% 37.7%
73 Unlike for the five other codes, 900 series code occurrences must be reported within 24 hours. Therefore, the reporting data supplied by DOH in June 2008 for 900 series codes is complete and 2007 results for them are shown. Results for 2007 are not shown for the five other codes because there is no reporting timeframe for them and DOH continued to accept them until later in 2008. Therefore, we could not be assured that the 2007 data provided for these codes were entirely complete for all hospitals.
We did not compare 2004–2007 reporting shares and patient discharges by geographic area because discharge data for 2007 were not available. However, there typically are only slight changes in discharge numbers from year to year. 74 More specifically, code 914 covers, “Misadministration involving diagnostic or therapeutic use or ionizing radiation (radioactive materials, x-rays and electrons), according to the NYPORTS Clinical Definitions Manual. Examples given in the Manual include, “A patient was treated using 9 MV photons rather than the prescribed 6 PV photons,” “Bone scan performed on the wrong patient,” and, “Prescription written for radiation treatment to right lung. Following completion of a single treatment it was discovered that the treatment field should have been to the left lung.”

policy report
March 2009 xi
www.comptroller.nyc.gov
From 2004 to 2006, New York City hospitals submitted 0.36 code 914 reports per 10,000 discharges, compared to 0.20 on Long Island and 0.59 north of New York City. New York City hospitals’ share of code 916 reports has consistently been smaller than their share of patient discharges, as shown below—a 7.8 point differential between their 2004-2007 reporting rate and their 2004-2006 share of statewide discharges.
Cardiac and/or respiratory arrest requiring ACLS [advanced cardiopulmonary life support] intervention (e.g., including delay in treatment, diagnosis or omission of care) (code 916)
From 2004 to 2006, the New York City rate for code 916 was 0.36 reports per 10,000 discharges, greater than the rate of 0.20 on Long Island, but significantly below the rate of 0.59 north of the City. Code 916
Total NYC Long Island North of NYC2004 110 38 (34.5%) 7 (6.4%) 65 (59.0%)2005 102 43 (42.1%) 8 (7.8%) 51 (50.0%)2006 118 53 (44.9%) 8 (6.8%) 57 (48.4%)2004-2006 330 134 (40.6%) 23 (6.9%) 173 (52.4%)2007 105 41 (39.0%) 7 (6.7%) 57 (54.3%)% of NYS discharges 2004-2006 47.7% 14.6% 3.7%
There have been large code 916 reporting disparities among comparable New York City hospitals. Because of the relatively low numbers of code 916 reports submitted each year, individual hospitals’ reporting numbers were compared for a three-year period, 2005-2007. Among very large hospitals (at least 30,000 discharges in 2006), two hospitals submitted 14 reports each and together accounted for 20 percent of code 916 submissions by New York City hospitals from 2005 to 2007. But three other very large hospitals submitted only two reports each, one other very large hospital submitted only one report, and another very large hospital submitted no code 916 reports. Many of the other hospitals also did not submit any code 916 reports.
Impairment of limb, organ or bodily functions (including delay in treatment, diagnosis or an omission in care) (code 918)
From 2004 to 2006, New York City hospitals had a rate of 0.34 reports per 10,000 discharges, compared to 0.33 on Long Island and 1.00 north of New York City. Eleven of the dozen highest rates75 in the State were Upstate. The New York City hospitals’ 2004-2006 share of statewide code 918 reports was 20.1 points below their share of statewide patient discharges.
Code 91876
Total NYC Long Island North of NYC2004 79 16 (20.5%) 10 (13.0%) 53 (67.1%)2005 174 52 (29.8%) 15 (8.6%) 107 (61.2%)2006 204 58 (28.4%) 13 (6.4%) 133 (65.2%)2004-2006 457 126 (27.6%) 38 (8.3%) 293 (64.1%)2007 241 81 (33.6%) 12 (5.0%) 148 (61.4%)% of NYS discharges 2004-2006 47.7% 14.4% 37.7%
75 These rates per 10,000 discharges were: 49.3, 8.3, 5.1, 5.0, 4.7, 3.9, 3.8, 3.5, 3.5, 2.5, 2.0, 1.7.
76 According to the NYPORTS Clinical Definitions Manual, code 918 Includes occurrences in which body function (e.g. sensory, motor, communication or physiologic function is diminished from the level prior to occurrence). Includes impairments present at discharge or for at least two weeks after occurrence is patient is not discharged.

policy report
March 2009 xii
www.comptroller.nyc.gov
Among very large New York City hospitals (at least 30,000 discharges annually), the number of reports from 2004 to 2007 ranged from 22 at each of two hospitals to only four at each of two others. A hospital outside of New York City submitted 46 code 918 codes and another reported 33; the latter hospital is a highly regarded major academic medical center.
Malfunction of equipment during treatment or diagnosis or a defective product which has potential for adversely affecting patient or hospital personnel or results in a retained foreign body (code 937)
The 2004-2006 New York City rate was 0.88 per 10,000 patient discharges, well below the rate of 1.55 on Long Island and 2.12 in the rest of the State. During this period, New York City hospitals accounted for 29.9 percent of code 937 reports statewide, 17.8 points below their proportionate share of statewide discharges.
Code 937Total NYC Long Island North of NYC
2004 463 154 (33.3%) 66 (14.2%) 243 (52.5%)2005 416 120 (28.8%) 73 (17.5% 223 (53.6%)2006 250 54 (21.6%) 38 (15.2%) 158 (63.2%)2004-2006 1,129 328 (29.0%) 177 (15.7%) 624 (55.3%)2007 280 72 (25.0%) 16 (5.7%) 192 (68.2%)% of NYS discharges 2004-2006 47.7% 14.6% 37.7%
Reflecting the substantially higher overall reporting rate outside of New York City, ten of the dozen highest reporting rates (average of 2005 and 2006 reports) were outside New York City. The highest 2005-2006 rate in New York City was 8.4 reports per 10,000 discharges, while the highest non-New York City rate was 32.5 per 10,000 discharges.77 Several non-New York City hospitals filed more than 25 code 937 reports—one major hospital filed 52—while only one New York City hospital filed this many. Virtually all of the very large New York City hospitals (over 30,000 discharges) had low code 937 reporting rates of fewer than 3.0 reports per 10,000 discharges, and several had rates below 1.0 report per 10,000 discharges.
There also were large reporting rate disparities among New York City hospitals. In 2005 and 2006 together, one of the City’s major academic medical centers filed 36 reports, while another major academic medical center filed none. One New York City HHC hospital filed 11 reports, while two others that had at least 50 percent more patient discharges filed none. A total of 23 New York City hospitals filed no code 937 reports in either year.
Occurrence codes with large reporting disparities among hospitals, but not among regions
Any adverse occurrence not directly related to the natural course of illness or underlying condition resulting in death (code 915)
Code 915 can be reported independently or as a detail code in conjunction with another code, such as code 401 (new acute pulmonary embolism) or code 701 (burns). When another 900-series code is reported, such as retained foreign body, it is recorded as a code 915 if the patient dies. An event is not dismissed from reporting under code 915 because a patient is significantly compromised from the underlying illness or condition, or because a patient develops a known complication or simply because the patient was elderly.
77 The one dozen highest rates in the State were: 32.5, 21,5,16.4, 13.1, 9.9, 8.4, 7.3, 6.7, 4.5, 4.1.

policy report
March 2009 xiii
www.comptroller.nyc.gov
Code 915 also covers the death of a fetus or neonate in the case of a live or still birth of equal to or greater than 1,000 grams and of greater than 28 weeks’ gestation; any iatrogenic (caused by a physician or hospital) incident resulting in death at any gestation or weight is reported. It covers all maternal deaths.78
In 2002, DOH assembled a data analysis panel to review code 915 reports. The wide scope of potential code 915 reporting is seen in the categories designated for review: medication-related, cardiac, pulmonary, maternal, neonatal, and surgical/procedural. Only the pulmonary-related and medication cases were studied in depth and risk-reduction strategies identified.79
From 2004 to 2006, New York City hospitals filed 2.38 reports per 10,000 discharges, close to the rate of 2.23 on Long Island but significantly below the rate of 3.42 north of the City. From 2004 to 2006, New York City hospitals accounted for 41.3 percent of code 915 reports statewide, 6.4 points below their share of statewide patient discharges.
Code 915Total NYC Long Island North of NYC
2004 728 287 (39.4%) 91 (12.5%) 350 (48.1%)2005 693 305 (44.0%) 74 (10.7%) 314 (45.3%)2006 727 295 (40.5%) 90 (12.0%) 342 (47.0%)2004-2006 2,148 887 (41.3%) 255 (11.9%) 1,006(46.8%)2007 666 302 (45.3%) 49 (7.3%) 315 (47.3%)% of NYS discharges 2004-2006 47.7% 14.6% 37.7%
Although the disparity between New York City code 915 reporting rates and rates elsewhere in the State was not as large as for other occurrence codes discussed above, reporting disparities among New York City hospitals were often very wide. Following are the dozen highest and lowest code 915 New York City reporting rates (average of 2005 and 2006). The size of a hospital did not necessarily positively correlate to its reporting rate; small hospitals as well as very large hospitals had some of the highest, as well as some of the lowest, code 915 reporting rates. Among very large hospitals (at least 30,000 patient discharges annually), the reporting rate (average of 2005 and 2006) ranged from 0.2 per 10,000 patent discharges to 2.6 per 10,000 discharges. Seven hospitals had either one or no code 915 reports in 2005 or 2006.
The wide disparities in code 915 reporting were illustrated by HHC hospitals. Within HHC, one particular medium-size hospital submitted 31 reports, while another hospital very close in size submitted only three reports during 2005 and 2006. 2005-2006 reporting rates at HHC hospitals ranged from lows of 0.4 and 0.6 per 10,000 discharges to 3.6, 3.9 and as high as 8.4 reports per 10,000 discharges.
78 According to the NYPORTS Clinical Definitions Manual, code 915 excludes end-of-life care such as DNR (do not resuscitate) with comfort care only, emergent and unplanned surgical patients with significant mortality category if the occurrence is not related to deviation from the standard of care, medication error, omission, delay or iatrogenic event; patients admitted with severe illness/incapacitating systemic disease that is a constant threat to life or moribund and not expected to survive 24 hours with or without an operation; death of fetus/neonate with presence of congenital anomalies incompatible with life; sepsis related to opportunistic infection following required antibiotic therapy.
79 Examples of pulmonary-related code 915 cases were: an air embolism that occurred when central venous line was removed while the patient was seated instead of supine; a feeding tube was inserted into a lung and the x-ray was not reviewed; and a patient was disconnected from an oximeter for transport and expired while awaiting transporter when the oxygen ran out. Examples of medication-related code 915 deaths were: concurrent use of anticoagulants (Heparin, Lovenox and Coumadin) and education on the concomitant use of anticoagulants had not been distributed to staff; illegible handwriting led to 100 mg of Librium being given versus 5 mg; and a pneumonia patient died when antibiotic doses were not given for 24 hours and pneumonia protocol was not followed.

policy report
March 2009 xiv
www.comptroller.nyc.gov
Highest NYC rates, hospital size Lowest NYC rates, hospital size
10.2, S 0.0, VL 8.6, S 0.0, S 8.4, M 0.0, S 7.0, M 0.0, M 5.3, L 0.0, S 4.7, L 0.0, M 4.6, VL 0.7, S 4.2, S 1.5, M 3.9, M 1.5, VL 3.7, L 1.9, VL 3.5, L 1.9, VL 3.3, VL 2.0, VL
Outside of New York City, the highest rates were higher overall than they were in New York City.80
Other serious occurrences warranting DOH notification (code 901)
Code 901 is the sole voluntary code. It serves as a catchall for reporting occurrences that are not directly reportable under another code. From 2004 to 2006, New York City hospitals accounted for 55.9 percent of code 901 reports in the State, well above their proportionate share of statewide patient discharges. Code 901
Total NYC Long Island North of NYC2004 347 190 (54.7%) 49 (14.1%) 108 (31.1%)2005 440 278 (63.2%) 42 (9.5%) 120 (27.3%)2006 351 186 (53.0%) 24 (6.8%) 141 (40%)2004-2006 1,138 654 (57.5%) 115 (10.1%) 369(32.4%)2007 294 147 (50.0%) 29 (9.9%) 118 (40.1%)% of NYS discharges 2004-2006 47.7% 14.6% 37.7%
Although New York City hospitals reported more code 901 occurrences than their proportionate statewide share of discharges would indicate, there were very large reporting rate disparities among these hospitals. As shown below, several filed more than 20 code 901 reports in 2005-2006, while others filed three or fewer or no reports. One very large hospital submitted 23 reports, while another, even larger one submitted only two. Within HHC, two hospitals had code 901 reporting rates several times as high as the rates at two other HHC hospitals.
For 2005 and 2006 combined, there were high reporting rates (at least 3.5 reports per 10,000 discharges) and low reporting rates (0.6 reports per 10,000 discharges) as follows:
High Rates Low rates 8.3, L 0.0, S 6.0, L 0.0, M 5.9, M 0.0, M 5.7, M 0.0, M 5.6, S 0.2, L 4.5, M 0.2, VL 4.2, M 0.3, M 3.9, L 0.5, M 3.6, VL 0.6, VL
0.6, L 0.6, VL
80 Excluding very small hospitals with fewer than 5,000 discharges a year, the six highest 2005-2006 rates (and hospital size category) were: 14.3 (M), 11.9 (M), 11.7 (L), 9.4 (S), 7.8 (S), 6.9 (L).

policy report
March 2009 xv
www.comptroller.nyc.gov
Reporting was heavily concentrated among relatively few hospitals. The first five high-rate hospitals in the list above filed more than 20 reports each and accounted for 28 percent of code 901 reports, while all of the low-rate hospitals listed above filed a total of only 17 reports and accounted for only 2.7 percent of code 901 reports.
Other occurrence codes
Significant reporting disparities were not observed for the following 900 series codes. Most of these codes allow for little reporting discretion or interpretation. New York City hospitals’ share of reports under these codes was largely proportionate to their share of statewide hospital discharges.
Incorrect invasive procedure or treatment (code 912)
NYC share Number 2004 44.9% 89 2005 35.6% 87 2006 39.3% 84 2007 54.8% 82 2004-2007 43.6% 342
Unintentionally retained foreign body (code 913)
NYC share Number 2004 50.1% 92 2005 49.4% 93 2006 47.3% 127 2007 54.7% 117 2004-2007 50.5% 429
Loss of limb or organ (including delay in treatment or diagnosis or an omission of care) (code 917)
NYC share Number 2004 50.0% 22 2005 40.5% 37 2006 45.5% 44 2007 47.7% 44 2004-2007 45.5% 147. Finally, there were too few reports to develop observations for the remaining codes not discussed above:
Code 921 Crime resulting in death or serious injury Code 922 Suicides and attempted suicides with serious injury related to an inpatient hospitalization Code 923 Elopement from hospital resulting in death or serious injury Code 931 Strike by hospital staff Code 932 External disaster outside the control of the hospital which affects facility operation Code 933 Termination of any services vital to continued safe operation of the hospital, etc.
Code 934 Poisoning occurring within the hospital (water, air, food) Code 935 Hospital fire disrupting patient care or causing harm to patients or staff Code 938 Malfunction of equipment during treatment or diagnosis, or a defective product
resulting in death or serious injury Code 961 Infant abduction Code 962 Infant discharged to wrong family Code 963 Rape by another patient or staff

policy report
March 2009 xvi
www.comptroller.nyc.gov
Appendix D
Analysis of Medication Error Reporting
Medication errors occur frequently in hospitals.
Medication errors can occur in a variety of ways, from failure to administer an ordered dose, to administration of the wrong medication, or at the wrong frequency, to incorrectly formulating the drug before administering, to following an inappropriate procedure or technique in administration.81 82 Since a typical hospital patient receives multiple medications, a single medication may need to be administered several times a day, and a single nurse may have to administer as many as 50 medications per shift, it is not surprising that medication errors occur frequently.
In 2006, an Institute of Medicine study found that medication errors harm at least 1.5 million people a year, including at least 400,000 in hospitals, and medication errors that adversely affect patient care outcomes occur in 0.25 percent of all admitted patients. From ten to 18 percent of all hospital medical injuries have been attributed to medication errors.83 A study cited in the main text, which reviewed incident reports at two hospitals and found that nine percent of patients had at least one incident report of which 59 percent “seemed preventable,” also found that 29 percent of the incidents involved medication administration and 45.3 percent of the preventable incidents were medication-related.84
Medication errors are a large subset of adverse drug events (ADEs). In 1995, it was estimated that over 770,000 hospital patients die or are injured each year due to ADEs, and medication errors were a “frequent cause” of these adverse drug events; the cost of adverse drug events was calculated at up to $5.6 million per hospital.85
There has been scant reporting under the three NYPORTS medication error reporting codes.
In recognition of the large number of medication errors that occur in hospitals, in 2000 DOH expanded NYPORTS mandatory adverse event reporting to include medication errors. Three different NYPORTS medication error reporting codes were designated. Code 110 is for medication errors that result in death, code 109 for medication errors that result in a near-death event, and code 108 is for medication errors that result in permanent patient harm that meets the National Coordinating Council Medication Error Reporting Program criteria for permanent patient harm. Reporting under these codes excludes any adverse drug reaction that was not the result of a medication error. Reporting also excludes patients who were severely ill when admitted; it is assumed that a medication error was not the cause of the harm in such circumstances.81 Source: NYPORTS Manual, Version #3
82 The American Society of Hospital Pharmacists definition of medical error: A medication error is any preventable event that may cause or lead to inappropriate medication use and patient harm while the medication is in the control of the health care professional, patient, or consumer. Such events may be related to professional practice, health care products, procedures, and systems including prescribing, order communication, product labeling, packaging and nomenclature, compounding, dispensing, distribution, administration, education, monitoring and use.
83 Stetler, C.B., Morsi, D., & Burns, M. (2000). “Physical and emotional patient safety: A different look at nursing-sensitive outcomes,” Outcomes Management for Nursing Practice, 2000.
84 T.K. Nuckols, op. cit. 85 U.S. Department of Health and Human Services, Agency for Healthcare Research and Quality, Reducing and Preventing Adverse Drug Events to Decrease Hospital Costs, Research in Action, Issue 1, March 2001.

policy report
March 2009 xvii
www.comptroller.nyc.gov
There has been only scant reporting under these codes. As shown in the following table, in New York City a total of only 11 hospital medication errors were reported for 2004, nine for 2005, seven for 2006 and ten for 2007. This compared to 33 in the State outside of New York City for 2004, 20 for 2005, 16 for 2006 and 16 for 2007. From 2004 to 2007, New York City accounted for 30 percent of the 122 medication errors reported statewide, even though (in 2006) the City’s hospitals accounted for 47.1 percent of hospital discharges.
Medication errors reported through NYPORTS, New York City hospitals.* Reporting code 2004 2005 2006 2007Code 108Medication error results in permanent patient harm
3 reports by 3 hospitals 3 reports by 3 hospitals 1 report 2 reports by 2 hospitals
Code 109Medication error results in a near death event
6 reports by 6 hospitals 3 reports by 3 hospitals 6 reports by 5 hospitals 3 reports by 3 hospitals
Code 110Medication error causes death
2 reports by 2 hospitals 3 reports by 3 hospitals No reports 5 reports by 4 hospitals
*Each hospital submitted one report unless noted.
The NYPORTS Clinical Definitions Manual86 says that medication errors that are not reportable under codes 108, 109 or 110 can still be reported under code 901. As discussed in Appendix C, code 901 is for reporting any other “serious occurrence warranting DOH notification.” However, hospital reporting under code 901 is scant. In 2006, for example, the majority of New York City hospitals reported five or fewer code 901 events, and several hospitals, including some large and very large ones, reported none. Also, code 901 covers the full gamut of adverse events that are not otherwise reportable under another NYPORTS code.
Underreporting of medication errors is widespread nationally. According to a survey of the literature conducted in 2004, current methods of collecting data on medication errors using incident reports “grossly underestimates errors.” 87
Medication errors that result in permanent patient harm (code 108) In 2002, the United States Pharmacopeia issued the results of its extensive analysis of hospital medication errors. The study was based on assessment and examination of errors in 2001 at 368 hospitals across the nation. In 2.4 percent of the 105,603 medication errors that were found, patients were injured.
Applying these figures to New York City, during 2001 there would have been approximately 400 medication errors that resulted in patient injury88—that is, a medication error was discovered and interventions by medical staff did not prevent the patient from being injured. Nevertheless, from 2004 through 2007, New York City hospitals submitted a total of only nine code 108 reports, with no more than three reports in any single year. Although code 108 applies only to medication errors resulting in permanent harm, the enormous disparity between the number of medication errors that resulted in patient harm and the number of reports submitted under code 108 is nonetheless striking.86 Version 4, 2005.
87 Anderson, James G., “Information technology for detecting medication errors and adverse drug events,” Regenstrief Center for Healthcare Engineering, Purdue University, Expert Opinion on Drug Safety, September 2004.
88 368 hospitals in the study had 105,603 medication errors. Assuming error rates at New York City hospitals were comparable to error rates at the 368 hospitals in the study (286 errors per hospital on average), there would have been approximately 16,600 medication errors at New York City hospitals. Assuming also that patients were injured in 2.4 percent of the New York City cases, there would have been approximately 400 medication error injuries.

policy report
March 2009 xviii
www.comptroller.nyc.gov
In another study, the number of medication errors that adversely affected patient care outcomes was analyzed for 913 U.S. hospitals.89 Between 385 and 467 medication errors were reported per hospital per year90; applying these numbers to 57 hospitals in New York City, there would be from 22,330 to 27,086 medication errors in New York City hospitals a year. The study found the mean number of these medication errors that adversely affected patient outcomes was 4.9 percent of the medication errors per hospital; in New York City, this would mean that 1,094 to 1,327 medication errors a year adversely affect patient outcomes.
Another indication that medication errors that lead to permanent patient harm are underreported is the large number of serious adverse drug events (ADEs) voluntarily reported to the Food and Drug Administration Adverse Event Reporting System. According to a report in Archives of Internal Medicine,91 since 1995 there has been a steep increase in serious ADEs92 reported to the FDA, from 34,966 in 1996 to 89,842 in 2005. In 2005, New York City’s proportionate share based on population would be over 2,400 serious ADEs.93 Although it has been found that 90 percent of hospital ADEs resulted from the side effect of a drug that was properly administered94, it is nonetheless noteworthy that New York City hospitals generated only three NYPORTS reports of medication error resulting in permanent harm in 2005, when well over 2,000 ADEs were reported. 95
It should be recognized that it can be difficult to differentiate between non-error adverse effects of a drug and adverse effects from administering a wrong dosage or the wrong drug, or administering a drug with another drug for which it may be contraindicated.
Medication errors that result in a near-death event (code 109)
The largest share of medication errors reported under NYPORTS—a total of 18—was reported under code 109. Code 109 excludes medication errors that result in cardiac or respiratory arrest that requires the need for basic life support only; only errors that require the need for advanced cardiopulmonary life support are reported.
89 Bond, C.A., Raehl, Cynthia L., Franke, Todd D., “Medication Errors in United States Hospitals,” Pharmacotherapy, 21(9):1023-1036, 2001.
90 Medication errors occurred in 5.07 percent of patient admissions to these hospitals each year, and there was a medication error every 22.7 hours and one that adversely affected patient outcome every 19.23 days, or one for every 401 admissions.
91 Moore, Thomas J., Cohen, Michael R., Furberg, Curt D, “Serious Adverse Drug Events Reported to the Food and Drug Administration, 1998-2005,” Archives of Internal Medicine, September 10, 2007.
92 A serious drug adverse event is one that resulted in death, a birth defect, disability, hospitalization, or was life threatening or required intervention to prevent harm.
93 70.4% of ADE reports were submitted by health professionals.
94 As reported by the Agency for Healthcare Research and Quality for 2001.
95 Inasmuch as reporting to the FDA is voluntary, the actual numbers are likely much greater. According to a report on adverse events issued in December 2008 by the Office of the Inspector General of the U.S. Department of Health and Human Services, “… an FDA source estimated that 10 percent of adverse drug events are reported to its reporting system, MedWatch.” In addition, according to the Los Angeles Times, “Studies have estimated that from as little as 3% of adverse events to a maximum of about 33% have been reported to the FDA.” (Maugh, Thomas, “Adverse drug reactions rise sharply, study says,” Los Angeles Times, September 11, 2007.)

policy report
March 2009 xix
www.comptroller.nyc.gov
Medication errors that result in death (code 110)
In 1999, the Institute of Medicine (IOM) identified hospital medical errors as the cause of up to 98,000 deaths a year. More than 7,000 deaths were determined to have been caused by medication errors.96 Medication errors are the largest single cause of fatal errors in hospitals. In May 2001, five percent of the medication errors reported to the U.S. Food and Drug Administration were fatal. 97
Assuming New York City’s share of the U.S. population matches its share of the nation’s hospital medication error deaths, and applying the IOM figures to today, there would be 190 hospital medication error deaths a year in New York City. Yet, as shown in the table above, for 2007, only five hospital medication error deaths were reported in New York City; for 2006, none were reported; for 2005, there were three; and for 2004, only two were reported—10 reported deaths over a four-year span, when the IOM study would indicate that 750 patients died.
Reasons for low medication error reporting rates To be sure, reporting of medication errors under NYPORTS has been limited to a considerable extent by the difficulty inherent in ascribing cause and effect to a poor medical outcome. For an occurrence to be reportable, it must be clear that it was a medication error, not some other factor, which resulted in the patient harm. A drug reaction that was not the result of a medication error is not reportable. Moreover, to be reportable under code 109, the harm to the patient must be permanent, not temporary.
Still, the wide gulf between reported numbers of harmful hospital medication errors found in respected national studies and the mere handful of medication errors reported by New York State—especially New York City—hospitals is striking and indicates that reporting could be more complete.
The survey of literature cited above confirmed that electronic information technologies can substantially increase detection and reporting of medication errors: “Basic information systems may be effective in identifying and avoiding potential ADEs [adverse drug events]… 53 percent of ADEs are identifiable with the lowest level information system” and “more sophisticated systems are capable of detecting a much larger percentage of ADEs and potential ADEs.”98
HHC officials informed Comptroller staff that HHC has had an electronic medical records system in place for more than a decade. According to HHC’s 2006 Report to the Community, “Today, HHC boasts a highly integrated electronic medical record system with capabilities that are available at fewer than ten percent of hospitals nationwide,” and that this technology “has greatly reduced medication errors…” 96 This total was limited to inpatients and did not include emergency rooms and ambulatory care settings, both of which are covered by NYPORTS reporting requirements. It has been found that medication errors occur at higher rates in ambulatory care settings than among inpatients. See: Testimony of Marie Dotseth, Minnesota Department of Health, National Summit on Medical Errors and Patient Safety Research, September 11, 2000. Individuals were selected to testify by the Agency for Healthcare Research and Quality. In addition, it has been found that infants are more susceptible to even minor medication errors than adults.
97 Thomas, M.R., Holquist, C., Phillips, J., “Med error reports to FDA show a mixed bag,” FDA Safety Page, Drug Topics, October 1, 2001. Moreover, it has been reported that medication errors are underreported. See, Mayo, Ann M., Duncan, Denise, “Nurse Perceptions of Medication Errors: What We Need to Know for Patient Safety,” Journal of Nursing Care Quality, July/August/September 2004: Only 45.6% of the 983 nurses believed that all drug errors are reported, and reasons for not reporting include fear of manager and peer reactions.
98 Ibid., p. 3.

policy report
March 2009 xx
www.comptroller.nyc.gov
Appendix E
Review of risk factors and codes 401, 402, 808 reporting disparities
Differences in medical services/procedure among hospitals werenot a significant cause of reporting disparities.
Codes 401/402
In recent years, the largest volume of NYPORTS reports have been submitted for code 401, new acute pulmonary embolism (PE), and code 402, new documented deep vein thrombosis (DVT). We compared hospital code 401/402 reporting rates to their patient age distributions (older patients are at greater risk of DVT/PE), their relative volume of procedures most closely associated with DVT and PE, including chemotherapy and knee and hip replacement,99 and whether the hospital was more likely to have a large number of patients who are immobile for long periods of time (for example, a hospital with a physical medicine-rehabilitation component), which is another DVT/PE risk factor.
In some instances, there was a positive correlation between a high prevalence of one or more of these risk factors and high reporting rates. For example, a cancer specialty hospital which conducted many chemotherapy procedures consistently had among the highest code 401 and code 402 reporting rates in the State. But this may say as much about its commitment to occurrence reporting as its higher risk factors; several acute care general hospitals that also conducted large numbers of chemotherapy procedures had relatively low code 401 and 402 reporting rates.
We also found that hospitals with large physical medicine and rehabilitation units did not necessarily have higher DVT and PE reporting rates than hospitals without physical medicine and rehabilitation units or where those units were relatively small. Likewise, there were hospitals that performed large numbers of knee and hip replacements that had relatively high code 401 and 402 reporting rates, but others performed large numbers of these procedures and had low reporting rates.
DVT and pulmonary embolism have been found to be more prevalent among elderly patients. Hospitals with relatively large proportions of older patients might therefore be expected to have greater incidences of DVT and PE among their patients than hospitals where older patients make up a smaller proportion of patients. However, our analysis shows that this was true only some of the time. In fact, there were many hospitals which reported relatively high rates of DVT and PE yet had relatively small shares of elderly patients, and there were hospitals which reported relatively low rates of DVT and PE yet had comparatively large numbers of older patients. Patient age distribution does not begin to explain why, for example, in 2006 one very large (at least 30,000 discharges annually) New York City hospital (approximately 29 percent of discharged patients were 65 or older) had a code 401/402 reporting rate of only 3.1 per 10,000 discharges, while another very large New York City hospital which had a similar age distribution (26 percent of patients over 65) had a reporting rate of 17.9 per 10,000 discharges.
99 According to the 2002-2004 NYPORTS Annual Report, the two procedures most associated with Code 402 reports were knee and hip replacement. Hip replacement was second most and knee replacement the fourth most frequent procedures associated with pulmonary embolism code 401 reports.
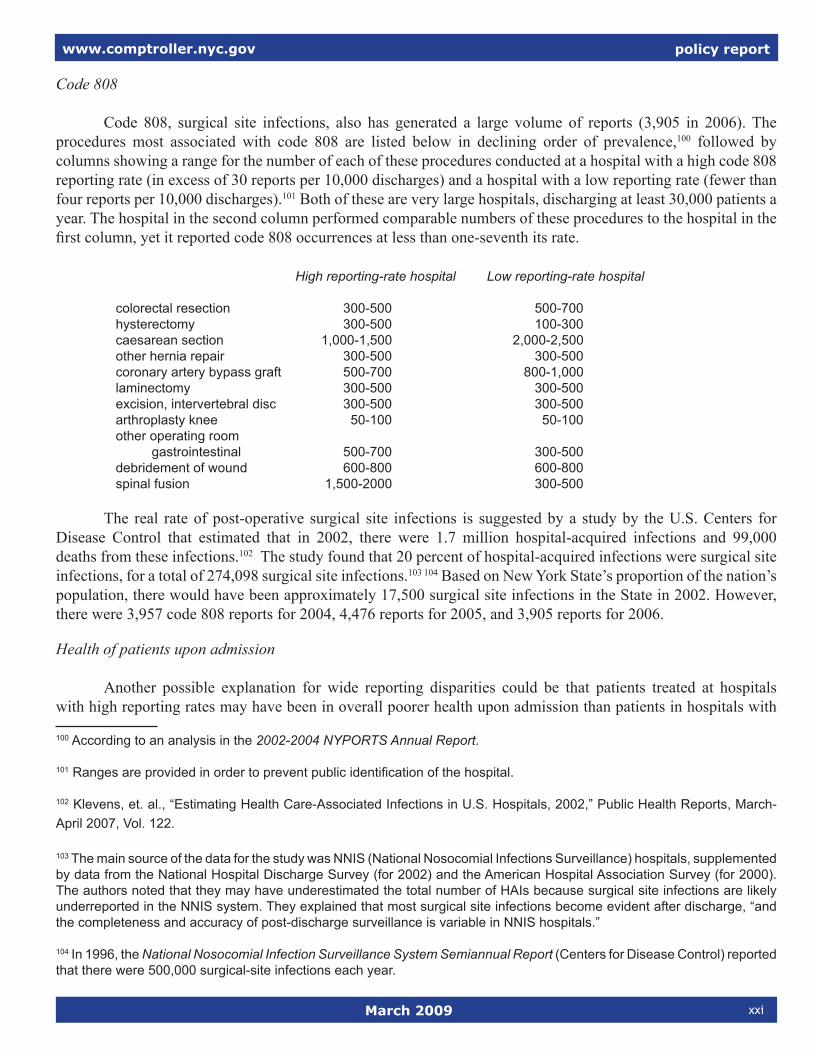
policy report
March 2009 xxi
www.comptroller.nyc.gov
Code 808
Code 808, surgical site infections, also has generated a large volume of reports (3,905 in 2006). The procedures most associated with code 808 are listed below in declining order of prevalence,100 followed by columns showing a range for the number of each of these procedures conducted at a hospital with a high code 808 reporting rate (in excess of 30 reports per 10,000 discharges) and a hospital with a low reporting rate (fewer than four reports per 10,000 discharges).101 Both of these are very large hospitals, discharging at least 30,000 patients a year. The hospital in the second column performed comparable numbers of these procedures to the hospital in the first column, yet it reported code 808 occurrences at less than one-seventh its rate.
High reporting-rate hospital Low reporting-rate hospital
colorectal resection 300-500 500-700 hysterectomy 300-500 100-300caesarean section 1,000-1,500 2,000-2,500other hernia repair 300-500 300-500 coronary artery bypass graft 500-700 800-1,000laminectomy 300-500 300-500excision, intervertebral disc 300-500 300-500arthroplasty knee 50-100 50-100other operating room gastrointestinal 500-700 300-500 debridement of wound 600-800 600-800spinal fusion 1,500-2000 300-500
The real rate of post-operative surgical site infections is suggested by a study by the U.S. Centers for Disease Control that estimated that in 2002, there were 1.7 million hospital-acquired infections and 99,000 deaths from these infections.102 The study found that 20 percent of hospital-acquired infections were surgical site infections, for a total of 274,098 surgical site infections.103 104 Based on New York State’s proportion of the nation’s population, there would have been approximately 17,500 surgical site infections in the State in 2002. However, there were 3,957 code 808 reports for 2004, 4,476 reports for 2005, and 3,905 reports for 2006.
Health of patients upon admission
Another possible explanation for wide reporting disparities could be that patients treated at hospitals with high reporting rates may have been in overall poorer health upon admission than patients in hospitals with
100 According to an analysis in the 2002-2004 NYPORTS Annual Report.
101 Ranges are provided in order to prevent public identification of the hospital.
102 Klevens, et. al., “Estimating Health Care-Associated Infections in U.S. Hospitals, 2002,” Public Health Reports, March-April 2007, Vol. 122.
103 The main source of the data for the study was NNIS (National Nosocomial Infections Surveillance) hospitals, supplemented by data from the National Hospital Discharge Survey (for 2002) and the American Hospital Association Survey (for 2000). The authors noted that they may have underestimated the total number of HAIs because surgical site infections are likely underreported in the NNIS system. They explained that most surgical site infections become evident after discharge, “and the completeness and accuracy of post-discharge surveillance is variable in NNIS hospitals.”
104 In 1996, the National Nosocomial Infection Surveillance System Semiannual Report (Centers for Disease Control) reported that there were 500,000 surgical-site infections each year.
policy report
March 2009 xxii
www.comptroller.nyc.gov
lower reporting rates, increasing the likelihood that minor mistakes, “near misses” and other lapses in care and treatment could result in a reportable occurrence. As reported by the Comptroller’s Office in 2007, it has been well established that residents of lower-income communities tend to be in poorer health than residents of more affluent areas.105 Nevertheless, several hospitals that serve predominantly lower-income populations in New York City had among the lowest reporting rates in the state.
105 See, Office of the Comptroller of the City of New York, Health and Wealth: Assessing and Addressing Income Disparities in the Health of New Yorkers, September 2007.