11th report of the malaysian dialysis & … · 111 nkf dialysis centre, kuala lumpur 112 normah...
TRANSCRIPT

11TH REPORT OF THE MALAYSIAN
DIALYSIS & TRANSPLANT REGISTRY 2003
Review of Dialysis Provision 1980 to 2003
Survey of Dialysis Practices 1993-2002 Analysis of RRT Outcomes 1997 - 2002
Edited by
T.O. Lim
Y.N.Lim
With contributions from Zaki Morad, Wan Shaariah, Liu WJ, Hooi LS, Goh BL, Philip N.J, Ahmad Fauzi, Prasad M, Fan KS, Teo SM, Tan SY, Lee ML, Lee DG
ISSN 1675-8862
Malaysian Society of Nephrology Clinical Research Centre Ministry of Health Malaysia
The Dialysis Association of Medical Assistants and Nurses

April 2004 © National Renal Registry, Malaysia Published by: National Renal Registry C/o Disease and Treatment Registry Unit 2nd Floor, Wisma MEPRO 29 & 31 Jalan Ipoh 51200 Kuala Lumpur Malaysia Tel. : (603) 4045 8636 Fax : (603) 4045 1252 e-mail : [email protected] Website: http://www.crc.gov.my/nrr This report is copyright. However it may be freely reproduced without the permission of the National Renal Registry. Acknowledgment would be appreciated. Suggested citation is: T.O. Lim, Y.N. Lim (Eds). Eleventh Report of the Malaysian Dialysis and Transplant Registry 2003. Kuala Lumpur 2004
This report is also published electronically on website of the National Renal Registry at:
http://www.crc.gov.my/nrr

i
FOREWORD This special 11th Report reviews the progress made and looks at the trends in renal replacement therapy (RRT) over the years from 1980 to 2003, dialysis practices from 1993 to 2002 and analysis of RRT outcomes from 1997 to 2002. It has been a remarkable two decades. Starting from near the bottom of the league table of renal replacement program we have now moved to a more respectable position. While a lot more needs to be done, the achievements to date have been considerable. Everyone involved in the provision and management of RRT can be justifiably proud of the progress made. The National Renal Registry started with modest aspirations and even less resources. It has now consolidated its management, acquired new resources especially in IT and has reached out to all providers of RRT. Its single most important achievement in this period under review has been to garner the trust and cooperation of all providers who willingly submitted data regularly. Its management approach of keeping in regular contact with the providers, being responsive to their needs, meeting all deadlines goes a long way in ensuring success. Two key individuals, Dr Lim Teck Onn and Ms Lee Day Guat, played key roles in the success of the National Renal Registry thus far. Their drive, enthusiasm, management skills, obsessive attention to details are the critical success factors of the registry. The number of new patients taken in for dialysis increased by more than 6.5 times over the last 10 year period. A truism shown in all countries is consistently seen in this report i.e. you can only treat that many you can afford. As the country’s Gross domestic product increases so does the number of new patients taken in for dialysis. However for a country with an income and status of a developing nation, we see a pattern in our dialysis patients that is more commonly seen in the rich industrialized countries. Nearly half of the new patients taken in for dialysis were diabetics and the dialysis acceptance rates were highest amongst the older age groups. In these groups the acceptance rates continue to increase sharply. A number of interesting features are seen in this report. The survival of dialysis patients in recent cohorts is lower than the earlier ones. Whether this is a reflection of the rapid proliferation of dialysis centers in recent years with the attendant problems of lack of experienced staff and supervising nephrologists is left to be seen in more detailed studies. Nonetheless it is a cause for concern. An economic evaluation of the cost of dialysis was included in this report. This was a study done on the Ministry of Health’s dialysis program. The cost per life year saved on haemodialysis was quite similar to that for CAPD. This has important implications for the planning of future RRT program. For this 10 year review expert panels were formed to look into selected clinical areas in greater detail than the usual annual reports. While most of the findings are in keeping with reports in the literature and other registry publications, there are a few that warrants further study as they showed differing trends. It would appear that taking in more patients for treatment will not pose a major hurdle given the trend seen in the last ten years and provided the country’s economy continue to grow. A major challenge now confronts all RRT providers; where do we go from here and how can we build on this success. We now have to focus more on improving outcomes through improvements in the quality of treatment that we provide. The NRR can play an important role in this respect. Given the network it has established, the database it accumulated and the goodwill it has generated it would not be too difficult a task for the NRR to take on this new responsibility of promoting quality initiatives through regular monitoring and analysis of outcomes. DR ZAKI MORAD Chairman, National Renal Registry.
ii
ACKNOWLEDGEMENTS
We owe grateful thanks to a multitude of people to get this - the Eleventh Report of the
Malaysian Dialysis and Transplant Registry 2003 to fruition.
We would especially like to thank the following (in no particular order):
Our source data providers :
The nephrologists, physicians and staff of dialysis and transplant centres from the various
government, university, non-government and private centres, without whose commitment, toil and
tears, and timely data submission there will be no report.
The members of the various panels for their expertise and of course for devoting their valuable
time and effort in preparing and writing the various chapters.
Director of the National Registration Department (Jabatan Pendaftaran Negara), for allowing us to
verify the status of those patient lost to follow-up.
And of course not forgetting our supporters from the industry and other well-wishers: Fresenius Medical Care
Baxter Healthcare (Asia) Gambro
MX Services Novartis Roche
And all others who have in one way or another contributed towards the success and the
publication of this report.
Dr. Zaki Morad Chairman National Renal Registry

iii
PARTICIPATING CENTRES
1 801 Rumah Sakit Angkatan Tentera, Kuching
2 807 Rumah Sakit Angkatan Tentera, Sg Petani
3 810 Rumah Sakit Angkatan Tentera, Majidee
4 819 Rumah Sakit Angkatan Tentera, TUDM
5 94 Hospital Angkatan Tentera, Terendak
6 95 Hospital Angkatan Tentera, Kinrara
7 96 Hospital Angkatan Tentera, Lumut
8 Aiman Dialysis Centre
9 Aixin-NKF Dialysis Centre
10 Alor Setar Hospital
11 AMD Rotary Dialysis Centre, Penang
12 Amitabha Haemodialysis Centre
13 Ampang Puteri Specialist Hospital
14 Assunta Hospital
15 Bakti-NKF Dialysis Centre, Kelang
16 Baling Hospital
17 Bangi Dialysis Centre
18 Banting Hospital
19 Batu Pahat Hospital
20 Batu Pahat Rotary Haemodialysis Centre
21 Beaufort Hospital
22 Berchaam Dialysis Centre
23 Berjaya NKF Dialysis Centre, Petaling Jaya
24 Besut Hospital
25 Bintulu Hospital
26 BP Renal Care
27 BP Renalcare, Segamat
28 Buddhist Tzu Chi Dialysis Centre, Butterworth
29 Buddhist Tzu-Chi Dialysis Centre, Jitra
30 Buddhist Tzu-Chi Dialysis Centre, Penang
31 Bukit Mertajam Hospital
32 Bukit Mertajam Specialist Hospital
33 Butterworth Hospital
34 C.S. Loo Kidney & Medical Specialist Centre
35 Charis-NKF Dialysis Centre, Cheras
iv
36 Che Eng Khor Haemodialysis Centre
37 Cheras Dialysis Centre
38 CHKMUS-MAA Medicare Charity Dialysis Centre
39 Damai Medical & Heart Clinic
40 Damansara Specialist Hospital
41 Duchess of Kent Hospital
42 Dungun Hospital
43 Fatimah Hospital
44 Fo Yi NKF Dialysis Centre
45 Gerik Hospital
46 Gleneagles Medical Centre, Penang
47 Haemo Care
48 Haemodialysis Association Klang
49 Harmoni Medical-Care
50 Healthcare Dialysis Centre, Petaling Jaya
51 Hope Haemodialysis Society Ipoh
52 Hospital Pakar Perdana
53 Hulu Terengganu Hospital
54 Ipoh Hospital
55 Island Hospital
56 JB Lion MAA-Medicare Charity Dialysis Centre
57 Jerantut Hospital
58 Johor Specialist Hospital
59 K K Tan Specialist Centre
60 Kajang Dialysis Centre
61 Kajang Hospital
62 Kampong Baru Medical Centre
63 Kangar Hospital
64 Kapit Hospital
65 KAS-Rotary-NKF Dialysis Centre
66 KB Rotary-MAA Dialysis Centre
67 Kemaman Hospital
68 Keningau Hospital
69 Kiwanis Dialysis Centre
70 Kluang Hospital
71 Kluang Rotary Haemodialysis Centre
72 Kota Bharu Hospital
v
73 Kota Tinggi Hospital
74 Kuala Krai Hospital
75 Kuala Lumpur Dialysis Centre
76 Kuala Lumpur Hospital
77 Kuala Lumpur Lions Renal Centre
78 Kuala Nerang Hospital
79 Kuala Pilah Hospital
80 Kuala Terengganu Hospital
81 Kuantan Specialist Centre
82 Kulim Haemodialysis
83 Kulim Hospital
84 Labuan Hospital
85 Lahad Datu Hospital
86 Lam Wah Ee Hospital
87 Langkawi Hospital
88 Leader Rotary Haemodialysis Centre, Puala Pinang
89 Lifeline Dialysis Clinic, Kuala Lumpur
90 Lion Club of Alor Setar-NKF Dialysis Centre
91 MAA-Medicare Charity Dialysis Centre, Butterworth
92 MAA-Medicare Charity Dialysis Centre, Cheras
93 MAA-Medicare Charity Dialysis Centre, Kajang
94 MAA-Medicare Charity Dialysis Centre, Kuala Lumpur
95 MAA-Medicare Charity Dialysis Centre, Mentakab
96 MAA-Medicare Charity Dialysis Centre, Teluk Intan
97 MAA-Medicare Kidney Charity Fund, Kota Kinabalu
98 Mahkota Medical Centre
99 Mawar Medical Centre
100 Mawar Sepang Haemodialysis
101 Melaka Hospital
102 Mentakab Hospital
103 Mersing Hospital
104 Mersing Rotary Haemodialysis Centre
105 Metro Specialist Hospital
106 Miri Hospital
107 Miri Red Crescent Dialysis Centre
108 Moral Uplifting-NKF Dialysis Centre, Ipoh
109 Muar Lions Renal Centre

vi
110 Nephrolife Dialysis Centre
111 NKF Dialysis Centre, Kuala Lumpur
112 Normah Medical Specialist Centre
113 Pahang Buddhist Association Haemodialysis Centre
114 Pakar Sultanah Fatimah Muar Hospital
115 Pantai Medical Centre, Kuala Lumpur
116 Pantai Air Keroh Hospital
117 Pantai Indah Hospital
118 Pantai Mutiara Hospital, Penang
119 Pasir Mas Hospital
120 Pathlab Dialysis Centre
121 Pekan Hospital
122 Penang Adventist Hospital
123 Penang Caring Dialysis Society
124 Perdana Dialysis Centre, Ipoh
125 Perdana Dialysis Centre, Taiping
126 Persatuan Amal Chin Malaysia Barat
127 Persatuan Buah Pinggang Sabah
128 Persatuan Dialisis Kurnia PJ
129 Persatuan Membaiki Akhlak Che Luan Khor
130 Pertubuhan Bakti Fo En Bandar Kulim
131 Pertubuhan Hemodialisis Pasar Besar Meru
132 Pertubuhan Hemodialisis Seberang Perai Selatan
133 PJ Dialysis Centre
134 Ping Rong NKF
135 Pontian Hospital
136 Pontian Rotary Haemodialysis Centre
137 Port Dickson Hospital
138 Premier Renal Care
139 Province Wellesley Renal Medifund Dialysis Centre
140 Pulau Pinang Hospital
141 Pusat Dialisis Dr K K Tan
142 Pusat Dialisis Ehsan Perak
143 Pusat Dialisis Klinik Waqaf An-nur, Batu Pahat
144 Pusat Dialisis Klinik Waqaf An-nur, Kota Raya
145 Pusat Dialisis Klinik Waqaf An-nur, Pasir Gudang
146 Pusat Dialisis Penawar Permai, Taiping

vii
147 Pusat Dialisis Penawar, Johor
148 Pusat Dialisis Sejati
149 Pusat Dialisis Sijangkang
150 Pusat Dialisis Taiping
151 Pusat Dialisis Tapah
152 Pusat Dialisis Terengganu/NKF
153 Pusat Haemodialysis Castina
154 Pusat Hemodialisis Banting Yayasan Nanyang-SJAM-KPS
155 Pusat Hemodialisis Darul Iltizam
156 Pusat Hemodialisis Darul Takzim
157 Pusat Hemodialisis Islam Makmur
158 Pusat Hemodialisis Kau Ong Yah Ampang
159 Pusat Hemodialisis KEMENTAH
160 Pusat Hemodialisis Majlis Perbandaran Kelang
161 Pusat Hemodialisis Manjung-NKF
162 Pusat Hemodialisis Mawar N. Sembilan, Bahau
163 Pusat Hemodialisis Mawar N. Sembilan, Lukut
164 Pusat Hemodialisis Mawar N. Sembilan, Seremban
165 Pusat Hemodialisis Rotary Kota Tinggi
166 Pusat Hemodialisis Rotary Kulai
167 Pusat Hemodialisis S P
168 Pusat Hemodialisis SJAM Bacang Melaka
169 Pusat Hemodialisis Yayasan Felda
170 Pusat Hemodialisis Zakat
171 Pusat Kesihatan Jitra
172 Pusat Muhibah Hemodialisis Pesatuan Tionghua Segamat
173 Pusat Pakar Dialisis Traktif, Seremban
174 Pusat Pakar Tawakal
175 Pusat Perubatan Angkatan Tentera, Kota Bharu
176 Pusat Perubatan Primier HUKM
177 Pusat Rawatan Dialisis Yayasan Pembangunan Keluarga Johor-NKF
178 Pusat Rawatan Islam Ar-Ridzuan
179 Pusat Rawatan Islam, Kuala Lumpur
180 Puteri Specialist Hospital
181 Putrajaya Hospital
182 Queen Elizabeth Hospital
183 Raub Hospital

viii
184 Reddy Clinic
185 Renal Care, Ipoh Specialist Hospital
186 Renal Care, Kedah Medical Centre
187 Renal Dialysis Centre, Gleneagles Intan Medical Centre
188 Renal Healthcare, Kuala Lumpur
189 Renal-Link, Seremban
190 Renal Link, Penang
191 Renal Medicare Centre
192 Renal-Link Sentosa, Sentosa Medical Centre
193 Renal-Link, Kelantan
194 Rotary Club Damansara-NKF Dialysis Centre, Kepong
195 Rotary Club Tawau Tanjung Haemodialysis Centre
196 Rotary Haemodialysis Centre, Johor Bahru
197 Santa Dialysis Centre
198 S.P. Menon Dialysis Centre, Klang
199 S.P. Menon Dialysis Centre, Kuala Lumpur
200 S.P. Menon Dialysis Centre, Petaling Jaya
201 Sabah Medical Centre
202 Sandakan Kidney Society
203 Sarawak General Hospital
204 Sarikei Hospital
205 Seberang Perai Haemodialysis Centre, Bagan Specialist Centre
206 Segamat Hospital
207 Selangor Medical Centre
208 Selasih Specialist Centre
209 Selayang Hospital
210 Seremban Hospital
211 Seri Manjung Hospital
212 Serian Hospital
213 Sibu Hospital
214 Sibu Kidney Foundation Haemodialysis Centre
215 Sik Hospital
216 SJAM-KPS Haemodialysis Centre, Kampar
217 SJAM-KPS HaemodialysisCentre, Kelang
218 Smartcare Dialysis Centre, Subang Jaya
219 Smartcare Dialysis Clinic, Cheras
220 Sri Aman Hospital

ix
221 Sri Kota Medical Centre
222 Strand Specialist Hospital
223 Subang Jaya Medical Centre
224 Sultanah Aminah Hospital
225 Sungai Bakap Hospital
226 Sungai Petani Hospital
227 Sunway Medical Centre
228 Superkids Trinity-NKF Dialysis Centre, Alor Setar
229 Systemic Dialysis Centre
230 Syukur Elit
231 Taiping Hospital
232 Tanah Merah Hospital
233 Tanjung Karang Hospital
234 Tanjung Malim Hospital
235 Tawau Hospital
236 Teluk Intan Hospital
237 Tenang Haemodialysis Centre
238 Tengku Ampuan Afzan Hospital, Kuantan
239 Tengku Ampuan Jemaah Hospital, Sabak Bernam
240 Tengku Ampuan Rahimah Hospital, Klang
241 The Kidney Dialysis Centre
242 The Nayang-NKF Dialysis Centre
243 The Penang Community Haemodialysis Society
244 Timberland Medical Centre
245 Traktif Specialist Dialysis Centre
246 Tung Shin Hospital
247 Universiti Kebangsaan Malaysia Bangi
248 Universiti Kebangsaan Malaysia Hospital
249 Universiti Sains Malaysia Hospital
250 University Malaya Medical Centre
251 Woh Peng Cheang Seah Dialysis Centre
252 Yan Hospital
253 Yayasan Dialisis Pertubohan Pendidikan Akhlak-NKF, Taiping
254 Yayasan Hemodialisis Kebajikan Southern Melaka
255 Yayasan Kebajikan SSL Heamodialisis

x
ABOUT THE NATIONAL RENAL REGISTRY The National Renal Registry (NRR) collects information about patients on renal replacement therapy (RRT) in Malaysia. This information is needed for the estimation of treatment rates in the country, as well as to assist the Ministry of Health (MOH), Non-Governmental Organization, private providers and industry in the planning and evaluation of RRT services. The National Renal Registry (NRR) has its origin in the Dialysis and Transplant Registry established by the Department of Nephrology in 1992 to collect data from patients on renal replacement therapy within the MOH. In order to expand coverage to include all patients on RRT in the country so that the registry may truly claim to be a national one, the Malaysian Society of Nephrology (MSN) was invited to co-sponsor the registry in 1995. In 2001, the Clinical Research Centre of the MOH was designated as NRR collaborating unit to provide clinical operational, biostatistical and data management capabilities to support the operations of the NRR. The Dialysis Association of Medical Assistant and Nurses (DAMAN), a key professional counterpart to MSN, also agrees to co-own the NRR in 2002. The objectives of NRR are to: 1. Determine the frequency and distribution of dialysis and transplantation in Malaysia. These
are useful measures of the health burden arising of end stage renal failure and its treatment provision in the country
2. Determine the outcomes, and factors influencing outcomes of dialysis and renal transplantation. This serves the needs of outcome assessment.
3. Evaluate RRT program. This serves the need of accountability. 4. Stimulate and facilitate research on RRT and ESRD. 5. Maintain the national renal transplant waiting list. The NRR receives data on RRT from 2 main sources: 1. The National Vital Registration system (Jabatan Pendaftaran Negara). These data are useful
for determining or verifying mortality outcomes of patients on RRT. 2. The most important data sources are the individual doctors, medical assistants and nurses
who care for patients on RRT, and voluntarily report data to the NRR.
NRR SPONSORS Malaysian Society of Nephrology
Dialysis Association of Medical Assistant and Nurses
Clinical Research Centre, Kuala Lumpur Hospital.
xi
ADVISORY COMMITTEE
Chairman: Dato’ Dr. Zaki Morad B Mohd Zaher Members: Dr. Lim Yam Ngo Dr. T. Thiruventhiran Dr. Tan Hee Wu MSN Nominees Professor Dr. Tan Si Yan Dr. Wong Hin Seng Dr. Lim Teck Onn Dr. Jamaiyah Haniff CRC Nominees Ms. Lee Day Guat Hj. Mohd Harith Fadzella DAMAN Nominees Ms. Asma Abdullah

xii
EXPERT PANEL For each chapter of this report, the NRR established an expert panel comprising nephrologists and allied health professionals where relevant with expert knowledge in the area concerned. The tasks of the Expert Panel were: 1. To undertake Quality Control of the reported data 2. To undertake literature review in the area relevant to the panel 3. To interpret the results presented in the NRR report 4. To write the chapter of the report relevant to the panel’s expertise Hence the contributors of the various chapters in this Report are:
Chapter Title Expert Panel Members Institution/company Lim Yam Ngo (Chairperson) Kuala Lumpur Hospital
Chapter 1: All RRT in Malaysia
Lim Teck Onn Clinical Research Centre
Lim Yam Ngo (Chairperson) Kuala Lumpur Hospital
Chapter 2: Dialysis in Malaysia
Lim Teck Onn Clinical Research Centre
Wan Shaariah Bt Md Yusuf (Chairperson) Seremban Hospital
Wong Hin Seng Kuala Lumpur Hospital
Ong Loke Meng Pulau Pinang Hospital
Chapter 3: Dialysis Survival
Tan Hee Wu Assunta Hospital
Liu Wen Jiun (Chairperson) Sultanah Aminah Hospital
Zaki Morad B Mohd Zaher Kuala Lumpur Hospital
Alinda Chiu Sze Fung Kuala Lumpur Hospital
Chapter 4: Quality of Life and Rehabilitation outcomes of Dialysis patients
Chew Thian Fook Kuala Lumpur Hospital
Hooi Lai Seong (Chairperson) Sultanah Aminah Hospital
Lim Teck Onn Clinical Research Centre
Ching Chen Hua Selayang Hospital
Chapter 5: Cost Effectiveness of Dialysis and Resource utilization
Adrian Goh Clinical Research Centre
Goh Bak Leong (Chairperson) Selayang Hospital
Go Kuan Weng Kuala Lumpur Hospital
Lily Mushahar Selayang Hospital
Chapter 6: Renal Transplantation
Rafidah Abdullah Selayang Hospital

xiii
Philip N. Jeremiah (Chairperson) Ampang Puteri Specialist Hospital
Parameswaran Krishnan Tg Ampuan Afzan Hospital
Bee Boon Cheak Kuala Lumpur Hospital
Chapter 7: Anaemia management
Tharmaratnam A/L Rasanayagam Tg. Ampuan Rahimah Hospital
Ahmad Fauzi Abdul Rahman (Chairperson)
Universiti Kebangsaan Malaysia Hospital
Winnie Chee Siew Swee Universiti Kebangsaan Malaysia
Ravindran Visvanathan Kuala Lumpur Hospital
Chapter 8: Nutritional status on dialysis
Tilakavati Karupaiah Universiti Kebangsaan Malaysia
Prasad Menon (Chairperson) Subang Jaya Medical Centre
Lee Wan Tin Subang Jaya Medical Centre
Ong Kee Liang Kuala Lumpur Hospital
Thiruventhiran ThilaganathanNational Kidney Foundation of Malaysia
Chapter 9: Cardiovascular disease in dialysis patients
Tan Chwee Choon Tg. Ampuan Rahimah Hospital
Fan Kin Sing (Chairperson) Renal Dialysis Centre Sdn. Bhd.
Rozina Bt Ghazalli Pulau Pinang Hospital
Chapter 10: Renal Bone Disease
Shahnaz Shah Firdaus Khan Kuala Lumpur Hospital
Teo Sue Mei (Chairperson) Ipoh Hospital
Claire Tan Hui Hong Sarawak Hospital
Foo Sui Mei Ipoh Hospital
Chapter 11: Hepatitis on Dialysis
Indralingam Vaithiligam Taiping Hospital
Teo Sue Mei (Chairperson) Ipoh Hospital
Claire Tan Hui Hong Sarawak Hospital
Foo Sui Mei Ipoh Hospital
Chapter 12: Vascular Access Infection
Indralingam Vaithiligam Taiping Hospital
Tan Si Yen (Chairperson) University Malaya Medical Centre
Chang Sean Haw University Malaya Medical Centre
Chapter 13: Dialysis Adequacy
Sukeri Mohamad Kota Bharu Hospital
Lee Ming Lee (Chairperson) Seremban Hospital
Susan Pee Sultanah Aminah Hospital
Lynster Liaw Pulau Pinang Hospital
Chapter 14: Paediatric RRT
Wan Jazilah Wan Ismail Selayang Hospital

xiv
CLINICAL RESEARCH CENTRE The Clinical Research Centre (CRC) is the designated collaborating unit to the NRR. It provides the functional capacity to support the operations of the NRR. The CRC is the clinical research arm of the Ministry of Health. Apart from the NRR, CRC currently also supports the National Cancer Registry, National Cataract Surgery Registry, National Neonatal Registry, National Mental Health Registry, National HIV/AIDS Treatment Registry and National Transplant Registry. In recent years, CRC has emerged to become the preferred collaborating partner for medical professional groups to establish disease and treatment registers in the country. This is because CRC possesses sophisticated facility and equipment, state of the art technology, and most importantly the trained human resources such as registry managers, clinical epidemiologists, biostatisticians, information technology professionals and other supporting staff skilled in registry operations. These resources are consolidated in the Disease and Treatment Registry Unit in the CRC. This unit specializes in assisting medical professionals to establish and operate their registries. Staff of the Clinical Research Centre (CRC) and Renal Registry Unit (RRU) of Disease & Treatment Registry Unit (DTRU) Director Dr. Zaki Morad B Mohamad Zaher Head Dr. Lim Teck Onn Head of DTRU Dr. Jamaiyah Haniff Registry Manager RRU SN Lee Day Guat Clinical Registry Assistant RRU Ms. Mardhiah Arifin Clinical Registry Assistant RRU Ms. Nor Azliana Clinical Epidemiologist Dr. Jamaiyah Haniff IT manager Ms Celine Tsai Pao Chien Network Administrator Mr. Kevin Ng Hong Heng Assistant Network Administrator Mr. Adlan Ab. Rahman Database Administrator Ms. Lim Jie Ying Webmaster Mr. Patrick Lum See Kai Programmer Mr. Sebastian Thoo Desktop publisher Ms Azizah Alimat Statistician Ms. Teh Poh Geok Assistant Statistician Ms. Aishah Mohd Noor Assistant Statistician Ms. Tan Mun Sie

xv
CONTENTS
Foreword i Acknowledgement ii
Participating Centres iii - ix
About The National Renal Registry x
Sponsors of the NRR x
Advisory Committee xi
Expert Panel xii - xiii
Clinical Research Centre xiv
Contents xv
Index of Tables xvi - xxi
Index of Figures xxii - xxv
Nephrology in Malaysia: Then and Now 1 - 8
Chapter 1: ALL RRT IN MALAYSIA 9 - 12 Stock and Flow • Treatment provision rate
Chapter 2: DIALYSIS IN MALAYSIA 13 - 25 Dialysis treatment provision • Geographic distribution • Dialysis treatment in relation to gender, age •
Method and location • Funding Dialysis treatment by sector • Primary renal disease • Death on dialysis
Chapter 3: DIALYSIS SURVIVAL 27 - 33 By dialysis modality, year commencing dialysis, age, diabetic status • adjusted mortality
Chapter 4: QUALITY OF LIFE AND REHABILITATION OUTCOMES OF DIALYSIS PATIENTS 35 - 45 Quality of life outcome • work related rehabilitation outcome Chapter 5: COST EFFECTIVENESS OF DIALYSIS AND RESOURCE UTILISATION 47 - 53 Methodology • cost per HD • cost per life year saved on HD and CAPD Chapter 6: RENAL TRANSPLANTATION 55 - 68 Influence of non-immunological factors on long-term survival Chapter 7: ANAEMIA MANAGEMENT 69 - 76 Target haemoglobin • ferrirtin and erythropoietin dosing • haemologbin and mortality Chapter 8: NUTRITIONAL STATUS ON DIALYSIS 77 - 87 Serum albumin in HD and CAPD • BMI in HD and CAPD Chapter 9: CARDIOVASCULAR DISEASE IN DIALYSIS PATIENTS 89 - 111 Blood pressure in HD and CAPD • serum cholesterol and triglyceride in HD and CAPD Chapter 10: RENAL BONE DISEASE 113 - 117 Serum calcium • serum phosphate • intact PTH Chapter 11: HEPATITIS ON DILAYSIS 119 - 122 Hepatitis B and C prevalence • seroconversion risk Chapter 12: VASCULAR ACCESS INFECTION 123 - 125 Incidence • risk factors Chapter 13: HAEMODIALYSIS ADEQUACY 127 - 133 Dialysis practice • spKt/V and survival Chapter 14: PAEDIATRIC RRT 135 - 142 Provision • treatment modality • primary renal disease • survival Appendix 1: DATA MANAGEMENT 143 - 144 Appendix 2: ANALYSIS SETS AND STATISTICAL METHODS 145 - 146 Appendix 3: GLOSSARY 147
xvi
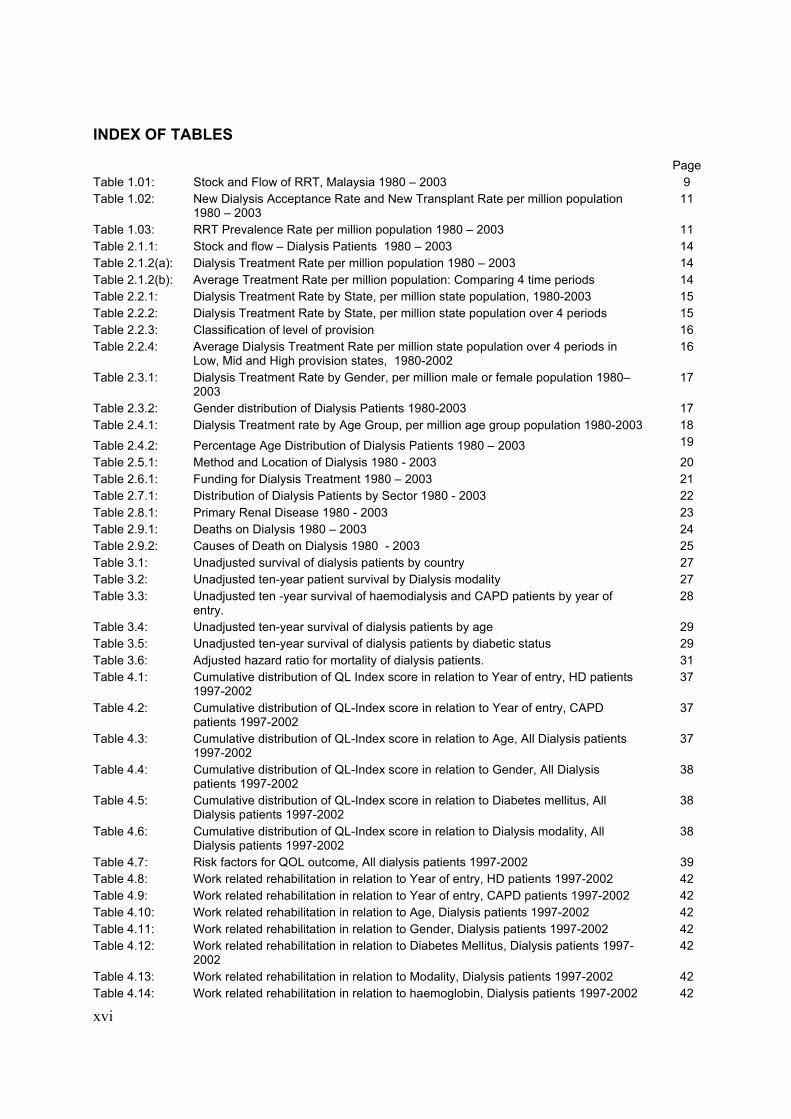
INDEX OF TABLES Page Table 1.01: Stock and Flow of RRT, Malaysia 1980 – 2003 9 Table 1.02: New Dialysis Acceptance Rate and New Transplant Rate per million population
1980 – 2003 11
Table 1.03: RRT Prevalence Rate per million population 1980 – 2003 11 Table 2.1.1: Stock and flow – Dialysis Patients 1980 – 2003 14 Table 2.1.2(a): Dialysis Treatment Rate per million population 1980 – 2003 14 Table 2.1.2(b): Average Treatment Rate per million population: Comparing 4 time periods 14 Table 2.2.1: Dialysis Treatment Rate by State, per million state population, 1980-2003 15 Table 2.2.2: Dialysis Treatment Rate by State, per million state population over 4 periods 15 Table 2.2.3: Classification of level of provision 16 Table 2.2.4: Average Dialysis Treatment Rate per million state population over 4 periods in
Low, Mid and High provision states, 1980-2002 16
Table 2.3.1: Dialysis Treatment Rate by Gender, per million male or female population 1980– 2003
17
Table 2.3.2: Gender distribution of Dialysis Patients 1980-2003 17 Table 2.4.1: Dialysis Treatment rate by Age Group, per million age group population 1980-2003 18
Table 2.4.2: Percentage Age Distribution of Dialysis Patients 1980 – 2003 19
Table 2.5.1: Method and Location of Dialysis 1980 - 2003 20 Table 2.6.1: Funding for Dialysis Treatment 1980 – 2003 21 Table 2.7.1: Distribution of Dialysis Patients by Sector 1980 - 2003 22 Table 2.8.1: Primary Renal Disease 1980 - 2003 23 Table 2.9.1: Deaths on Dialysis 1980 – 2003 24 Table 2.9.2: Causes of Death on Dialysis 1980 - 2003 25 Table 3.1: Unadjusted survival of dialysis patients by country 27 Table 3.2: Unadjusted ten-year patient survival by Dialysis modality 27 Table 3.3: Unadjusted ten -year survival of haemodialysis and CAPD patients by year of
entry. 28
Table 3.4: Unadjusted ten-year survival of dialysis patients by age 29 Table 3.5: Unadjusted ten-year survival of dialysis patients by diabetic status 29 Table 3.6: Adjusted hazard ratio for mortality of dialysis patients. 31 Table 4.1: Cumulative distribution of QL Index score in relation to Year of entry, HD patients
1997-2002 37
Table 4.2: Cumulative distribution of QL-Index score in relation to Year of entry, CAPD patients 1997-2002
37
Table 4.3: Cumulative distribution of QL-Index score in relation to Age, All Dialysis patients 1997-2002
37
Table 4.4: Cumulative distribution of QL-Index score in relation to Gender, All Dialysis patients 1997-2002
38
Table 4.5: Cumulative distribution of QL-Index score in relation to Diabetes mellitus, All Dialysis patients 1997-2002
38
Table 4.6: Cumulative distribution of QL-Index score in relation to Dialysis modality, All Dialysis patients 1997-2002
38
Table 4.7: Risk factors for QOL outcome, All dialysis patients 1997-2002 39 Table 4.8: Work related rehabilitation in relation to Year of entry, HD patients 1997-2002 42 Table 4.9: Work related rehabilitation in relation to Year of entry, CAPD patients 1997-2002 42 Table 4.10: Work related rehabilitation in relation to Age, Dialysis patients 1997-2002 42 Table 4.11: Work related rehabilitation in relation to Gender, Dialysis patients 1997-2002 42 Table 4.12: Work related rehabilitation in relation to Diabetes Mellitus, Dialysis patients 1997-
2002 42
Table 4.13: Work related rehabilitation in relation to Modality, Dialysis patients 1997-2002 42 Table 4.14: Work related rehabilitation in relation to haemoglobin, Dialysis patients 1997-2002 42

xvii
Table 4.15: Work related rehabilitation in relation to Albumin, Dialysis patients 1997-2002 43 Table 4.16: Work related rehabilitation in relation to KT/V, HD patients only 1997-2002 43 Table 4.17: Risk factors for Rehabilitation outcome, All dialysis patients 1997-2002 43 Table 5.1: Characteristics of participating centres 48 Table 5.2: Characteristics of sample HD and CAPD subjects 49 Table 5.3: Cost per HD procedure with cost component breakdown 50 Table 5.4: Cost per patient-month of CAPD treatment with cost component breakdown 51 Table 5.5: Costs of Outpatient care 51 Table 5.6: Average length of Hospitalisation per month on Dialysis 51 Table 5.7: Costs of Hospitalisation care 51 Table 5.8: Costs of EPO utilisation per patient-year 51 Table 5.9: Life expectancies on HD and CAPD by Age 52 Table 5.10: Cost per Life-year saved on HD and CAPD 52 Table 5.11: Cost per Life-year saved on HD and CAPD by Age 52 Table 5.12: Cost Effectiveness under different scenarios 52 Table 6.1: Place of Renal Transplantation 1993-2002 56 Table 6.2: Unadjusted Transplant Patient Survival related to Year of transplant 1993-2002 56 Table 6.3: Unadjusted Transplant Graft Survival related to Year of transplant 1993-2002 56 Table 6.4: Renal Transplant Recipients' Characteristics 1993-2002 56 Table 6.5: Causes of Graft Failure 1993-2002 57 Table 6.6: Renal Transplant performed between 1993-2002 54 Table 6.7: Unadjusted Transplant Patient and Graft Survival 1993-2002 58 Table 6.8: Unadjusted Transplant Patient Survival related to Age 1993-2002 58 Table 6.9: Unadjusted Transplant Graft Survival related to Age 1993-2002 58 Table 6.10: Unadjusted Transplant Patient Survival related to Ethnicity 1993-2002 59 Table 6.11: Unadjusted Transplant Graft Survival related to Ethnicity 1993-2002 59 Table 6.12: Unadjusted Transplant Graft Survival related to BMI 1993-2002 60 Table 6.13: Unadjusted Transplant Patient Survival related to Diabetes Mellitus 1993-2002 60 Table 6.14: Unadjusted Transplant Graft Survival related to Diabetes Mellitus 1993-2002 60 Table 6.15: Unadjusted Transplant Patient Survival related to HbsAg status 1993-2002 61 Table 6.16: Unadjusted Transplant Graft Survival related to HBsAg status 1993-2002 61 Table 6.17: Unadjusted Transplant Graft Survival related to Anti-HCV status 1993-2002 61 Table 6.18: Unadjusted Transplant Patient Survival related to Cardiovascular Disease 1993-
2002 62
Table 6.19: Unadjusted Transplant Graft Survival related to Cardiovascular Disease 1993-2002 62 Table 6.20: Unadjusted Transplant Patient Survival related to Prior Dialysis Duration 1993-
2002 62
Table 6.21: Unadjusted Transplant Graft Survival related to Prior Dialysis Duration 1993-2002 62 Table 6.22: Unadjusted Transplant Patient Survival related to Type of Transplant 1993-2002 63 Table 6.23: Unadjusted Transplant Graft Survival related to Type of Transplant 1993-2002 63 Table 6.24: Risk factors for Transplant Patient Survival 1993-2002 64 Table 6.25: Risk factors for Graft Survival 1993-2002 65 Table 6.26: Unadjusted Transplant Patient Survival related to Diabetes Mellitus 1993-2002 66 Table 6.27: Unadjusted HD Patient Survival related to Diabetes Mellitus 1993-2002 66 Table 7.1.1: Distribution of Haemoglobin Concentration without Erythropoietin, all HD patients, ,
1993 – 2002 70
Table 7.1.2: Distribution of Haemoglobin Concentration on Erythropoietin, HD patients, 1993 – 2002
70
Table 7.1.3: Distribution of Haemoglobin concentration without Erythropoietin, CAPD patients, 1993 - 2003
71
Table 7.1.4: Distribution of Haemoblobin concentration on Erythropoietin, CAPD patients, 1993– 2002
71
Table 7.2.1: Treatment for Anemia, HD patients 72 Table 7.2.2: Distribution of Erythropoietin dose per week, HD patients 1993-2002 72
xviii
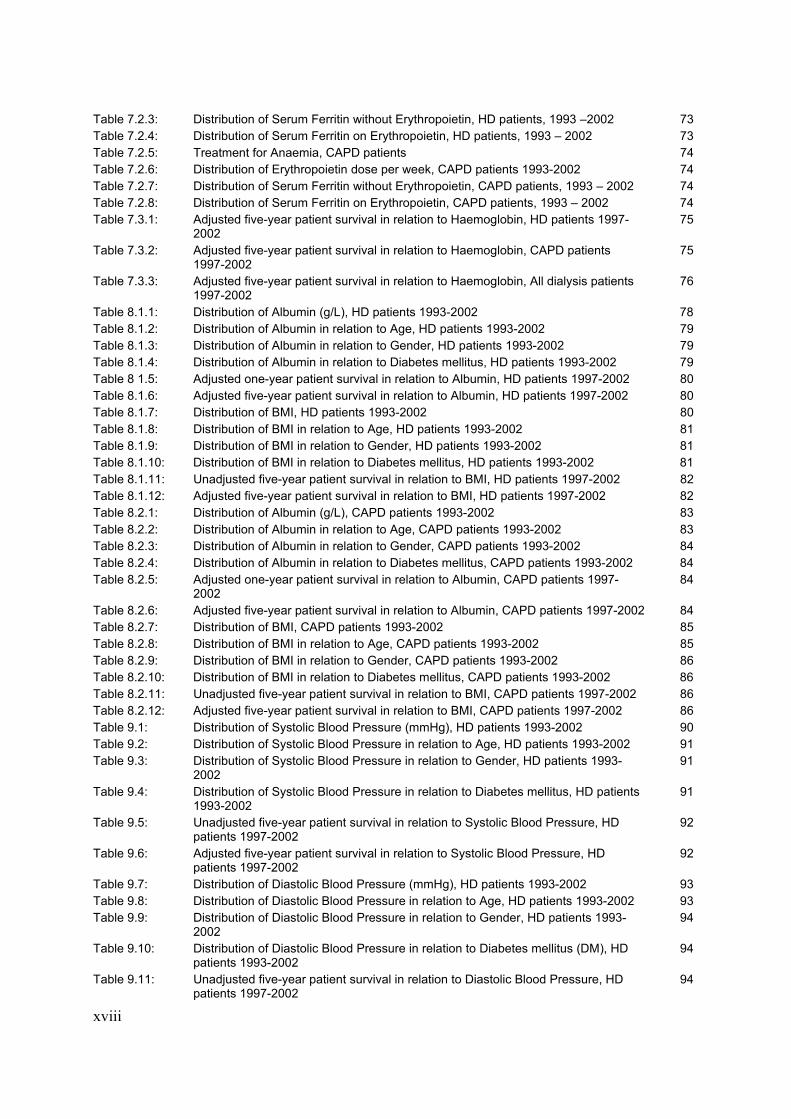
Table 7.2.3: Distribution of Serum Ferritin without Erythropoietin, HD patients, 1993 –2002 73 Table 7.2.4: Distribution of Serum Ferritin on Erythropoietin, HD patients, 1993 – 2002 73 Table 7.2.5: Treatment for Anaemia, CAPD patients 74 Table 7.2.6: Distribution of Erythropoietin dose per week, CAPD patients 1993-2002 74 Table 7.2.7: Distribution of Serum Ferritin without Erythropoietin, CAPD patients, 1993 – 2002 74 Table 7.2.8: Distribution of Serum Ferritin on Erythropoietin, CAPD patients, 1993 – 2002 74 Table 7.3.1: Adjusted five-year patient survival in relation to Haemoglobin, HD patients 1997-
2002 75
Table 7.3.2: Adjusted five-year patient survival in relation to Haemoglobin, CAPD patients 1997-2002
75
Table 7.3.3: Adjusted five-year patient survival in relation to Haemoglobin, All dialysis patients 1997-2002
76
Table 8.1.1: Distribution of Albumin (g/L), HD patients 1993-2002 78 Table 8.1.2: Distribution of Albumin in relation to Age, HD patients 1993-2002 79 Table 8.1.3: Distribution of Albumin in relation to Gender, HD patients 1993-2002 79 Table 8.1.4: Distribution of Albumin in relation to Diabetes mellitus, HD patients 1993-2002 79 Table 8 1.5: Adjusted one-year patient survival in relation to Albumin, HD patients 1997-2002 80 Table 8.1.6: Adjusted five-year patient survival in relation to Albumin, HD patients 1997-2002 80 Table 8.1.7: Distribution of BMI, HD patients 1993-2002 80 Table 8.1.8: Distribution of BMI in relation to Age, HD patients 1993-2002 81 Table 8.1.9: Distribution of BMI in relation to Gender, HD patients 1993-2002 81 Table 8.1.10: Distribution of BMI in relation to Diabetes mellitus, HD patients 1993-2002 81 Table 8.1.11: Unadjusted five-year patient survival in relation to BMI, HD patients 1997-2002 82 Table 8.1.12: Adjusted five-year patient survival in relation to BMI, HD patients 1997-2002 82 Table 8.2.1: Distribution of Albumin (g/L), CAPD patients 1993-2002 83 Table 8.2.2: Distribution of Albumin in relation to Age, CAPD patients 1993-2002 83 Table 8.2.3: Distribution of Albumin in relation to Gender, CAPD patients 1993-2002 84 Table 8.2.4: Distribution of Albumin in relation to Diabetes mellitus, CAPD patients 1993-2002 84 Table 8.2.5: Adjusted one-year patient survival in relation to Albumin, CAPD patients 1997-
2002 84
Table 8.2.6: Adjusted five-year patient survival in relation to Albumin, CAPD patients 1997-2002 84 Table 8.2.7: Distribution of BMI, CAPD patients 1993-2002 85 Table 8.2.8: Distribution of BMI in relation to Age, CAPD patients 1993-2002 85 Table 8.2.9: Distribution of BMI in relation to Gender, CAPD patients 1993-2002 86 Table 8.2.10: Distribution of BMI in relation to Diabetes mellitus, CAPD patients 1993-2002 86 Table 8.2.11: Unadjusted five-year patient survival in relation to BMI, CAPD patients 1997-2002 86 Table 8.2.12: Adjusted five-year patient survival in relation to BMI, CAPD patients 1997-2002 86 Table 9.1: Distribution of Systolic Blood Pressure (mmHg), HD patients 1993-2002 90 Table 9.2: Distribution of Systolic Blood Pressure in relation to Age, HD patients 1993-2002 91 Table 9.3: Distribution of Systolic Blood Pressure in relation to Gender, HD patients 1993-
2002 91
Table 9.4: Distribution of Systolic Blood Pressure in relation to Diabetes mellitus, HD patients 1993-2002
91
Table 9.5: Unadjusted five-year patient survival in relation to Systolic Blood Pressure, HD patients 1997-2002
92
Table 9.6: Adjusted five-year patient survival in relation to Systolic Blood Pressure, HD patients 1997-2002
92
Table 9.7: Distribution of Diastolic Blood Pressure (mmHg), HD patients 1993-2002 93 Table 9.8: Distribution of Diastolic Blood Pressure in relation to Age, HD patients 1993-2002 93 Table 9.9: Distribution of Diastolic Blood Pressure in relation to Gender, HD patients 1993-
2002 94
Table 9.10: Distribution of Diastolic Blood Pressure in relation to Diabetes mellitus (DM), HD patients 1993-2002
94
Table 9.11: Unadjusted five-year patient survival in relation to Diastolic Blood Pressure, HD patients 1997-2002
94
xix
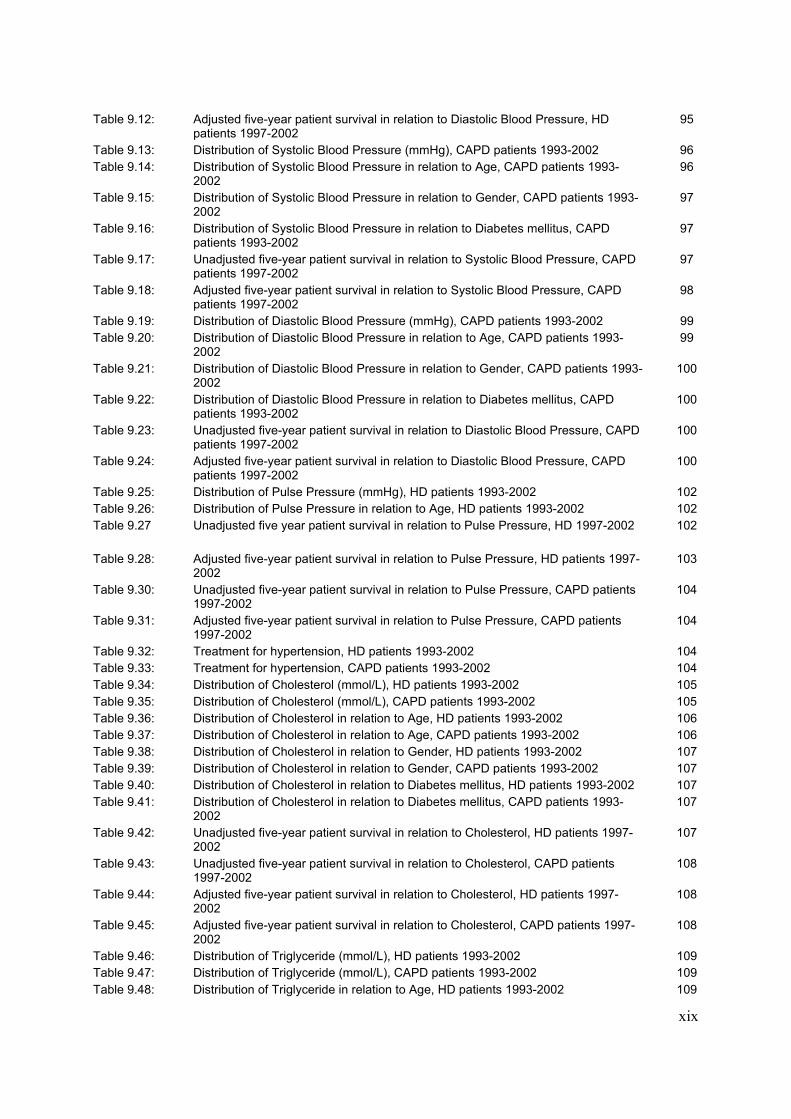
Table 9.12: Adjusted five-year patient survival in relation to Diastolic Blood Pressure, HD patients 1997-2002
95
Table 9.13: Distribution of Systolic Blood Pressure (mmHg), CAPD patients 1993-2002 96 Table 9.14: Distribution of Systolic Blood Pressure in relation to Age, CAPD patients 1993-
2002 96
Table 9.15: Distribution of Systolic Blood Pressure in relation to Gender, CAPD patients 1993-2002
97
Table 9.16: Distribution of Systolic Blood Pressure in relation to Diabetes mellitus, CAPD patients 1993-2002
97
Table 9.17: Unadjusted five-year patient survival in relation to Systolic Blood Pressure, CAPD patients 1997-2002
97
Table 9.18: Adjusted five-year patient survival in relation to Systolic Blood Pressure, CAPD patients 1997-2002
98
Table 9.19: Distribution of Diastolic Blood Pressure (mmHg), CAPD patients 1993-2002 99 Table 9.20: Distribution of Diastolic Blood Pressure in relation to Age, CAPD patients 1993-
2002 99
Table 9.21: Distribution of Diastolic Blood Pressure in relation to Gender, CAPD patients 1993-2002
100
Table 9.22: Distribution of Diastolic Blood Pressure in relation to Diabetes mellitus, CAPD patients 1993-2002
100
Table 9.23: Unadjusted five-year patient survival in relation to Diastolic Blood Pressure, CAPD patients 1997-2002
100
Table 9.24: Adjusted five-year patient survival in relation to Diastolic Blood Pressure, CAPD patients 1997-2002
100
Table 9.25: Distribution of Pulse Pressure (mmHg), HD patients 1993-2002 102 Table 9.26: Distribution of Pulse Pressure in relation to Age, HD patients 1993-2002 102 Table 9.27
Unadjusted five year patient survival in relation to Pulse Pressure, HD 1997-2002 102
Table 9.28: Adjusted five-year patient survival in relation to Pulse Pressure, HD patients 1997-2002
103
Table 9.30: Unadjusted five-year patient survival in relation to Pulse Pressure, CAPD patients 1997-2002
104
Table 9.31: Adjusted five-year patient survival in relation to Pulse Pressure, CAPD patients 1997-2002
104
Table 9.32: Treatment for hypertension, HD patients 1993-2002 104 Table 9.33: Treatment for hypertension, CAPD patients 1993-2002 104 Table 9.34: Distribution of Cholesterol (mmol/L), HD patients 1993-2002 105 Table 9.35: Distribution of Cholesterol (mmol/L), CAPD patients 1993-2002 105 Table 9.36: Distribution of Cholesterol in relation to Age, HD patients 1993-2002 106 Table 9.37: Distribution of Cholesterol in relation to Age, CAPD patients 1993-2002 106 Table 9.38: Distribution of Cholesterol in relation to Gender, HD patients 1993-2002 107 Table 9.39: Distribution of Cholesterol in relation to Gender, CAPD patients 1993-2002 107 Table 9.40: Distribution of Cholesterol in relation to Diabetes mellitus, HD patients 1993-2002 107 Table 9.41: Distribution of Cholesterol in relation to Diabetes mellitus, CAPD patients 1993-
2002 107
Table 9.42: Unadjusted five-year patient survival in relation to Cholesterol, HD patients 1997-2002
107
Table 9.43: Unadjusted five-year patient survival in relation to Cholesterol, CAPD patients 1997-2002
108
Table 9.44: Adjusted five-year patient survival in relation to Cholesterol, HD patients 1997-2002
108
Table 9.45: Adjusted five-year patient survival in relation to Cholesterol, CAPD patients 1997-2002
108
Table 9.46: Distribution of Triglyceride (mmol/L), HD patients 1993-2002 109 Table 9.47: Distribution of Triglyceride (mmol/L), CAPD patients 1993-2002 109 Table 9.48: Distribution of Triglyceride in relation to Age, HD patients 1993-2002 109
xx
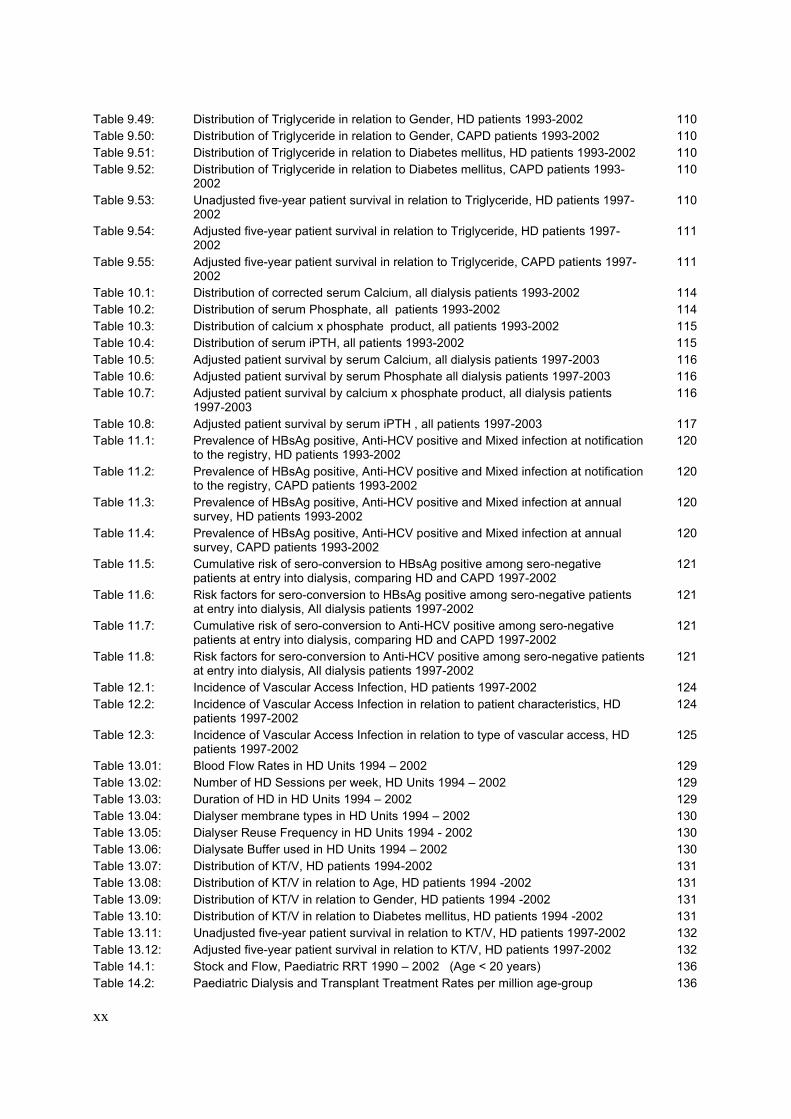
Table 9.49: Distribution of Triglyceride in relation to Gender, HD patients 1993-2002 110 Table 9.50: Distribution of Triglyceride in relation to Gender, CAPD patients 1993-2002 110 Table 9.51: Distribution of Triglyceride in relation to Diabetes mellitus, HD patients 1993-2002 110 Table 9.52: Distribution of Triglyceride in relation to Diabetes mellitus, CAPD patients 1993-
2002 110
Table 9.53: Unadjusted five-year patient survival in relation to Triglyceride, HD patients 1997-2002
110
Table 9.54: Adjusted five-year patient survival in relation to Triglyceride, HD patients 1997-2002
111
Table 9.55: Adjusted five-year patient survival in relation to Triglyceride, CAPD patients 1997-2002
111
Table 10.1: Distribution of corrected serum Calcium, all dialysis patients 1993-2002 114 Table 10.2: Distribution of serum Phosphate, all patients 1993-2002 114 Table 10.3: Distribution of calcium x phosphate product, all patients 1993-2002 115 Table 10.4: Distribution of serum iPTH, all patients 1993-2002 115 Table 10.5: Adjusted patient survival by serum Calcium, all dialysis patients 1997-2003 116 Table 10.6: Adjusted patient survival by serum Phosphate all dialysis patients 1997-2003 116 Table 10.7: Adjusted patient survival by calcium x phosphate product, all dialysis patients
1997-2003 116
Table 10.8: Adjusted patient survival by serum iPTH , all patients 1997-2003 117 Table 11.1: Prevalence of HBsAg positive, Anti-HCV positive and Mixed infection at notification
to the registry, HD patients 1993-2002 120
Table 11.2: Prevalence of HBsAg positive, Anti-HCV positive and Mixed infection at notification to the registry, CAPD patients 1993-2002
120
Table 11.3: Prevalence of HBsAg positive, Anti-HCV positive and Mixed infection at annual survey, HD patients 1993-2002
120
Table 11.4: Prevalence of HBsAg positive, Anti-HCV positive and Mixed infection at annual survey, CAPD patients 1993-2002
120
Table 11.5: Cumulative risk of sero-conversion to HBsAg positive among sero-negative patients at entry into dialysis, comparing HD and CAPD 1997-2002
121
Table 11.6: Risk factors for sero-conversion to HBsAg positive among sero-negative patients at entry into dialysis, All dialysis patients 1997-2002
121
Table 11.7: Cumulative risk of sero-conversion to Anti-HCV positive among sero-negative patients at entry into dialysis, comparing HD and CAPD 1997-2002
121
Table 11.8: Risk factors for sero-conversion to Anti-HCV positive among sero-negative patients at entry into dialysis, All dialysis patients 1997-2002
121
Table 12.1: Incidence of Vascular Access Infection, HD patients 1997-2002 124 Table 12.2: Incidence of Vascular Access Infection in relation to patient characteristics, HD
patients 1997-2002 124
Table 12.3: Incidence of Vascular Access Infection in relation to type of vascular access, HD patients 1997-2002
125
Table 13.01: Blood Flow Rates in HD Units 1994 – 2002 129 Table 13.02: Number of HD Sessions per week, HD Units 1994 – 2002 129 Table 13.03: Duration of HD in HD Units 1994 – 2002 129 Table 13.04: Dialyser membrane types in HD Units 1994 – 2002 130 Table 13.05: Dialyser Reuse Frequency in HD Units 1994 - 2002 130 Table 13.06: Dialysate Buffer used in HD Units 1994 – 2002 130 Table 13.07: Distribution of KT/V, HD patients 1994-2002 131 Table 13.08: Distribution of KT/V in relation to Age, HD patients 1994 -2002 131 Table 13.09: Distribution of KT/V in relation to Gender, HD patients 1994 -2002 131 Table 13.10: Distribution of KT/V in relation to Diabetes mellitus, HD patients 1994 -2002 131 Table 13.11: Unadjusted five-year patient survival in relation to KT/V, HD patients 1997-2002 132 Table 13.12: Adjusted five-year patient survival in relation to KT/V, HD patients 1997-2002 132 Table 14.1: Stock and Flow, Paediatric RRT 1990 – 2002 (Age < 20 years) 136 Table 14.2: Paediatric Dialysis and Transplant Treatment Rates per million age-group 136

xxi
population, 1990 – 2002 Table 14.3: Age definition, incidence and prevalence of paediatric RRT compared to other
registries per million age related population (pmarp) 137
Table 14.4: Geographical Distribution of paediatric (<20 years) RRT 2002 137 Table 14.5: Gender distribution of New Dialysis and Transplant Patients 1980-2002 138 Table 14.6: Dialysis acceptance and New Transplant rate per million age group population
1990-2002 138
Table 14.7: New Dialysis by treatment modality 1990 - 2002 139 Table 14.8: New Dialysis by Sector 1990 – 2002 139 Table 14.9: Primary Renal Disease 1990– 2002 140 Table 14.10: Patient Survival by Modality of RRT, 1980-2002 140 Table 14.11: Dialysis Technique Survival by Modality 1980-2002 141 Table 14.12: Types of Transplant 1985-2002 141 Table 14.13: Transplant Allograft survival, 1980-2002 142
xxii
INDEX OF FIGURES Figure 1.01: Stock and Flow of RRT, Malaysia 1980 – 2003 10
Figure 1.01(a): New Dialysis and Transplant patients 10
Figure 1.01(b): Patients dialysing and with Functioning Transplant at 31st December 1980 – 2003 10
Figure 1.02: New Dialysis Acceptance and New Transplant Rate 1980 - 2003 11
Figure1.03(a): Dialysis and Transplant Prevalence Rate per million population 1980 - 2003 11
Figure 1.03(b): New Dialysis Treatment Rate per million population and Gross Domestic Product (USD) 1980-2003
12
Figure 1.03(c): RRT Prevalence Rate per million population and Gross Domestic Product (USD) 1980-2003
12
Figure 2.1.2(b): New Dialysis Treatment Rate per million population, Comparing 4 periods 14
Figure 2.1.2(c): Dialysis Prevalence Rate per million population, Comparing 4 periods 14
Figure 2.2.4: Average Dialysis Treatment Rate per million state population over 4 periods in Low, Mid and High provision states, 1980-2002
16
Figure 2.3.1: Dialysis Treatment by Gender 1980 – 2003 17
Figure 2.3.2: Gender Distribution of New Dialysis patients 1980 – 2003 17
Figure 2.4.1: Dialysis Treatment Rate by Age Group 1980 - 2003 18
Figure 2.4.2: Age Distribution of Dialysis patients 1980 – 2003 19
Figure 2.4.2(a): New Dialysis patients 19
Figure 2.4.2(b): Dialysing patients at 31st December 19
Figure 2.5.1: Method and Location of New Dialysis Patients 1980 - 2003 20
Figure 2.6.1: Funding for Dialysis Treatment 1980 – 2003 21
Figure 2.6.1(a): New Dialysis patients 19
Figure 2.6.1(b): Dialysing patients at 31st December 19
Figure 2.7.1: Distribution of Dialysis Patients by Sector 1980 – 2003 22
Figure 2.7.1(a): New Dialysis patients 22
Figure 2.7.1(b): Dialysing patients at 31st December 22
Figure 2.8.1: Primary Renal Disease for New Dialysis Patients 1980– 2003 23
Figure 2.9.1: Death Rates on Dialysis 1980 – 2003 24
Figure 3.2: Unadjusted ten-year patient survival by Dialysis Modality 27
Figure 3.4: Unadjusted ten-year survival of dialysis patients by age 28
Figure 3.5: Unadjusted ten-year survival of dialysis patients by diabetic status 29
Figure 3.6(a): Adjusted hazard ratio for mortality of dialysis patients by diastolic blood pressure 32
Figure 4.1: Cumulative distribution of QL Index score in relation to Year of entry, HD patients 1997-2002
37
Figure 4.2: Cumulative distribution of QL-Index score in relation to Year of entry, CAPD patients 1997-2002
37
Figure 4.3: Cumulative distribution of QL-Index score in relation to Age, All Dialysis patients 1997-2002 37
Figure 4.4: Cumulative distribution of QL-Index score in relation to Gender, All Dialysis patients 1997-2002
38
Figure 4.5: Cumulative distribution of QL-Index score in relation to Diabetes mellitus, All Dialysis patients 1997-2002
38
Figure 4.6: Cumulative distribution of QL-Index score in relation to Dialysis modality, All Dialysis patients 1997-2002
38
Figure 4.7(a): Cumulative probability of better QoL outcome in different age groups (years) of dialysis 40
xxiii
patients, entering in 1997-2002.
Figure 4.7(b): Cumulative probability of better QoL outcome in dialysis patients entering in different year. 40
Figure 4.7(c): Cumulative probability of better QoL outcome according to different albumin (g/L) levels in dialysis patients, entering in 1997-2002.
40
Figure 4.7(d): Cumulative probability of better QoL outcome according to different haemoglobin (g/dL) levels in dialysis patients, entering in 1997-2002.
40
Figure 4.7(e): Cumulative probability of better QoL outcome according to different Kt/V levels in dialysis patients, entering in 1997-2002.
40
Figure 4.17(a): Probability of returning to work according to different age groups (years) in dialysis patients, entering in 1997-2002.
44
Figure 4.17(b): Probability of returning to work according to year of entering dialysis between 1997-2002. 44
Figure 4.17(c): Probability of returning to work according to albumin levels in dialysis patients, entering in 1997-2002.
44
Figure 4.17(d): Probability of returning to work according to haemoglogin levels in dialysis patients, entering in 1997-2002.
44
Figure 4.17(e): Probability of returning to work according to Kt/V levels in dialysis patients, entering in 1997-2002.
44
Figure 5.1: Cost efficiency of HD in relation to volume 52
Figure 5.2: Cost efficiency of CAPD in relation to volume 52
Figure 6.2: Unadjusted Transplant Patient Survival related to Year of transplant 1993-2002 56
Figure 6.3: Unadjusted Transplant Graft Survival related to Year of transplant 1993-2002 56
Figure 6.7: Unadjusted Transplant Patient and Graft Survival 1993-2002 58
Figure 6.8: Unadjusted Transplant Patient Survival related to Age 1993-2002 58
Figure 6.9: Unadjusted Transplant Graft Survival related to Age 1993-2002 58
Figure 6.10: Unadjusted Transplant Patient Survival related to Ethnic 1993-2002 59
Figure 6.11: Unadjusted Transplant Graft Survival related to Ethnic 1993-2002 59
Figure 6.12: Unadjusted Transplant Graft Survival related to BMI 1993-2002 60
Figure 6.13: Unadjusted Transplant Patient Survival related to Diabetes Mellitus 1993-2002 60
Figure 6.14: Unadjusted Transplant Graft Survival related to Diabetes Mellitus 1993-2002 60
Figure 6.15: Unadjusted Transplant Patient Survival related to HbsAg status 1993-2002 61
Figure 6.16: Unadjusted Transplant Graft Survival related to HBsAg status 1993-2002 61
Figure 6.17: Unadjusted Transplant Graft Survival related to Anti-HCV status 1993-2002 61
Figure 6.18: Unadjusted Transplant Patient Survival related to Cardiovascular Disease 1993-2002 62
Figure 6.19: Unadjusted Transplant Graft Survival related to Cardiovascular Disease 1993-2002 62
Figure 6.20 Unadjusted Transplant Patient Survival related to Prior Dialysis Duration 1993-2002 62
Figure 6.21: Unadjusted Transplant Graft Survival related to Prior Dialysis Duration 1993-2002 62
Figure 6.22: Unadjusted Transplant Patient Survival related to Type of Transplant 1993-2002 63
Figure 6.23: Unadjusted Transplant Graft Survival related to Type of Transplant 1993-2002 63
Figure 6.24: Adjusted Transplant Patient Survival related to Year of Transplant 1993-2002 64
Figure 6.25: Adjusted Graft Survival related to Year of Transplant 1993-2002 65
Figure 6.28: Transplant graft survival: AZA vs MMF 1993-2002 67
Figure 6.29: Adjusted transplant graft survival: AZA vs MMF 1993-2002 67
Figure 6.30: Transplant graft survival: CsA vs FK506 1993-2002 67
Figure 6.31: Adjusted transplant graft survival: CsA vs FK506 1993-2002 67
Figure 7.1.1: Mean of haemoglobin Concentration without Erythropoietin, HD patients, 1993-2002 70
Figure 7.1.2: Mean of haemoglobin Concentration on Erythropoietin, HD patients, 1993-2002 70
Figure 7.1.3: Mean of haemoglobin Concentration without Erythropoietin, CAPD patients, 1993-2002 71
xxiv
Figure 7.1.4 Mean of haemoglobin Concentration on Erythropoietin, CAPD patients, 1993-2002 71
Figure 7.2.3 : Mean of Serum Ferritin without Erythropoietin, HD patients, 1993-2002 73
Figure 7.2.4 : Mean of Serum Ferritin on Erythropoietin, HD patients, 1993-2002 73
Figure 7.2.7: Mean of Serum Ferritin without Erythropoietin, CAPD patients, 1993-2002 75
Figure 7.2.8: Mean of Serum Ferritin on Erythropoietin, CAPD patients, 1993-2002 75
Figure 7.3.1: Patient Survival in Relation to Haemoglobin, HD patients 1997-2002 76
Figure 7.3.2: Adjusted Patient Survival in Relation to Haemoglobin, CAPD patients 1997-2002 76
Figure 7.3.3: Patient Survival in Relation to Hemoglobin, All dialysis patients 1997-2002 76
Figure 8.1.1: Distribution of Albumin (g/L), HD patients 1993-2002 78
Figure 8.1.6: Adjusted five-year patient survival in relation to Albumin, HD patients 1997-2002 80
Figure 8.1.7: Distribution of BMI, HD patients 1993-2002 81
Figure 8.1.11: Unadjusted five-year patient survival in relation to BMI, HD patients 1997-2002 82
Figure 8.1.12: Adjusted five-year patient survival in relation to BMI, HD patients 1997-2002 82
Figure 8.2.1: Distribution of Albumin (g/L), CAPD patients 1993-2002 83
Figure 8.2.6: Adjusted five-year patient survival in relation to Albumin, CAPD patients 1997-2002 84
Figure 8.2.7: Distribution of BMI, CAPD patients 1993-2002 85
Figure 8.2.11: Unadjusted five-year patient survival in relation to BMI, CAPD patients 1997-2002 86
Figure 8.2.12: Adjusted five-year patient survival in relation to BMI, CAPD patients 1997-2002 86
Figure 9.1: Distribution of Systolic Blood Pressure (mmHg), HD patients 1993-2002 90
Figure 9.5: Unadjusted five-year patient survival in relation to Systolic Blood Pressure, HD patients 1997-2002
92
Figure 9.6: Adjusted five-year patient survival in relation to Systolic Blood Pressure, HD patients 1997-2002
92
Figure 9.7: Distribution of Diastolic Blood Pressure (mmHg), HD patients 1993-2002 93
Figure 9.11: Unadjusted five-year patient survival in relation to Diastolic Blood Pressure, HD patients 1997-2002
95
Figure 9.12: Adjusted five-year patient survival in relation to Diastolic Blood Pressure, HD patients 1997-2002
95
Figure 9.13: Distribution of Systolic Blood Pressure (mmHg), CAPD patients 1993-2002 96
Figure 9.17: Unadjusted five-year patient survival in relation to Systolic Blood Pressure, CAPD patients 1997-2002
98
Figure 9.18: Adjusted five-year patient survival in relation to Systolic Blood Pressure, CAPD patients 1997-2002
98
Figure 9.19: Distribution of Diastolic Blood Pressure (mmHg), CAPD patients 1993-2002 99
Figure 9.23: Unadjusted five-year patient survival in relation to Diastolic Blood Pressure, CAPD patients 1997-2002
101
Figure 9.24: Adjusted five-year patient survival in relation to Diastolic Blood Pressure, CAPD patients 1997-2002
101
Figure 9.25: Distribution of Pulse Pressure (mmHg), HD patients 1993-2002 102
Figure 9.28: Adjusted five-year patient survival in relation to Pulse Pressure, HD patients 1997-2002 103
Figure 9.29: Distribution of Pulse Pressure (mmHg), CAPD patients 1993-2002 103
Figure 9.31: Adjusted five-year patient survival in relation to Pulse Pressure, CAPD patients 1997-2002 104
Figure 9.34: Distribution of Cholesterol (mmol/L), HD patients 1993-2002 106
Figure 9.35: Distribution of Cholesterol (mmol/L), CAPD patients 1993-2002 106
Figure 9.42: Unadjusted five-year patient survival in relation to Cholesterol, HD patients 1997-2002 108
Figure 9.43: Unadjusted five-year patient survival in relation to Cholesterol, CAPD patients 1997-2002 108
Figure 9.44: Adjusted five-year patient survival in relation to Cholesterol, HD patients 1997-2002 108
Figure 9.45: Adjusted five-year patient survival in relation to Cholesterol, CAPD patients 1997-2002 108

xxv
Figure 9.53: Unadjusted five-year patient survival in relation to Triglyceride, HD patients 1997-2002 110
Figure 9.54: Adjusted five-year patient survival in relation to Triglyceride, HD patients 1997-2002 111
Figure 9.55: Adjusted five-year patient survival in relation to Triglyceride, CAPD patients 1997-2002 111
Figure 10.1: Distribution of corrected serum Calcium, all patients 114
Figure 10.2: Distribution of serum Phosphate, all patients 114
Figure 10.3: Distribution of calcium x phosphate product, all patients 115
Figure 10.4: Distribution of serum iPTH, all patients 115
Figure 10.5: Adjusted patient survival in relation to serum Calcium, all patients1997-2002 116
Figure 10.6: Adjusted patient survival in relation to serum Phosphate, all dialysis patients 1997-2002 116
Figure 10.7: Adjusted patient survival in relation to calcium x phosphate product, all dialysis patients 1997-2002
116
Figure 10.8: Adjusted patient survival in relation to serum iPTH, all patients 1997-2002 117
Figure 11.5: Cumulative risk of sero-conversion to HBsAg positive among sero-negative patients at entry into dialysis, comparing HD and CAPD 1997-2002
121
Figure 11.7: Cumulative risk of sero-conversion to Anti-HCV positive among sero-negative patients at entry into dialysis, comparing HD and CAPD 1997-2002
121
Figure .13.11: Unadjusted five-year patient survival in relation to KT/V, HD patients 1997-2002 132
Figure .13.12: Adjusted five-year patient survival in relation to KT/V, HD patients 1997-2002 132
Figure 14.1: Prevalent cases of RRT by modality in children under 20 years old 136
Figure 14.2: Incidence and prevalence rate per million age related population < 20 years old on RRT 137
Figure 14.5: Number of New dialysis and Transplant patients by gender 1980 - 2002 138
Figure 14.6(a): Dialysis Treatment Rate by Age Group 1990-2002 138
Figure 14.6(b): Transplant Treatment Rate by Age Group 1990-2002 138
Figure 14.7: New Dialysis by treatment modality 1990 - 2002 139
Figure 14.8: New Dialysis by Sector 1990 – 2002 139
Figure 14.10: Patient Survival by Modality 140
Figure 14.11: Dialysis Technique survival by modality 141
Figure 14.13: Transplant allograft survival 1980 – 2002 142