1.1.1 objectives of the study
TRANSCRIPT


Comprehensive Wastewater Cost of Service Study - DRAFT
Draft Report / August 23, 2017
The City of Galt


24640 Jefferson Avenue Suite 207
Murrieta, CA 92562
Phone 951.698.0145 www.raftelis.com
August 23, 2017 Mr. Steven Winkler Public Works Director City of Galt 495 Industrial Drive Galt, CA 95632 Subject: Comprehensive Wastewater Cost of Service Study Report Dear Mr. Winker, Raftelis Financial Consultants, Inc. (RFC) is pleased to provide this Comprehensive Wastewater Cost of Service Study Report (Report) for the City of Galt (City). This Study includes a comprehensive review of the City’s financial plan, flow trends, accounts, customer types, capital improvement plan, debt obligations, and reserves to establish equitable rates that provide sufficient revenue over a five-year planning period. The proposed rate structures and resulting rates were derived based on the cost of service principles and are proportionate and in compliance with Proposition 218. The major objectives of the study include the following:
» Develop financial plans for the wastewater utility to ensure financial sufficiency, meet operation and maintenance (O&M) costs, meet debt obligations, and ensure sufficient funding for system improvement and capital needs
» Develop sound and sufficient reserve fund targets » Review current rate structures for the wastewater utility and determine any adjustments to the rates
to more closely reflect costs incurred and adequately recover the revenue requirements over the planning period
The Report summarizes the key findings and recommendations related to the development of the financial plan for the Wastewater utility and the development of the updated wastewater rates. It has been a pleasure working with you, and we thank you, John Griffin, Mark Clarkson, Emily Boyd, and other City Staff for the support provided during this study. Sincerely, RAFTELIS FINANCIAL CONSULTANTS, INC.
Habib Isaac Andrea Boehling Senior Manager Senior Consultant
City of Galt Draft Comprehensive Wastewater Cost of Service Study Report
TABLE OF CONTENTS
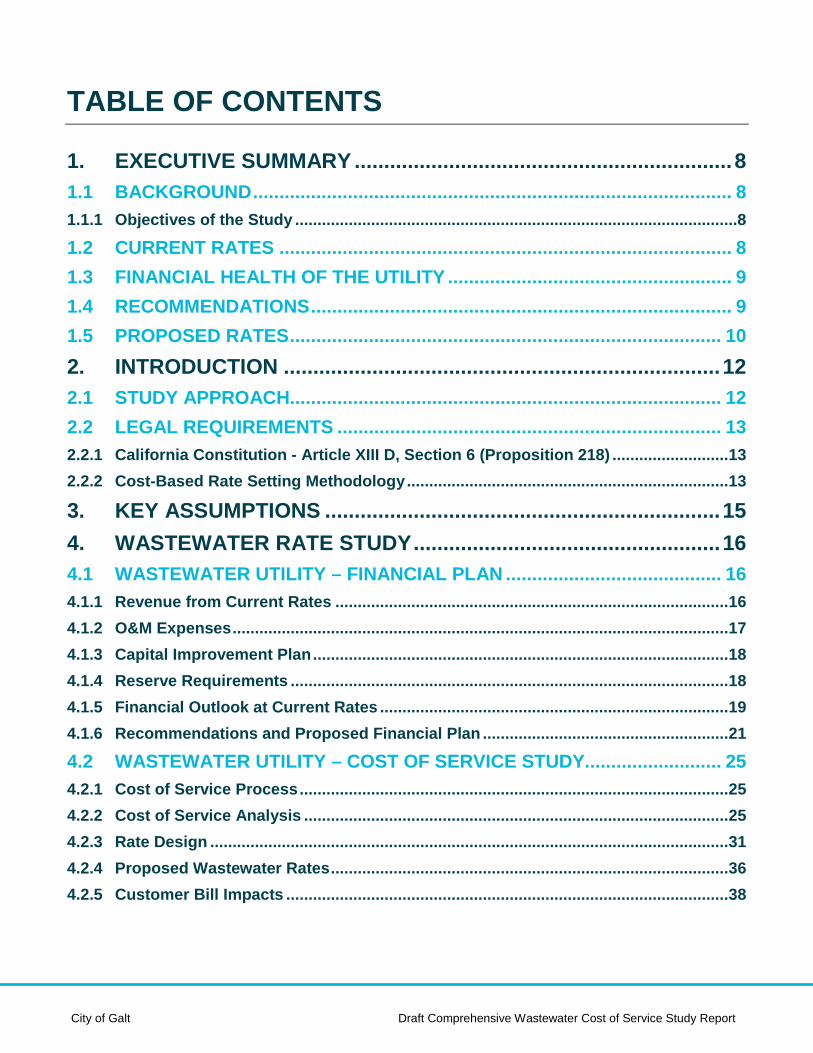
1. EXECUTIVE SUMMARY ................................................................ 8
1.1 BACKGROUND ........................................................................................... 8
1.1.1 Objectives of the Study ...................................................................................................8
1.2 CURRENT RATES ...................................................................................... 8
1.3 FINANCIAL HEALTH OF THE UTILITY ...................................................... 9
1.4 RECOMMENDATIONS ................................................................................ 9
1.5 PROPOSED RATES .................................................................................. 10
2. INTRODUCTION .......................................................................... 12
2.1 STUDY APPROACH.................................................................................. 12
2.2 LEGAL REQUIREMENTS ......................................................................... 13
2.2.1 California Constitution - Article XIII D, Section 6 (Proposition 218) .......................... 13
2.2.2 Cost-Based Rate Setting Methodology ........................................................................ 13
3. KEY ASSUMPTIONS ................................................................... 15
4. WASTEWATER RATE STUDY .................................................... 16
4.1 WASTEWATER UTILITY – FINANCIAL PLAN ......................................... 16
4.1.1 Revenue from Current Rates ........................................................................................ 16
4.1.2 O&M Expenses ............................................................................................................... 17
4.1.3 Capital Improvement Plan ............................................................................................. 18
4.1.4 Reserve Requirements .................................................................................................. 18
4.1.5 Financial Outlook at Current Rates .............................................................................. 19
4.1.6 Recommendations and Proposed Financial Plan ....................................................... 21
4.2 WASTEWATER UTILITY – COST OF SERVICE STUDY.......................... 25
4.2.1 Cost of Service Process ................................................................................................ 25
4.2.2 Cost of Service Analysis ............................................................................................... 25
4.2.3 Rate Design .................................................................................................................... 31
4.2.4 Proposed Wastewater Rates ......................................................................................... 36
4.2.5 Customer Bill Impacts ................................................................................................... 38
City of Galt Draft Comprehensive Wastewater Cost of Service Study Report
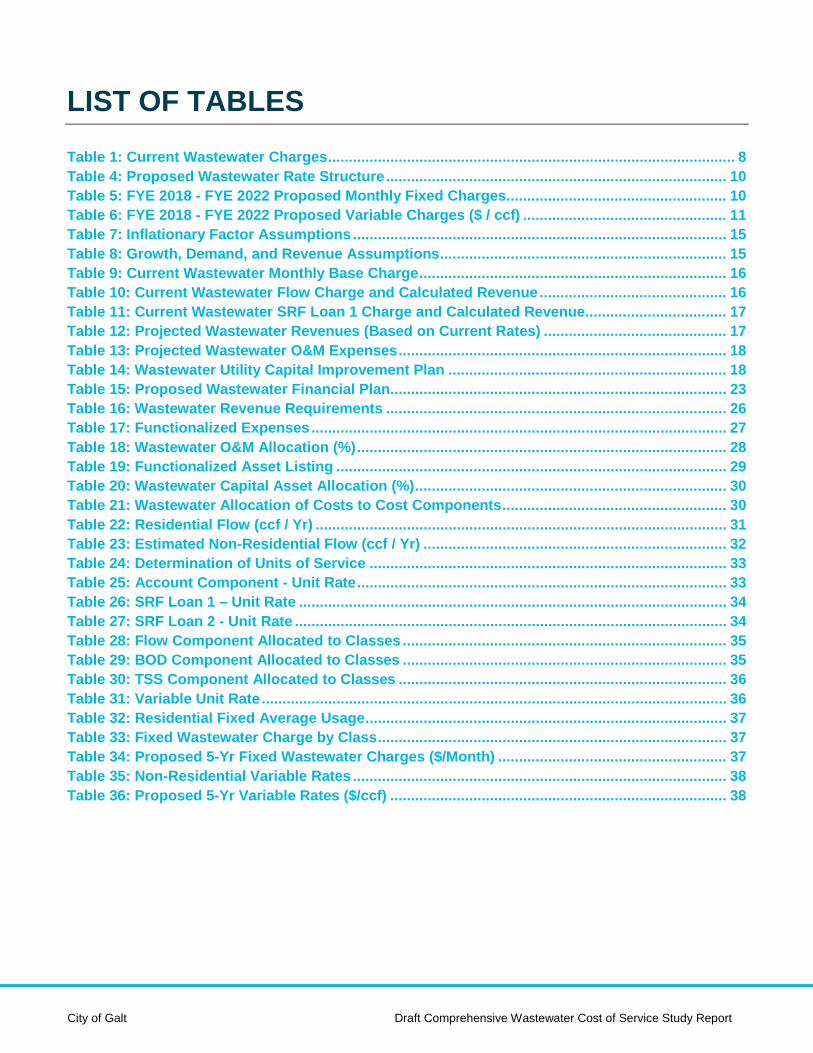
LIST OF TABLES Table 1: Current Wastewater Charges .................................................................................................. 8 Table 4: Proposed Wastewater Rate Structure .................................................................................. 10 Table 5: FYE 2018 - FYE 2022 Proposed Monthly Fixed Charges ..................................................... 10 Table 6: FYE 2018 - FYE 2022 Proposed Variable Charges ($ / ccf) ................................................. 11 Table 7: Inflationary Factor Assumptions .......................................................................................... 15 Table 8: Growth, Demand, and Revenue Assumptions ..................................................................... 15 Table 9: Current Wastewater Monthly Base Charge .......................................................................... 16 Table 10: Current Wastewater Flow Charge and Calculated Revenue ............................................. 16 Table 11: Current Wastewater SRF Loan 1 Charge and Calculated Revenue .................................. 17 Table 12: Projected Wastewater Revenues (Based on Current Rates) ............................................ 17 Table 13: Projected Wastewater O&M Expenses ............................................................................... 18 Table 14: Wastewater Utility Capital Improvement Plan ................................................................... 18 Table 15: Proposed Wastewater Financial Plan ................................................................................. 23 Table 16: Wastewater Revenue Requirements .................................................................................. 26 Table 17: Functionalized Expenses .................................................................................................... 27 Table 18: Wastewater O&M Allocation (%) ......................................................................................... 28 Table 19: Functionalized Asset Listing .............................................................................................. 29 Table 20: Wastewater Capital Asset Allocation (%) ........................................................................... 30 Table 21: Wastewater Allocation of Costs to Cost Components ...................................................... 30 Table 22: Residential Flow (ccf / Yr) ................................................................................................... 31 Table 23: Estimated Non-Residential Flow (ccf / Yr) ......................................................................... 32 Table 24: Determination of Units of Service ...................................................................................... 33 Table 25: Account Component - Unit Rate ......................................................................................... 33 Table 26: SRF Loan 1 – Unit Rate ....................................................................................................... 34 Table 27: SRF Loan 2 - Unit Rate ........................................................................................................ 34 Table 28: Flow Component Allocated to Classes .............................................................................. 35 Table 29: BOD Component Allocated to Classes .............................................................................. 35 Table 30: TSS Component Allocated to Classes ............................................................................... 36 Table 31: Variable Unit Rate ................................................................................................................ 36 Table 32: Residential Fixed Average Usage ....................................................................................... 37 Table 33: Fixed Wastewater Charge by Class .................................................................................... 37 Table 34: Proposed 5-Yr Fixed Wastewater Charges ($/Month) ....................................................... 37 Table 35: Non-Residential Variable Rates .......................................................................................... 38 Table 36: Proposed 5-Yr Variable Rates ($/ccf) ................................................................................. 38

City of Galt Draft Comprehensive Wastewater Cost of Service Study Report
LIST OF FIGURES Figure 1: Wastewater Operating Financial Position at Current Rates .............................................. 20 Figure 2: Baseline Wastewater Capital Improvement Plan and Funding Source ............................ 20 Figure 3: Projected Ending Wastewater Reserves at Current Rates ................................................ 21 Figure 4: Operating Financial Position at Proposed Rates ............................................................... 23 Figure 5: Proposed Wastewater Capital Improvement Plan and Funding Source .......................... 24 Figure 6: Projected Ending Wastewater Reserves at Projected Rates............................................. 24 Figure 7: Wastewater Cost of Service Process .................................................................................. 25 Figure 8: Residential Customer Bill Impacts (FYE 2018) .................................................................. 39 Figure 9: Residential Customer Bill Impacts (FYE 2018-FYE 2022) .................................................. 39 Figure 10: Non-Residential Bill Impacts (Low, Medium, High), 150 ccf ............................................ 40
LIST OF APPENDICES
APPENDIX A: Detailed Financial Plan

City of Galt Draft Comprehensive Wastewater Cost of Service Study Report
This page intentionally left blank to facilitate two-sided printing.

8 | City of Galt
1. EXECUTIVE SUMMARY
1.1 BACKGROUND In 2016, the City of Galt (City) engaged RFC to conduct a Comprehensive Wastewater Cost of Service Study (Study) to develop a financial plan, and design rates for the City’s Wastewater Utility over the next five years. The City collects and treats wastewater generated by approximately 7,500 accounts. Flows from these customers are conveyed and pumped to the 3.0 million gallon per day (mgd) treatment plant via 12 wastewater lift stations. Recent improvements of approximately $26.8 million was necessary to comply with more stringent effluent limitations and for expanding the solids handling process.
1.1.1 Objectives of the Study The major objectives of the study include the following:
» Develop financial plans for the wastewater utility to ensure financial sufficiency, meet operation and maintenance (O&M) costs, meet existing and new debt obligations, ensure sufficient funding for system improvement and capital needs, and maintain the financial health of the utility
» Develop sound and sufficient reserve fund targets » Review current rate structures for the wastewater utility and determine any adjustments to the rates
to more closely reflect costs incurred and adequately recover the revenue requirements over the planning period
» Identify contributions from future customers for their portion of recently completed projects.
1.2 CURRENT RATES The current wastewater rate structure consists of a monthly base charge for residential customers, a combination of a base charge and flow rate for Commercial/Industrial customers, and flow rates for Multi-Family greater than 4 units (with a water meter) and Institutional customers. Customers also pay a separate Upgrade Debt Service charge in the form of either a base/monthly fee or a commodity rate based on customer type. Table 1 summarizes the current wastewater rate structure of the City. Column B summarizes the monthly base charges, Column C summarizes the flow rates, and Column D summarizes the Upgrade Debt Service (SRF Loan 1 rates).
Table 1: Current Wastewater Charges
Customer Class [A]
FYE 2017 Base Charge
[B]
FYE 2017 Flow Rates
($ / ccf) [C]
FYE 2017 SRF Loan 1 Rate
[D] Single Family Residential $37.34 / DU N/A $11.03 / DU Multi-Family Residential $37.34 / DU N/A $11.03 / DU Commercial / Industrial $1.83 / Month $2.69 / ccf $0.80 / ccf Multi-Family > 4 w/ meter N/A $2.48 / ccf $0.74 / ccf Institutional N/A $1.88 / ccf $0.56 / ccf Contract – Metered 4” $16.09 / Month $3.20 / ccf $0.95 / ccf Contract – Metered 6” $16.73 / Month $3.20 /ccf $0.95 / ccf
Draft Comprehensive Wastewater Cost of Service Study Report | 9
1.3 FINANCIAL HEALTH OF THE UTILITY As part of the financial plan development, RFC first reviewed the City’s projected revenue requirements over a 10-year planning horizon to determine the financial health of the wastewater utility over the short-term and long-term to determine if the current rates could support the revenue needs. In Fiscal Year 2017-18 (FYE 2018), the City’s total beginning reserve balance for the wastewater utility is estimated at approximately $9.8 million. These reserves have been built up over time and were intended to help fund the necessary upcoming capital projects totaling approximately $8.3 million during the next 5 years. However, due to required improvements to the system, the City obtained an additional SRF loan (SRF Loan 2) and the corresponding debt payments are not accounted for in the existing rates. The payments on the debt obligation are anticipated to be approximately $1.6 million annually. Based on the City’s revenue requirements, recently adopted reserve policies, capital planning schedule, existing and recent new debt obligations, and current revenues, the existing wastewater rates will:
» Result in negative net operating cash income of approximately $785,000 for FYE 2018 with the deficit increasing each subsequent year
» Fully fund capital projects through PAYGO1 for FYE 2018 and FYE 2019 with deficits beginning in FYE 2020
» Be unable to meet the minimum reserve targets during the study period Without revenue adjustments, the utility will fully deplete reserves by FYE 2021, will be unable to meet debt obligations, and will no longer be able to fund capital projects.
1.4 RECOMMENDATIONS Overall, the proposed financial plan for the wastewater system aims to strike a balance between ensuring a strong financial position and, to the extent possible, minimizing rate increases to its customers through a multi-year measured approach. In addition, the City will use capacity fee revenue associated with new developments share of debt funded wastewater treatment upgrade. Developments share was based on the proportionate amount of the upgrades attributable to accommodating growth. Based on information from the City, the total amount of the upgrades associated with new growth equals $3.6M, which will be used to offset debt over a 4-year period at $900k per year. With this revenue offset, it was initially recommended that the City adjust revenue by an additional 8% in FYE 2018 above and beyond the increase needed to cover the SRF Loan 2 obligation and 6% revenue adjustments will be needed for each remaining year of the 5-Yr study period. This was presented to City Council on July 18th as part of a rate workshop session. City Council provided feedback and requested City staff to revisit its reserve policies and determine if any adjustment could be made to reduce the first year’s increase of 8% down to 6%, in-line with the remaining revenue adjustments over the five-year planning period. The City made an adjustment to its Rate Stabilization Reserve to not fund it while revenue adjustments are necessary to mitigate rate increases as much as possible. With this adjustment, the proposed revenue adjustments reduced down to 5.5% each fiscal year over the five-year planning period. The first adjustment will take place on November 1, 2017, the second adjustment will take place on March 1, 2019, and the remaining adjustments will occur each subsequent year on March 1.
1 Pay-As-You-Go or PAYGO means capital projects will be funded through cash on hand (rates or reserves) as opposed to issuing debt
10 | City of Galt
To determine the appropriate rate structure for meeting the City’s revenue requirements, RFC reviewed the current rate structure and flow data, worked closely with City staff, and where possible, incorporated feedback on policies and objectives. As such, RFC recommends the following proposed adjustments to the current structure:
» Establish a customer service charge per account, applicable to all accounts regardless of class » Establish a flat monthly charge for all Single Family Residential (SFR) and Multi-Family Residential
(MFR) customers » Establish a separate rate for the new debt obligation associated with SRF Loan 2 » Establish low, medium, and high non-residential customer classes based on the flow and strength
contributions to the City’s treatment plant
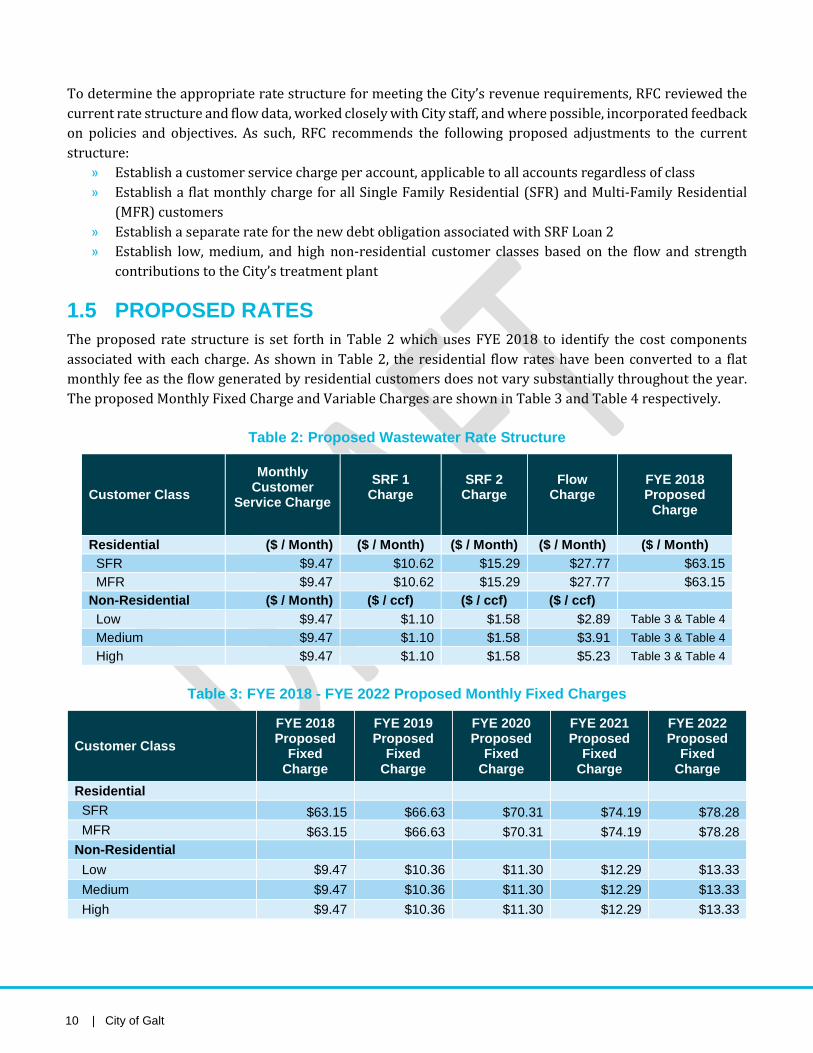
1.5 PROPOSED RATES The proposed rate structure is set forth in Table 2 which uses FYE 2018 to identify the cost components associated with each charge. As shown in Table 2, the residential flow rates have been converted to a flat monthly fee as the flow generated by residential customers does not vary substantially throughout the year. The proposed Monthly Fixed Charge and Variable Charges are shown in Table 3 and Table 4 respectively.
Table 2: Proposed Wastewater Rate Structure
Customer Class Monthly
Customer Service Charge
SRF 1 Charge
SRF 2 Charge
Flow Charge
FYE 2018 Proposed
Charge
Residential ($ / Month) ($ / Month) ($ / Month) ($ / Month) ($ / Month) SFR $9.47 $10.62 $15.29 $27.77 $63.15 MFR $9.47 $10.62 $15.29 $27.77 $63.15 Non-Residential ($ / Month) ($ / ccf) ($ / ccf) ($ / ccf) Low $9.47 $1.10 $1.58 $2.89 Table 3 & Table 4 Medium $9.47 $1.10 $1.58 $3.91 Table 3 & Table 4 High $9.47 $1.10 $1.58 $5.23 Table 3 & Table 4
Table 3: FYE 2018 - FYE 2022 Proposed Monthly Fixed Charges
Customer Class FYE 2018 Proposed
Fixed Charge
FYE 2019 Proposed
Fixed Charge
FYE 2020 Proposed
Fixed Charge
FYE 2021 Proposed
Fixed Charge
FYE 2022 Proposed
Fixed Charge
Residential SFR $63.15 $66.63 $70.31 $74.19 $78.28 MFR $63.15 $66.63 $70.31 $74.19 $78.28 Non-Residential Low $9.47 $10.36 $11.30 $12.29 $13.33 Medium $9.47 $10.36 $11.30 $12.29 $13.33 High $9.47 $10.36 $11.30 $12.29 $13.33
Draft Comprehensive Wastewater Cost of Service Study Report | 11
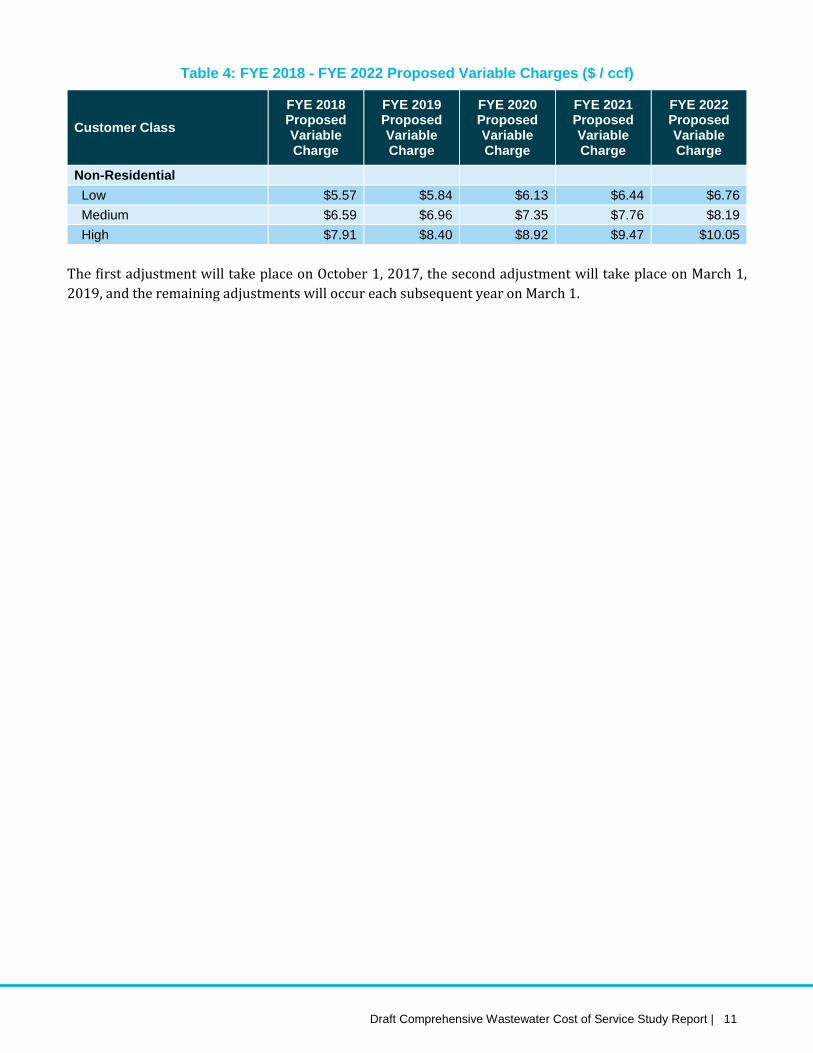
Table 4: FYE 2018 - FYE 2022 Proposed Variable Charges ($ / ccf)
Customer Class FYE 2018 Proposed Variable Charge
FYE 2019 Proposed Variable Charge
FYE 2020 Proposed Variable Charge
FYE 2021 Proposed Variable Charge
FYE 2022 Proposed Variable Charge
Non-Residential Low $5.57 $5.84 $6.13 $6.44 $6.76 Medium $6.59 $6.96 $7.35 $7.76 $8.19 High $7.91 $8.40 $8.92 $9.47 $10.05
The first adjustment will take place on October 1, 2017, the second adjustment will take place on March 1, 2019, and the remaining adjustments will occur each subsequent year on March 1.
12 | City of Galt
2. INTRODUCTION
2.1 STUDY APPROACH The total cost of wastewater service is analyzed by system function in order to equitably distribute costs of service to the various customer classes. For analysis, wastewater utility costs of service are developed consistent with the guidelines detailed in the Water Environment Federation (WEF) Manual of Practice No. 27, Financing and Charges for Wastewater Systems, 2004. The first step in ratemaking analysis is to determine the adequate and appropriate level of funding for a given utility. This is referred to as determining the “revenue requirement”. This analysis typically considers the short-term and long-term service objectives of the utility over a given planning horizon, including capital facilities, system operations and maintenance, and financial reserve policies to determine the adequacy of a utility’s existing rates to recover its costs. Several factors may affect these projections, including the number of customers served, changes in total discharge to the plant and corresponding strength concentrations, nonrecurring sales, inflation, interest rates, capital finance needs, changes in tax laws, and other changes in operating and economic conditions, among others. After determining the utility’s revenue requirement, the next step was determining the cost of service. Utilizing the City’s approved budget, financial reports, operating data, and capital improvement plans, a rate study generally categorizes (functionalizes) system costs (e.g., collection, treatment, administration, etc.), including operating and maintenance and asset costs, among major operating functions to determine the cost of service. After the asset values and operating costs are properly categorized by function, these functionalized costs are allocated first to cost causation components, and then distributed to the various customer classes (e.g., single family residential, multi-family residential, non-residential) by determining the characteristics of those classes and the contribution of each to cost causation components such as customer costs, SRF Loan 1, SRF Loan 2, total flow, biological oxygen demand (BOD), and total suspended solids (TSS). Rate design is the final element of the rate-making procedure and uses the revenue requirement and cost of service analysis to determine rates for each customer class that reflect the cost of providing service to those customers. Rates utilize “rate components” that build-up to the total variable rates, and fixed charge rates, for the various customer classes.
Draft Comprehensive Wastewater Cost of Service Study Report | 13
2.2 LEGAL REQUIREMENTS 2.2.1 California Constitution - Article XIII D, Section 6 (Proposition 218) Proposition 218, reflected in the California Constitution as Article XIII D, was enacted in 1996 to ensure that rates and fees are reasonable and proportional to the cost of providing service. The principal requirements for fairness of the fees, as they relate to public water or wastewater services are as follows:
1. Revenues derived from the charge shall not exceed the costs required to provide the property related service.
2. Revenues derived from the charge shall not be used for any purpose other than that for which the charge was imposed.
3. The amount of the charge imposed upon any parcel shall not exceed the proportional cost of service attributable to the parcel.
4. No charge may be imposed for a service unless that service is actually used or immediately available to the owner of property.
5. No charge may be imposed for general governmental services including, but not limited to, police, fire, ambulance or library services, where the service is available to the public at large in substantially the same manner as it is to property owners.
6. A public agency must hold a public hearing to consider the adoption of the proposed new or increase in an existing charge; written notice of the public hearing and proposed charge shall be mailed to the record owner of each parcel at least 45 days prior to the public hearing; if the public agency receives written protests to the proposed charge from a majority of the property owners, the charge may not be imposed.
2.2.2 Cost-Based Rate Setting Methodology The costs of wastewater rates and charges should be recovered from classes of customers in proportion to the cost of serving those customers. To develop utility rates that comply with Proposition 218 and industry standards while meeting other emerging goals and objectives of the City, there are four major steps discussed below and previously addressed in Section 2.1.
1. Calculate Revenue Requirement The rate-making process starts by determining the test year (rate setting year) revenue requirement, which for this study is FYE 2018. The revenue requirement should sufficiently fund the utility’s O&M, debt service, capital expenses, and reserves.
2. Cost of Service Analysis (COS)
The annual cost of providing service is distributed among customer classes commensurate with their service requirements. A COS analysis involves the following:
a) Functionalize costs. Examples of functions are collection, treatment, storage, general and administrative
b) Allocate functionalized costs to cost causation components. Cost causation components include, but are not limited to, customer service, SRF Loan 1, SRF Loan 2, flow, BOD, and TSS.
c) Distribute the cost causation components. Distribute cost components, using unit costs, to customer classes in proportion to their demands on the system.

14 | City of Galt
A COS analysis for wastewater considers flow as well as the typical strength concentration of flow generated by various customer types to determine the total proportionate demand placed on the City’s wastewater system. As such, total flow is used for collection facilities and flow with the inclusion of strength factors are used to apportion treatment costs to each customer class.
3. Rate Design and Calculations Rates do more than simply recover costs. Within the legal framework and industry standards, properly designed rates should support and optimize a blend of various utility objectives, such as ensuring revenue stability and equity between customer classes and accounts within each customer class. Rates may also act as a public information tool in communicating what rates are funding and to what extent, such as the incorporating the SRF loans as separate line items within each customer’s bill.
4. Rate Adoption
Rate adoption is the last step of the rate-making process to comply with Proposition 218. RFC documents the rate study results in this Study Report to serve as the City’s administrative record and a public education tool about the proposed changes, the rationale and justifications behind the changes, and their anticipated financial impacts.

Draft Comprehensive Wastewater Cost of Service Study Report | 15
3. KEY ASSUMPTIONS The Study uses the City’s proposed FYE 2018 budget as the base year and the model projects the City’s revenue requirements through FYE 2027; however, the proposed wastewater rates herein are for FYE 2018 through FYE 2022 as the City will continue to periodically review rates and take a measured approach with any potential rate adjustments. Certain cost escalation assumptions and inputs were incorporated into the Study to adequately model expected future costs of the City’s expenses. These assumptions were based on discussions with and/or direction from City staff and are presented in Table 5 and Table 6.
Table 5: Inflationary Factor Assumptions
Inflationary Factors
FYE 20182
FYE 2019
FYE 2020
FYE 2021
FYE 2022
FYE 2023
FYE 2024
FYE 2025
FYE 2026
FYE 2027
CPI 0.0% 1.9% 1.9% 1.9% 1.9% 1.9% 1.9% 1.9% 1.9% 1.9% General 5.0% 5.0% 5.0% 5.0% 5.0% 5.0% 5.0% 5.0% 5.0% 5.0% Salaries 10.0% 5.0% 5.0% 5.0% 5.0% 5.0% 5.0% 5.0% 5.0% 5.0% Benefits 12.0% 12.0% 12.0% 12.0% 12.0% 12.0% 12.0% 12.0% 12.0% 12.0% Energy 0.0% 5.0% 5.0% 5.0% 5.0% 5.0% 5.0% 5.0% 5.0% 5.0% Capital 0.0% 2.7% 2.7% 2.7% 2.7% 2.7% 2.7% 2.7% 2.7% 2.7% Non-Inflated 0.0% 0.0% 0.0% 0.0% 0.0% 0.0% 0.0% 0.0% 0.0% 0.0%
Table 6: Growth, Demand, and Revenue Assumptions
FYE 2018
FYE 2019
FYE 2020
FYE 2021
FYE 2022
FYE 2023
FYE 2024
FYE 2025
FYE 2026
FYE 2027
Account Growth3
All Customer Classes 1.0% 1.0% 1.0% 1.0% 1.0% 1.0% 1.0% 1.0% 1.0% 1.0% Demand Factor4
All Customer Classes 100% 100% 100% 100% 100% 100% 100% 100% 100% 100% Revenues Factors
Non-Operating Revenues 2.0% 2.0% 2.0% 2.0% 2.0% 2.0% 2.0% 2.0% 2.0% 2.0% Reserve Interest Rate 0% 0% 0% 0% 0% 0% 0% 0% 0% 0%
2 Through discussions with City staff, the projected wastewater expenditures for FYE 2018 were based on inflating salaries, benefits, and General Admin costs from FYE 2017 by 10%, 12%, and 5% respectively. All other costs were provided by the City. 3 For financial planning purposes, account growth was conservatively set at 1.0% which means that the City is relying on small amounts of growth to help fund ongoing operating and maintenance costs. 4 Demand factors can be used to project changes in discharge and flow patterns. For the purposes of this Study, no changes were made to flow patterns.

16 | City of Galt
4. WASTEWATER RATE STUDY
4.1 WASTEWATER UTILITY – FINANCIAL PLAN This section describes the development of the wastewater utilities financial plan, the results of which were used to determine the revenue adjustments needed to meet ongoing expenses and provide fiscal sustainability to the City. The review involves analysis of projected annual operating revenues under the current rates, O&M expenses, capital expenditures, transfers between funds, and reserve requirements.
4.1.1 Revenue from Current Rates The current wastewater rate structure consists of a monthly base charge per dwelling unit for residential customers, a combination of a base charge and flow rate for Commercial/Industrial customers, and flow rates for Multi-Family greater than 4 units (with a water meter) and Institutional customers. Customers also pay a separate Upgrade Debt Service charge in the form of either a base/monthly fee or a commodity rate. The following tables summarize the current wastewater rate structure of the City. Table 7 summarizes the projected number of dwelling units, monthly base charge, and the projected revenues. Table 8 summarizes the wastewater flows by customer class, existing flow rates, and the projected revenues. Table 9 summarizes the SRF Loan 1 charges and the resulting projected revenues.
Table 7: Current Wastewater Monthly Base Charge
Customer Class
# of Dwelling Units [A]
FYE 2017 Base Charge
($ / Month) [B]
Projected Base Revenue
[C] (A x B x 12)
Single Family Residential 6,836 $37.34 $3,062,931 Multi-Family Residential 450 $37.34 $201,842 Commercial 156 $1.83 $3,460 Industrial 8 $1.83 $177 Contract – Metered 4” 1 $16.09 $193 Contract – Metered 6” 1 $16.73 $201 Annual Wastewater Base Revenue $3,268,805
Table 8: Current Wastewater Flow Charge and Calculated Revenue
Customer Class Projected Flow [A]
FYE 2017 Flow Rates
($ / ccf) [B]
Projected Flow Revenue
[C] (A x B)
Commercial 92,142 $2.69 $247,863 Industrial 1,547 $2.69 $4,162 Multi-Family w/ water meter 184 $2.48 $456 Institutional 37,827 $1.88 $71,115 Contract – Metered 4” 8,783 $3.20 $28,120 Contract – Metered 6” 26,836 $3.20 $85,921 Annual Wastewater Flow Revenue $437,636
Draft Comprehensive Wastewater Cost of Service Study Report | 17
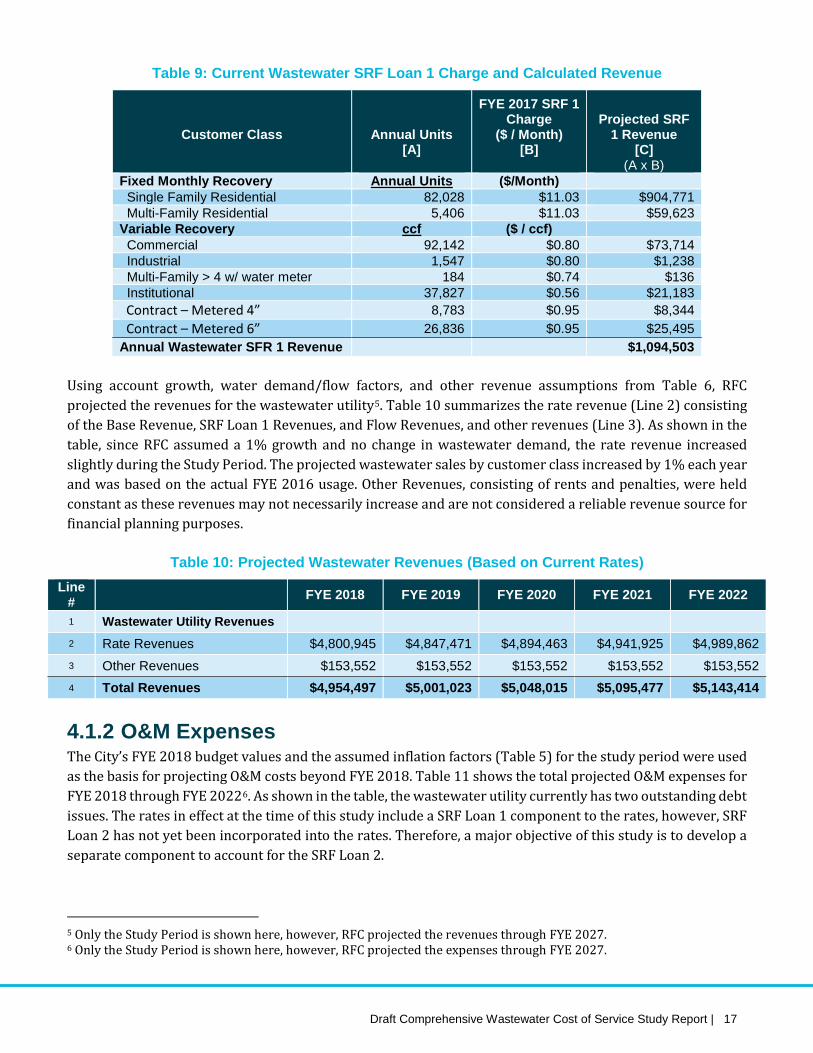
Table 9: Current Wastewater SRF Loan 1 Charge and Calculated Revenue
Customer Class
Annual Units [A]
FYE 2017 SRF 1 Charge
($ / Month) [B]
Projected SRF 1 Revenue
[C] (A x B)
Fixed Monthly Recovery Annual Units ($/Month) Single Family Residential 82,028 $11.03 $904,771 Multi-Family Residential 5,406 $11.03 $59,623 Variable Recovery ccf ($ / ccf) Commercial 92,142 $0.80 $73,714 Industrial 1,547 $0.80 $1,238 Multi-Family > 4 w/ water meter 184 $0.74 $136 Institutional 37,827 $0.56 $21,183 Contract – Metered 4” 8,783 $0.95 $8,344 Contract – Metered 6” 26,836 $0.95 $25,495 Annual Wastewater SFR 1 Revenue $1,094,503
Using account growth, water demand/flow factors, and other revenue assumptions from Table 6, RFC projected the revenues for the wastewater utility5. Table 10 summarizes the rate revenue (Line 2) consisting of the Base Revenue, SRF Loan 1 Revenues, and Flow Revenues, and other revenues (Line 3). As shown in the table, since RFC assumed a 1% growth and no change in wastewater demand, the rate revenue increased slightly during the Study Period. The projected wastewater sales by customer class increased by 1% each year and was based on the actual FYE 2016 usage. Other Revenues, consisting of rents and penalties, were held constant as these revenues may not necessarily increase and are not considered a reliable revenue source for financial planning purposes.
Table 10: Projected Wastewater Revenues (Based on Current Rates) Line
# FYE 2018 FYE 2019 FYE 2020 FYE 2021 FYE 2022
1 Wastewater Utility Revenues
2 Rate Revenues $4,800,945 $4,847,471 $4,894,463 $4,941,925 $4,989,862 3 Other Revenues $153,552 $153,552 $153,552 $153,552 $153,552 4 Total Revenues $4,954,497 $5,001,023 $5,048,015 $5,095,477 $5,143,414
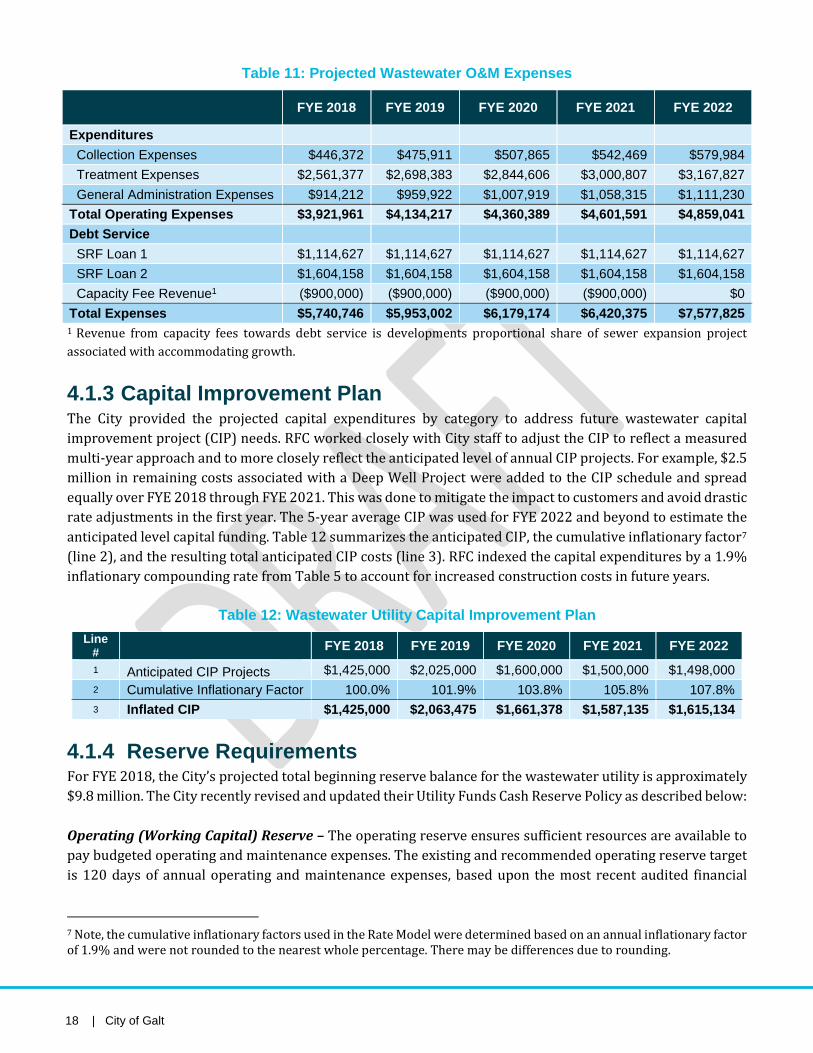
4.1.2 O&M Expenses The City’s FYE 2018 budget values and the assumed inflation factors (Table 5) for the study period were used as the basis for projecting O&M costs beyond FYE 2018. Table 11 shows the total projected O&M expenses for FYE 2018 through FYE 20226. As shown in the table, the wastewater utility currently has two outstanding debt issues. The rates in effect at the time of this study include a SRF Loan 1 component to the rates, however, SRF Loan 2 has not yet been incorporated into the rates. Therefore, a major objective of this study is to develop a separate component to account for the SRF Loan 2.
5 Only the Study Period is shown here, however, RFC projected the revenues through FYE 2027. 6 Only the Study Period is shown here, however, RFC projected the expenses through FYE 2027.
18 | City of Galt
Table 11: Projected Wastewater O&M Expenses
FYE 2018 FYE 2019 FYE 2020 FYE 2021 FYE 2022
Expenditures
Collection Expenses $446,372 $475,911 $507,865 $542,469 $579,984 Treatment Expenses $2,561,377 $2,698,383 $2,844,606 $3,000,807 $3,167,827 General Administration Expenses $914,212 $959,922 $1,007,919 $1,058,315 $1,111,230 Total Operating Expenses $3,921,961 $4,134,217 $4,360,389 $4,601,591 $4,859,041 Debt Service SRF Loan 1 $1,114,627 $1,114,627 $1,114,627 $1,114,627 $1,114,627 SRF Loan 2 $1,604,158 $1,604,158 $1,604,158 $1,604,158 $1,604,158 Capacity Fee Revenue1 ($900,000) ($900,000) ($900,000) ($900,000) $0 Total Expenses $5,740,746 $5,953,002 $6,179,174 $6,420,375 $7,577,825
1 Revenue from capacity fees towards debt service is developments proportional share of sewer expansion project associated with accommodating growth.
4.1.3 Capital Improvement Plan The City provided the projected capital expenditures by category to address future wastewater capital improvement project (CIP) needs. RFC worked closely with City staff to adjust the CIP to reflect a measured multi-year approach and to more closely reflect the anticipated level of annual CIP projects. For example, $2.5 million in remaining costs associated with a Deep Well Project were added to the CIP schedule and spread equally over FYE 2018 through FYE 2021. This was done to mitigate the impact to customers and avoid drastic rate adjustments in the first year. The 5-year average CIP was used for FYE 2022 and beyond to estimate the anticipated level capital funding. Table 12 summarizes the anticipated CIP, the cumulative inflationary factor7 (line 2), and the resulting total anticipated CIP costs (line 3). RFC indexed the capital expenditures by a 1.9% inflationary compounding rate from Table 5 to account for increased construction costs in future years.
Table 12: Wastewater Utility Capital Improvement Plan Line
# FYE 2018 FYE 2019 FYE 2020 FYE 2021 FYE 2022 1 Anticipated CIP Projects $1,425,000 $2,025,000 $1,600,000 $1,500,000 $1,498,000 2 Cumulative Inflationary Factor 100.0% 101.9% 103.8% 105.8% 107.8% 3 Inflated CIP $1,425,000 $2,063,475 $1,661,378 $1,587,135 $1,615,134
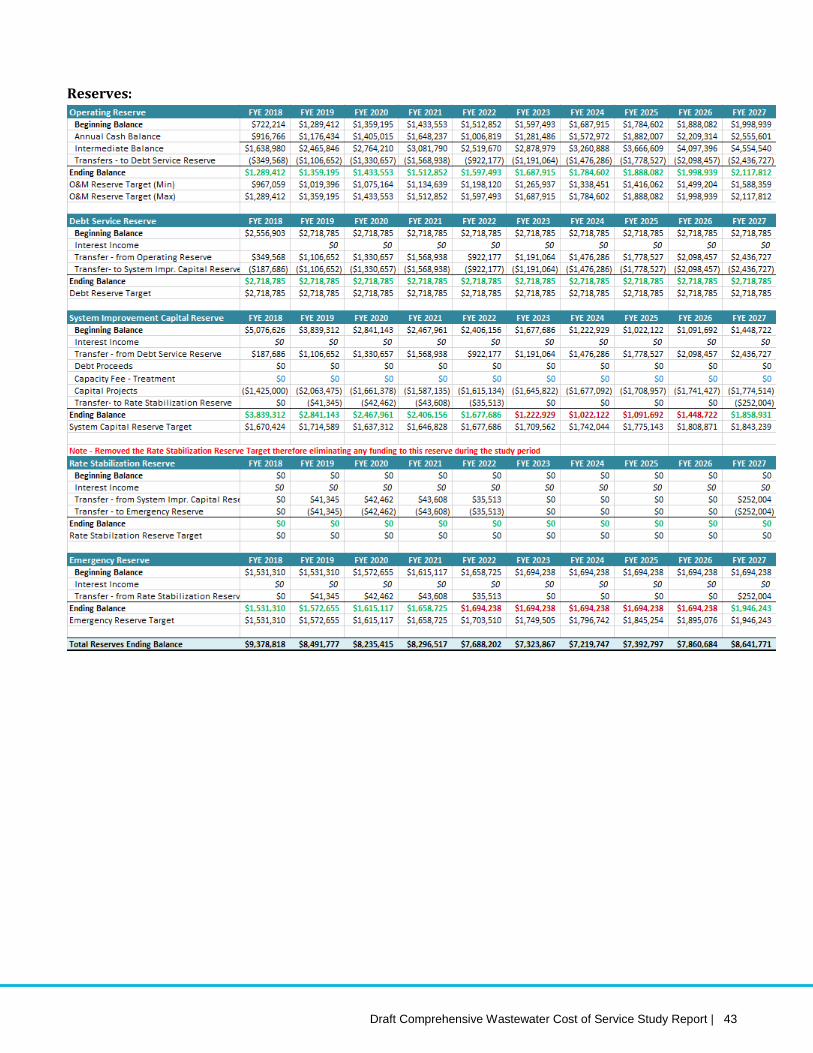
4.1.4 Reserve Requirements For FYE 2018, the City’s projected total beginning reserve balance for the wastewater utility is approximately $9.8 million. The City recently revised and updated their Utility Funds Cash Reserve Policy as described below: Operating (Working Capital) Reserve – The operating reserve ensures sufficient resources are available to pay budgeted operating and maintenance expenses. The existing and recommended operating reserve target is 120 days of annual operating and maintenance expenses, based upon the most recent audited financial
7 Note, the cumulative inflationary factors used in the Rate Model were determined based on an annual inflationary factor of 1.9% and were not rounded to the nearest whole percentage. There may be differences due to rounding.

Draft Comprehensive Wastewater Cost of Service Study Report | 19
statements. Maintaining this level of reserves also provides liquid funds for the continued ongoing operations of the utility in the event of unforeseen costs or interruption with the utility or the billing system. Debt Service – The debt service reserve ensures the City has the ability to make debt service payments in the event of a disruption in planned revenues. This reserve is set at either the anticipated debt service payment due the subsequent fiscal year or the amount of reserves required by bond covenants, whichever is greater. Systems Improvements Capital – The system improvement capital reserve provides funds to ensure continuity of planned improvement projects over the multiple fiscal years. The reserve target is one to five years of planned capital improvements, with a maximum of up to five million dollars. Rate Stabilization Reserve – The rate stabilization reserve mitigates rate shock due to temporary and transitional regulatory changes, loss of major resource, sharp demand reductions, or market volatility. The rate stabilization reserve target is set at 10% of annual operating revenues based upon the most recent audited financial statements. Emergency Capital – The emergency capital reserve is intended to provide the initial funds to accomplish emergency repairs to the system in the event of a failure or natural disaster such as a flood, earthquake, or fire. The target for this reserve is set at 2% of the value of depreciable capital assets (before depreciation), as reported on the most recent audited financial statements.
4.1.5 Financial Outlook at Current Rates Based on the City’s revenue requirements, reserve policies, capital planning schedule, and current revenues, the existing wastewater rates will:
» Result in negative net operating cash income of approximately $785,000 for FYE 2018 with the deficit increasing each subsequent year
» Fully fund capital projects through PAYGO for FYE 2018 and FYE 2019 with deficits beginning in FYE 2020
» Be unable to meet the minimum reserve targets during the study period Without establishing a new rate component for SRF Loan 2 and additional revenue adjustments, the utility will: 1) fully deplete reserves by FYE 2021, 2) be unable to meet debt obligations, and 3) no longer fully fund planned capital projects. Figure 1 illustrates the operating position of the wastewater utility, where expenses, inclusive of reserve funding, are shown by stacked bars; and the total revenues at current rates are shown by the horizontal orange trend line. Figure 2 summarizes the baseline CIP and its funding sources by fiscal year (currently 100% PAYGO). Figure 3 displays the ending total reserve balance by FY for the wastewater utility.

20 | City of Galt
Figure 1: Wastewater Operating Financial Position at Current Rates
Figure 2: Baseline Wastewater Capital Improvement Plan and Funding Source

Draft Comprehensive Wastewater Cost of Service Study Report | 21
Figure 3: Projected Ending Wastewater Reserves at Current Rates
4.1.6 Recommendations and Proposed Financial Plan Overall, the proposed financial plan for the wastewater system aims to strike a balance between ensuring a strong financial position and, to the extent possible, minimizing rate increases to its customers through a multi-year measured approach. In addition, the City will use capacity fee revenue associated with new developments share of debt funded wastewater treatment upgrade. Developments share was based on the proportionate amount of the upgrades attributable to accommodating growth. Based on information from the City, the total amount of the upgrades associated with new growth equals $3.6M, which will be used to offset debt over a 4-year period at $900k per year. With this revenue offset, it was initially recommended that the City adjust revenue by an additional 8% in FYE 2018 above and beyond the increase needed to cover the SRF Loan 2 obligation and 6% revenue adjustments will be needed for each remaining year of the 5-Yr study period. This was presented to City Council on July 18th as part of a rate workshop session. City Council provided feedback and requested City staff to revisit its reserve policies and determine if any adjustment could be made to reduce the first year’s increase of 8% down to 6%, in-line with the remaining revenue adjustments over the five-year planning period. The City made an adjustment to its Rate Stabilization Reserve to not fund it while revenue adjustments are necessary to mitigate rate increases as much as possible. With this adjustment, the proposed revenue adjustments reduced down to 5.5% each fiscal year over the five-year planning period. The first adjustment will take place on November 1, 2017, the second adjustment will take place on March 1, 2019, and the remaining adjustments will occur each subsequent year on March 1.

22 | City of Galt
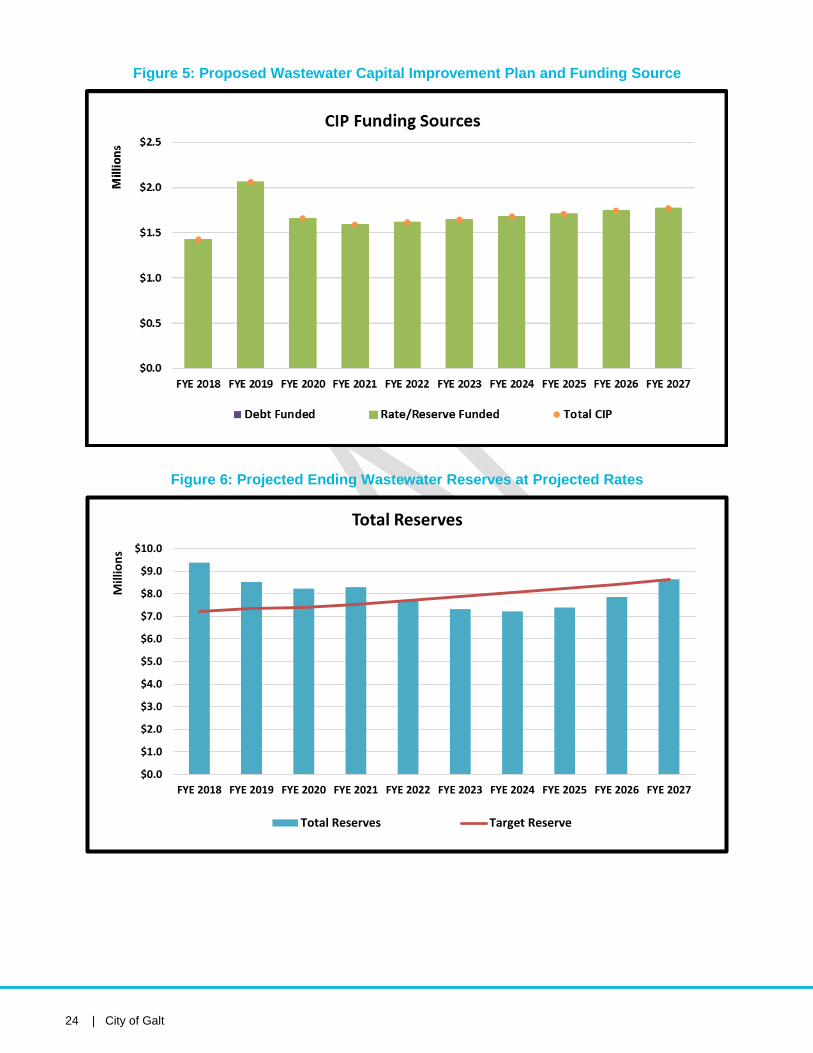
4.1.6.1 CIP Adjustments As discussed in Section 4.1.3, RFC worked closely with City Staff to adjust the CIP to reflect a measured multi-year approach and to more closely reflect the anticipated level of CIP funding. Table 12 summarizes the CIP which has been inflated using the inflationary factor from Table 5 to account for the decreased purchasing power of the dollar. No other adjustments were made to the projected CIP for the proposed financial plan. 4.1.6.2 Recommended Reserves RFC recommends establishing the reserves as outlined in the “Utility Funds Cash Reserve Policy” and discussed above in Section 4.1.4. However, the proposed financial plan does not meet the reserve targets in each year of the study period and based on direction from City staff to mitigate rate increases, the Rate Stabilization is not funded during the planning period. Although reserves dip below the reserve target between FYE 2022 through FYE 2026, it is primarily due to the loss of capacity fee revenue to offset debt payments. However, rate revenues slowly recover through the proposed annual revenue adjustments which allow the City to slowly build back up reserves over the minimum target by FYE 2027. 4.1.6.3 Proposed Financial Plan Under the proposed plan, the City will maintain a positive net income and will maintain a strong financial position. Table 13 summarizes the proposed financial plan (see Appendix A for a detailed financial plan)8. Figure 4 illustrates the operating position of the wastewater utility, where expenses, inclusive of reserve funding, are shown by stacked bars; and total revenues at both current rates and proposed rates are shown by the horizontal trend lines. Figure 5 summarizes the revised projected CIP and its funding sources (100% PAYGO). Figure 6 displays the ending total reserve balance for the wastewater utility, inclusive of operating and capital funds. The horizontal trend lines indicate the target reserve balance and the bars indicate ending reserve balance. No new debt is proposed to be issued as part of the proposed 5-year financial plan.
8 May be slight differences due to rounding.

Draft Comprehensive Wastewater Cost of Service Study Report | 23
Table 13: Proposed Wastewater Financial Plan Line
# FYE 2018 FYE 2019 FYE 2020 FYE 2021 FYE 2022
1 Revenues
2 Rate Revenues $6,503,960 $6,975,884 $7,430,637 $7,915,060 $8,431,092 3 Other Revenues $153,552 $153,552 $153,552 $153,552 $153,552 4 Total Revenues $6,657,512 $7,129,436 $7,584,189 $8,068,612 $8,584,644 5
6 Less: Expenditures 7 Total Operating Expenditures $3,921,961 $4,134,217 $4,360,389 $4,601,591 $4,859,041 8 Total Debt Service $1,818,785 $1,818,785 $1,818,785 $1,818,785 $2,718,785 9 Total Expenditures $5,740,746 $5,953,002 $6,179,174 $6,420,375 $7,577,825 10 11 Net Cashflow (line 4 – line 9) $916,766 $1,176,434 $1,405,015 $1,648,237 $1,006,819 12 13 Beginning Reserve Balance $9,887,052 $9,378,818 $8,491,777 $8,235,415 $8,296,517 14 Net Cashflow (line 11) $916,766 $1,176,434 $1,405,015 $1,648,237 $1,006,819 15 CIP Expenditures (Table 12) ($1,425,000) ($2,063,475) ($1,661,378) ($1,587,135) ($1,615,134) 16 Ending Reserve Balance $9,378,818 $8,491,777 $8,235,415 $8,296,517 $7,688,202
Figure 4: Operating Financial Position at Proposed Rates
24 | City of Galt
Figure 5: Proposed Wastewater Capital Improvement Plan and Funding Source
Figure 6: Projected Ending Wastewater Reserves at Projected Rates
$0.0
$1.0
$2.0
$3.0
$4.0
$5.0
$6.0
$7.0
$8.0
$9.0
$10.0
FYE 2018 FYE 2019 FYE 2020 FYE 2021 FYE 2022 FYE 2023 FYE 2024 FYE 2025 FYE 2026 FYE 2027
Mill
ions
Total Reserves
Total Reserves Target Reserve

Draft Comprehensive Wastewater Cost of Service Study Report | 25
4.2 WASTEWATER UTILITY – COST OF SERVICE STUDY 4.2.1 Cost of Service Process This section of the Report discusses the allocation of O&M expenses to the appropriate parameters consistent with industry standards, the determination of unit costs, and calculation of costs by customer class for the Wastewater Utility. The total cost of wastewater service is analyzed by system function in order to equitably distribute costs of service to the various classes of customers. For this analysis, wastewater utility costs of service are developed consistent with the guidelines for allocating costs detailed in the Water Environment Federation (WEF) Manual of Practice No. 27, Financing and Charges for Wastewater Systems, 2004. Figure 7 provides a general overview of a cost-of-service analysis. Each step shown below will be described in greater detail in the next section.
Figure 7: Wastewater Cost of Service Process
4.2.2 Cost of Service Analysis 4.2.2.1 Step 1 – Determine Revenue Requirements In this Study, wastewater rates are calculated for the Test Year (FYE 2018), by using the City’s projected FYE 2018 expenditures and by inflating the FYE 2017 budgeted salaries, benefits, and general administrative costs by 10%, 12% and 5%, respectively. Test Year revenue requirements are used in the cost allocation process. Subsequent year’s revenue adjustments are incremental and the rates for the future years are based on 5.5% revenue adjustments, which doesn’t necessarily correlate to an equivalent 5.5% rate increase. Due to the uncertainty regard the timing and amount of future years’ capital projects, it is recommended that the City reevaluate the actual revenue adjustments required in FYE 2023 and beyond9. The revenue requirement determination is based upon the premise that utility should generate annual revenues to meet O&M expenses, any debt service needs, reserve levels, and capital investments. Deductions are made to account for revenue offsets, required net cashflows (found in Table 13 – Line 11), and any mid-year adjustments. FYE 2018 cost of service to be recovered from the City’s wastewater customers is shown in Table 14.
9 The Financial Plan assumes 5.5% revenues adjustments in the out years (FYE 2023-2027), however, the proposed rates are only for FYE 2018-FYE 2022.
Step 1 Determine Revenue
Requirements
Step 2 Functionalize O&M
Expenses
Step 3Allocate Functionalized
Costs to Cost Components
Step 4Distribute Cost Components to
Customer Classes

26 | City of Galt
Table 14: Wastewater Revenue Requirements
Line # FYE 2018 1 Specific Operating Capital Total 2 Revenue Requirements
3 Operating Expenses $3,921,961 $3,921,961 4 SRF Loan 1 $1,114,627 $1,114,627 5 SRF Loan 2 $1,604,158 $1,604,158 6 Proposed Debt $0 $0 7 Total Revenue Requirements $2,718,785 $3,921,961 $0 $6,640,746 8 9 Less: Revenue Offsets
10 Capacity Fee Revenue $900,000 $900,000 11 Rents - Misc $29,068 $29,068 12 Rents – Rifle Range $5,000 $5,000 13 Utility Penalties $60,494 $60,494 14 Operating Interest Income $58,990 $58,990 15 Contract Customers10 $114,434 $114,434 16 Total Revenue Offsets $0 $267,986 $900,000 $1,167,986 17 18 Less: Adjustments
19 Adjustments for Cash Balance ($916,766) ($916,766) 20 Adjustments for Mid-Year Increase ($85,887) ($85,887) 21 Total Adjustments $0 $0 ($1,002,652) ($1,002,652) 22
23 Revenue Req. from Rates $2,718,785 $3,653,975 $102,652 $6,475,412 4.2.2.2 Step 2 – Functionalize O&M Costs A cost of service analysis distributes a utility’s revenue requirements (costs) to each customer class. After determining a utility’s revenue requirement, the total cost of wastewater service is analyzed by system functions to proportionately distribute costs in relation to how that cost is generally incurred. The wastewater utility costs were categorized into the following functions:
» Operations & Maintenance (O&M) Expenses o Collection
Personnel Services – Salaries and benefits related to the collection system. Maintenance & Operations – Expenses associated with the maintenance and
continued operations of the wastewater conveyance system. Capital Outlay – Small equipment / capital used for the collection system and not
included in the major capital improvement plan. o Treatment
Personnel Services – Salaries and benefits related to the treatment of wastewater. Maintenance & Operations – Expenses related to treating wastewater flow at the
treatment plant, including supplies, utility costs, contract services, etc. 10 For revenue projections, revenue from Contract Customers was assumed to remain constant and all anticipated revenues (Base and commodity) from these customers was used as an offset to the Operating requirements.

Draft Comprehensive Wastewater Cost of Service Study Report | 27
Capital Outlay – Small equipment / capital used for the treatment system and not included in the major capital improvement plan.
» General Administration – City’s overhead costs/abatement costs, typically administrative in nature. » SFR Loan 1 – Annual debt service payments for SRF Loan 1. These costs were incurred to meet new
regulatory requirements. » SRF Loan 2 – Annual debt service payments for SRF Loan 2. These costs were incurred to meet new
regulatory requirements. Table 15 summarizes the functionalized costs prior to any offset adjustments (i.e. lines 2-7 from Table 14).
Table 15: Functionalized Expenses
Functionalized Expenses FYE 2018
Functionalized Expenses
SRF Loan 1 $1,114,627 SRF Loan 2 $1,604,158 Collection Personnel Services $356,127 Maintenance & Operations $76,645 Capital Outlay $13,600 Treatment Personnel Services $1,125,380 Maintenance & Operations $1,341,897 Capital Outlay $94,100 General Administration $914,212 Total O&M Expenses $6,640,746
4.2.2.3 Step 3 – Allocate Functionalized Costs to Cost Components The wastewater utility is comprised of various facilities, each designed and operated to fulfill a given function. In order to provide adequate service to its customers at all times, the utility must be capable of collecting and conveying the total amount of wastewater generated. The separation of costs by function allows allocation of such costs to the functional cost components. The City’s costs were allocated to the following cost causation components:
1. Customer Service includes customer related costs such as billing, collecting, customer accounting, and customer call center. These costs are incurred at the same level regardless of the type of land use, amount of flow, or the wastewater strength.
2. SFR 1 represents the annual debt service costs related to SRF Loan 1. 3. SRF 2 represents the annual debt service costs related to SRF Loan 2. 4. Flow (ccf) is the amount of wastewater estimated to enter the collection system. 5. BOD (mg/L), or biochemical oxygen demand, is the amount of oxygen required to break down the
organic material present in the wastewater. Higher strength wastewater requires higher amounts of oxygen and therefore are more expensive to treat due to aeration needs.

28 | City of Galt
6. TSS (mg/L), or total suspended solids, is the measure of the suspended solids in wastewater. Higher suspended solids are also more expensive to treat. Like BOD, TSS is also a measure of wastewater strength.
As an example, treatment costs are allocated to flow, BOD, and TSS since the costs to treat wastewater is dependent on these cost causation components. Table 16 summarizes the percent allocations for the City’s O&M Expenses, the costs (prior to offsets and adjustments) allocated to the cost components, and the resulting O&M Allocation (%). The O&M Allocation (%) will be used to allocate the Operating Requirement, including any revenue offsets or adjustments, from the revenue requirement (Table 14).
Table 16: Wastewater O&M Allocation (%) Cost Components
Functionalized Expenses
Customer Service Flow BOD TSS Total
% Allocation Collection Personnel Services 0.0% 100.0% 0.0% 0.0% 100.0% Maint. & Operations 0.0% 100.0% 0.0% 0.0% 100.0% Capital Outlay 0.0% 100.0% 0.0% 0.0% 100.0% Treatment Personnel Services 0.0% 50.0% 25.0% 25.0% 100.0% Maint. & Operations 0.0% 50.0% 25.0% 25.0% 100.0% Capital Outlay 0.0% 50.0% 25.0% 25.0% 100.0% General Administration 100.0% 0.0% 0.0% 0.0% 100.0% $ Allocation Collection Personnel Services $0 $356,127 $0 $0 $356,127 Maint. & Operations $0 $76,645 $0 $0 $76,645 Capital Outlay $0 $13,600 $0 $0 $13,600 Treatment Personnel Services $0 $562,690 $281,345 $281,345 $1,125,380 Maint. & Operations $0 $670,949 $335,474 $335,474 $1,341,897 Capital Outlay $0 $47,050 $23,525 $23,525 $94,100 General Administration $914,212 $0 $0 $0 $914,212 Total O&M Expenses $914,212 $1,727,061 $640,344 $640,344 $3,921,961 O&M Allocation (%)11 23.3% 44.0% 16.3% 16.3% 100%
11 Difference due to rounding. The model uses exact numbers and does not round.
Draft Comprehensive Wastewater Cost of Service Study Report | 29
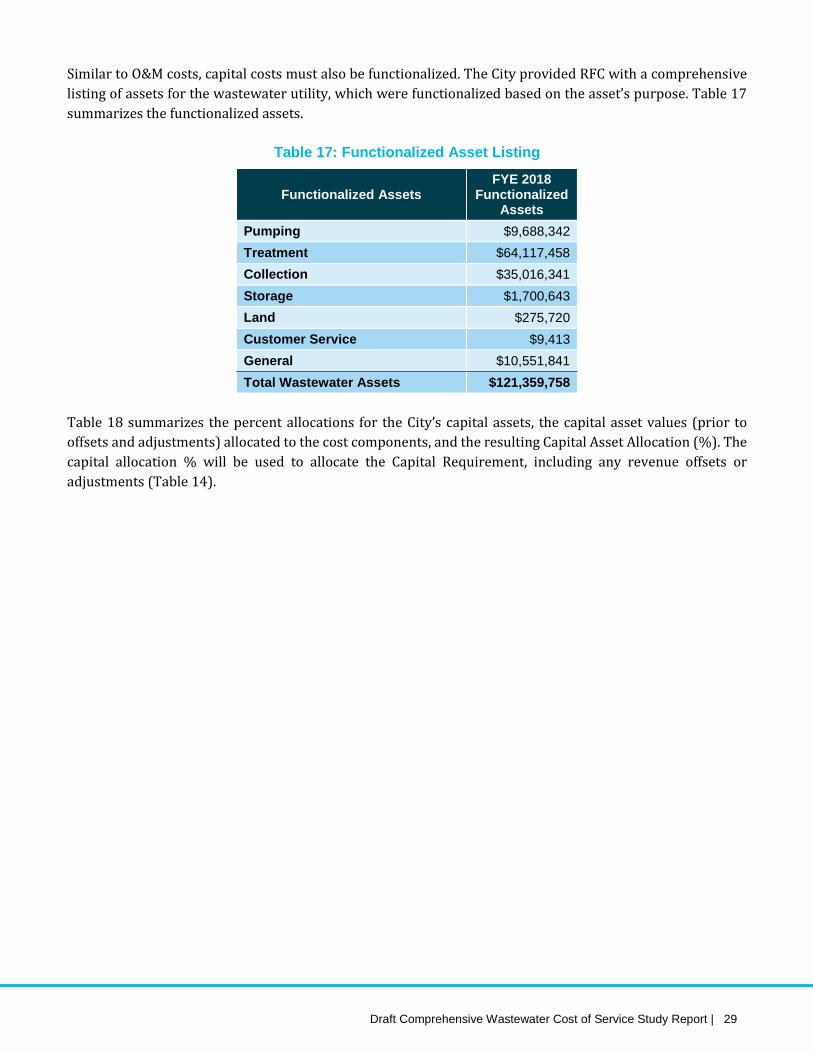
Similar to O&M costs, capital costs must also be functionalized. The City provided RFC with a comprehensive listing of assets for the wastewater utility, which were functionalized based on the asset’s purpose. Table 17 summarizes the functionalized assets.
Table 17: Functionalized Asset Listing
Functionalized Assets FYE 2018
Functionalized Assets
Pumping $9,688,342 Treatment $64,117,458 Collection $35,016,341 Storage $1,700,643 Land $275,720 Customer Service $9,413 General $10,551,841 Total Wastewater Assets $121,359,758
Table 18 summarizes the percent allocations for the City’s capital assets, the capital asset values (prior to offsets and adjustments) allocated to the cost components, and the resulting Capital Asset Allocation (%). The capital allocation % will be used to allocate the Capital Requirement, including any revenue offsets or adjustments (Table 14).

30 | City of Galt
Table 18: Wastewater Capital Asset Allocation (%) Cost Components
Functionalized Assets Customer Service Flow BOD TSS Total
% Allocation Pumping 0.0% 100.0% 0.0% 0.0% 100.0% Treatment 0.0% 50.0% 25.0% 25.0% 100.0% Collection 0.0% 100.0% 0.0% 0.0% 100.0% Storage 0.0% 50.0% 25.0% 25.0% 100.0% Land 0.0% 100.0% 0.0% 0.0% 100.0% Customer Service 0.0% 100.0% 0.0% 0.0% 100.0% General 0.0% 100.0% 0.0% 0.0% 100.0% $ Allocation Pumping $0 $9,688,342 $0 $0 $9,688,342 Treatment $0 $32,058,729 $16,029,365 $16,029,365 $64,117,458 Collection $0 $35,016,341 $0 $0 $35,016,341 Storage $0 $850,321 $425,161 $425,161 $1,700,643 Land $0 $275,720 $0 $0 $275,720 Customer Service $0 $9,413 $0 $0 $9,413 General $0 $10,551,841 $0 $0 $10,551,841 Total Assets $0 $88,450,708 $16,454,525 $16,454,525 $121,359,758 Asset Allocation (%) 0% 72.9% 13.6% 13.6% 100%
Table 19 shows the revenue requirements from Table 14 allocated to each of the cost causation components. SRF Loan 1 and SRF Loan 2 costs were allocated directly to their respective components and will be allocated to all customers. These costs were not impacted by offsets or other adjustments and therefore reflect only the costs related to the debt service payments. Operating revenue requirements were allocated based on the O&M Allocation (%) from Table 16 and Capital revenue requirements were allocated based on the Capital Asset Allocation (%) from Table 18.
Table 19: Wastewater Allocation of Costs to Cost Components
Customer Service SRF 1 SRF 2 Flow BOD TSS Total
O&M Expenses $851,744 $0 $0 $1,609,051 $596,590 $596,590 $3,653,975 Existing Loans $0 $1,114,627 $1,604,158 $0 $0 $0 $2,718,785 Capital Expenses $0 $0 $0 $74,816 $13,918 $13,918 $102,652 Cost of Service Req. $851,744 $1,114,627 $1,604,158 $1,683,868 $610,508 $610,508 $6,475,412
Before we can allocate the cost of service requirements from Table 19 to customer classes, we first must define the rate structure. Therefore, Step 4 will be discussed in Section 4.2.3.2.

Draft Comprehensive Wastewater Cost of Service Study Report | 31
4.2.3 Rate Design A key component of the Study includes evaluating the current rate structure and determining the most appropriate structures to model moving forward. To determine the appropriate rate structure for meeting the City’s revenue requirements, RFC reviewed the current rate structure and flow data, worked closely with City staff, and where possible, incorporated feedback on policies and objectives. As such, RFC recommends the following proposed adjustments to the current structure:
» Establish a customer service charge per account, applicable to all accounts regardless of class » Establish a flat monthly charge for all Single Family Residential (SFR) and Multi-Family Residential
(MFR) customers » Establish low, medium, and high non-residential customer classes based on the flow and strength
contributions to the City’s treatment plant Based on direction received from City Staff, the SRF Loan 1 and SRF Loan 2 revenue requirements will be recovered as a fixed component for residential customers and as a variable component for non-residential customers.
4.2.3.1 Flow by Customer Class Table 20 shows the derivation of the projected residential flow. Using the number of residential units (column A) as provided by the City, assumed gallons per capita per day (column B), and the assumed persons per household (column C), RFC projected the residential flow (ccf per year).
Table 20: Residential Flow (ccf / Yr)
# of Units [A]
GPCD [B]
PPH [C]
Projected Flow [D]
((A x B x C x 365) ÷ 748.05) Single-Family 6,836 65 3.3 715,437
Multiple-Family 450 65 3.3 47,146 Total Projected Residential Flow (ccf/Yr) 762,583
Non-residential customer flows were estimated based on water usage adjusted by a return-to-system factor of 90%. RFC recommends consolidating the non-residential customer classes and creating three general categories based on strength loading factors (low, medium, and high). As new development comes online, this allow the City to evaluate the demand placed by the new customer/development on the system and treatment plant and classify the account accordingly. Table 21 summarizes the projected flow for non-residential customers.

32 | City of Galt
Table 21: Estimated Non-Residential Flow (ccf / Yr)
Non-Residential Customers
Water Use
(ccf) [A]
Return-to-System Factor
[B]
Total Projected Non-Residential
Flow (ccf) [C]
(A x B) Non-Residential Low 79,066 0.90 71,159 Medium 14,433 0.90 12,989 High 36,931 0.90 33,238 Total Non-Res. Flows 130,429 117,387
4.2.3.2 Step 4- Distribute Cost Components to Customer Classes To allocate costs to different customer classes, unit costs of service need to be developed for each cost causation component. The unit costs of service are developed by dividing the total annual costs allocated to each parameter by the total annual service units of the respective component. Table 22 summarizes the derivation of each of the annual units of service. The numbers shown in Table 22 are derived as follows:
» Number of Accounts – Residential units were provided by the City and the Non-Residential was based on the accounts within the consumption database.
» Annual Accounts - # of Accounts times the number of billing periods (12). » Loading Factors - RFC utilized the strength and loading factors from the Revenue Program Report
published by the Sanitation Districts of Los Angeles County (LACSD). This report used the information from the State Water Resource Control Board (SWRCB) and LACSD updated the strength concentrations associated with BOD and TSS by testing various customers within their service area. Similar to how it is industry practice to utilize information from the SWRCB which is not specific to geographical location but is a function of specific type of use, the LACSD 2007 update reflects a substantial dataset of most up-to-date trends by use type.
o BOD (mg/L) - Through discussions with City Staff, the Sanitation Districts of Los Angeles County ‘s “Revenue Program Report” was used to determine the BOD by customer class.
o TSS (mg/L) - Through discussions with City Staff, the Sanitation Districts of Los Angeles County ‘s “Revenue Program Report” was used to determine the TSS by customer class.
» Flow (ccf / Yr) – Residential Flow was derived in Table 20 and Non-Residential Flow was derived in Table 21.
» Flow (MG / Yr) – There are approximately 748.05 gallons in 1 ccf. The flow was converted into MG/Yr by taking the Flow (ccf / Yr) times 748.05 and then dividing my 1,000,000.
» BOD (lbs/Yr) – Flow was weighted by BOD and converted to lbs / YR. (BOD (mg/L) x Flow (MG /Yr) x the conversion factor of 8.3454).
» TSS (lbs/Yr) – Flow was weighted by TSS and converted to lbs / YR. (TSS (mg/L) x Flow (MG /Yr) x the conversion factor of 8.3454).

Draft Comprehensive Wastewater Cost of Service Study Report | 33
Table 22: Determination of Units of Service
Customer Class # of
Accounts Annual
Accounts BOD
(mg/L) TSS
(mg/L) Flow
(ccf / YR) Flow
(MG / Yr) BOD
(lbs / Yr) TSS
(lbs / Yr) [A]
[B]
(A x 12) [C]
[D]
[E]
[F]
[G]
[H]
Residential
SFR 6,836 82,028 205 225 715,437 715.44 1,223,975 1,343,387 MFR 450 5,406 205 225 47,146 47.15 80,658 88,527 Non-Residential 216 2,593 Low 309 276 71,159 53.23 137,268 122,608 Medium 662 432 12,989 9.72 53,681 35,031 High 959 799 33,238 24.86 198,989 165,790
Total 7,502 90,027 879,969 850 1,694,571 1,755,342 The units of service for each cost component is discussed separately below. Each unit rate has been rounded up to the nearest whole penny. Customer Service Component These costs are incurred at the same level regardless of the type of land use, amount of flow, or the wastewater strength, therefore, the Customer Service Component is based on the number of accounts/bills. The total Customer Service Requirement from Table 19 of $851,744 is divided by the number of annual accounts to determine the unit cost of service shown in Table 23.
Table 23: Account Component - Unit Rate
Account Component Customer Service Revenue Requirements $851,744 ÷ # of Annual Accounts (Table 22) 90,027 Monthly Unit Rate $9.47
SRF Loan 1 Component These costs were incurred to improve the system and meet regulatory requirements, therefore, the requirements are spread to customer classes based on demand placed on the system (or flow) as shown in Table 24. The total revenue requirement of $1,114,627 from Table 19 was spread over projected flow (inclusive of contract customer flows of 35,619 ccf) to equitably apportion the obligation between customer classes and then by the units of service identified for each customer class to ensure further apportionment of the obligation is fairly apportioned between accounts within each customer category.

34 | City of Galt
Table 24: SRF Loan 1 – Unit Rate
Customer Class Projected Flow
(ccf) [A]
% Allocation
[B]
Allocated Requirement
[C]
Units of Service
[D]
Unit Rate [E]
(C ÷ D) Residential 762,583 83% $928,359 87,434 bills $10.62 Non-Residential 117,387 13% $142,905 117,387 ccf $1.10 Contract Customers 35,619 4% $43,362 Contract N/A
915,589 100% $1,114,627 The demand from Residential customers typically does not vary significantly from month-to-month or between customers, therefore, the revenue requirements of $928,359 was converted to a fixed monthly unit rate of $10.62 by dividing the allocated requirement by the number of bills ($928,359 ÷ 87,434). The SRF Loan 1 requirement will continue to be recovered over the variable component for Non-Residential customers. The unit rate of $1.10 per ccf was determined by dividing the allocated revenue requirement of $142,905 by the total Non-Residential water usage of 117,387 ccf as the City will charge every unit of water when billing non-residential customers; however, the total obligation to non-residential was based on expected return flow at 90% of water usage. (from Table 21 – Column A). Through discussion with City Staff, the City will also revise the contract customer rates following the Rate Study, therefore, these customers were allocated their proportionate share of the SRF Loan 1 and SRF Loan 2 requirements based on flow. SRF Loan 2 Component These costs were also incurred to improve the system and meet regulatory requirements and were allocated in the same manner as the SRF Loan 1 requirements. Table 25 shows the revenue requirements of $1,604,158 allocated to each customer class and the resulting unit rate.
Table 25: SRF Loan 2 - Unit Rate
Customer Class Projected Flow
(ccf) [A]
% Allocation
[B]
Allocated Requirement
[C]
Units of Service
[D]
Unit Rate [E]
(C ÷ D) Residential 762,583 83% $1,336,084 87,434 bills $15.29 Non-Residential 117,387 13% $205,667 117,387 ccf $1.58 Contract Customers 35,619 4% $62,407 Contract N/A
915,589 100.0% $1,604,158 Flow Component RFC allocated the Flow Requirement of $1,683,868 from Table 19 to each customer class based on their proportionate share of the projected flow as shown in Table 26.
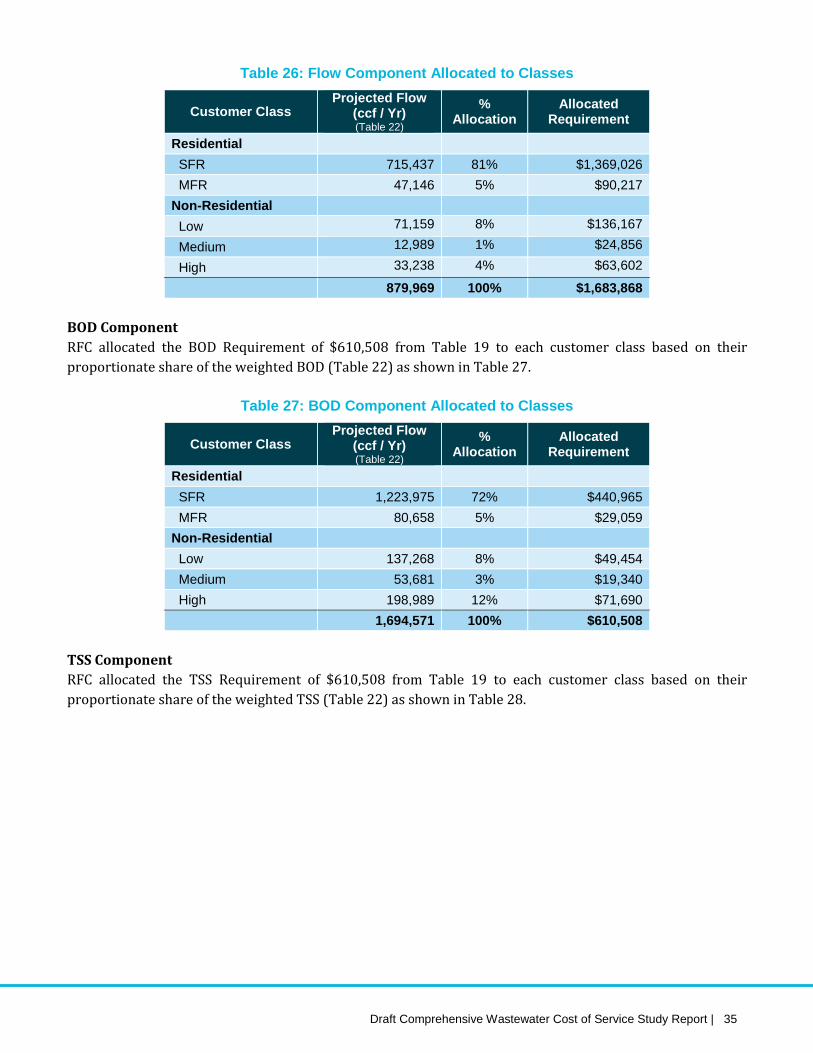
Draft Comprehensive Wastewater Cost of Service Study Report | 35
Table 26: Flow Component Allocated to Classes
Customer Class Projected Flow
(ccf / Yr) (Table 22)
% Allocation
Allocated Requirement
Residential SFR 715,437 81% $1,369,026 MFR 47,146 5% $90,217 Non-Residential
Low 71,159 8% $136,167
Medium 12,989 1% $24,856
High 33,238 4% $63,602
879,969 100% $1,683,868 BOD Component RFC allocated the BOD Requirement of $610,508 from Table 19 to each customer class based on their proportionate share of the weighted BOD (Table 22) as shown in Table 27.
Table 27: BOD Component Allocated to Classes
Customer Class Projected Flow
(ccf / Yr) (Table 22)
% Allocation
Allocated Requirement
Residential SFR 1,223,975 72% $440,965 MFR 80,658 5% $29,059 Non-Residential
Low 137,268 8% $49,454 Medium 53,681 3% $19,340 High 198,989 12% $71,690
1,694,571 100% $610,508 TSS Component RFC allocated the TSS Requirement of $610,508 from Table 19 to each customer class based on their proportionate share of the weighted TSS (Table 22) as shown in Table 28.

36 | City of Galt
Table 28: TSS Component Allocated to Classes
Customer Class Projected Flow
(ccf / Yr) (Table 22)
% Allocation
Allocated Requirement
Residential SFR 1,343,387 77% $467,230 MFR 88,527 5% $30,790 Non-Residential
Low 122,608 7% $42,643 Medium 35,031 2% $12,184 High 165,790 9% $57,662
1,755,342 100% $610,508 Next the allocated variable revenue requirements were added together to determine the total variable requirement by customer class. The total requirement was then divided by the total billable units to determine the variable unit rate for each customer class as shown in Table 29.
Table 29: Variable Unit Rate
Flow [A]
(Table 26)
BOD [B]
(Table 27)
TSS [C]
(Table 28)
Total Variable Req. [D]
(A+B+C)
Billable Units
[E] (Table 22)
Unit Charge
[F] (D ÷ E)
Residential SFR $1,369,026 $440,965 $467,230 $2,277,220 705,636 $3.23
MFR $90,217 $29,059 $30,790 $150,065 46,500 $3.23 Non-Residential Low $136,167 $49,454 $42,643 $439,567 79,066 $2.89 Medium $24,856 $19,340 $12,184 $94,951 14,433 $3.91 High $63,602 $71,690 $57,662 $291,652 36,931 $5.23 Total Requirements $1,683,868 $610,508 $610,508 $3,253,455 882,566
4.2.4 Proposed Wastewater Rates 4.2.4.1 Fixed Charges For SFR, and MFR units, the monthly fixed charge consists of an Account/Customer Service component combined with a fixed usage charge based on the estimated flow from such units. The estimated monthly flow for SFR and MFR units is calculated in Table 30. Gallons per Day per Person were multiplied by the average number of residents (or people per household) to arrive at the Gallons per Day per Household. Next, the gallons per day per household is multiplied by 30 days in a month to arrive at the total estimated flow for each residential class in gallons. This flow was then converted to ccf and represents the average usage per month (Column D).

Draft Comprehensive Wastewater Cost of Service Study Report | 37
Table 30: Residential Fixed Average Usage
Customer Class
Gallons per Day per Person
[A]
Average Number of Residents
[B]
Gallons per Day per Household
[C] (A x B)
Average ccf per Month
[D] (C x 30) ÷ 748.052
SFR 65 3.3 214.5 8.6 MFR 65 3.3 214.5 8.6
The average monthly usage was then multiplied by the variable rate of $3.23 (from Table 29) to create the fixed usage rates listed in Table 31. This fixed usage component is added to the Accounts/Customer Service Unit rate to create the monthly fixed service charge for Residential customers. Non-Residential customers fixed monthly charge will consist of only the Account component of $9.47 (from Table 23).
Table 31: Fixed Wastewater Charge by Class
Customer Class
Accounts Component
[A]
SRF Loan 1 [B]
SRF Loan 2 [C]
Flow Charge Component
[D]
Proposed FYE 2018 Fixed
Charge ($/Month)
[E] (A + B + C + D)
Residential
SFR $9.47 $10.62 $15.29 $27.77 $63.15 MFR $9.47 $10.62 $15.29 $27.77 $63.15 Non- Residential
Low $9.47 See Variable Rate See Variable Rate See Variable Rate $9.47 Medium $9.47 See Variable Rate See Variable Rate See Variable Rate $9.47 High $9.47 See Variable Rate See Variable Rate See Variable Rate $9.47
Applying the proposed revenue adjustments of 5.5% to the rates for each of the remaining years of the Study Period (FYE 2019 and FYE 2022) yields the fixed charges shown in Table 32, which doesn’t necessarily correlate to a 5.5% rate increase.
Table 32: Proposed 5-Yr Fixed Wastewater Charges ($/Month)
Customer Class FYE 2018 Proposed
Fixed Charge
FYE 2019 Proposed
Fixed Charge
FYE 2020 Proposed
Fixed Charge
FYE 2021 Proposed
Fixed Charge
FYE 2022 Proposed
Fixed Charge
Residential SFR $63.15 $66.63 $70.31 $74.19 $78.28 MFR $63.15 $66.63 $70.31 $74.19 $78.28 Non-Residential Low $9.47 $10.36 $11.30 $12.29 $13.33 Medium $9.47 $10.36 $11.30 $12.29 $13.33 High $9.47 $10.36 $11.30 $12.29 $13.33

38 | City of Galt
4.2.4.2 Variable Rates The SRF Loan 1 and SRF Loan 2 Non-Residential variable rates were determined in Table 24 and Table 25 respectively. The variable component of Flow, BOD, and TSS were combined in Section 4.2.3.2 and the Non-Residential flow rates were determined in Table 29. Table 33 summarizes each of the proposed Non-Residential rate components for FYE 2018. This table does not show any Residential variable rate components because all Residential revenue requirements will be recovered as part of their fixed charge.
Table 33: Non-Residential Variable Rates
Customer Class
SRF Loan 1 [A]
SRF Loan 2 [B]
Flow Charge Component
[C]
Proposed FYE 2018 Variable Rate ($/ccf)
[D] (A + B + C)
Non- Residential Low $1.10 $1.58 $2.89 $5.57 Medium $1.10 $1.58 $3.91 $6.59 High $1.10 $1.58 $5.23 $7.91
Applying the proposed revenue adjustments of 5.5% to the Non-Residential Variable Rates for each of the remaining years of the Study Period (FYE 2019 through FYE 2022) yields the Proposed Non-Residential Variable Rates shown in Table 34, which doesn’t necessarily correlate to a 5.5% rate increase.
Table 34: Proposed 5-Yr Variable Rates ($/ccf)
Customer Class FYE 2018 Proposed Variable
Rate
FYE 2019 Proposed Variable
Rate
FYE 2020 Proposed Variable
Rate
FYE 2021 Proposed Variable
Rate
FYE 2022 Proposed Variable
Rate
Non-Residential Low $5.57 $5.84 $6.13 $6.44 $6.76 Medium $6.59 $6.96 $7.35 $7.76 $8.19 High $7.91 $8.40 $8.92 $9.47 $10.05
4.2.5 Customer Bill Impacts 4.2.5.1 Residential Customer Impacts Figure 8 compares the bill totals for a Single-Family Residential customer at the existing rates, the existing rates plus the addition of the SRF Loan 2 component, and the proposed rates (inclusive of the new SRF Loan 2 component). It is important to note that the SRF Loan 2 is a cost that must be recovered through rates which requires the SFR bill to increase by $15.29 prior to any adjustments for operation and maintenance costs.

Draft Comprehensive Wastewater Cost of Service Study Report | 39
Figure 8: Residential Customer Bill Impacts (FYE 2018)
Figure 9 compare the monthly bill totals for a Single-Family Residential customer at the existing rates plus the addition of the SRF Loan 2 component, and the proposed rates for each year of the study period (FYE 2018 through FYE 2022).
Figure 9: Residential Customer Bill Impacts (FYE 2018-FYE 2022)
$37.34 $37.34 $37.24
$11.03 $11.03 $10.62
$15.29 $15.29 $48.37
$63.66 $63.15
$0
$10
$20
$30
$40
$50
$60
$70
Existing Existing w SRF 2 Proposed
Mon
thly
Bill
($)
Residential Monthly Bill Impacts
Base Rate SRF Loan 1 SRF Loan 2 Total
$63.66 $63.15 $66.63 $70.31 $74.19 $78.28
$0
$10
$20
$30
$40
$50
$60
$70
$80
$90
Existing w/ SRF 2 Proposed FYE2018
Proposed FYE2019
Proposed FYE2020
Proposed FYE2021
Proposed FYE2022
Mon
thly
Bill
($)
Residential Monthly Bill Impacts
6%6%
6%
-0.8%
6%
40 | City of Galt
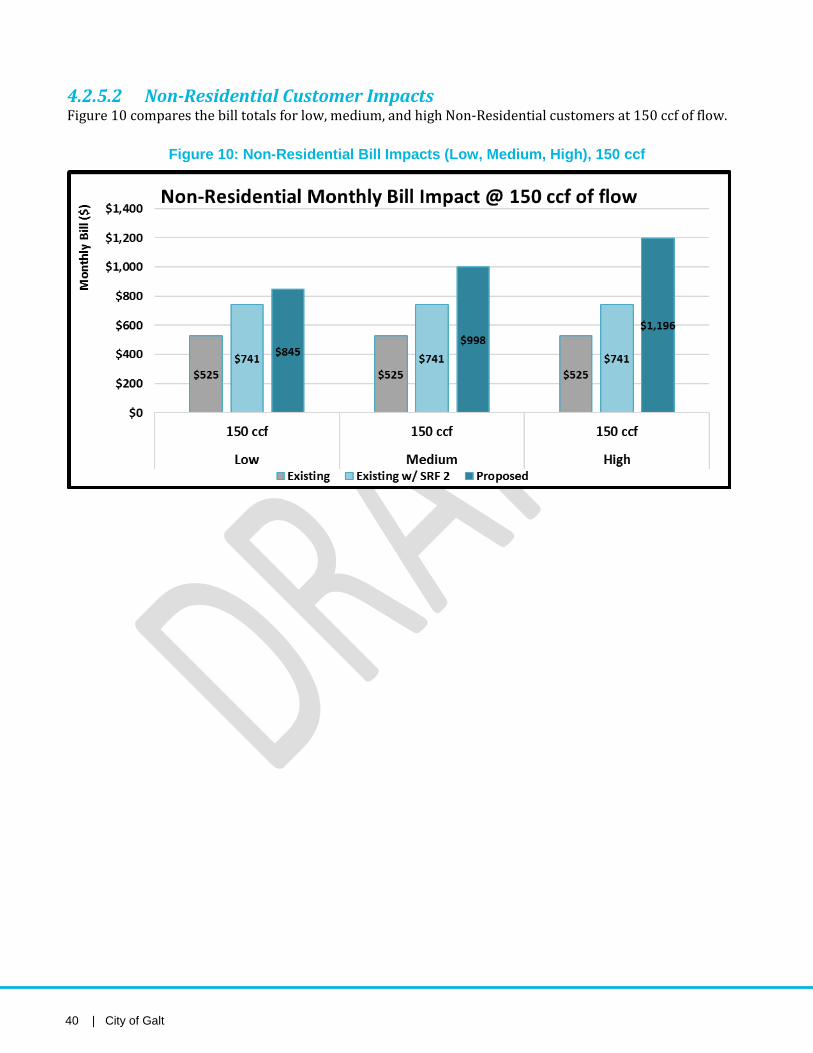
4.2.5.2 Non-Residential Customer Impacts Figure 10 compares the bill totals for low, medium, and high Non-Residential customers at 150 ccf of flow.
Figure 10: Non-Residential Bill Impacts (Low, Medium, High), 150 ccf

Draft Comprehensive Wastewater Cost of Service Study Report | 41
APPENDIX A:
Detailed Financial Plan
42 | City of Galt
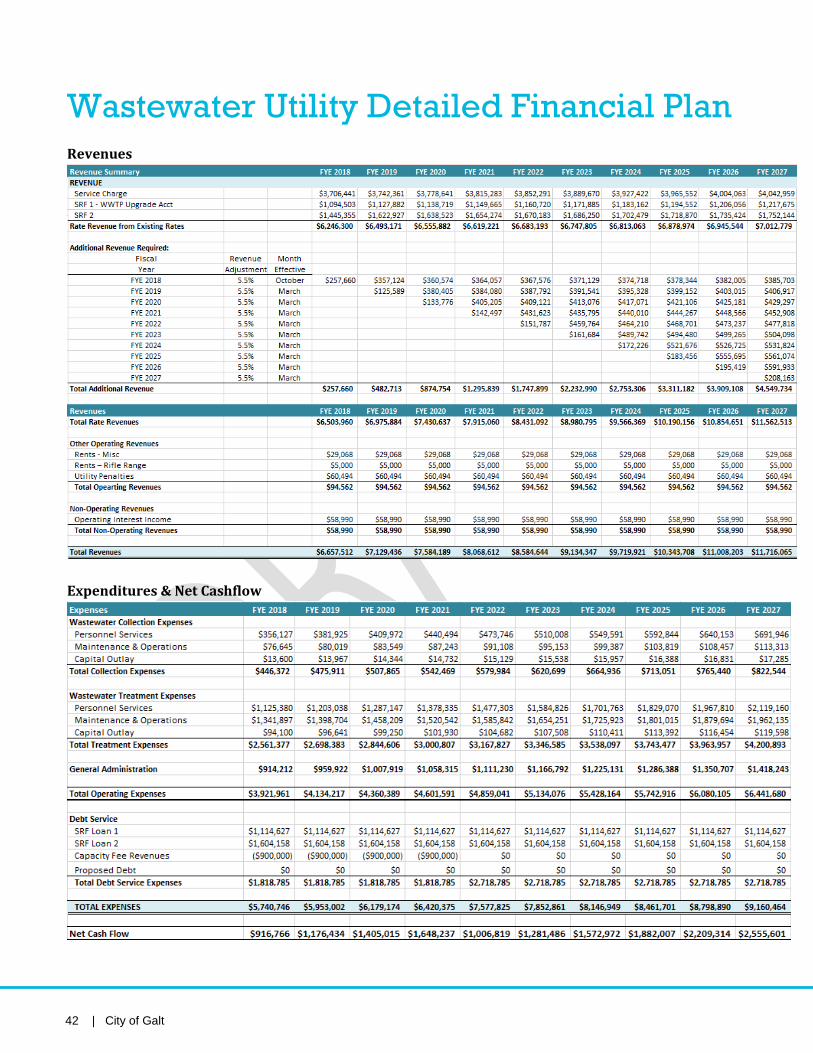
Wastewater Utility Detailed Financial Plan
Revenues
Expenditures & Net Cashflow
Draft Comprehensive Wastewater Cost of Service Study Report | 43
Reserves:

`
CITY OF GALT PUBLIC WORKS DEPARTMENT 495 INDUSTRIAL DRIVE GALT, CA 95632
Notice of Public Hearing Regarding
Proposed Wastewater (Sewer) Rate Adjustments November 7, 2017 at 6:00 PM
At the City Council Chambers, 380 Civic Drive, Galt CA 95632
(UNA VERSIÓN EN ESPAÑOL DE ESTA CARTA PUEDE OBTENERSE A LA CIUDAD DE GALT, DEPARTAMENTO DE OBRAS PÚBLICAS A 495 INDUSTRIAL DRIVE, GALT, CA 95632)
You are receiving this notice because you either own or are the party responsible for paying the wastewater (sewer) bill for a parcel of property within the City of Galt. A recent cost of service study has identified the need for adjustments to the City’s wastewater rate structure. Under current wastewater use patterns the City’s existing wastewater rates will not produce sufficient revenues to sustain the wastewater system, following the increased capital costs to the existing wastewater treatment plant along with increases to operation and maintenance expenses. To address the projected revenue shortfall, revised wastewater rates are proposed, effective November 15, 2017. The proposed rates will provide an equitable and proportional distribution of costs between the various customer classes, so that each customer pays its fair share. For more information or questions about the proposed wastewater rates, you may contact the Department of Public Works at (209) 366-7260 or by e-mail at [email protected] or visit the City’s website at www.ci.galt.ca.us.

`
Reason for the Wastewater Rate Increases and Adjustments Over the course of the last several years, the City has had to make substantial improvements to its wastewater treatment plant (“WWTP”) and sewer collection system with several key capital projects, including two WWTP upgrades (completed in 2010 and 2017), and the Live Oak Force Main Project, completed in 2015. Additionally, the an industrial deep well project is currently underway to provide a long-term solution for meeting effluent arsenic limitations for the WWTP. To pay for the WWTP upgrades, the City entered into two low-interest State Revolving Fund (“SRF”) Loan agreements with the State of California. These SRF Loan agreements require the City to maintain certain reserve levels for repayment of the loans and further require the City to establish a rate structure that allows for repayment of the SRF loans. The existing wastewater rates include a fee for the first SRF Loan upgrade, but the City needs to increase rates to repay the second SRF Loan which the City will have to start repaying this year. The City hired an independent rate consultant, Raftelis Financial Consultants, Inc. (“RFC”), to evaluate the City’s cost of service needs and how to equitably and proportionally allocate those costs of service. Based on its analysis of the City’s revenue requirements, reserve policies, capital planning schedule, and current revenues, RFC determined that without establishing rate adjustments, including a new rate component for the second SRF Loan, the City would (1) fully deplete reserves by the Fiscal Year ending in 2021; (2) be unable to meet debt obligations; and (3) no longer be able to fully fund planned capital projects. Basis Upon Which The Proposed Water Rates Were Calculated RFC recommended adjustments to the City’s wastewater rate structure to meet the City’s cost of service needs through an initial rate increase followed by subsequent smaller increases, as explained further below, spread over a five-year period. The proposed rate adjustments are based upon the analyses in the Rate Study regarding the actual and projected costs of operation and debt service requirements for the SRF loans. The proposed wastewater rates establish: (1) a customer service charge per account, applicable to all accounts regardless of customer class; (2) a flat monthly charge for all Single Family Residential and Multi-Family Residential customers since the demand from residential customers typically does not vary significantly from month-to-month or between residential customers; (3) low, medium and high non-residential (e.g., commercial and industrial) customer classes based on the non-residential customers’ flow and strength contributions to the City’s WWTP; and (4) rates necessary to re-pay the two SRF Loans. The complete RFC Rate Study is available on the City’s website at www.ci.galt.ca.us, along with staff reports from three wastewater rate workshops held on July 18, August 15, and September 5, 2017. Please see the City Council agendas for these meeting dates to view the workshop materials and Rate Study. The current and proposed wastewater rates are set forth in the tables below and on the following pages. If approved the proposed wastewater rates will be subject to an annual adjustment effective November 15, 2017, and annually beginning March 1, 2019 and thereafter through 2022.
EXISTING MONTHLY WASTEWATER RATES Customer Class Current Base
Charge Current Flow
Rates ($/ccf*)
Current SRF Loan 1 Rate
Total Current Fixed Charge
Single Family Residential $37.34/DU** N/A $11.03/DU $48.37 Multi-Family Residential $37.34/DU N/A $11.03/DU $48.37 Commercial/Industrial $1.83/Month $2.69/ccf $0.80/ccf
Multi-Family > 4 N/A $2.48/ccf $0.74/ccf Institutional N/A $1.88/ccf $0.56/ccf Contract Meter 4” $16.09/Month $3.20/ccf $0.95/ccf Contract Meter 6” $16.73/Month $3.20/ccf $0.95/ccf
*Each ccf (100 cubic feet) of water equates to 748 gallons of water. **Each DU equates to one dwelling unit. A single-family residential property is assigned one “DU.”

`
PROPOSED RESIDENTIAL WASTEWATER RATES The proposed residential monthly wastewater charges consist of four components for each customer class with fixed charges for residential customers as follows:
The proposed monthly residential wastewater rates over the next five years, including the four components identified above, total as follows:
PROPOSED NON-RESIDENTIAL WASTEWATER RATES The proposed monthly rates for non-residential customers include a fixed-rate customer service account component, plus a variable rate, which includes the non-residential customer class share of the SRF 1 and SRF 2 Loan, as well as the flow charge component.
PROPOSED NON-RESIDENTIAL VARIABLE MONTHLY FLOW RATES (Commercial, Industrial Customers) Strength Class Nov. 15, 2017
($/ccf *) March 1, 2019
($/ccf) March 1, 2020
($/ccf) March 1, 2021
($/ccf) March 1, 2022
($/ccf) Low $5.57 $5.84 $6.13 $6.44 $6.76
Medium $6.59 $6.96 $7.35 $7.76 $8.19 High $7.91 $8.40 $8.92 $9.47 $10.05
PROPOSED RESIDENTIAL WASTEWATER RATE COMPONENTS EFFECTIVE NOV. 15, 2017 FOR FY 2018 Customer Class Accounts
Component [A]
SRF Loan 1 [B]
SRF Loan 2 [C]
Flow Charge Component
[D]
Proposed Charge Eff. Nov 1, 2017
[A+B+C+D] Residential
Single Family $9.47 $10.62 $15.29 $27.77 $63.15 Multi Family $9.47 $10.62 $15.29 $27.77 $63.15
PROPOSED RESIDENTIAL MONTHLY FIXED CHARGES – TOTAL CHARGE Customer Class Nov. 15, 2017
($/Month per DU)
March 1, 2019 ($/Month per
DU)
March 1, 2020 ($/Month per
DU)
March 1, 2021 ($/Month per
DU)
March 1, 2022 ($/Month per
DU) Residential
Single Family $63.15 $66.63 $70.31 $74.19 $78.28 Multi Family $63.15 $66.63 $70.31 $74.19 $78.28
PROPOSED NON-RESIDENTIAL FIXED WASTEWATER RATES Customer Class Nov. 15, 2017
($/Month per DU)
March 1, 2019 ($/Month per DU)
March 1, 2020 ($/Month per DU)
March 1, 2021 ($/Month per DU)
March 1, 2022 ($/Month per DU)
Non-Residential (e.g., Commercial, Industrial) Low $9.47 $10.36 $11.30 $12.29 $13.33
Medium $9.47 $10.36 $11.30 $12.29 $13.33 High $9.47 $10.36 $11.30 $12.29 $13.33

`
*Each ccf (100 cubic feet) of water equates to 748 gallons of water. PROTEST NOTICE: Galt property owners and wastewater customers have the right to protest the wastewater rate adjustments proposed by the City. Written protests may be submitted for a specific service address by either the property owner or by a tenant who is paying directly for the utility services. However, only one valid protest per service address will be counted. If valid written protests are submitted on behalf of a majority of affected properties the proposed rate adjustment will not be imposed. To be considered valid, a protest must be submitted to the City Clerk in writing by the affected property owner or tenant and shall state their first and last name, the street address or Assessor’s Parcel Number. Please identify on the front of the envelope or subject line for any written protest: “Wastewater Rate Protest.” Written protests must be received by the City Clerk prior to the close of the public hearing to be held on November 7, 2017, at 6:00 PM. Mailed protests should be post-marked no later than November 3, 2017 to assure timely receipt. Oral comments at the public hearing will not qualify as formal protests unless accompanied by a written protest.
Send your written protest to:
City of Galt City Clerk
380 Civic Drive Galt, CA 95632
Fax: 209-745-3373
E-mail: [email protected]
OR
Deliver your written protest at the Public Hearing on November 7, 2017
6:00 PM City Hall Council Chambers
2017 Water, Wastewater and Storm Drainage Capacity Fee Study
Draft Report / August 23, 2017
The City of Galt
24640 Jefferson Avenue Suite 207
Murrieta, CA 92562
Phone 951.387.4352 www.raftelis.com
August 23, 2017 Mr. Steven Winkler Public Works Director City of Galt 495 Industrial Drive Galt, CA 95632 Subject: Water, Wastewater, and Storm Drainage Capacity Fee Study Dear Mr. Winker, Raftelis Financial Consultants, Inc. (Raftelis) is pleased to provide this Water, Wastewater, and Storm Drainage Capacity Fees Study Report (Report) to the City of Galt (City). This report details the methodology used to update the City’s capacity fees and summarizes the key findings and recommendations. It has been a pleasure working with you, and we thank you and the City staff for the support provided during the course of this study. Sincerely, RAFTELIS FINANCIAL CONSULTANTS, INC.
Habib Isaac Andrea Boehling Senior Manager Senior Consultant

City of Galt Water, Wastewater, and Storm Drainage Capacity Fee Study Report
TABLE OF CONTENTS 1. EXECUTIVE SUMMARY ............................................................................. 6
1.1 WATER CAPACITY FEES .......................................................................... 6
1.2 WASTEWATER CAPACITY FEES .............................................................. 7
1.3 STORM DRAINAGE CAPACITY FEES ....................................................... 7
1.4 OVERVIEW .................................................................................................. 8
1.5 ECONOMIC AND LEGAL FRAMEWORK ................................................... 8
2. METHODOLOGIES ................................................................................... 10
2.1 BUY-IN APPROACH ................................................................................. 10
2.2 INCREMENTAL COST APPROACH ......................................................... 12
3. PROPOSED WATER CAPACITY FEE ...................................................... 13
3.1 PROPOSED METHOD: BUY-IN APPROACH ........................................... 13
4. PROPOSED WASTEWATER CAPACITY FEE ......................................... 15
4.1 PROPOSED METHOD: BUY-IN APPROACH ........................................... 15
5. PROPOSED STORM DRAINAGE CAPACITY FEE .................................. 17
5.1 PROPOSED METHOD: BUY-IN APPROACH ........................................... 17
6. PROPOSED CAPACITY FEES ................................................................. 18
6.1 WATER CAPACITY FEE ........................................................................... 18
6.2 WASTEWATER CAPACITY FEE .............................................................. 19
6.3 STORM DRAINAGE CAPACITY FEE ....................................................... 19
7. RATE COMPARISON ................................................................................ 20
7.1 WATER CAPACITY FEE COMPARISON ................................................. 20
7.2 WASTEWATER CAPACITY FEE COMPARISON ..................................... 21
7.3 STORM DRAINAGE CAPACITY FEE COMPARISON .............................. 22
APPENDIX A – CONSTRUCTION COST INDEX ............................................... 24
APPENDIX B – WATER REPLACEMENT COST VALUE .................................. 25
APPENDIX C – WASTEWATER REPLACEMENT COST VALUE ..................... 33
APPENDIX D – STORM DRAINAGE REPLACEMENT COST VALUE .............. 42

City of Galt Water, Wastewater, and Storm Drainage Capacity Fee Study Report
LIST OF TABLES Table 1: Current Water Capacity Fees .................................................................................................. 6 Table 2: Proposed Water Capacity Fees .............................................................................................. 6 Table 3: Current Wastewater Capacity Fees ........................................................................................ 7 Table 4: Proposed Wastewater Capacity Fees..................................................................................... 7 Table 5: Water Assets/System Value .................................................................................................. 13 Table 6: Water Meter Equivalent (ME) ................................................................................................ 14 Table 7: Wastewater Collection Assets/System Value ...................................................................... 15 Table 8: Wastewater Treatment Assets/System Value ...................................................................... 15 Table 9: Buy-In Component Calculation for Wastewater Collection ................................................ 16 Table 10: Buy-In Component Calculation for Wastewater Treatment .............................................. 16 Table 11: Storm Drainage Equivalent Units ....................................................................................... 17 Table 12: Proposed Water Capacity Fees .......................................................................................... 18 Table 13: Proposed Wastewater Capacity Fee................................................................................... 19 Table 14: Proposed Storm Drainage Capacity Fees .......................................................................... 19 Table 15: Engineering News Record Construction Cost Index – 20 Cities ...................................... 24 Table 16: Water Asset Listing and RCLD ........................................................................................... 25 Table 17: Wastewater Asset Listing and RCLD ................................................................................. 33 Table 18: Storm Drainage Asset Listing and RCLD ........................................................................... 42
LIST OF FIGURES Figure 1: Formula for Buy-In Approach.............................................................................................. 10 Figure 2: Formula for Incremental Cost Approach ............................................................................ 12 Figure 3: Water Buy-In Capacity Fee Calculation .............................................................................. 14 Figure 4: Buy-In Calculation (Storm Drainage) .................................................................................. 18 Figure 5: Water Capacity Fee Comparison (Existing City) ................................................................ 20 Figure 6: Water Capacity Fee Comparison (Proposed City) ............................................................. 21 Figure 7: Wastewater Capacity Fee Comparison (Existing City) ...................................................... 22 Figure 8: Wastewater Capacity Fee Comparison (Proposed City) ................................................... 22 Figure 9: Storm Drainage Capacity Fee Comparison (Existing City) ............................................... 23 Figure 10: Storm Drainage Capacity Fee Comparison (Proposed City) ........................................... 23

City of Galt Water, Wastewater, and Storm Drainage Capacity Fee Study Report
This page intentionally left blank to facilitate two-sided printing.

6 | City of Galt
1. EXECUTIVE SUMMARY The City of Galt contracted with Raftelis Financial Consultants, Inc. (Raftelis) to conduct a Water, Wastewater, and Storm Drainage Capacity Fee Study (Study). This report describes the methodology Raftelis used to calculate the proposed capacity fees in accordance with the rules and regulations of California State Government Code Section 66013. This report is formal technical documentation in support of modifications to the capacity fees within the City’s service area.
1.1 WATER CAPACITY FEES Currently, the City’s Water Capacity Fee is made up of two components, a Well Development component and an Existing Distribution Buy-In component, and varies by meter size. The total water capacity fee for meters 1” or less is $2,780. Table 1 summarizes the current water capacity fees by meter size.
Table 1: Current Water Capacity Fees
Meter Size Capital Cost Well Development
Buy-In Existing Distribution
System
Current Water Capacity Fee
1" (or less) $1,459 $1,321 $2,780 1.5" $3,445 $2,014 $5,459 2" $5,686 $5,000 $10,686 3" $12,775 $11,234 $24,009 4" $23,077 $19,998 $43,075 6" $51,169 $44,996 $96,165 8" $90,971 $79,993 $170,964
10" $142,142 $124,989 $267,131 12" $204,685 $179,986 $384,671
The analysis herein utilizes the Buy-In Method and justifies modifying the Water Capacity Fee to $6,598 per equivalent meter. Table 2 summarizes the proposed water capacity fees.
Table 2: Proposed Water Capacity Fees
Meter Size AWWA Ratio Proposed Water Capacity Fee
1" (or less) 1.00 $6,598 1.5" 2.00 $13,196 2" 3.20 $21,114 3" 7.00 $46,186 4" 12.60 $83,135 6" 26.00 $171,548 8" 56.00 $369,488
10" 84.00 $554,232 12" 106.00 $699,388

Water, Wastewater, and Storm Drainage Capacity Fee Study Report | 7
1.2 WASTEWATER CAPACITY FEES The existing Wastewater Capacity Fee is made up of two components, a Supplemental WWTP component and an Existing System Buy-In component. The current Wastewater Capacity Fee is $8,707 per residential unit or per 250 gallons of discharge for non-residential customers. Table 3 shows the current wastewater capacity fees.
Table 3: Current Wastewater Capacity Fees
Wastewater Buy-in Existing System
Supplemental WWTP Fee
Total WW Capacity Fee
Residential (per unit) $4,919 $3,788 $8,707 Commercial (per connection per EDU) $4,919 $3,788 $8,707
The analysis herein evaluates the collection and treatment systems independently, therefore the proposed fees include a collection component and a treatment component. Raftelis utilized the Buy-In Method to justify the total Wastewater Capacity Fee of $7,946 per equivalent unit, where an equivalent unit is equal to the average single-family discharge of 250 gallons per day. Table 4 shows the proposed wastewater capacity fees.
Table 4: Proposed Wastewater Capacity Fees
Proposed Collection
Component
Proposed Treatment
Component
Total Proposed WW Capacity
Fee
Cost per Equivalent Unit $4,770 $3,176 $7,946
1.3 STORM DRAINAGE CAPACITY FEES The existing Storm Drainage Capacity Fee is $3,324 per acre and does not include cost of project-specific storm drain improvements. The analysis herein uses the Buy-In Method and justifies modifying the Storm Drainage Capacity fee to $6,644 per acre.

8 | City of Galt
1.4 OVERVIEW As part of the City’s review of rates and fees, the capacity fees are being updated to ensure new system users or existing users requiring increased system capacity recover their fair share of the costs associated with the water, wastewater, and storm drainage facilities required to serve them. Capacity fees are one-time fees, collected as a condition of establishing a new connection to the City’s water, wastewater, and storm drainage systems or the expansion of an already existing connection. The purpose of these fees is to pay for development’s share of the costs of existing and/or new water, wastewater, and storm drainage facilities. These fees are designed to be proportional to the demand placed on the systems by the new or expanded connections. The recommended Capacity Fees for the City do not exceed the estimated reasonable costs of providing the facilities for which they are collected and are of proportional benefit to the property being charged. This report documents the data, methodology, and results of the Capacity Fees Study.
1.5 ECONOMIC AND LEGAL FRAMEWORK For publicly owned systems, most of the assets are typically paid for by the contributions of existing customers through rates, charges, securing debt, and taxes. In service areas that incorporate new customers, the infrastructure developed by previous customers is generally extended towards the service of new customers. Existing customers’ investment in the existing system capacity allows newly connecting customers to take advantage of unused surplus capacity. To further economic equality among new and existing customers, new connectors will typically “buy-in” to the existing and pre-funded facilities based on the existing assets, effectively putting them on par with existing customers. In other words, the new users are buying into the existing system based on the replacement costs of existing assets in order to continue to provide the same level of service to new customers through expansion and upgrades to the system.
1.5.1 Economic Framework The basic economic philosophy behind Capacity Fees is that the costs of providing service should be paid for by those that receive utility from the product. In order to effect fair distribution of the value of the system, the charge should reflect a reasonable estimate of the cost of providing capacity to new users, and not unduly burden existing users through a comparable rate increase. Accordingly, many utilities make this philosophy one of their primary guiding principles when developing their Capacity Fee structure. The philosophy that service should be paid for by those that receive utility from the product is often referred to as “growth-should-pay-for-growth.” The principal is summarized in the American Water Works Association (AWWA) Manual M26, Water Rates and Related Charges:
“The purpose of designing customer-contributed-capital system charges is to prevent or reduce the inequity to existing customers that results when these customers must pay the increase in water rates that are needed to pay for added plant costs for new customers. Contributed capital reduces the need for new outside sources of capital, which ordinarily has been serviced from the revenue stream. Under a system of contributed capital, many water utilities are able to finance required facilities by use of a ‘growth-pays-for-growth’ policy.”
This principle, in general, also applies to wastewater and storm drainage systems. In this excerpt, customer-contributed-capital system charges are equivalent to Capacity Fees.

Water, Wastewater, and Storm Drainage Capacity Fee Study Report | 9
1.5.2 Legal Framework In establishing Capacity Fees, it is important to understand and comply with local laws and regulations governing the establishment, calculation, and implementation of Capacity Fees. The following sections summarize the regulations applicable to the development of Capacity Fees for the City.
1.5.3 California Government Code Requirements Capacity Fees must be established based on a reasonable relationship to the needs and benefits brought about by the development or expansion. Courts have long used a standard of reasonableness to evaluate the legality of development charges. The basic statutory standards governing Capacity Fees are embodied by California Government Code Sections 66013, 66016, 66022 and 66023. Government Code Section 66013, in particular, contains requirements specific to determining utility development charges:
“Notwithstanding any other provision of law, when a local agency imposes fees for water connections or sewer connections, or imposes capacity charges, those fees or charges shall not exceed the estimated reasonable cost of providing the service for which the fee or charge is imposed, unless a question regarding the amount the fee or charge in excess of the estimated reasonable cost of providing the services or materials is submitted to, and approved by, a popular vote of two-thirds of those electors voting on the issue.”
Section 66013 also includes the following general requirements: » Local agencies must follow a process set forth in the law, making certain determinations regarding the
purpose and use of the charge; they must establish a nexus or relationship between a development project and the public improvement being financed with the charge.
» The Capacity Charge revenue must be segregated from the general fund in order to avoid commingling of Capacity Fees and the General Fund.
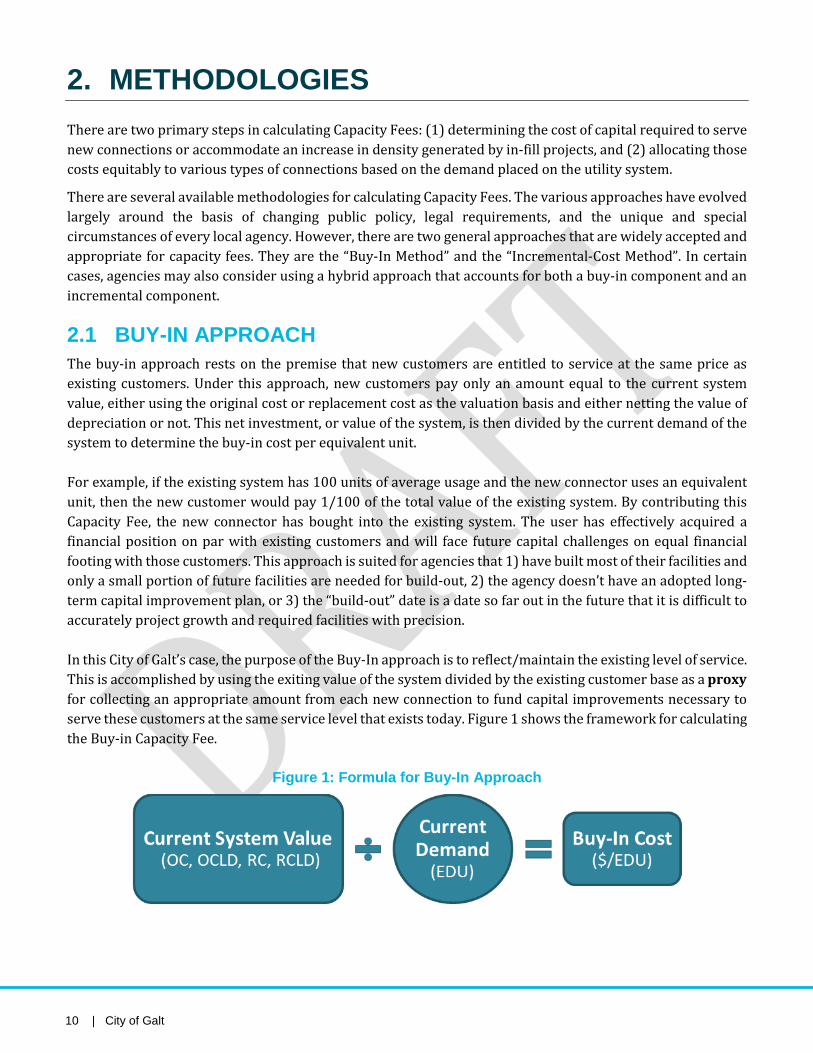
10 | City of Galt
2. METHODOLOGIES There are two primary steps in calculating Capacity Fees: (1) determining the cost of capital required to serve new connections or accommodate an increase in density generated by in-fill projects, and (2) allocating those costs equitably to various types of connections based on the demand placed on the utility system.
There are several available methodologies for calculating Capacity Fees. The various approaches have evolved largely around the basis of changing public policy, legal requirements, and the unique and special circumstances of every local agency. However, there are two general approaches that are widely accepted and appropriate for capacity fees. They are the “Buy-In Method” and the “Incremental-Cost Method”. In certain cases, agencies may also consider using a hybrid approach that accounts for both a buy-in component and an incremental component.
2.1 BUY-IN APPROACH The buy-in approach rests on the premise that new customers are entitled to service at the same price as existing customers. Under this approach, new customers pay only an amount equal to the current system value, either using the original cost or replacement cost as the valuation basis and either netting the value of depreciation or not. This net investment, or value of the system, is then divided by the current demand of the system to determine the buy-in cost per equivalent unit. For example, if the existing system has 100 units of average usage and the new connector uses an equivalent unit, then the new customer would pay 1/100 of the total value of the existing system. By contributing this Capacity Fee, the new connector has bought into the existing system. The user has effectively acquired a financial position on par with existing customers and will face future capital challenges on equal financial footing with those customers. This approach is suited for agencies that 1) have built most of their facilities and only a small portion of future facilities are needed for build-out, 2) the agency doesn’t have an adopted long-term capital improvement plan, or 3) the “build-out” date is a date so far out in the future that it is difficult to accurately project growth and required facilities with precision. In this City of Galt’s case, the purpose of the Buy-In approach is to reflect/maintain the existing level of service. This is accomplished by using the exiting value of the system divided by the existing customer base as a proxy for collecting an appropriate amount from each new connection to fund capital improvements necessary to serve these customers at the same service level that exists today. Figure 1 shows the framework for calculating the Buy-in Capacity Fee.
Figure 1: Formula for Buy-In Approach

Water, Wastewater, and Storm Drainage Capacity Fee Study Report | 11
2.1.1 Asset Valuation Approaches There are various methods employed to estimate the asset value of the existing facilities and derive an updated capacity fee based on the existing asset value. The principal methods commonly used to value a utility's existing assets are original cost replacement cost, original cost less depreciation, and replacement cost less depreciation.
1. Original Cost (OC). The principal advantages of the original cost method lie in its relative simplicity and stability, since the recorded costs of tangible property are held constant. The major criticism levied against original cost valuation pertains to the disregard of changes in the value of money, which are attributable to inflation and other factors. As evidenced by history, prices tend to increase rather than to remain constant. Because the value of money varies inversely with changes in price, monetary values in most recent years have exhibited a definite decline; a fact not recognized by the original cost approach. This situation causes further problems when it is realized that most utility systems are developed over time on a piecemeal basis as demanded by service area growth. Consequently, each property addition was paid for with dollars of different purchasing power. When these outlays are added together to obtain a plant value the result can be misleading.
2. Replacement Cost (RC). Changes in the value of the dollar over time, at least as considered by the impacts of inflation, can be recognized by replacement cost asset valuation. The replacement cost represents the cost of duplicating the existing utility facilities (or duplicating its function) at current prices. Unlike the original cost approach, the replacement cost method recognizes price level changes that may have occurred since plant construction. The most accurate replacement cost valuation would involve a physical inventory and appraisal of plant components in terms of their replacement costs at the time of valuation. However, with original cost records available, a reasonable approximation of replacement cost plant value can most easily be ascertained by trending historical original costs. This approach employs the use of cost indices to express actual capital costs experienced by the utility in terms of current dollars. An obvious advantage of the replacement cost approach is that it gives consideration to changes in the value of money over time.
3. Original Cost Less Depreciation (OCLD) or Replacement Cost Less Depreciation (RCLD).
Considerations of the current value of utility facilities may also be materially affected by the effects of age and depreciation. Depreciation takes into account the anticipated losses in plant value caused by wear and tear, decay, inadequacy, and obsolescence. To provide appropriate recognition of the effects of depreciation on existing utility facilities, both the original cost and replacement cost valuation measures can also be expressed on an OCLD and RCLD basis. These measures are identical to the aforementioned valuation methods, with the exception that accumulated depreciation is computed for each asset account based upon its age or condition, and deducted from the respective total original cost or replacement cost to determine the OCLD or RCLD measures of system value.
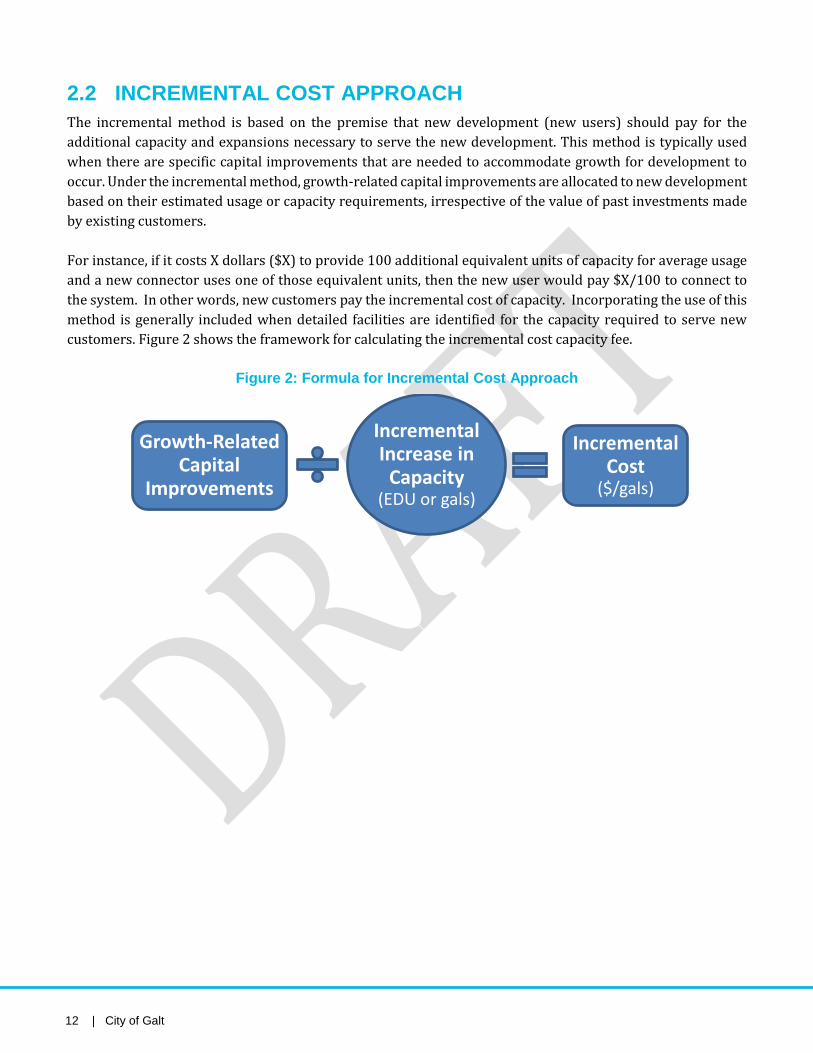
12 | City of Galt
2.2 INCREMENTAL COST APPROACH The incremental method is based on the premise that new development (new users) should pay for the additional capacity and expansions necessary to serve the new development. This method is typically used when there are specific capital improvements that are needed to accommodate growth for development to occur. Under the incremental method, growth-related capital improvements are allocated to new development based on their estimated usage or capacity requirements, irrespective of the value of past investments made by existing customers. For instance, if it costs X dollars ($X) to provide 100 additional equivalent units of capacity for average usage and a new connector uses one of those equivalent units, then the new user would pay $X/100 to connect to the system. In other words, new customers pay the incremental cost of capacity. Incorporating the use of this method is generally included when detailed facilities are identified for the capacity required to serve new customers. Figure 2 shows the framework for calculating the incremental cost capacity fee.
Figure 2: Formula for Incremental Cost Approach
Growth-Related Capital
Improvements
Incremental Increase in
Capacity (EDU or gals)
Incremental Cost
($/gals)
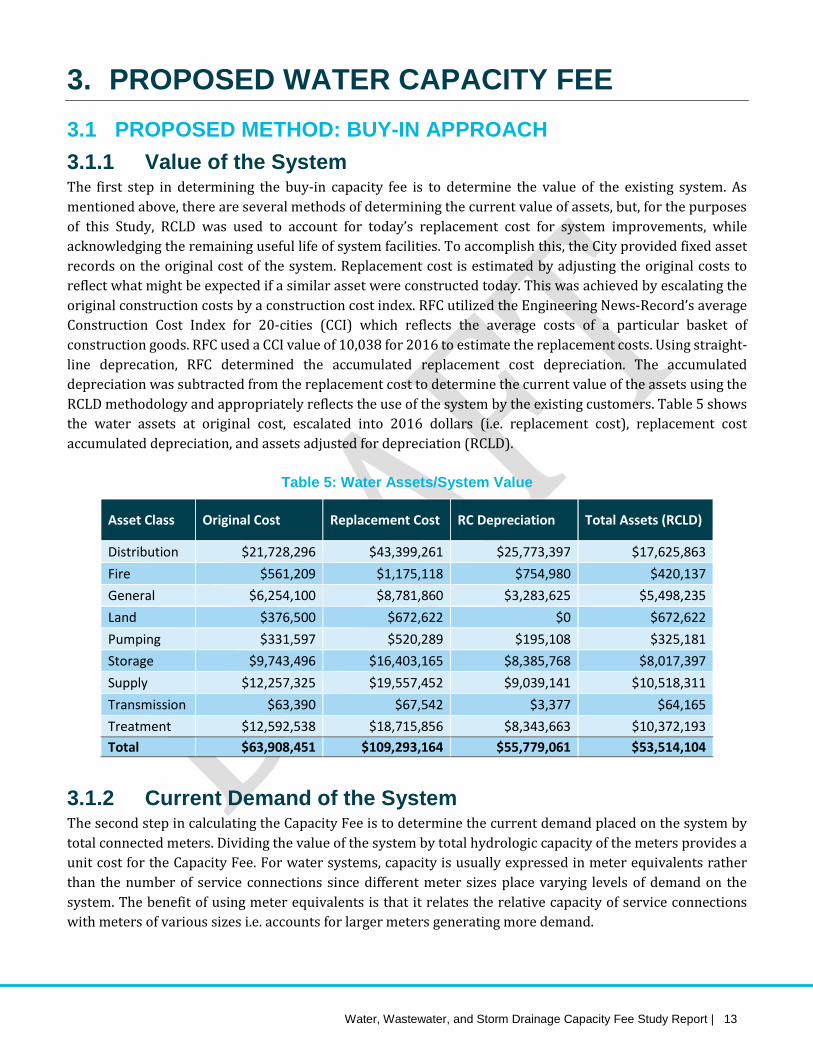
Water, Wastewater, and Storm Drainage Capacity Fee Study Report | 13
3. PROPOSED WATER CAPACITY FEE 3.1 PROPOSED METHOD: BUY-IN APPROACH 3.1.1 Value of the System The first step in determining the buy-in capacity fee is to determine the value of the existing system. As mentioned above, there are several methods of determining the current value of assets, but, for the purposes of this Study, RCLD was used to account for today’s replacement cost for system improvements, while acknowledging the remaining useful life of system facilities. To accomplish this, the City provided fixed asset records on the original cost of the system. Replacement cost is estimated by adjusting the original costs to reflect what might be expected if a similar asset were constructed today. This was achieved by escalating the original construction costs by a construction cost index. RFC utilized the Engineering News-Record’s average Construction Cost Index for 20-cities (CCI) which reflects the average costs of a particular basket of construction goods. RFC used a CCI value of 10,038 for 2016 to estimate the replacement costs. Using straight-line deprecation, RFC determined the accumulated replacement cost depreciation. The accumulated depreciation was subtracted from the replacement cost to determine the current value of the assets using the RCLD methodology and appropriately reflects the use of the system by the existing customers. Table 5 shows the water assets at original cost, escalated into 2016 dollars (i.e. replacement cost), replacement cost accumulated depreciation, and assets adjusted for depreciation (RCLD).
Table 5: Water Assets/System Value
Asset Class Original Cost Replacement Cost RC Depreciation Total Assets (RCLD)
Distribution $21,728,296 $43,399,261 $25,773,397 $17,625,863 Fire $561,209 $1,175,118 $754,980 $420,137 General $6,254,100 $8,781,860 $3,283,625 $5,498,235 Land $376,500 $672,622 $0 $672,622 Pumping $331,597 $520,289 $195,108 $325,181 Storage $9,743,496 $16,403,165 $8,385,768 $8,017,397 Supply $12,257,325 $19,557,452 $9,039,141 $10,518,311 Transmission $63,390 $67,542 $3,377 $64,165 Treatment $12,592,538 $18,715,856 $8,343,663 $10,372,193 Total $63,908,451 $109,293,164 $55,779,061 $53,514,104
3.1.2 Current Demand of the System The second step in calculating the Capacity Fee is to determine the current demand placed on the system by total connected meters. Dividing the value of the system by total hydrologic capacity of the meters provides a unit cost for the Capacity Fee. For water systems, capacity is usually expressed in meter equivalents rather than the number of service connections since different meter sizes place varying levels of demand on the system. The benefit of using meter equivalents is that it relates the relative capacity of service connections with meters of various sizes i.e. accounts for larger meters generating more demand.

14 | City of Galt
RFC utilized consumption data provided by the City to determine the current number of meters by meter size for the service area. Next, the AWWA Standards for Maximum Rated Safe Operating Flow in gallons per minute (gpm) were used to determine the equivalent meter ratios. The typical single-family residential base meter for the City is a 1” or less meter. As shown in Table 6, the safe operating capacity of a 1” meter is 50 gpm. For each meter size there is a corresponding maximum safe operating capacity which provides the basis for calculating the meter equivalency ratios (AWWA Meter Ratio). For example, the safe operating capacity for a 4” meter is 630 gpm. Comparing the 4” meter and the 1” meter on a capacity basis, a 4” meter is equivalent to 12.6 1” meters. This was determined by dividing the 4” meter capacity of 630 gpm by the 1” meter capacity of 50 gpm. Therefore, the base meter receives an equivalent meter ratio of 1 whereas the 4” meter receives an equivalent meter ratio of 12.6. Note, the meter ratios should reflect each meter’s capacity in relation to the 1” meter capacity. Finally, the number of meters (by size) was multiplied by the respective equivalent meter ratio to obtain the Meter Equivalent (MEs). Table 6 summarizes the data used to determine the total equivalent meters of 8,110, which is reflective of the current demand of the system.
Table 6: Water Meter Equivalent (ME)
Meter Size [A]
Meter Type [B]
AWWA Meter Capacity (gpm)
[C]
AWWA Ratio [D]
(C ÷ 50)
Meter Counts [E]
Meter Equivalents
[F] (D x E)
1" (or less) Turbine Type, Class I 50 1.00 6,896 6,896 1.5" Turbine Type, Class I 100 2.00 76 152 2" Turbine Type, Class I 160 3.20 170 544 3" Turbine Type, Class I 350 7.00 25 175 4" Turbine Type, Class I 630 12.60 19 239 6" Turbine Type, Class I 1,300 26.00 4 104 8" Turbine Type, Class II 2,800 56.00 - -
10" Turbine Type, Class II 4,200 84.00 - - 12" Turbine Type, Class II 5,300 106.00 - -
Total 7,190 8,110 The final step in determining the Water Buy-In Capacity Fee is to divide the total current value of the water system from Section 3.1.1 by the total equivalent meters from Section 3.1.2. In 2016 dollars, the total net value of the water system is $53,514,104 The value of the system is then divided by the total system capacity (or demand) expressed in total equivalent meters (8,110) to determine the per meter equivalent (or ME) cost of $6,598. Figure 3 summarizes the calculation of the Water Buy-In Capacity Fee per ME.
Figure 3: Water Buy-In Capacity Fee Calculation
Current System Value
$53,514,104
8,110 MEs
Buy-In Capacity Fee
$6,598

Water, Wastewater, and Storm Drainage Capacity Fee Study Report | 15
4. PROPOSED WASTEWATER CAPACITY FEE 4.1 PROPOSED METHOD: BUY-IN APPROACH 4.1.1 Value of the System The first step in determining the wastewater buy-in capacity fee is to determine the value of the existing system. For the wastewater system, the assets were categorized into collection assets and treatment assets. Similar to the City’s water facilities, RCLD was used to derive the updated wastewater capacity fee. The OC, RC, Replacement Depreciation, and RCLD asset values for both the collection component and the treatment component are shown in Table 7 and Table 8, respectively).
Table 7: Wastewater Collection Assets/System Value
Asset Class Original Cost Replacement Cost
Replacement Cost Depreciation
Collection System Assets (RCLD)
Collection $36,692,527 $84,476,622 $49,460,280 $35,016,341 Customer Service $11,165 $13,843 $4,430 $9,413 General $14,450,100 $24,533,597 $13,981,756 $10,551,841 Land $214,470 $275,720 $0 $275,720 Pumping $10,563,309 $14,654,531 $4,966,189 $9,688,342 Storage $1,949,196 $2,676,793 $976,151 $1,700,643 Total $63,880,767 $126,631,106 $69,388,805 $57,242,300
Table 8: Wastewater Treatment Assets/System Value
Asset Class Original Cost Replacement Cost
Replacement Cost Depreciation
Treatment System Assets (RCLD)
Treatment $41,413,593 $46,954,476 $8,837,018 $38,117,458 Total $41,413,593 $46,954,476 $8,837,018 $38,117,458
4.1.2 Existing Capacity The second step in calculating the Buy-In component of the Wastewater Capacity Fee is to determine the demand of the system. The existing wastewater system has a treatment capacity of 3,000,000 gpd. As such, the unit cost for the Collection component and the Treatment component were derived by taking the value of each respective component and dividing the total by 3MGD to reflect a cost per gallon of the system.

16 | City of Galt
The calculation of the Buy-In Components for collection and treatment are shown in Table 9 and Table 10 respectively.
Table 9: Buy-In Component Calculation for Wastewater Collection
Collection Component
Wastewater Collection System Value $57,242,300
÷ Current Demand 3,000,000 gpd
$ per gallon per day $19.08
× Average Single-Family Demand 250 gpd
Wastewater Collection Buy-In Component $4,770 per EU (SFR)
Table 10: Buy-In Component Calculation for Wastewater Treatment
Treatment Component
Wastewater Treatment System Value $38,117,458
÷ Current Capacity 3,000,000 gpd
$ per gallon per day $12.71
× Average Single-Family Demand 250 gpd
Wastewater Treatment Buy-In Component $3,176 per EU (SFR)
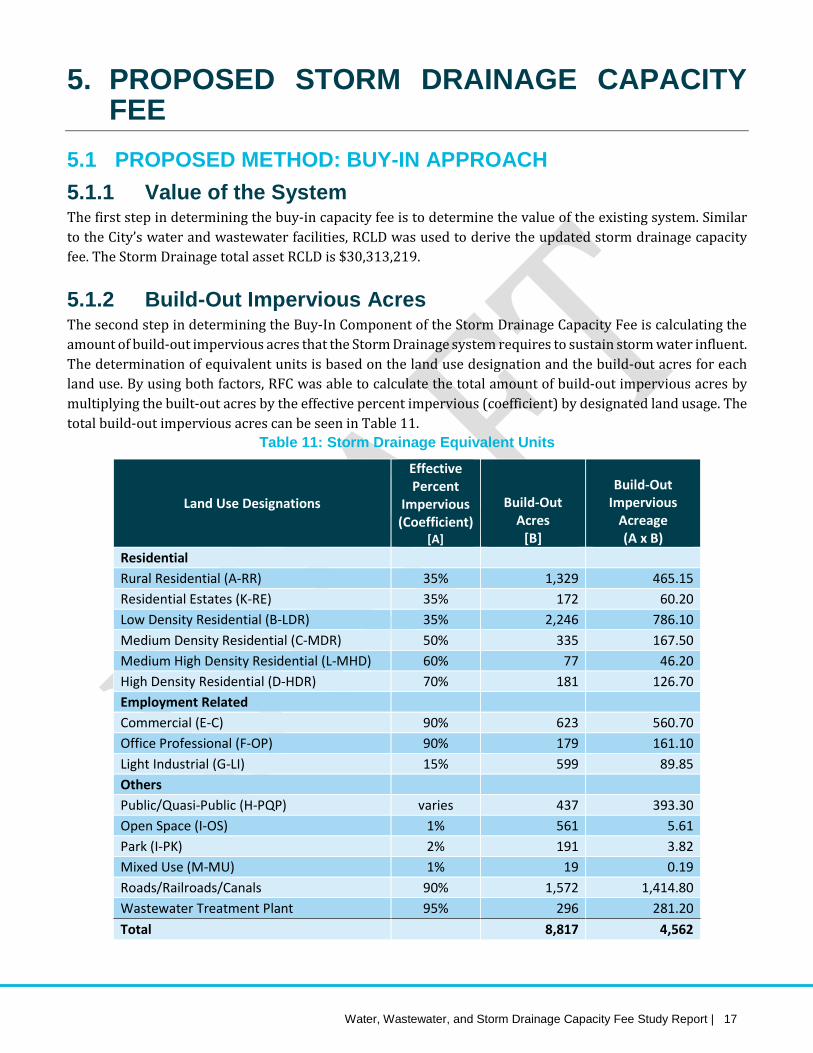
Water, Wastewater, and Storm Drainage Capacity Fee Study Report | 17
5. PROPOSED STORM DRAINAGE CAPACITY FEE
5.1 PROPOSED METHOD: BUY-IN APPROACH 5.1.1 Value of the System The first step in determining the buy-in capacity fee is to determine the value of the existing system. Similar to the City’s water and wastewater facilities, RCLD was used to derive the updated storm drainage capacity fee. The Storm Drainage total asset RCLD is $30,313,219.
5.1.2 Build-Out Impervious Acres The second step in determining the Buy-In Component of the Storm Drainage Capacity Fee is calculating the amount of build-out impervious acres that the Storm Drainage system requires to sustain storm water influent. The determination of equivalent units is based on the land use designation and the build-out acres for each land use. By using both factors, RFC was able to calculate the total amount of build-out impervious acres by multiplying the built-out acres by the effective percent impervious (coefficient) by designated land usage. The total build-out impervious acres can be seen in Table 11.
Table 11: Storm Drainage Equivalent Units
Land Use Designations
Effective Percent
Impervious (Coefficient)
[A]
Build-Out Acres
[B]
Build-Out Impervious
Acreage (A x B)
Residential
Rural Residential (A-RR) 35% 1,329 465.15 Residential Estates (K-RE) 35% 172 60.20 Low Density Residential (B-LDR) 35% 2,246 786.10 Medium Density Residential (C-MDR) 50% 335 167.50 Medium High Density Residential (L-MHD) 60% 77 46.20 High Density Residential (D-HDR) 70% 181 126.70 Employment Related
Commercial (E-C) 90% 623 560.70 Office Professional (F-OP) 90% 179 161.10 Light Industrial (G-LI) 15% 599 89.85 Others
Public/Quasi-Public (H-PQP) varies 437 393.30 Open Space (I-OS) 1% 561 5.61 Park (I-PK) 2% 191 3.82 Mixed Use (M-MU) 1% 19 0.19 Roads/Railroads/Canals 90% 1,572 1,414.80 Wastewater Treatment Plant 95% 296 281.20 Total 8,817 4,562

18 | City of Galt
The next step in determining the Storm Drainage Buy-In Capacity Fee is to divide the current values determined in Section 5.1.1 by the total existing impervious areas from Section 5.1.2. The calculation of the Storm Drainage Capacity Fee can be seen in Figure 4.
Figure 4: Buy-In Calculation (Storm Drainage)
6. PROPOSED CAPACITY FEES 6.1 WATER CAPACITY FEE The Proposed Water Buy-In Capacity Fee is shown in Table 12. For meter sizes above 1” the Buy-In capacity fee is escalated by the corresponding AWWA ratios.
Table 12: Proposed Water Capacity Fees
Meter Size AWWA Ratio
Total Proposed Water Capacity Fee
1" (or less) 1.00 $6,598 1.5" 2.00 $13,196 2" 3.20 $21,114 3" 7.00 $46,186 4" 12.60 $83,135 6" 26.00 $171,548 8" 56.00 $369,488
10" 84.00 $554,232 12" 106.00 $699,388
Current System Value
$30,313,219
4,562 Acres
Buy-In Capacity Fee
$6,644
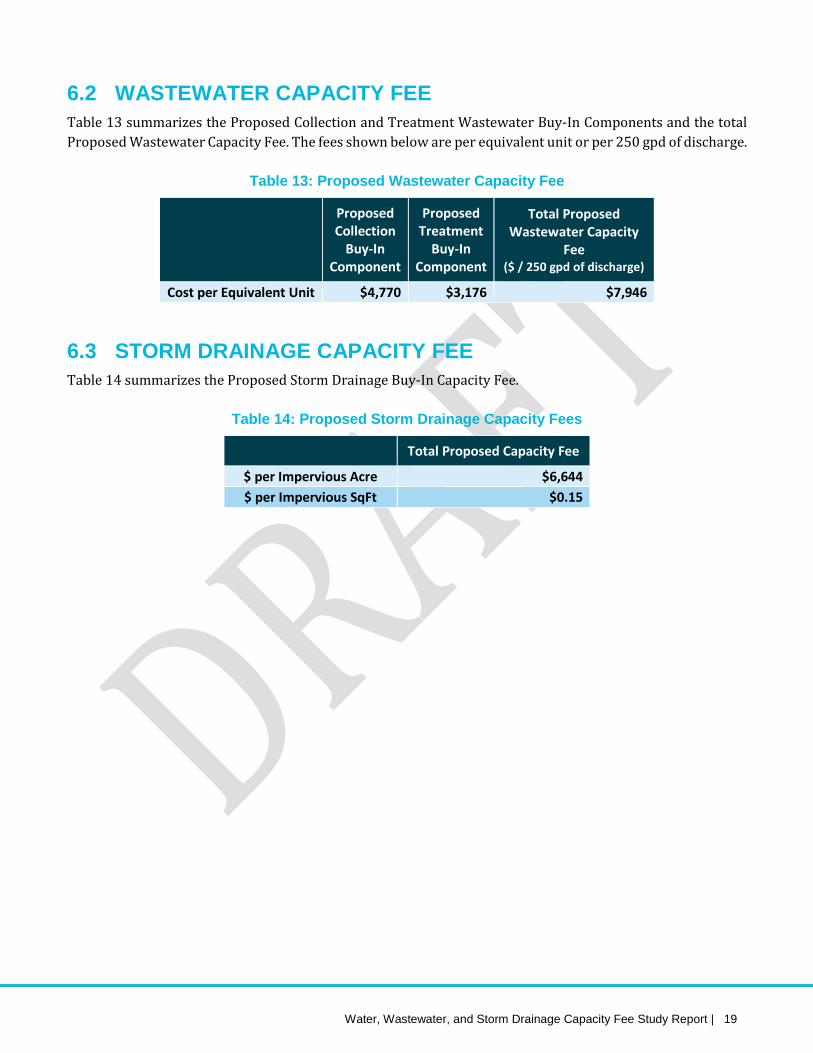
Water, Wastewater, and Storm Drainage Capacity Fee Study Report | 19
6.2 WASTEWATER CAPACITY FEE Table 13 summarizes the Proposed Collection and Treatment Wastewater Buy-In Components and the total Proposed Wastewater Capacity Fee. The fees shown below are per equivalent unit or per 250 gpd of discharge.
Table 13: Proposed Wastewater Capacity Fee
Proposed Collection
Buy-In Component
Proposed Treatment
Buy-In Component
Total Proposed Wastewater Capacity
Fee ($ / 250 gpd of discharge)
Cost per Equivalent Unit $4,770 $3,176 $7,946
6.3 STORM DRAINAGE CAPACITY FEE Table 14 summarizes the Proposed Storm Drainage Buy-In Capacity Fee.
Table 14: Proposed Storm Drainage Capacity Fees
Total Proposed Capacity Fee
$ per Impervious Acre $6,644 $ per Impervious SqFt $0.15
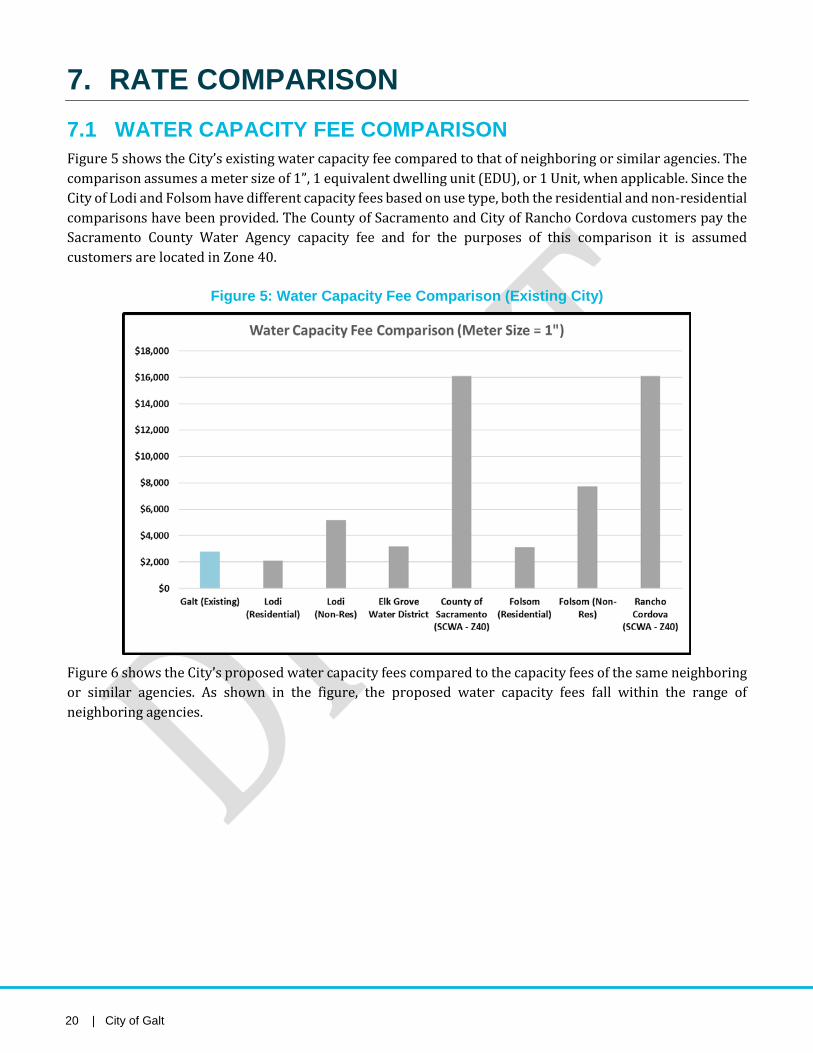
20 | City of Galt
7. RATE COMPARISON 7.1 WATER CAPACITY FEE COMPARISON Figure 5 shows the City’s existing water capacity fee compared to that of neighboring or similar agencies. The comparison assumes a meter size of 1”, 1 equivalent dwelling unit (EDU), or 1 Unit, when applicable. Since the City of Lodi and Folsom have different capacity fees based on use type, both the residential and non-residential comparisons have been provided. The County of Sacramento and City of Rancho Cordova customers pay the Sacramento County Water Agency capacity fee and for the purposes of this comparison it is assumed customers are located in Zone 40.
Figure 5: Water Capacity Fee Comparison (Existing City)
Figure 6 shows the City’s proposed water capacity fees compared to the capacity fees of the same neighboring or similar agencies. As shown in the figure, the proposed water capacity fees fall within the range of neighboring agencies.

Water, Wastewater, and Storm Drainage Capacity Fee Study Report | 21
Figure 6: Water Capacity Fee Comparison (Proposed City)
7.2 WASTEWATER CAPACITY FEE COMPARISON Figure 7 shows the City’s existing wastewater capacity fee compared to that of neighboring or similar agencies. The comparisons were based on the following assumptions:
• City of Galt – fee is per equivalent unit or per 250 gallons per day of flow • City of Lodi – fee is for a meter size of 1” • Elk Grove, County of Sacramento, and Rancho Cordova – fee includes both the SASD and SCRSD components
o SASD – Comparison assumes 1 net acre at a charge of $17,134 (Expansion Charge) o SCRSD – Comparison assumes a Single-Family residence at a charge of $5,523 (New Areas)
• City of Folsom – fee is based on the City’s collection capacity fee for a Single-Family residence of $991 plus the treatment component from SCRSD of $5,523 (assumed New Area)
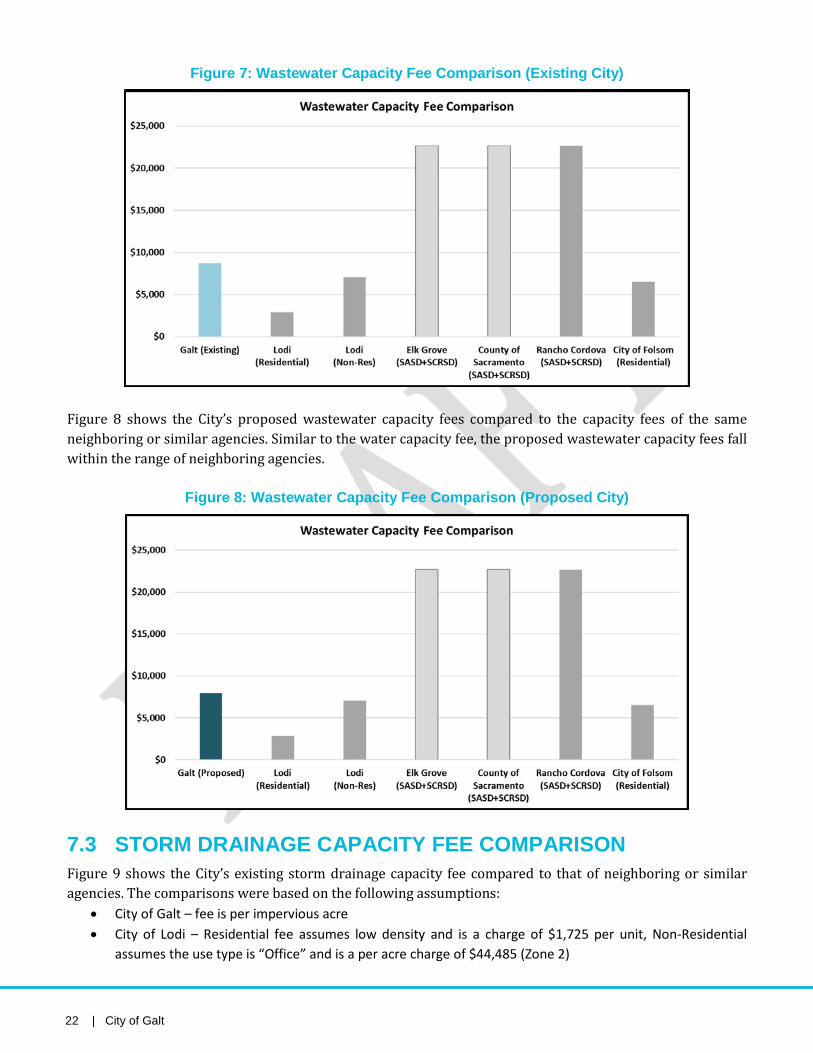
22 | City of Galt
Figure 7: Wastewater Capacity Fee Comparison (Existing City)
Figure 8 shows the City’s proposed wastewater capacity fees compared to the capacity fees of the same neighboring or similar agencies. Similar to the water capacity fee, the proposed wastewater capacity fees fall within the range of neighboring agencies.
Figure 8: Wastewater Capacity Fee Comparison (Proposed City)
7.3 STORM DRAINAGE CAPACITY FEE COMPARISON Figure 9 shows the City’s existing storm drainage capacity fee compared to that of neighboring or similar agencies. The comparisons were based on the following assumptions:
• City of Galt – fee is per impervious acre • City of Lodi – Residential fee assumes low density and is a charge of $1,725 per unit, Non-Residential
assumes the use type is “Office” and is a per acre charge of $44,485 (Zone 2)

Water, Wastewater, and Storm Drainage Capacity Fee Study Report | 23
• Elk Grove, County of Sacramento, and Rancho Cordova – RFC utilized the average of the residential fees ($14,610) as the storm drainage fees appeared to vary based on the size of the residential lot (Zone 11A)
• City of Folsom – Residential fee assumes one unit and is a charge of $958, Non-Residential assumes “Commercial” use-type and is based on a charge of $5,822
Figure 9: Storm Drainage Capacity Fee Comparison (Existing City)
Figure 10 shows the City’s proposed storm drainage capacity fees compared to the capacity fees of the same neighboring or similar agencies. Similar to the water and wastewater capacity fees, the proposed storm drainage capacity fees fall within the range of neighboring agencies.
Figure 10: Storm Drainage Capacity Fee Comparison (Proposed City)
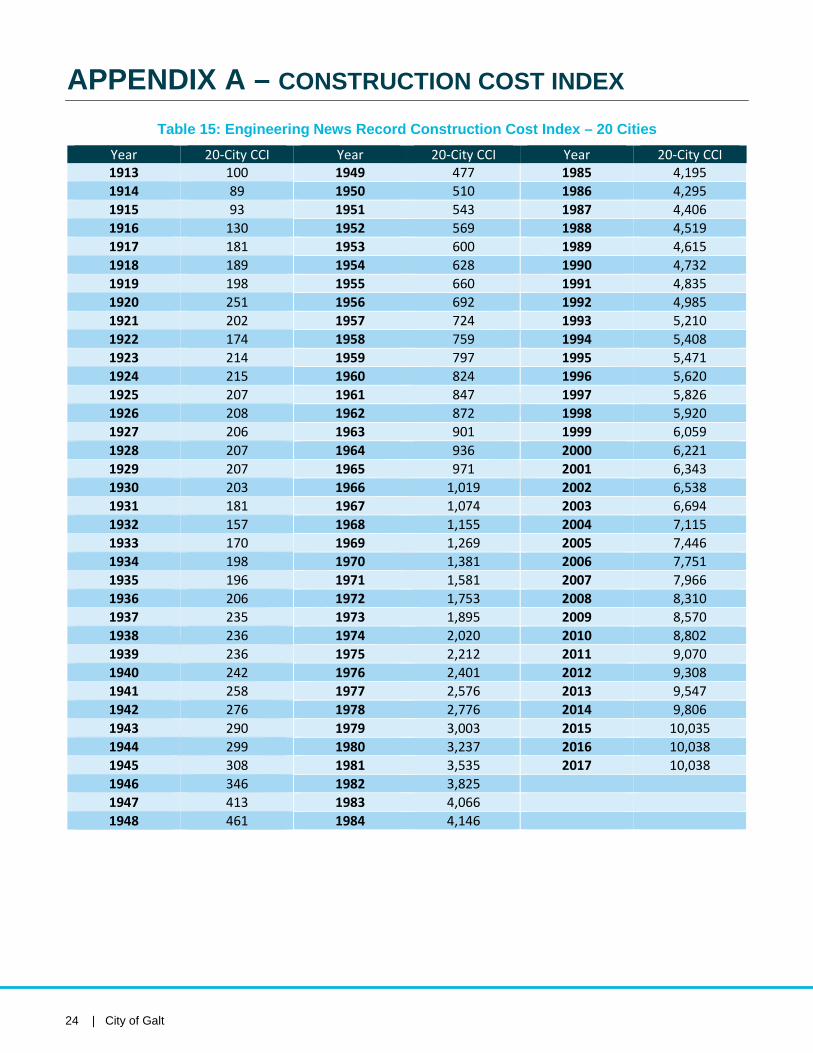
24 | City of Galt
APPENDIX A – CONSTRUCTION COST INDEX
Table 15: Engineering News Record Construction Cost Index – 20 Cities Year 20-City CCI Year 20-City CCI Year 20-City CCI 1913 100 1949 477 1985 4,195 1914 89 1950 510 1986 4,295 1915 93 1951 543 1987 4,406 1916 130 1952 569 1988 4,519 1917 181 1953 600 1989 4,615 1918 189 1954 628 1990 4,732 1919 198 1955 660 1991 4,835 1920 251 1956 692 1992 4,985 1921 202 1957 724 1993 5,210 1922 174 1958 759 1994 5,408 1923 214 1959 797 1995 5,471 1924 215 1960 824 1996 5,620 1925 207 1961 847 1997 5,826 1926 208 1962 872 1998 5,920 1927 206 1963 901 1999 6,059 1928 207 1964 936 2000 6,221 1929 207 1965 971 2001 6,343 1930 203 1966 1,019 2002 6,538 1931 181 1967 1,074 2003 6,694 1932 157 1968 1,155 2004 7,115 1933 170 1969 1,269 2005 7,446 1934 198 1970 1,381 2006 7,751 1935 196 1971 1,581 2007 7,966 1936 206 1972 1,753 2008 8,310 1937 235 1973 1,895 2009 8,570 1938 236 1974 2,020 2010 8,802 1939 236 1975 2,212 2011 9,070 1940 242 1976 2,401 2012 9,308 1941 258 1977 2,576 2013 9,547 1942 276 1978 2,776 2014 9,806 1943 290 1979 3,003 2015 10,035 1944 299 1980 3,237 2016 10,038 1945 308 1981 3,535 2017 10,038 1946 346 1982 3,825 1947 413 1983 4,066 1948 461 1984 4,146

Water, Wastewater, and Storm Drainage Capacity Fee Study Report | 25
APPENDIX B – WATER REPLACEMENT COST VALUE
Table 16: Water Asset Listing and RCLD
Asset Classification Asset Description
Asset Installed
Date
Useful Life
(Years)
Original Cost
Replacement Cost
RC Depreciation RCLD
Supply FENCE-OAK AVE WELL 6/30/1989 50 $5,521 $10,804 $5,834 $4,970
Treatment CFD WATER TREATMENT PLANT 6/30/1993 40 $4,320,792 $7,743,495 $4,452,510 $3,290,985
Treatment SHOP CORPORATION YARD 6/30/1964 10 $60,000 $744,195 $744,195 $0
Treatment FUMASI GATEWAY PLANT IMP 6/30/2000 10 $24,990 $38,953 $38,953 $0
Treatment CARILLION WTP EXPANSION 6/30/2005 50 $1,320,172 $1,844,653 $405,824 $1,438,829
Treatment WTP CONSTRUCTION 6/30/1999 40 $36,282 $61,792 $26,262 $35,531
Treatment STANDBY GENERATOR INSTALL #58I 6/30/2013 40 $27,123 $29,960 $2,247 $27,713
Treatment ROOF REPAIRS 6/30/2014 10 $5,097 $5,431 $1,086 $4,345
Treatment ROOF REPAIRS 6/30/2014 10 $5,097 $5,431 $1,086 $4,345
Treatment MSC HVAC-Bus (#50A)-05 6/30/2015 20 $1,572 $1,636 $82 $1,554
Treatment MSC HVAC-Bus (#50A)-05a 6/30/2015 20 $1,572 $1,636 $82 $1,554
Treatment NEW WTP (KOST) #51B 6/30/2014 1 $60 $64 $64 $0
Treatment WWTP ARSENIC TREATMENT #53Z 6/30/2014 1 $200,209 $213,322 $213,322 $0
Treatment WWTP ARSENIC TREATMENT #53Z 6/30/2015 1 $114,344 $118,998 $118,998 $0
Treatment ARSENIC SLUDGE REMOVAL #55A 6/30/2015 1 $3,390 $3,528 $3,528 $0
Treatment MEADOWVIEW WATERLIN UPGRD #55F 6/30/2015 1 $436,890 $454,672 $454,672 $0
Treatment WWTP Arsenic Treatment-#53Z 6/30/2016 1 $7,900 $7,900 $0 $7,900
Treatment Arsenic Sludge Removal-#55A 6/30/2016 1 $8,790 $8,790 $0 $8,790
Supply MEADOWVIEW WELL 6/30/1976 22 $30,000 $145,058 $145,058 $0
Supply EMERALD OAK DR WELL 6/30/1983 22 $160,000 $362,601 $362,601 $0
Supply SIMMERHORN RD WELL 6/30/1974 22 $40,000 $229,890 $229,890 $0
General 4TH ST F & H STS 6/30/1988 22 $9,620 $19,476 $19,476 $0
General JOY AIR COMPRESSOR 6/30/1985 10 $12,867 $29,551 $29,551 $0
General COMPUTER SYSTEM FMI 6/30/1987 4 $5,602 $11,345 $11,345 $0
General BOBCAT LOADER 6/30/1994 10 $11,536 $20,508 $20,508 $0
General VHS TURBIN PUMP MOTOR 150 6/30/1994 10 $11,376 $20,223 $20,223 $0
General 1990 CHEV 3/4 TON #908 6/30/1991 5 $14,135 $26,374 $26,374 $0
General SULLIVAN AIR COMPRESSER 6/30/1995 10 $6,150 $10,887 $10,887 $0
Distribution COMMERCIAL WATER METER 6/30/1995 22 $163,783 $289,932 $276,754 $13,179
Distribution COMM WATER METER 6/30/1996 22 $20,711 $36,268 $32,971 $3,297
General GMC 1/2 TON PU #951 6/30/1995 5 $14,058 $24,886 $24,886 $0
General 1990 CHEVY PU #902 6/30/2000 5 $9,413 $14,672 $14,672 $0
General CASE 590 SUPER M BACKHOE 6/30/2005 5 $22,466 $31,391 $31,391 $0
General 2005 CHEV PU #05-6 6/30/2005 5 $8,250 $11,528 $11,528 $0

26 | City of Galt
Asset Classification Asset Description
Asset Installed
Date
Useful Life
(Years)
Original Cost
Replacement Cost
RC Depreciation RCLD
General 1992 GMC AG-CHEM SLDG TK#921 6/30/1993 5 $12,468 $22,345 $22,345 $0
General TOWNMASTER TRAILER T-20 6/30/1993 10 $4,396 $7,879 $7,879 $0
General CRM AIR COMPRESSOR 6/30/2000 10 $4,086 $6,369 $6,369 $0
General COMMERCIAL SHELVING 6/30/2001 10 $3,480 $5,461 $5,461 $0
General 2001 DODGE DUMP TRUCK 6/30/2001 5 $10,308 $16,174 $16,174 $0
General 1999 CLARK FORKLIFT 6/30/2002 5 $4,213 $6,398 $6,398 $0
General 2001 DODGE RAM #01-7 6/30/2002 5 $6,193 $9,405 $9,405 $0
General UTILITY BOX & SERVICE CRANE 6/30/2002 10 $4,985 $7,571 $7,571 $0
Distribution WATER MAIN IMPROVEMENTS 6/30/2002 22 $33,114 $50,290 $32,002 $18,287
Transmission GALT INTERCHANGE 6/30/2003 10 $0 $0 $0 $0
General 2003 CHEVY 1TON UNIT #03-3 6/30/2004 5 $8,919 $12,584 $12,584 $0
General 2004 GMC PU UNIT #04-3 6/30/2004 5 $6,180 $8,720 $8,720 $0
General 1998 CASE TRACTOR #982 6/30/1999 5 $22,803 $38,836 $38,836 $0
General 2006 FORD F450 W/ CRANE #06-1 6/30/2006 5 $41,988 $56,563 $56,563 $0
General ASPHAULT MACHINE 6/30/2006 10 $17,765 $23,932 $23,932 $0
General 2006 FORD F250 #05-08 6/30/2006 5 $7,886 $10,624 $10,624 $0
General 2006 FORD F450 #05-09 6/30/2006 5 $9,648 $12,997 $12,997 $0
Distribution HANDHELD METER READER SYSTEM 6/30/2007 10 $11,513 $14,695 $13,225 $1,469
General 2008 SSTERLING DUMP TRK #07-06 6/30/2008 5 $26,611 $32,995 $32,995 $0
General 2008 FORD F-250 #08-1 6/30/2008 5 $24,774 $30,718 $30,718 $0
General INTERACTIVE VOICE MSG SYSTEM 6/30/2008 25 $21,363 $26,488 $8,476 $18,012
Supply CARILLION WELL REHAB 6/30/2010 10 $27,213 $31,924 $19,154 $12,770
Treatment ARSENIC TREATMENT 6/30/2010 22 $797,116 $935,103 $255,028 $680,075
Treatment ARSENIC TREATMENT IMPRV 6/30/2008 22 $182,618 $226,431 $82,339 $144,093
Treatment ARSENCI TREATMENT 6/30/2009 22 $978,462 $1,166,516 $371,164 $795,352
Supply QUAIL HOLLOW WELL #13 REHAB 6/30/2008 10 $28,630 $35,499 $28,399 $7,100
Supply WELL REHAB QUAIL HOLLOW #13 6/30/2009 10 $16,009 $19,086 $13,360 $5,726
Treatment ARSENIC TREATMENT 6/30/2011 22 $17,000 $19,400 $4,409 $14,991
General 2012 FORD F250 REG CAB #12-1 6/30/2012 5 $6,783 $7,618 $6,094 $1,524
General SKIP LOADER 6/30/2013 10 $22,262 $24,590 $7,377 $17,213
General SKIP LOADER 6/30/2013 10 $22,262 $24,590 $7,377 $17,213
General 2014 FORD F150 P/U W/LIGHTBAR 6/30/2014 5 $17,914 $19,087 $7,635 $11,452
General 2014 FORD F150 P/U W/LIGHT BAR 6/30/2014 5 $9,161 $9,761 $3,905 $5,857
General 2014 RAM 1500 2WD CREW CAB 6/30/2014 5 $5,200 $5,541 $2,216 $3,324
General 2015 Ford F150-Bus-05 6/30/2015 5 $6,424 $6,686 $1,337 $5,348
General CASE 580SN, TIER 41 BCKHO LODR 6/30/2015 10 $66,415 $69,118 $6,912 $62,206
General SCADA SYSTEM INSTALL 6/30/2010 22 $1,160 $1,361 $371 $990
General 2016 Ford F250 - Unit 16-2 6/30/2016 5 $1,132 $1,132 $0 $1,132
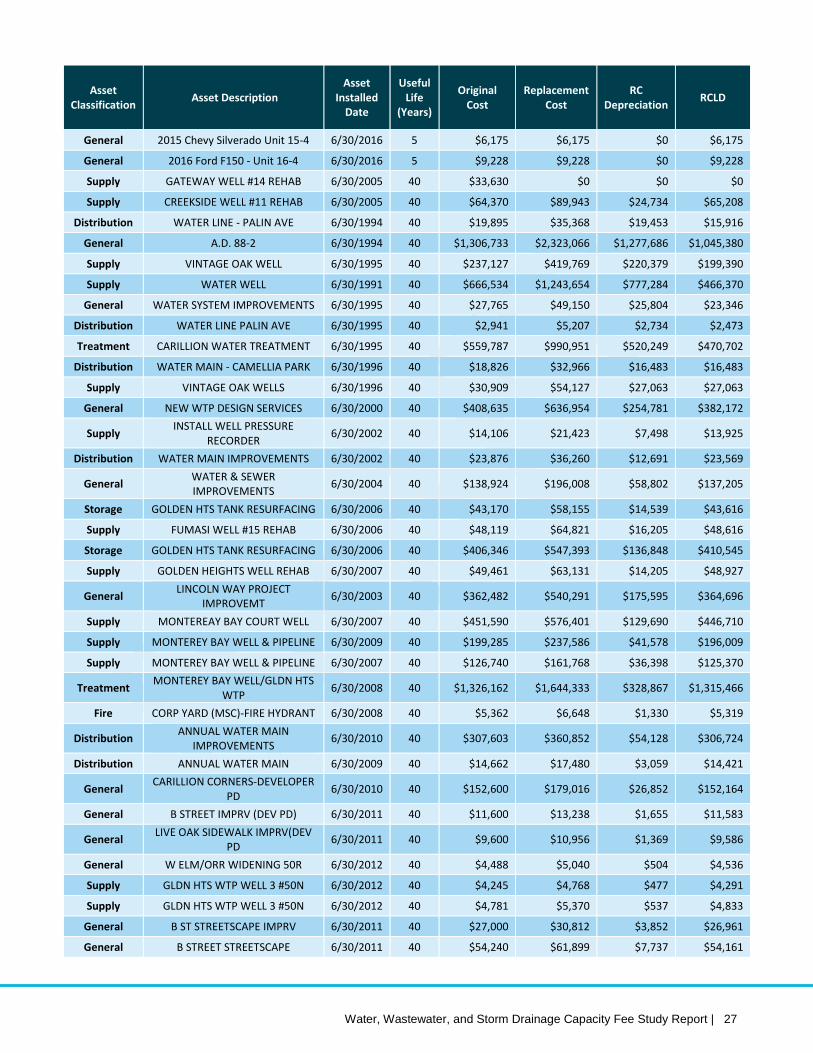
Water, Wastewater, and Storm Drainage Capacity Fee Study Report | 27
Asset Classification Asset Description
Asset Installed
Date
Useful Life
(Years)
Original Cost
Replacement Cost
RC Depreciation RCLD
General 2015 Chevy Silverado Unit 15-4 6/30/2016 5 $6,175 $6,175 $0 $6,175
General 2016 Ford F150 - Unit 16-4 6/30/2016 5 $9,228 $9,228 $0 $9,228
Supply GATEWAY WELL #14 REHAB 6/30/2005 40 $33,630 $0 $0 $0
Supply CREEKSIDE WELL #11 REHAB 6/30/2005 40 $64,370 $89,943 $24,734 $65,208
Distribution WATER LINE - PALIN AVE 6/30/1994 40 $19,895 $35,368 $19,453 $15,916
General A.D. 88-2 6/30/1994 40 $1,306,733 $2,323,066 $1,277,686 $1,045,380
Supply VINTAGE OAK WELL 6/30/1995 40 $237,127 $419,769 $220,379 $199,390
Supply WATER WELL 6/30/1991 40 $666,534 $1,243,654 $777,284 $466,370
General WATER SYSTEM IMPROVEMENTS 6/30/1995 40 $27,765 $49,150 $25,804 $23,346
Distribution WATER LINE PALIN AVE 6/30/1995 40 $2,941 $5,207 $2,734 $2,473
Treatment CARILLION WATER TREATMENT 6/30/1995 40 $559,787 $990,951 $520,249 $470,702
Distribution WATER MAIN - CAMELLIA PARK 6/30/1996 40 $18,826 $32,966 $16,483 $16,483
Supply VINTAGE OAK WELLS 6/30/1996 40 $30,909 $54,127 $27,063 $27,063
General NEW WTP DESIGN SERVICES 6/30/2000 40 $408,635 $636,954 $254,781 $382,172
Supply INSTALL WELL PRESSURE RECORDER 6/30/2002 40 $14,106 $21,423 $7,498 $13,925
Distribution WATER MAIN IMPROVEMENTS 6/30/2002 40 $23,876 $36,260 $12,691 $23,569
General WATER & SEWER IMPROVEMENTS 6/30/2004 40 $138,924 $196,008 $58,802 $137,205
Storage GOLDEN HTS TANK RESURFACING 6/30/2006 40 $43,170 $58,155 $14,539 $43,616
Supply FUMASI WELL #15 REHAB 6/30/2006 40 $48,119 $64,821 $16,205 $48,616
Storage GOLDEN HTS TANK RESURFACING 6/30/2006 40 $406,346 $547,393 $136,848 $410,545
Supply GOLDEN HEIGHTS WELL REHAB 6/30/2007 40 $49,461 $63,131 $14,205 $48,927
General LINCOLN WAY PROJECT IMPROVEMT 6/30/2003 40 $362,482 $540,291 $175,595 $364,696
Supply MONTEREAY BAY COURT WELL 6/30/2007 40 $451,590 $576,401 $129,690 $446,710
Supply MONTEREY BAY WELL & PIPELINE 6/30/2009 40 $199,285 $237,586 $41,578 $196,009
Supply MONTEREY BAY WELL & PIPELINE 6/30/2007 40 $126,740 $161,768 $36,398 $125,370
Treatment MONTEREY BAY WELL/GLDN HTS WTP 6/30/2008 40 $1,326,162 $1,644,333 $328,867 $1,315,466
Fire CORP YARD (MSC)-FIRE HYDRANT 6/30/2008 40 $5,362 $6,648 $1,330 $5,319
Distribution ANNUAL WATER MAIN IMPROVEMENTS 6/30/2010 40 $307,603 $360,852 $54,128 $306,724
Distribution ANNUAL WATER MAIN 6/30/2009 40 $14,662 $17,480 $3,059 $14,421
General CARILLION CORNERS-DEVELOPER PD 6/30/2010 40 $152,600 $179,016 $26,852 $152,164
General B STREET IMPRV (DEV PD) 6/30/2011 40 $11,600 $13,238 $1,655 $11,583
General LIVE OAK SIDEWALK IMPRV(DEV PD 6/30/2011 40 $9,600 $10,956 $1,369 $9,586
General W ELM/ORR WIDENING 50R 6/30/2012 40 $4,488 $5,040 $504 $4,536
Supply GLDN HTS WTP WELL 3 #50N 6/30/2012 40 $4,245 $4,768 $477 $4,291
Supply GLDN HTS WTP WELL 3 #50N 6/30/2012 40 $4,781 $5,370 $537 $4,833
General B ST STREETSCAPE IMPRV 6/30/2011 40 $27,000 $30,812 $3,852 $26,961
General B STREET STREETSCAPE 6/30/2011 40 $54,240 $61,899 $7,737 $54,161
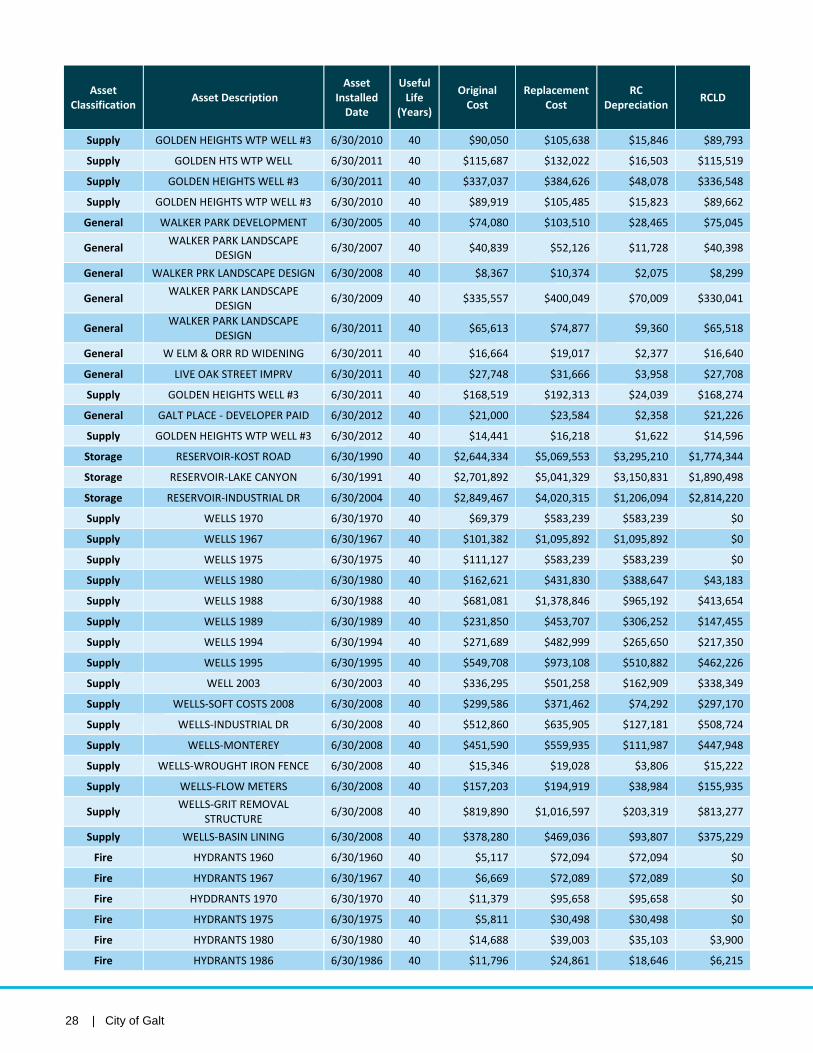
28 | City of Galt
Asset Classification Asset Description
Asset Installed
Date
Useful Life
(Years)
Original Cost
Replacement Cost
RC Depreciation RCLD
Supply GOLDEN HEIGHTS WTP WELL #3 6/30/2010 40 $90,050 $105,638 $15,846 $89,793
Supply GOLDEN HTS WTP WELL 6/30/2011 40 $115,687 $132,022 $16,503 $115,519
Supply GOLDEN HEIGHTS WELL #3 6/30/2011 40 $337,037 $384,626 $48,078 $336,548
Supply GOLDEN HEIGHTS WTP WELL #3 6/30/2010 40 $89,919 $105,485 $15,823 $89,662
General WALKER PARK DEVELOPMENT 6/30/2005 40 $74,080 $103,510 $28,465 $75,045
General WALKER PARK LANDSCAPE DESIGN 6/30/2007 40 $40,839 $52,126 $11,728 $40,398
General WALKER PRK LANDSCAPE DESIGN 6/30/2008 40 $8,367 $10,374 $2,075 $8,299
General WALKER PARK LANDSCAPE DESIGN 6/30/2009 40 $335,557 $400,049 $70,009 $330,041
General WALKER PARK LANDSCAPE DESIGN 6/30/2011 40 $65,613 $74,877 $9,360 $65,518
General W ELM & ORR RD WIDENING 6/30/2011 40 $16,664 $19,017 $2,377 $16,640
General LIVE OAK STREET IMPRV 6/30/2011 40 $27,748 $31,666 $3,958 $27,708
Supply GOLDEN HEIGHTS WELL #3 6/30/2011 40 $168,519 $192,313 $24,039 $168,274
General GALT PLACE - DEVELOPER PAID 6/30/2012 40 $21,000 $23,584 $2,358 $21,226
Supply GOLDEN HEIGHTS WTP WELL #3 6/30/2012 40 $14,441 $16,218 $1,622 $14,596
Storage RESERVOIR-KOST ROAD 6/30/1990 40 $2,644,334 $5,069,553 $3,295,210 $1,774,344
Storage RESERVOIR-LAKE CANYON 6/30/1991 40 $2,701,892 $5,041,329 $3,150,831 $1,890,498
Storage RESERVOIR-INDUSTRIAL DR 6/30/2004 40 $2,849,467 $4,020,315 $1,206,094 $2,814,220
Supply WELLS 1970 6/30/1970 40 $69,379 $583,239 $583,239 $0
Supply WELLS 1967 6/30/1967 40 $101,382 $1,095,892 $1,095,892 $0
Supply WELLS 1975 6/30/1975 40 $111,127 $583,239 $583,239 $0
Supply WELLS 1980 6/30/1980 40 $162,621 $431,830 $388,647 $43,183
Supply WELLS 1988 6/30/1988 40 $681,081 $1,378,846 $965,192 $413,654
Supply WELLS 1989 6/30/1989 40 $231,850 $453,707 $306,252 $147,455
Supply WELLS 1994 6/30/1994 40 $271,689 $482,999 $265,650 $217,350
Supply WELLS 1995 6/30/1995 40 $549,708 $973,108 $510,882 $462,226
Supply WELL 2003 6/30/2003 40 $336,295 $501,258 $162,909 $338,349
Supply WELLS-SOFT COSTS 2008 6/30/2008 40 $299,586 $371,462 $74,292 $297,170
Supply WELLS-INDUSTRIAL DR 6/30/2008 40 $512,860 $635,905 $127,181 $508,724
Supply WELLS-MONTEREY 6/30/2008 40 $451,590 $559,935 $111,987 $447,948
Supply WELLS-WROUGHT IRON FENCE 6/30/2008 40 $15,346 $19,028 $3,806 $15,222
Supply WELLS-FLOW METERS 6/30/2008 40 $157,203 $194,919 $38,984 $155,935
Supply WELLS-GRIT REMOVAL STRUCTURE 6/30/2008 40 $819,890 $1,016,597 $203,319 $813,277
Supply WELLS-BASIN LINING 6/30/2008 40 $378,280 $469,036 $93,807 $375,229
Fire HYDRANTS 1960 6/30/1960 40 $5,117 $72,094 $72,094 $0
Fire HYDRANTS 1967 6/30/1967 40 $6,669 $72,089 $72,089 $0
Fire HYDDRANTS 1970 6/30/1970 40 $11,379 $95,658 $95,658 $0
Fire HYDRANTS 1975 6/30/1975 40 $5,811 $30,498 $30,498 $0
Fire HYDRANTS 1980 6/30/1980 40 $14,688 $39,003 $35,103 $3,900
Fire HYDRANTS 1986 6/30/1986 40 $11,796 $24,861 $18,646 $6,215

Water, Wastewater, and Storm Drainage Capacity Fee Study Report | 29
Asset Classification Asset Description
Asset Installed
Date
Useful Life
(Years)
Original Cost
Replacement Cost
RC Depreciation RCLD
Fire HYDRANTS 1988 6/30/1988 40 $45,329 $91,768 $64,238 $27,531
Fire HYDRANTS 1989 6/30/1989 40 $31,963 $62,548 $42,220 $20,328
Fire HYDRANTS 1990 6/30/1990 40 $13,561 $25,998 $16,899 $9,099
Fire HYDRANTS 1992 6/30/1992 40 $1,191 $2,197 $1,318 $879
Fire HYDRANTS 1994 6/30/1994 40 $13,561 $24,108 $13,260 $10,849
Fire HYDRANTS 1995 6/30/1995 40 $73,170 $129,528 $68,002 $61,526
Fire HYDRANTS 1996 6/30/1996 40 $63,754 $111,643 $55,821 $55,821
Fire HYDRANTS 1997 6/30/1997 40 $80,701 $139,189 $66,115 $73,074
Fire HYDRANTS 2003 6/30/2003 40 $58,352 $86,975 $28,267 $58,708
Fire HYDRANTS 2004 6/30/2004 40 $9,346 $13,186 $3,956 $9,230
Fire HYDRANTS-CREEKSIDE 2 6/30/2007 40 $3,708 $4,733 $1,065 $3,668
Fire HYDRANTS-RIVER OAKS 3A 6/30/2007 40 $21,150 $26,995 $6,074 $20,921
Fire HYDRANTS-THE MEADOW 6/30/2007 40 $3,708 $4,733 $1,065 $3,668
Fire HYDRANTS-SOFT COSTS 2007 6/30/2007 40 $3,665 $4,678 $1,053 $3,625
Fire HYDRANTS-SOFT COSTS 2008 6/30/2008 40 $5,247 $6,506 $1,301 $5,205
Fire HYDRANTS-COUNTRYSIDE 2 6/30/2008 40 $8,400 $10,415 $2,083 $8,332
Fire HYDRANTS-CREEKSIDE 4 6/30/2008 40 $32,500 $40,297 $8,059 $32,238
Distribution WTR LINES 1960 6/30/1960 40 $177,716 $2,503,863 $2,503,863 $0
Distribution WTR LINES 1967 6/30/1967 40 $324,346 $3,506,029 $3,506,029 $0
Distribution WTR LINES 1970 6/30/1970 40 $491,584 $4,132,523 $4,132,523 $0
Distribution WTR LINES 1975 6/30/1975 40 $206,457 $1,083,567 $1,083,567 $0
Distribution WTR LINES 1980 6/30/1980 40 $391,896 $1,040,653 $936,588 $104,065
Distribution WTR LINES 1986 6/30/1986 40 $369,933 $779,662 $584,747 $194,916
Distribution WTR LINES 1988 6/30/1988 40 $1,352,969 $2,739,082 $1,917,358 $821,725
Distribution WTR LINES 1989 6/30/1989 40 $874,905 $1,712,101 $1,155,668 $556,433
Distribution WTR LINES 1990 6/30/1990 40 $421,980 $808,994 $525,846 $283,148
Distribution WTR LINES 1992 6/30/1992 40 $135,190 $249,328 $149,597 $99,731
Distribution WTR LINES 1994 6/30/1994 40 $629,096 $1,118,386 $615,112 $503,274
Distribution WTR LINES 1995 6/30/1995 40 $2,685,793 $4,754,467 $2,496,095 $2,258,372
Distribution WTR LINES 1996 6/30/1996 40 $2,303,570 $4,033,896 $2,016,948 $2,016,948
Distribution WTR LINES 1997 6/30/1997 40 $2,170,702 $3,743,921 $1,778,363 $1,965,559
Distribution WTR LINES 2003 6/30/2003 40 $2,212,081 $3,297,173 $1,071,581 $2,225,592
Distribution WTR LINES 2004 6/30/2004 40 $641,005 $904,394 $271,318 $633,076
Distribution WTR LINES-CREEKSIDE 2 6/30/2007 40 $34,215 $43,671 $9,826 $33,845
Distribution WTR LINES-FIELD 18 6/30/2007 40 $2,817 $3,596 $809 $2,787
Distribution WTR LINES-RIVEROAKS A 6/30/2007 40 $147,205 $187,890 $42,275 $145,614
Distribution WTR LINES-THE MEADOW 6/30/2007 40 $34,226 $43,685 $9,829 $33,856
Distribution WTR LINES-SOFT COSTS 2007 6/30/2007 40 $28,026 $35,772 $8,049 $27,723
Distribution WTR LINES-SOFT COSTS 2008 6/30/2008 40 $21,618 $26,805 $5,361 $21,444
Distribution WTR LINES-COUNTRYSIDE 2 6/30/2008 40 $13,200 $16,367 $3,273 $13,094

30 | City of Galt
Asset Classification Asset Description
Asset Installed
Date
Useful Life
(Years)
Original Cost
Replacement Cost
RC Depreciation RCLD
Distribution WTR LINES-CREEKSIDE 4 6/30/2008 40 $155,304 $192,564 $38,513 $154,051
Treatment FILTER SYSTEM REHAB 6/30/2011 22 $209,366 $238,928 $54,302 $184,626
Transmission CENTRAL GALT INTERCHANGE 6/30/2014 40 $63,390 $67,542 $3,377 $64,165
General WELL REHAB #58H 6/30/2014 40 $183,691 $195,723 $9,786 $185,936
General GOLDEN HEIGHTS WELL 6/30/2010 40 $12,292 $14,419 $2,163 $12,257
General MONTEREY BAY WELL/GLDN.HTS WTP 6/30/2011 40 $332,345 $379,272 $47,409 $331,863
General MONT BAY WELL/GLN HTS WTP 56E 6/30/2012 40 $957,938 $1,075,819 $107,582 $968,237
General MONT BAY WELL/GLDN HTS WTP 56E 6/30/2013 40 $19,071 $21,066 $1,580 $19,486
General MONT BAY/GLDN HGHTS WELL #56E 6/30/2014 40 $29,801 $31,753 $1,588 $30,165
Treatment MONTEREY BY/GOLDEN HEIGHTS WTP 6/30/2015 40 $5,820 $6,057 $151 $5,905
Treatment MNTRY BY/GOLDN HGHTS WTP #56E 6/30/2015 40 $4,800 $4,995 $125 $4,870
Supply WELL REHAB #58H 6/30/2015 40 $152,212 $158,407 $3,960 $154,447
Supply GOLDEN HEIGHTS WELL 6/30/2010 40 $115,579 $135,587 $20,338 $115,249
Treatment MONT BAY/GLDN HTS WTP 56E 6/30/2012 40 $1,564,042 $1,756,508 $175,651 $1,580,857
Distribution WATER METER RETROFIT #56F 6/30/2014 15 $411,630 $438,590 $58,479 $380,112
Distribution WATER METER RETROFIT #56F 6/30/2014 15 $623 $664 $89 $576
Distribution WATER CAPACITY IMPROVMNTS #53G 6/30/2015 40 $691,531 $719,677 $17,992 $701,685
Distribution Water Capacity Imp-#53G 6/30/2016 40 $9,849 $9,849 $0 $9,849
Distribution WATER METER RETROFIT #56F 6/30/2015 15 $921,068 $958,556 $63,904 $894,653
Distribution WATER METER RETROFIT #56F 6/30/2015 15 $2,642,873 $2,750,439 $183,363 $2,567,077
Distribution Water Meter Retrofit-#56F 6/30/2016 15 $403,625 $403,625 $0 $403,625
Distribution Water Meter Retrofit-56F 6/30/2016 15 $19,557 $19,557 $0 $19,557
Supply MB Well/Golden Hts-#56E 6/30/2016 40 $7,290 $7,290 $0 $7,290
Supply Well Rehab Monterrey Bay-#58H 6/30/2016 40 $72,793 $72,793 $0 $72,793
Land OAK AVE WELLSITE 6/30/1966 0 $15,000 $40,374 $0 $40,374
Land C ST WATER TOWER 6/30/1996 0 $17,000 $25,261 $0 $25,261
Land EMERALD OAK WELLSITE 6/30/1981 0 $15,000 $29,998 $0 $29,998
Land ELM STREET WELLSITE 6/30/1966 0 $5,000 $13,458 $0 $13,458
Land CORPORATION YARD 6/30/1968 0 $42,500 $109,950 $0 $109,950
Land LAND FOR WATER TANK SITE 6/30/1992 0 $180,085 $289,655 $0 $289,655
Land KOST ROAD WATER TANK 6/30/1992 0 $101,916 $163,925 $0 $163,925
Treatment INDUSTRIAL PRK WTP (LiveOak) 6/30/2010 40 $138,438 $162,403 $24,360 $138,042
Supply LIVE OAK WTP & WELL 6/30/2008 40 $27,607 $34,231 $6,846 $27,385
Supply LIVE OAK WTP & WELL 6/30/2006 40 $52,493 $70,714 $17,679 $53,036
Supply LIVE OAK WTP & WELL 6/30/2007 40 $385,770 $492,389 $110,787 $381,601
Treatment INDUSTRIAL PARK WTP 6/30/2008 40 $45,544 $56,471 $11,294 $45,176
Treatment INDUSTRIAL PARK WTP 6/30/2009 40 $75,642 $90,180 $15,781 $74,398
Supply LIVEOAK WTP & WELL 6/30/2005 40 $88,608 $123,811 $34,048 $89,763

Water, Wastewater, and Storm Drainage Capacity Fee Study Report | 31
Asset Classification Asset Description
Asset Installed
Date
Useful Life
(Years)
Original Cost
Replacement Cost
RC Depreciation RCLD
Supply LIVE OAK WTP & WELL 6/30/2006 40 $378,312 $509,629 $127,407 $382,222
Supply LIVE OAK WTP & WELL 6/30/2007 40 $1,689,042 $2,155,860 $485,068 $1,670,791
Supply WATER WELL INSTALL(KOST/NE) 6/30/2009 1 $6,524 $7,778 $7,778 $0
Supply KOST WELL DESIGN/CONST 6/30/2010 1 $221,779 $260,171 $260,171 $0
Supply KOST ROAD WELL (NEW) 51C 6/30/2012 1 $20,862 $23,430 $23,430 $0
Supply KOST ROAD WELL (NEW) 51C 6/30/2013 1 $25,880 $28,587 $28,587 $0
Supply NEW WELL KOST RD #51C 6/30/2014 1 $4,970 $5,296 $5,296 $0
Distribution WATER METER READING EQUIPMENT 6/30/2001 10 $5,926 $9,299 $9,299 $0
General 2001 DODGE DAKOTA PU 6/30/2001 5 $17,061 $26,769 $26,769 $0
Fire MARKET HYDRANT UPGRADE 6/30/2001 10 $31,081 $48,767 $48,767 $0
General SCADA SYSTEM 6/30/2005 10 $12,448 $17,393 $17,393 $0
Distribution WATER MAIN IMPROVEMENTS 6/30/2002 10 $1,360 $2,066 $2,066 $0
General 2004 DODGE DAKOTA UNIT #04-1 6/30/2004 5 $9,026 $12,734 $12,734 $0
General SCADA SYSTEM 6/30/2006 10 $23,725 $31,960 $31,960 $0
Distribution METER INSTALL 6/30/2007 22 $10,650 $13,594 $5,561 $8,033
General SCADA SYSTEM INSTALL 6/30/2007 10 $4,326 $5,522 $4,970 $552
Treatment ARSENIC TREATMENT 6/30/2010 22 $66,786 $78,347 $21,367 $56,980
Treatment ARSENIC TREATMENT 6/30/2009 22 $29,674 $35,377 $11,256 $24,121
Treatment ARSENIC TREATMENT 6/30/2011 22 $17,000 $19,400 $4,409 $14,991
General SCADA SYSTEM 6/30/2008 22 $101,252 $125,544 $45,653 $79,892
General SCADA SYSTEM 6/30/2008 22 $6,363 $7,890 $2,869 $5,021
General SCADA SYSTEM INSTALL 6/30/2010 22 $6,250 $7,332 $2,000 $5,332
Distribution C STREET WATER MAIN 6/30/1994 40 $36,500 $64,888 $35,689 $29,200
Distribution LIVE OAK TEST HOLE 6/30/2000 40 $10,158 $15,834 $6,333 $9,500
Pumping WATER STORAGE PUMP STATION 6/30/2001 40 $331,597 $520,289 $195,108 $325,181
General A STREET MAIN @ R/R 6/30/1999 40 $41,314 $70,361 $29,903 $40,457
Storage RESEVOIR CONSTRUCTION 6/30/2002 40 $1,092,016 $1,658,416 $580,446 $1,077,971
Distribution WATER MAIN IMPROVEMENTS 6/30/2002 40 $33,432 $50,772 $17,770 $33,002
General OLD TOWN PROJECT 6/30/2003 40 $4,876 $7,268 $2,362 $4,906
General WATER & SEWER IMPROVEMENTS 6/30/2004 40 $443,657 $625,956 $187,787 $438,170
Storage RESEVOIR CONST - IND AREA 6/30/2007 40 $6,271 $8,004 $1,801 $6,203
General LIINCOLN WAY PROJECT IMPROVEMT 6/30/2003 40 $417,075 $621,662 $202,040 $419,622
Supply GLDN HTS WTP WELL 3 #50N 6/30/2012 40 $5,415 $6,081 $608 $5,473
Supply GOLDEN HEIGHTS WELL #3 6/30/2011 40 $168,519 $192,313 $24,039 $168,274
Supply GOLDEN HEIGHTS WTP WELL 6/30/2011 40 $26,080 $29,762 $3,720 $26,042
Supply GOLDEN HEIGHTS WTP WELL 6/30/2011 40 $70,953 $80,971 $10,121 $70,850
Supply WELLS 1967 6/30/1967 40 $6,530 $70,585 $70,585 $0
Supply MONTEREY BAY WELL/GLDN HTS WTP 6/30/2011 40 $115,589 $131,910 $16,489 $115,421

32 | City of Galt
Asset Classification Asset Description
Asset Installed
Date
Useful Life
(Years)
Original Cost
Replacement Cost
RC Depreciation RCLD
Supply MONT BAY WELL/GLDN HTS WTP 56E 6/30/2012 40 $304,757 $342,259 $34,226 $308,033
Supply MONT BAY WELL/GLDN HTS WTP 56E 6/30/2013 40 $43,795 $48,376 $3,628 $44,748
Supply MONT BAY WELL/GLDN HTS WTP 56E 6/30/2013 40 $57,346 $63,344 $4,751 $58,593
Supply MONT BAY/GOLDEN HEIGHTS #56E 6/30/2014 40 $31,997 $34,093 $1,705 $32,388
Supply MONT BAY WELL/GLDN HTS WTP 56E 6/30/2014 40 $6,442 $6,864 $343 $6,521
Distribution WATER CAPACITY IMPRVMNTS #53G 6/30/2014 40 $13,240 $14,107 $705 $13,402
Distribution WATER METER RETROFIT 6/30/2008 15 $56,648 $70,239 $37,461 $32,778
Distribution WATER METER RETROFIT 6/30/2009 15 $3,120 $3,720 $1,736 $1,984
Distribution WATER METER RETROFIT 6/30/2011 15 $1,530 $1,746 $582 $1,164
Distribution WATER METER RETROFIT 6/30/2010 15 $12,216 $14,331 $5,732 $8,598
Total $63,908,451 $109,293,164 $55,779,061 $53,514,104

Water, Wastewater, and Storm Drainage Capacity Fee Study Report | 33
APPENDIX C – WASTEWATER REPLACEMENT COST VALUE
Table 17: Wastewater Asset Listing and RCLD
Asset Classification Description
Asset Installed
Date
Useful Life
(Years) Original Cost Replacement
Cost RC
Depreciation RCLD
Pumping SEWER LIFT STATION 6/30/2000 20 $107,773 $167,990 $134,392 $33,598
Pumping CHABOLLA LIFT STATION IMPRVMTS 6/30/1999 20 $47,330 $80,607 $68,516 $12,091
Storage HAZARDOUS MATERIAL STORGE BLDG 6/30/2007 25 $7,250 $9,254 $3,332 $5,923
Storage HAZMAT STORAGE SHED 6/30/2008 25 $7,217 $8,948 $2,863 $6,085
Treatment WWTP CAPITAL MAINTENANCE #53D 6/30/2013 40 $7,521 $8,307 $623 $7,684
Treatment BLDG IMPRV - ROOFING 6/30/2014 10 $5,097 $5,431 $1,086 $4,345
Treatment BLDG IMPRV - ROOFING #50A 6/30/2014 10 $5,097 $5,431 $1,086 $4,345
Treatment MSC HVAC-Bus (#50A)-07 6/30/2015 20 $1,572 $1,636 $82 $1,554
Treatment MSC HVAC-Bus (#50A)-07a 6/30/2015 20 $1,572 $1,636 $82 $1,554
Treatment WWTP BIOSOLIDS UPGRADE 6/30/2011 40 $763,627 $871,450 $108,931 $762,519
Treatment WWTP BIOSOLIDS UPGRADE 56H 6/30/2012 40 $21,237 $23,850 $2,385 $21,465
Treatment TERT/UV DISINF #56H 6/30/2012 40 $65,443 $73,497 $7,350 $66,147
Treatment WWTP UPGRADE 6/30/2010 40 $21,197 $24,867 $3,730 $21,137
Treatment TERT/UV DISNF (WWTP UPGRADE) 6/30/2010 40 $5,389,314 $6,322,245 $948,337 $5,373,908
Treatment TERT/UV DISINF (WWTP UPGRADE) 6/30/2011 40 $7,946,375 $9,068,395 $1,133,549 $7,934,846
Treatment WWTP UPGRADE 6/30/2007 40 $112,846 $144,035 $32,408 $111,627
Treatment WWTP UPGRADE 6/30/2008 40 $237,401 $294,358 $58,872 $235,486
Treatment WWTP UPGRADE 6/30/2008 40 $71,273 $88,372 $17,674 $70,698
Treatment WWTP UPGRADE 6/30/2009 40 $130,476 $155,552 $27,222 $128,331
Treatment WWTP BIOSOLIDS UPGRADE 6/30/2009 40 $12,000 $14,306 $2,504 $11,803
Treatment TERT/UV DISINFECT 6/30/2009 40 $884,616 $1,054,634 $184,561 $870,073
Treatment WWTP CAPITAL MAINT #53D 6/30/2014 40 $56,708 $60,422 $3,021 $57,401
Treatment WWTP FACILITY PLNG 6/30/2013 1 $409,212 $452,014 $452,014 $0
Treatment WWTP FACILITY PLANNING 6/30/2014 1 $121,904 $129,888 $129,888 $0
Treatment 2015 NPDES RENEWAL #53AD 6/30/2014 1 $6,180 $6,585 $6,585 $0
Treatment WWTP ARSENIC TREATMENT #53Z 6/30/2014 1 $1,383,290 $1,473,890 $1,473,890 $0
Pumping Sewer Lift Stn Upgrades-#58K 6/30/2016 1 $62,447 $62,447 $0 $62,447
Treatment WWTP Arsenic Treatment-#53Z 6/30/2016 1 $8,045,722 $8,045,722 $0 $8,045,722

34 | City of Galt
Asset Classification Description
Asset Installed
Date
Useful Life
(Years) Original Cost Replacement
Cost RC
Depreciation RCLD
Treatment WWTP ARSENIC TREATMENT #53Z 6/30/2015 40 $12,199,678 $12,696,210 $317,405 $12,378,805
General 1989 CHEV PU #891 1989 5 $11,933 $0 $0 $0
Pumping MCFARLAND TRUDY PUMP STATION 6/30/1983 10 $54,000 $122,378 $122,378 $0
Collection SEWER CLEANERS 6/30/1978 10 $10,000 $34,023 $34,023 $0
General BOBAT LOADER 1/3 6/30/1994 10 $11,536 $20,508 $20,508 $0
General 1994 GMC C2500 SIERRA PU #942 6/30/1994 5 $14,503 $25,784 $25,784 $0
General 1994 GMC C1500 SIERRAPU #941 6/30/1994 5 $14,730 $26,186 $26,186 $0
General SECA SECTIONAL RODDER 6/30/1991 10 $20,962 $39,111 $39,111 $0
General 1990 CHEV 3/4 TON PU #907 6/30/1991 5 $14,135 $26,374 $26,374 $0
General SULLIVAN AIR COMPRESSOR 6/30/1995 10 $6,150 $10,887 $10,887 $0
General AERATOR 10 HP W/200 CAB 6/30/1995 10 $10,937 $19,360 $19,360 $0
General TRACTOR/BOOM FLAIL MOWER 6/30/1996 10 $28,865 $50,548 $50,548 $0
General 2000 FORD PU #992 6/30/2000 5 $16,911 $26,360 $26,360 $0
Collection CAMERA FOR SEWER LINES 6/30/2001 10 $7,015 $11,006 $11,006 $0
Collection REPAIR E STREET SEWER 6/30/2002 10 $5,880 $8,930 $8,930 $0
Collection REPAIR 18HP REWIND MOTOR 6/30/2002 10 $10,239 $15,549 $15,549 $0
General IMPROVEMENTS@WWP SHOOTING RANG 6/30/2002 15 $10,351 $15,719 $14,671 $1,048
General 2004 UT TRAILER 6/30/2004 10 $5,213 $7,355 $7,355 $0
General MAGNETECK TRAILER MOUNT 6/30/1999 10 $19,625 $33,423 $33,423 $0
General MAGNETECK TRAILER MOUNT 6/30/1999 10 $31,471 $53,597 $53,597 $0
General 1999 VAC-CON INTERNATIONAL#991 6/30/1999 10 $191,077 $325,421 $325,421 $0
General POWER ROD DRIVE 6/30/1999 10 $6,103 $10,393 $10,393 $0
General CASE 590 SUPER M BACKHOE 6/30/2005 5 $22,466 $31,391 $31,391 $0
General 2005 CHEV PU #05-6 6/30/2005 5 $8,250 $11,528 $11,528 $0
General 1992 GMC AG-CHEM SLDG TK#921 6/30/1993 5 $12,468 $22,345 $22,345 $0
General TOWNMASTER TRAILER T-20 6/30/1993 10 $4,396 $7,879 $7,879 $0
General CFM AIR COMPRESSOR 6/30/2000 10 $4,086 $6,369 $6,369 $0
General 2001 DODGE DUMP TRUCK 6/30/2001 5 $10,308 $16,174 $16,174 $0
General 1999 CLARK FORKLIFT 6/30/2002 10 $4,213 $6,398 $6,398 $0
General 2001 DODGE RAM #01-7 6/30/2002 5 $6,193 $9,405 $9,405 $0
General UTILITY BOX & SERVICE CRANE 6/30/2002 10 $4,985 $7,571 $7,571 $0
Storage SLUDGE LAGOON EXPANSION 6/30/2003 10 $23,197 $34,576 $34,576 $0
General 2003 CHEVY 1 TON UNIT #03-3 6/30/2004 5 $8,919 $12,584 $12,584 $0

Water, Wastewater, and Storm Drainage Capacity Fee Study Report | 35
Asset Classification Description
Asset Installed
Date
Useful Life
(Years) Original Cost Replacement
Cost RC
Depreciation RCLD
General 2004 GMC PU UNIT #04-3 6/30/2004 5 $5,968 $8,420 $8,420 $0
General FREQUENCY DRIVE/REPAIR 6/30/2004 10 $16,468 $23,234 $23,234 $0
General 1998 CASE TRACTOR #982 6/30/1999 5 $22,803 $38,836 $38,836 $0
General FRONT LOADER JD TRACTOR 6/30/2003 10 $5,233 $7,799 $7,799 $0
General LIVE OAK SEWER PLANT LAND IMPR 6/30/2006 10 $56,120 $75,600 $75,600 $0
Collection ASPHALT MACHINE 6/30/2006 10 $17,765 $23,932 $23,932 $0
General 2006 FORD F250 #05-08 6/30/2006 5 $7,650 $10,306 $10,306 $0
General 2006 FORD F450 #05-09 6/30/2006 5 $9,648 $12,997 $12,997 $0
General JOHN DEER #225 TRACTOR 6/30/2006 5 $8,444 $11,375 $11,375 $0
Collection HORIZONTAL ROTOR AERATOR 6/30/2007 10 $14,236 $18,171 $16,354 $1,817
Collection FLOW METERS 6/30/2007 10 $6,268 $8,001 $7,201 $800
Treatment CHLORINE/RESIDUAL ANALYSER 6/30/2007 10 $8,504 $10,854 $9,769 $1,085
Treatment CHLORINE/RESIDUAL ANALYSERS 6/30/2007 10 $8,504 $10,854 $9,769 $1,085
General FREQUENCY DRIVE/REPAIR 6/30/2004 10 $160,038 $225,797 $225,797 $0
General 2008 STERLING DUMP TRK #07-06 6/30/2008 5 $26,611 $32,995 $32,995 $0
General 2007 CHEVY PU #07-05 6/30/2008 5 $23,670 $29,348 $29,348 $0
General 2007 DODGE RAM PU #07-4 6/30/2008 5 $23,032 $28,557 $28,557 $0
Collection FLOW METERS 6/30/2008 10 $222,888 $276,363 $221,091 $55,273
General INTERACTIVE VOICE MESSG SYS 6/30/2008 25 $17,809 $22,081 $7,066 $15,015
Collection SEWER MAIN CAMERA 6/30/2011 10 $99,144 $113,143 $56,572 $56,572
General 2012 FORD F250 REG CAB #12-1 6/30/2012 5 $6,783 $7,618 $6,094 $1,524
Collection PORTABLE PUMP (TRAILER MNTD) 6/30/2012 10 $55,773 $62,636 $25,055 $37,582
Collection TRAILER-16' TANDEM (for pump) 6/30/2012 10 $9,037 $10,150 $4,060 $6,090
General SKIP LOADER 6/30/2013 10 $22,262 $24,590 $7,377 $17,213
General VAC-CON COMBO TRUCK 6/30/2013 5 $372,366 $411,315 $246,789 $164,526
General SKIP LOADER 6/30/2013 10 $22,262 $24,590 $7,377 $17,213
General 2014 FORD F150 P/U W/LIGHT BAR 6/30/2014 5 $17,847 $19,016 $7,607 $11,410
General 2014 FORD F150 P/U W/LIGHT BAR 6/30/2014 5 $8,766 $9,340 $3,736 $5,604
General 2014 RAM 1500 2WD CREW CAB 6/30/2014 5 $5,200 $5,541 $2,216 $3,324
General CASE 580SN TIER 41 BCKHOE LDR 6/30/2015 10 $28,464 $29,622 $2,962 $26,660
General 2015 Ford F150-Bus-07 6/30/2015 5 $6,424 $6,686 $1,337 $5,348
General 2016 Ford F250 - Unit 16-2 6/30/2016 5 $617 $617 $0 $617
General 2016 Ford F150 Unit 16-4 6/30/2016 5 $14,608 $14,608 $0 $14,608

36 | City of Galt
Asset Classification Description
Asset Installed
Date
Useful Life
(Years) Original Cost Replacement
Cost RC
Depreciation RCLD
General Ford F150 - Unit 16-3 6/30/2016 5 $21,803 $21,803 $0 $21,803
General 2015 Chevy Silverado Unit 15-4 6/30/2016 5 $6,175 $6,175 $0 $6,175
Pumping CRYSTAL WAY PUMP STATION 6/30/1971 40 $5,500 $40,387 $40,387 $0
Pumping MCFARLAND/A ST PUMP STATION 6/30/1975 40 $75,000 $393,629 $393,629 $0
Pumping DOWNING 1ST ST PUMP STATION 6/30/1979 40 $20,000 $61,004 $56,428 $4,575
Pumping 1ST STREET 5HP PUMP STATION 6/30/1988 40 $5,600 $11,337 $7,936 $3,401
Collection SEWER PIPELINE IMPROVEMENTS 6/30/2005 50 $19,230 $26,870 $5,911 $20,959
General A.D. 88-2 6/30/1994 50 $192,365 $341,981 $150,472 $191,509
General S. GALT SEWER DESIGN 6/30/1994 50 $30,363 $53,979 $23,751 $30,228
General S GALT SEWER DESIGN 6/30/1995 50 $289,243 $512,025 $215,051 $296,975
Pumping REBUILD 77HP FLGYT PUMP 6/30/1991 40 $9,669 $18,042 $11,276 $6,766
Treatment A STREET PUMP STATION REB 6/30/1991 40 $5,721 $10,675 $6,672 $4,003
General SEWER SYSTEM IMPROVEMENTS 6/30/1995 40 $114,145 $202,063 $106,083 $95,980
Collection SEWER LINES 6/30/2001 50 $10,978 $17,225 $5,167 $12,057
Treatment WWTP GROUND WATER 6/30/2003 40 $491,289 $732,282 $237,992 $494,290
Collection PURLIDGE PROP SEWER LINE 6/30/2003 50 $361,620 $539,005 $140,141 $398,864
Storage RD/IRRIGATION IMPROVEMENTS 6/30/2004 50 $42,247 $59,607 $14,306 $45,301
Pumping SEWER LIFT STATION UPGRADE 6/30/2003 40 $60,016 $89,455 $29,073 $60,382
General WATER & SEWER IMPROVEMENTS 6/30/2004 40 $84,152 $118,730 $35,619 $83,111
Pumping LIVE OAK SEWER LIFT STN UPGRAD 6/30/2006 40 $64,707 $87,168 $21,792 $65,376
Storage WWTP IRRIGATION IMPRV 6/30/2006 40 $150,556 $202,816 $50,704 $152,112
General UHF RADIO CONVERSION 6/30/2007 25 $324 $414 $149 $265
Pumping ELM/AMADOR LIFT STN IMPRVMNTS 6/30/2007 40 $71,617 $91,411 $20,567 $70,843
General LINCOLN WAY PROJECT IMPROVEMT 6/30/2003 40 $206,994 $308,531 $100,273 $208,259
Collection SEWER MAIN IMPROVEMENTS 6/30/2002 50 $9,098 $13,817 $3,869 $9,948
Storage RESEVOIR CONSTRUCTION 6/30/2007 40 $5,133 $6,551 $1,474 $5,077
Pumping LIFT STN STATIONARY GENERATOR 6/30/2008 40 $24,732 $30,666 $6,133 $24,533
Pumping LIFT STN STATIONARY GENERATOR 6/30/2008 40 $5,268 $6,532 $1,306 $5,226
Collection MONTEREY PRK - SEWER LINES 6/30/2009 50 $16,017 $19,095 $2,673 $16,422
Collection ROUNDSTONE PRK-SEWER LINES 6/30/2009 50 $10,571 $12,603 $1,764 $10,838
Collection WWTP BYPASS PIPELINE 6/30/2010 50 $656,108 $769,685 $92,362 $677,323
Collection WWTP BYPASS PIPELINE 6/30/2009 50 $109,100 $130,069 $18,210 $111,859

Water, Wastewater, and Storm Drainage Capacity Fee Study Report | 37
Asset Classification Description
Asset Installed
Date
Useful Life
(Years) Original Cost Replacement
Cost RC
Depreciation RCLD
General CARILLION CORNERS-DEVELOPER PD 6/30/2010 50 $50,840 $59,641 $7,157 $52,484
Collection SEWER LINE PIPELINE IMPRV 6/30/2011 50 $84,320 $96,225 $9,623 $86,603
Collection SEWER PIPELINE IMPRV 6/30/2011 50 $32,593 $37,195 $3,720 $33,476
General WALKER PARK LANDSCAPE DESIGN 6/30/2011 50 $56,370 $64,330 $6,433 $57,897
General CCTV SYSTEM - WALKER PARK 6/30/2011 50 $16,498 $18,827 $1,883 $16,945
General WALKER PARK LANDSCAPE DESIGN 6/30/2011 50 $74,268 $84,754 $8,475 $76,279
Pumping SWR LIFT STN-CRYSTAL WAY 6/30/1971 40 $32,602 $239,400 $239,400 $0
Pumping SWR LIFT STN-MCFARLAND 6/30/1975 40 $180,905 $949,460 $949,460 $0
Pumping SWR LIFT STN - E STREET 6/30/1986 40 $88,568 $186,664 $139,998 $46,666
Pumping SWR LIFT STN-CHABOLLA 6/30/1986 40 $88,568 $186,664 $139,998 $46,666
Pumping SWR LIFT STN - ELM/HIWAY 99 6/30/1986 40 $88,568 $186,664 $139,998 $46,666
Pumping SWR LIFT STN-SPARROW 6/30/1986 40 $88,568 $186,664 $139,998 $46,666
Pumping SWR LIFT STN-VINTAGE OAK 6/30/1986 40 $351,261 $740,310 $555,232 $185,077
Pumping SWR LIFT STN-FIRST STREET 6/30/1988 40 $93,187 $188,657 $132,060 $56,597
Pumping SWR LIFT STN-A STREET 6/30/1991 40 $395,424 $737,802 $461,127 $276,676
Pumping SWR LIFT STN-LIVE OAK 6/30/2006 40 $634,886 $855,262 $213,816 $641,447
Pumping SWR LIFT STN-ELM/AMADOR PUMP 6/30/2007 40 $95,407 $121,776 $27,400 $94,376
Pumping SWR LIFT STN-FIELD 18 RECAPTR2 6/30/2007 40 $17,500 $22,337 $5,026 $17,311
Pumping SWR LIFT STN-FIELD 18 RECPTR 2 6/30/2007 40 $12,075 $15,412 $3,468 $11,945
Pumping SWR LIFT STN-FIELD 18 WET WELL 6/30/2007 40 $23,575 $30,091 $6,770 $23,320
Pumping SWR LIFT STN-2007 SOFT COSTS 6/30/2007 40 $19,059 $24,327 $5,473 $18,853
Collection SWR PIPELINE 1967 6/30/1970 50 $452,519 $3,804,120 $3,499,790 $304,330
Collection SWR PIPELINE 1975 6/30/1975 50 $514,218 $2,698,815 $2,213,029 $485,787
Collection SWR PIPELINE 1980 6/30/1980 50 $1,100,304 $2,921,781 $2,103,682 $818,099
Collection SWR PIPELINE 1986 6/30/1986 50 $1,128,149 $2,377,660 $1,426,596 $951,064
Collection SWR PIPELINE 1988 6/30/1988 50 $2,439,023 $4,937,795 $2,765,165 $2,172,630
Collection SWR PIPELINE 1989 6/30/1989 50 $1,965,997 $3,847,258 $2,077,519 $1,769,739
Collection SWR PIPELINE 1990 6/30/1990 50 $1,504,413 $2,884,167 $1,499,767 $1,384,400
Collection SWR PIPELINE 1992 6/30/1992 50 $214,370 $395,359 $189,772 $205,586
Collection SWR PIPELINE 1994 6/30/1994 50 $1,396,770 $2,483,131 $1,092,578 $1,390,553
Collection SWR PIPELINE 1995 6/30/1995 50 $5,515,250 $9,763,252 $4,100,566 $5,662,686
Collection SWR PIPELINE 1996 6/30/1996 50 $4,195,329 $7,346,650 $2,938,660 $4,407,990
Collection SWR PIPELINE 1997 6/30/1997 50 $4,345,560 $7,495,011 $2,848,104 $4,646,907
Collection SWR PIPELINE 2003 6/30/2003 50 $3,304,163 $4,924,954 $1,280,488 $3,644,466

38 | City of Galt
Asset Classification Description
Asset Installed
Date
Useful Life
(Years) Original Cost Replacement
Cost RC
Depreciation RCLD
Collection SWR PIPELINE 2004 6/30/2004 50 $476,190 $671,857 $161,246 $510,611
Collection SWR PIPELINE-CREEKSIDE 2 #2 6/30/2007 50 $24,725 $31,558 $5,681 $25,878
Collection SWR PIPELINE-CREEKSIDE 2 #2 6/30/2007 50 $15,295 $19,522 $3,514 $16,008
Collection SWR PIPELINE-FIELD 18 6/30/2007 50 $862 $1,100 $198 $902
Collection SWR PIPELINE-RIVER OAKS 3A 6/30/2007 50 $143,325 $182,937 $32,929 $150,008
Collection SWR PIPELINE-THE MEADOWS 6/30/2007 50 $62,040 $79,187 $14,254 $64,933
Collection SWR PIPELINE-2007 SOFT COSTS 6/30/2007 50 $31,592 $40,323 $7,258 $33,065
Collection SWR PIPELINE-2008 SOFT COSTS 6/30/2008 50 $17,826 $22,103 $3,536 $18,566
Collection SWR PIPELINE-COUNTRYSIDE 6/30/2008 50 $138,950 $172,287 $27,566 $144,721
Collection SWR MANHOLE 1960 6/30/1960 50 $36,195 $509,956 $509,956 $0
Collection SWR MANHOLE 1967 6/30/1967 50 $44,894 $485,283 $475,578 $9,706
Collection SWR MANHOLE 1970 6/30/1970 50 $91,972 $773,167 $711,313 $61,853
Collection SWR MANHOLE 1975 6/30/1975 50 $83,060 $435,931 $357,464 $78,468
Collection SWR MANHOLE 1980 6/30/1980 50 $174,297 $462,834 $333,240 $129,593
Collection SWR MANHOLE 1986 6/30/1986 50 $161,277 $339,904 $203,942 $135,961
Collection SWR MANHOLE 1988 6/30/1988 50 $368,191 $745,402 $417,425 $327,977
Collection SWR MANHOLE 1989 6/30/1989 50 $271,383 $531,069 $286,777 $244,292
Collection SWR MANHOLE 1990 6/30/1990 50 $160,923 $308,512 $160,426 $148,086
Collection SWR MANHOLE 1992 6/30/1992 50 $24,723 $45,596 $21,886 $23,710
Collection SWR MANHOLE 1993 6/30/1993 50 $513,081 $919,517 $422,978 $496,539
Collection SWR MANHOLE 1994 6/30/1994 50 $122,608 $217,968 $95,906 $122,062
Collection SWR MANHOLE 1995 6/30/1995 50 $689,953 $1,221,374 $512,977 $708,397
Collection SWR MANHOLE 1996 6/30/1996 50 $545,494 $955,242 $382,097 $573,145
Collection SWR MANHOLE 1997 6/30/1997 50 $136,213 $234,934 $89,275 $145,659
Collection SWR MANHOLE 2001 6/30/2001 50 $89,879 $141,024 $42,307 $98,717
Collection SWR MANHOLE 2003 6/30/2003 50 $531,174 $791,731 $205,850 $585,881
Collection SWR MANHOLE 2004 6/30/2004 50 $90,736 $128,019 $30,725 $97,295
Collection SWR MANHOLE-CREEKSIDE 2 #2 6/30/2007 50 $18,000 $22,975 $4,135 $18,839
Collection SWR MANHOLE-RIVER OAKS 3A 6/30/2007 50 $32,200 $41,099 $7,398 $33,702
Collection SWR MANHOLE-THE MEADOWS 6/30/2007 50 $25,000 $31,910 $5,744 $26,166
Collection SWR MANHOLE-2007 SOFT COSTS 6/30/2007 50 $9,648 $12,315 $2,217 $10,098
Collection SWR MANHOLE-2008 SOFT COSTS 6/30/2008 50 $7,120 $8,828 $1,413 $7,416
Collection SWR MANHOLE-COUNTRYSIDE 2 6/30/2008 50 $3,000 $3,720 $595 $3,125
Collection SWR MANHOLE-CREEKSIDE 4 6/30/2008 50 $52,501 $65,097 $10,415 $54,681
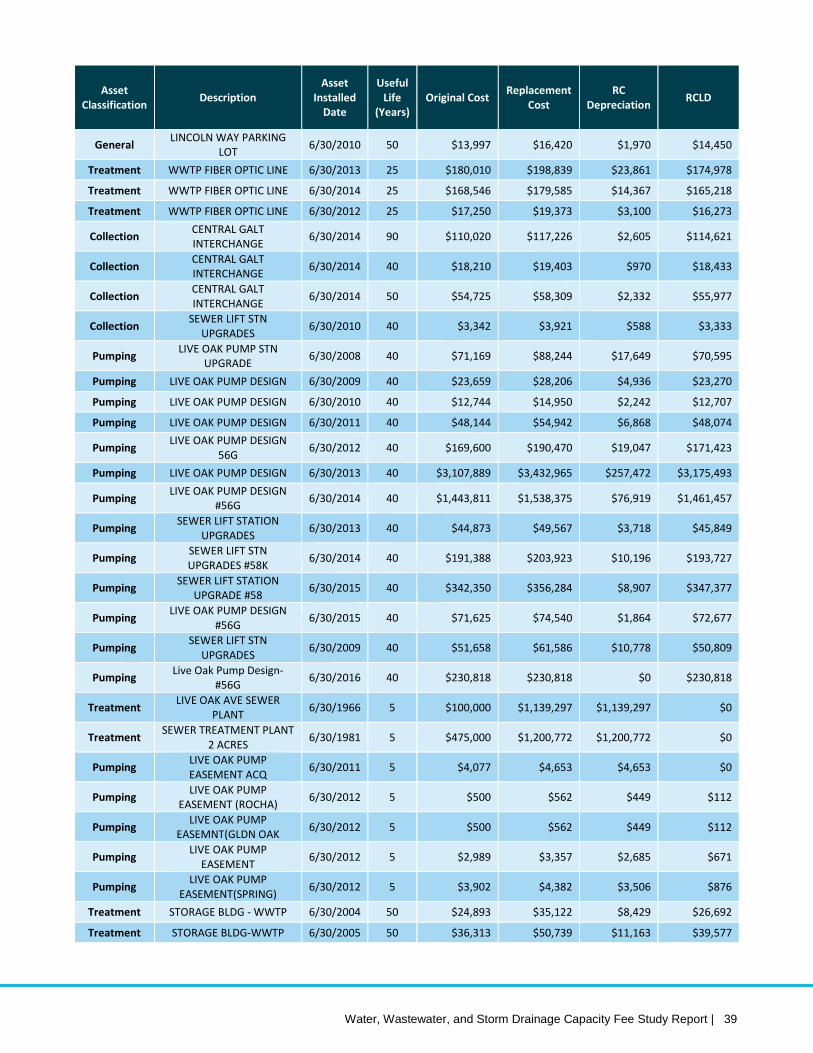
Water, Wastewater, and Storm Drainage Capacity Fee Study Report | 39
Asset Classification Description
Asset Installed
Date
Useful Life
(Years) Original Cost Replacement
Cost RC
Depreciation RCLD
General LINCOLN WAY PARKING LOT 6/30/2010 50 $13,997 $16,420 $1,970 $14,450
Treatment WWTP FIBER OPTIC LINE 6/30/2013 25 $180,010 $198,839 $23,861 $174,978
Treatment WWTP FIBER OPTIC LINE 6/30/2014 25 $168,546 $179,585 $14,367 $165,218
Treatment WWTP FIBER OPTIC LINE 6/30/2012 25 $17,250 $19,373 $3,100 $16,273
Collection CENTRAL GALT INTERCHANGE 6/30/2014 90 $110,020 $117,226 $2,605 $114,621
Collection CENTRAL GALT INTERCHANGE 6/30/2014 40 $18,210 $19,403 $970 $18,433
Collection CENTRAL GALT INTERCHANGE 6/30/2014 50 $54,725 $58,309 $2,332 $55,977
Collection SEWER LIFT STN UPGRADES 6/30/2010 40 $3,342 $3,921 $588 $3,333
Pumping LIVE OAK PUMP STN UPGRADE 6/30/2008 40 $71,169 $88,244 $17,649 $70,595
Pumping LIVE OAK PUMP DESIGN 6/30/2009 40 $23,659 $28,206 $4,936 $23,270
Pumping LIVE OAK PUMP DESIGN 6/30/2010 40 $12,744 $14,950 $2,242 $12,707
Pumping LIVE OAK PUMP DESIGN 6/30/2011 40 $48,144 $54,942 $6,868 $48,074
Pumping LIVE OAK PUMP DESIGN 56G 6/30/2012 40 $169,600 $190,470 $19,047 $171,423
Pumping LIVE OAK PUMP DESIGN 6/30/2013 40 $3,107,889 $3,432,965 $257,472 $3,175,493
Pumping LIVE OAK PUMP DESIGN #56G 6/30/2014 40 $1,443,811 $1,538,375 $76,919 $1,461,457
Pumping SEWER LIFT STATION UPGRADES 6/30/2013 40 $44,873 $49,567 $3,718 $45,849
Pumping SEWER LIFT STN UPGRADES #58K 6/30/2014 40 $191,388 $203,923 $10,196 $193,727
Pumping SEWER LIFT STATION UPGRADE #58 6/30/2015 40 $342,350 $356,284 $8,907 $347,377
Pumping LIVE OAK PUMP DESIGN #56G 6/30/2015 40 $71,625 $74,540 $1,864 $72,677
Pumping SEWER LIFT STN UPGRADES 6/30/2009 40 $51,658 $61,586 $10,778 $50,809
Pumping Live Oak Pump Design-#56G 6/30/2016 40 $230,818 $230,818 $0 $230,818
Treatment LIVE OAK AVE SEWER PLANT 6/30/1966 5 $100,000 $1,139,297 $1,139,297 $0
Treatment SEWER TREATMENT PLANT 2 ACRES 6/30/1981 5 $475,000 $1,200,772 $1,200,772 $0
Pumping LIVE OAK PUMP EASEMENT ACQ 6/30/2011 5 $4,077 $4,653 $4,653 $0
Pumping LIVE OAK PUMP EASEMENT (ROCHA) 6/30/2012 5 $500 $562 $449 $112
Pumping LIVE OAK PUMP EASEMNT(GLDN OAK 6/30/2012 5 $500 $562 $449 $112
Pumping LIVE OAK PUMP EASEMENT 6/30/2012 5 $2,989 $3,357 $2,685 $671
Pumping LIVE OAK PUMP EASEMENT(SPRING) 6/30/2012 5 $3,902 $4,382 $3,506 $876
Treatment STORAGE BLDG - WWTP 6/30/2004 50 $24,893 $35,122 $8,429 $26,692
Treatment STORAGE BLDG-WWTP 6/30/2005 50 $36,313 $50,739 $11,163 $39,577

40 | City of Galt
Asset Classification Description
Asset Installed
Date
Useful Life
(Years) Original Cost Replacement
Cost RC
Depreciation RCLD
Treatment BLDG IMPRV - ROOFING #50A 6/30/2014 10 $5,097 $5,431 $1,086 $4,345
Treatment MASTER PLAN FOR WWTP 6/30/2001 1 $66,119 $103,743 $103,743 $0
Treatment WWTP FACILITY PLNG 6/30/2013 1 $239,278 $264,306 $264,306 $0
Treatment WWTP FACILITY PLNG #50C 6/30/2014 1 $52,970 $56,439 $56,439 $0
Treatment WWTP ARSENIC TREATMENT #53Z 6/30/2014 1 $230,585 $245,688 $245,688 $0
Treatment WWTP ARSENIC TREATMENT #53Z 6/30/2015 40 $202,575 $210,820 $5,271 $205,550
Treatment WWTP Arsenic Treatment-#53Z 6/30/2016 1 $157,485 $157,485 $0 $157,485
General GATOR UTILITY VEHICLE 6/30/2005 5 $10,000 $13,973 $13,973 $0
General SCADA SYSTEM 6/30/2005 10 $12,448 $17,393 $17,393 $0
Treatment SLUDGE LAGOON EXPANSION 6/30/2003 10 $6,250 $9,316 $9,316 $0
General 2004 DODGE DAKOTA UNIT #04-1 6/30/2004 5 $8,360 $11,796 $11,796 $0
General 2004 VAC-CON UNIT #04-2 6/30/2004 5 $72,213 $101,886 $101,886 $0
General SCADA SYSTEM 6/30/2006 10 $23,713 $31,943 $31,943 $0
Treatment CLARIFIER COVERS 6/30/2006 10 $67,919 $91,495 $91,495 $0
Collection FLOW METERS 6/30/2006 10 $16,953 $22,838 $22,838 $0
General SCADA SYSTEM 6/30/2006 10 $9,780 $13,175 $13,175 $0
Treatment CHAMBER COVERS 6/30/2006 10 $80,000 $107,769 $107,769 $0
Storage WWTP FIELD IMPRV 6/30/2006 22 $901,708 $1,214,701 $552,137 $662,564
General SCADA SYSTEM DESIGN 6/30/2007 10 $5,864 $7,484 $6,736 $748
Treatment CLARIFIERS OVERS 6/30/2007 10 $1,071 $1,367 $1,231 $137
Collection FLOW METERS 6/30/2007 10 $18,754 $23,937 $21,543 $2,394
Storage WWTP FIELD IMPRV-PHASE I 6/30/2007 22 $187,442 $239,247 $97,874 $141,373
Treatment GRIT REMOVAL SYSTEM 6/30/2008 22 $673,330 $834,874 $303,591 $531,284
Treatment ARSENIC TREATMENT 6/30/2010 22 $193,947 $227,521 $62,051 $165,470
Treatment ARSENIC TREATMENT 6/30/2009 22 $2,303 $2,745 $874 $1,872
Treatment ARSENIC TREATMENT 6/30/2011 22 $6,000 $6,847 $1,556 $5,291
General SCADA SYSTEM DESIGN 6/30/2008 22 $438,794 $544,068 $197,843 $346,225
General SCADA SYSTEM 6/30/2008 22 $19,622 $24,330 $8,847 $15,482
Treatment WWTP AUXILARY BASIN PHASE I 6/30/2005 40 $8,610 $12,030 $3,308 $8,722
Storage WWTP IRRIGATION SYSTEM 6/30/1999 40 $15,891 $27,063 $11,502 $15,561
Storage SLUDGE LAGOON EXPANSION 6/30/2003 40 $47,065 $70,152 $22,799 $47,353
Pumping SEWER LIFT STATION UPGRADE 6/30/2003 40 $20,635 $30,757 $9,996 $20,761
Storage WWTP IRRIGATION IMPROV 6/30/2006 40 $82,455 $111,076 $27,769 $83,307
General LINCOLN WAY PROJECT IMPROVEMT 6/30/2003 40 $530,142 $790,193 $256,813 $533,380

Water, Wastewater, and Storm Drainage Capacity Fee Study Report | 41
Asset Classification Description
Asset Installed
Date
Useful Life
(Years) Original Cost Replacement
Cost RC
Depreciation RCLD
Storage ROAD IRRIGATION IMPRV 2005 6/30/2005 100 $227,502 $317,885 $34,967 $282,918
Pumping SEWER LIFT STN CONSTRUCTION 6/30/2002 40 $389,207 $591,079 $206,877 $384,201
Pumping SEWER LIFT STN IMPROVEMENTS 6/30/2002 40 $79,093 $120,116 $42,041 $78,076
Pumping SEWER LIFT STN CONST - WWTP 6/30/2008 40 $405,957 $503,354 $100,671 $402,683
Storage WWTP IRRIGATION SYS 6/30/2003 40 $251,532 $374,916 $121,848 $253,068
Collection WWTP BYPASS PIPELINE 6/30/2010 50 $128,583 $150,842 $18,101 $132,741
Collection SWR PIPELINE 1967 6/30/1967 50 $534,085 $5,773,209 $5,657,745 $115,464
Collection SWR PIPELINE 1960 6/30/1960 50 $369,003 $5,198,925 $5,198,925 $0
Collection SWR PIPELINE 1967 6/30/1967 50 $400,580 $4,330,087 $4,243,485 $86,602
Pumping LIVE OAK PUMP DESIGN 6/30/2009 40 $73,885 $88,085 $15,415 $72,670
Pumping LIVE OAK PUMP DESIGN 6/30/2010 40 $12,744 $14,950 $2,242 $12,707
Pumping LIVE OAK PUMP DESIGN 6/30/2011 40 $174,268 $198,875 $24,859 $174,016
Pumping LIVE OAK PUMP DESIGN #56G 6/30/2012 40 $76,176 $85,550 $8,555 $76,995
Pumping LIVE OAK PUMP DESIGN 6/30/2013 40 $466,591 $515,395 $38,655 $476,740
Pumping LIVE OAK PUMP DESIGN #56G 6/30/2014 40 $212,790 $226,727 $11,336 $215,391
General GOLDEN HEIGHTS WELL 6/30/2010 40 $5,013 $5,880 $882 $4,998
General MONT BAY WELL/GLDN HTS WTP 56E 6/30/2012 40 $51,700 $58,062 $5,806 $52,256
General MONT BAY/GLDN HTS WTP 56E 6/30/2013 40 $3,990 $4,407 $331 $4,077
Treatment WWTP UPGRADE 6/30/2010 40 $4,666 $5,473 $821 $4,652
Pumping LIVE OAKD PUMP DESIGN #56G 6/30/2015 40 $6,457 $6,720 $168 $6,552
Pumping Live Oak Pump Design-#56G 6/30/2016 40 $0 $0 $0 $0
Land BISHOP PROPERTY 6/30/2002 0 $153,250 $202,210 $0 $202,210
Land WWTP LAND (NW MCFARLAND/ELM) 6/30/2006 0 $32,902 $40,107 $0 $40,107
Land WWTP EXPANSION - LAND ACQ 6/30/2007 0 $24,417 $29,180 $0 $29,180
Land LIVE OAK PUMP EASEMENT(SPRING) 6/30/2012 0 $3,901 $4,223 $0 $4,223
Customer Service
INTERACTIVE VOICE MESSG SYST 6/30/2008 25 $11,165 $13,843 $4,430 $9,413
General WASTEWATER TREATMENT PLAN 6/30/1993 40 $1,647,122 $2,951,884 $1,697,334 $1,254,551
General WASTEWATER TREATMENT PLAN 6/30/1993 40 $9,063,926 $16,243,890 $9,340,237 $6,903,653
Total $105,294,360 $173,585,582 $78,225,824 $95,359,758

42 | City of Galt
APPENDIX D – STORM DRAINAGE REPLACEMENT COST VALUE
Table 18: Storm Drainage Asset Listing and RCLD
Asset Classification Description
Asset Installed
Date
Useful Life
(Years)
Original Cost
Replacement Cost
RC Depreciation RCLD
Collection INDUSTRIAL DR STORM DRAIN EXT 6/30/2006 40 $170,000 $229,009 $57,252 $171,757
Collection INDUSTRIAL STORM DRAIN EXT 6/30/2006 40 $340,681 $458,936 $114,734 $344,202
Collection MONTEREY PRK-STORM DRAIN 6/30/2009 40 $91,950 $109,622 $19,184 $90,438
Collection ROUNDSTONE PRK-STORM DRAIN 6/30/2009 40 $56,713 $67,613 $11,832 $55,781
Collection SD OPEN DITCH-PRINGLE (GASB 34 6/30/1995 100 $285,373 $505,175 $106,087 $399,089
Collection SD OPEN DITCH-REMAINDER (GASB 6/30/1970 100 $157,680 $1,325,544 $609,750 $715,794
Collection SD MANHOLE 1960 6/30/1960 50 $28,606 $403,033 $403,033 $0
Collection SD MANOLE 1967 6/30/1967 50 $25,871 $279,655 $274,062 $5,593
Collection SD MANHOLE 1970 6/30/1970 50 $77,295 $649,788 $597,805 $51,983
Collection SD MANHOLE 1975 6/30/1975 50 $40,747 $213,854 $175,360 $38,494
Collection SD MANHOLE 1980 6/30/1980 50 $61,921 $164,428 $118,388 $46,040
Collection SD MANHOLE 1986 6/30/1986 50 $100,418 $211,638 $126,983 $84,655
Collection SD MANHOLE 1988 6/30/1988 50 $268,940 $544,468 $304,902 $239,566
Collection SD MANHOLE 1989 6/30/1989 50 $225,608 $441,491 $238,405 $203,086
Collection SD MANHOLE 1990 6/30/1990 50 $100,577 $192,820 $100,266 $92,554
Collection SD MANHOLE 1992 6/30/1992 50 $3,532 $6,514 $3,127 $3,387
Collection SD MANHOLE 1994 6/30/1994 50 $68,967 $122,608 $53,947 $68,660
Collection SD MANHOLE 1995 6/30/1995 50 $484,518 $857,707 $360,237 $497,470
Collection SD MANHOLE 1996 6/30/1996 50 $410,116 $718,174 $287,270 $430,905
Collection SD MANHOLE 1997 6/30/1997 50 $619,149 $1,067,877 $405,793 $662,084
Collection SD MANHOLE 2003 6/30/2003 50 $516,946 $770,524 $200,336 $570,188
Collection SD MANHOLE 2004 6/30/2004 50 $100,818 $142,244 $34,139 $108,106
Collection SD MANHOLE-CREEKSIDE 2 #2 6/30/2007 50 $9,000 $11,487 $2,068 $9,420
Collection SD MANHOLE-RIVER OAKS 3A 6/30/2007 50 $153,000 $195,286 $35,152 $160,135
Collection SD MANHOLE-THE MEADOW 6/30/2007 50 $9,000 $11,487 $2,068 $9,420
Collection SD MANHOLE-2007 SOFT COSTS 6/30/2007 50 $21,938 $28,001 $5,040 $22,961
Collection SD MANHOLE-2008 SOFT COSTS 6/30/2008 50 $7,184 $8,908 $1,425 $7,482
Collection SD MANHOLE-CREEKSIDE 4 48" 6/30/2008 50 $24,000 $29,758 $4,761 $24,997
Collection SD MANHOLE-CREEKSIDE 4 60" 6/30/2008 50 $20,000 $24,798 $3,968 $20,831
Collection SD MANHOLE-CREEKSIDE 4 72" 6/30/2008 50 $12,000 $14,879 $2,381 $12,498

Water, Wastewater, and Storm Drainage Capacity Fee Study Report | 43
Asset Classification Description
Asset Installed
Date
Useful Life
(Years)
Original Cost
Replacement Cost
RC Depreciation RCLD
Collection SD LAT PIPE 1992 6/30/1992 25 $7,243 $13,358 $12,824 $534
Collection SD LAT PIPE 1994 6/30/1994 25 $94,297 $167,638 $147,522 $20,117
Collection SD LAT PIPE 1995 6/30/1995 25 $612,119 $1,083,590 $910,216 $173,374
Collection SD LAT PIPE 1996 6/30/1996 25 $690,036 $1,208,356 $966,685 $241,671
Collection SD LAT PIPE 1997 6/30/1997 25 $833,845 $1,438,175 $1,093,013 $345,162
Collection SD LAT PIPE 2003 6/30/2003 25 $637,097 $949,612 $493,798 $455,814
Collection SD LAT PIPE 2004 6/30/2004 25 $93,046 $131,279 $63,014 $68,265
Collection SD LAT PIPE-CREEKSIDE 4 6/30/2008 25 $3,850 $4,774 $1,528 $3,246
Collection SD LAT PIPE-2008 SOFT COSTS 6/30/2008 25 $494 $613 $196 $417
Collection SD INLET 1960 6/30/1960 40 $75,071 $1,057,685 $1,057,685 $0
Collection SD INLET 1967 6/30/1967 40 $43,082 $465,696 $465,696 $0
Collection SD INLET 1970 6/30/1970 40 $117,366 $986,643 $986,643 $0
Collection SD INLET 1975 6/30/1975 40 $63,165 $331,515 $331,515 $0
Collection SD INLET 1980 6/30/1980 40 $107,840 $286,362 $257,726 $28,636
Collection SD INLET 1986 6/30/1986 40 $148,927 $313,875 $235,406 $78,469
Collection SD INLET 1988 6/30/1988 40 $442,430 $895,698 $626,989 $268,710
Collection SD INLET 1989 6/30/1989 40 $345,147 $675,418 $455,907 $219,511
Collection SD INLET 1990 6/30/1990 40 $141,559 $271,388 $176,402 $94,986
Collection SD INLET 1992 6/30/1992 40 $13,557 $25,003 $15,002 $10,001
Collection SD INLET 1994 6/30/1994 40 $95,598 $169,951 $93,473 $76,478
Collection SD INLET 1995 6/30/1995 40 $725,339 $1,284,016 $674,108 $609,907
Collection SD INLET 1996 6/30/1996 40 $661,032 $1,157,566 $578,783 $578,783
Collection SD INLET 1997 6/30/1997 40 $954,613 $1,646,470 $782,073 $864,397
Collection SD INLET 2003 6/30/2003 40 $459,671 $685,153 $222,675 $462,479
Collection SD INLET 2004 6/30/2004 40 $96,749 $136,503 $40,951 $95,552
Collection SD INLET - 2005 PAVEMENT REHAB 6/30/2007 40 $16,000 $20,422 $4,595 $15,827
Collection SD INLET - RIVER OAKS 3A 6/30/2007 40 $22,000 $28,080 $6,318 $21,762
Collection SD INLET- 2007 SOFT COSTS 6/30/2007 40 $4,875 $6,222 $1,400 $4,822
Collection SD INLET-2008 SOFT COSTS 6/30/2008 40 $5,420 $6,720 $1,344 $5,376
Collection SD INLET-CREEKSIDE 4 TYPE B 6/30/2008 40 $36,750 $45,567 $9,113 $36,454
Collection SD INLET-CREEKSIDE 4 TYPE I 6/30/2008 40 $2,500 $3,100 $620 $2,480
Collection SD INLET-E STOCKTON BIKE PATH 6/30/2008 40 $3,000 $3,720 $744 $2,976
Collection SD PIPES PVC 6/30/1960 25 $121,528 $1,712,223 $1,712,223 $0
Collection SD PIPES RCP 6/30/1960 40 $147,457 $2,077,540 $2,077,540 $0
Collection SD PIPES PVC 6/30/1967 25 $50,623 $547,211 $547,211 $0
Collection SD PIPES RCP 6/30/1967 40 $601,668 $6,503,751 $6,503,751 $0
Collection SD PIPES PVC 6/30/1970 25 $177,574 $1,492,784 $1,492,784 $0

44 | City of Galt
Asset Classification Description
Asset Installed
Date
Useful Life
(Years)
Original Cost
Replacement Cost
RC Depreciation RCLD
Collection SD PIPES RCP 1970 6/30/1970 40 $498,508 $4,190,730 $4,190,730 $0
Collection SD PIPES PVC 1975 6/30/1975 25 $179,752 $943,409 $943,409 $0
Collection SD PIPES RCP 1975 6/30/1975 40 $89,008 $467,149 $467,149 $0
Collection SD PIPES PVC 1980 6/30/1980 25 $190,169 $504,981 $504,981 $0
Collection SD PIPES RCP 1980 6/30/1980 40 $531,421 $1,411,152 $1,270,037 $141,115
Collection SD PIPES PVC 1986 6/30/1986 25 $229,161 $482,974 $482,974 $0
Collection SD PIPES RCP 1986 6/30/1986 40 $798,428 $1,682,748 $1,262,061 $420,687
Collection SD PIIPES PVC 1988 6/30/1988 25 $1,006,777 $2,038,217 $2,038,217 $0
Collection SD PIPES RCP 1988 6/30/1988 40 $1,667,341 $3,375,528 $2,362,869 $1,012,658
Collection SD PIPES PVC 1989 6/30/1989 25 $966,876 $1,892,079 $1,892,079 $0
Collection SD PIPES RCP 1989 6/30/1989 40 $1,314,815 $2,572,960 $1,736,748 $836,212
Collection SD PIPES PVC 1990 6/30/1990 25 $401,521 $769,771 $769,771 $0
Collection SD PIPES RCP 1990 6/30/1990 40 $1,906,233 $3,654,512 $2,375,433 $1,279,079
Collection SD PIPES PVC 1992 6/30/1992 25 $29,324 $54,082 $51,918 $2,163
Collection SD PIPES RCP 1992 6/30/1992 40 $12,535 $23,118 $13,871 $9,247
Collection SD PIPES PVC 1994 6/30/1994 25 $324,666 $577,180 $507,919 $69,262
Collection SD PIPES RCP 1994 6/30/1994 40 $995,993 $1,770,643 $973,854 $796,790
Collection SD PIPES PVC 1995 6/30/1995 25 $1,170,879 $2,072,723 $1,741,087 $331,636
Collection SD PIPES RCP 1995 6/30/1995 40 $3,554,179 $6,291,708 $3,303,147 $2,988,561
Collection SD PIPES PVC 1996 6/30/1996 25 $649,053 $1,136,589 $909,271 $227,318
Collection SD PIPES RCP 1996 6/30/1996 40 $3,933,284 $6,887,769 $3,443,885 $3,443,885
Collection SD PIPES PVC 1997 6/30/1997 25 $1,588,989 $2,740,611 $2,082,864 $657,747
Collection SD PIPES RCP 2003 6/30/2003 40 $2,088,912 $3,113,586 $1,011,915 $2,101,671
Collection SD PIPES PVC 2004 6/30/2004 25 $192,819 $272,048 $130,583 $141,465
Collection SD PIPES RCP 2004 6/30/2004 40 $1,350,724 $1,905,737 $571,721 $1,334,016
Collection SD PIPES-2005 PAVEMENT REHAB 6/30/2007 40 $49,750 $63,500 $14,287 $49,212
Collection SD PIPES-CHABOLLA CTR EXPANSN 6/30/2007 40 $634 $809 $182 $627
Collection SD PIPES-CREEKSIDE 2 #2 6/30/2007 40 $4,410 $5,629 $1,266 $4,362
Collection SD PIPES-CREEKSIDE 2 #2 6/30/2007 40 $34,080 $43,499 $9,787 $33,712
Collection SD PIPES-FIELD 18 6/30/2007 40 $2,817 $3,596 $809 $2,787
Collection SD PIPES-RIVER OAKS 3A 6/30/2007 40 $64,898 $82,835 $18,638 $64,197
Collection SD PIPES-RIVER OAKS 3A 6/30/2007 40 $7,353 $9,385 $2,112 $7,274
Collection SD PIPES-RIVER OAKS 3A 6/30/2007 40 $8,112 $10,354 $2,330 $8,024
Collection SD PIPES-RIVER OAKS 3A 6/30/2007 40 $55,461 $70,789 $15,928 $54,862
Collection SD PIPES-THE MEADOW 6/30/2007 40 $4,410 $5,629 $1,266 $4,362
Collection SD PIPES-THE MEADOW 6/30/2007 40 $34,080 $43,499 $9,787 $33,712
Collection SD PIPES-2007 SOFT COSTS 6/30/2007 40 $34,127 $43,559 $9,801 $33,758
Collection SD PIPES-2008 SOFT COSTS 6/30/2008 40 $24,444 $30,309 $6,062 $24,247
Collection SD PIPES-COUNTRYSIDE 2 6/30/2008 40 $12,600 $15,623 $3,125 $12,498

Water, Wastewater, and Storm Drainage Capacity Fee Study Report | 45
Asset Classification Description
Asset Installed
Date
Useful Life
(Years)
Original Cost
Replacement Cost
RC Depreciation RCLD
Collection SD PIPES-CREEKSIDE 4 12" 6/30/2008 40 $81,472 $101,019 $20,204 $80,815
Collection SD PIPES-CREEKSIDE 4 18" 6/30/2008 40 $10,464 $12,975 $2,595 $10,380
Collection SD PIPES-CREEKSIDE 4 36" 6/30/2008 40 $41,730 $51,742 $10,348 $41,393
Collection SD PIPES-CREEKSIDE 4 42" 6/30/2008 40 $36,320 $45,034 $9,007 $36,027
Collection SD PIPES-CREEKSIDE 4 48" 6/30/2008 40 $4,400 $5,456 $1,091 $4,365
Collection SD PIPES-E STOCKTON BIKE PATH 6/30/2008 40 $3,550 $4,402 $880 $3,521
Collection SD LAT PIPE 1960 6/30/1960 25 $49,688 $700,061 $700,061 $0
Collection SD PIPES RCP 1997 6/30/1997 40 $3,300,351 $5,692,285 $2,703,835 $2,988,450
Collection SD PIPES PVC 2003 6/30/2003 25 $1,060,068 $1,580,063 $821,633 $758,430
Collection SD LIFT STN-GREER BASIN 2002 6/30/2002 40 $34,054 $51,717 $18,101 $33,616
Collection SD LIFT STN-WAGON WAY 2002 6/30/2002 40 $69,385 $105,373 $36,881 $68,493
Collection SD OUTFALL 1960 6/30/1960 40 $2,123 $29,911 $29,911 $0
Collection SD OUTFALL 1967 6/30/1967 40 $8,301 $89,730 $89,730 $0
Collection SD OUTFALL 1970 6/30/1970 40 $4,447 $37,384 $37,384 $0
Collection SD OUTFALL 1975 6/30/1975 40 $1,425 $7,479 $7,479 $0
Collection SD OUTFALL 6/30/1986 40 $24,897 $52,472 $39,354 $13,118
Collection SD OUTFALL 1989 6/30/1989 40 $14,862 $29,083 $19,631 $9,452
Collection SD OUTFALL 1990 6/30/1990 40 $15,239 $29,215 $18,990 $10,225
Collection SD OUTFALL 1992 6/30/1992 40 $3,211 $5,922 $3,553 $2,369
Collection SD OUTFALL 1994 6/30/1994 40 $13,933 $24,770 $13,623 $11,146
Collection SD OUTFALL 1995 6/30/1995 40 $77,523 $137,233 $72,048 $65,186
Collection SD OUTFALL 2003 6/30/2003 40 $64,672 $96,396 $31,329 $65,067
Collection MONTEREY PRK -SD MANHOLE 6/30/2009 50 $9,159 $10,919 $1,529 $9,391
Collection ROUNDSTONE PRK- SD MANHOLE 6/30/2009 50 $9,613 $11,461 $1,604 $9,856
Collection GALT PLACE MANHOLE - DEV PAID 6/30/2012 50 $30,000 $33,692 $2,695 $30,996
Total $45,466,738 $101,592,862 $71,279,642 $30,313,219
CITY OF GALTWASTEWATER
COST OF SERVICE/RATE STUDYAND
CAPACITY FEE STUDYCITY COUNCIL STUDY SESSION
CONTINUED FROM AUGUST 15, 2017
SEPTEMBER 5, 2017

WASTEWATER COST OF SERVICE
SUMMARY
2COS Rate Review

Current Financial Outlook
Wastewater Rates 3
-$6.0
-$4.0
-$2.0
$0.0
$2.0
$4.0
$6.0
$8.0
$10.0
FYE 2018 FYE 2019 FYE 2020 FYE 2021 FYE 2022 FYE 2023 FYE 2024 FYE 2025 FYE 2026 FYE 2027
Mill
ions
Operating Financial Plan
General & Admin Collection Treatment SRF 1
SRF 2 Net Cashflow Current Revenue

-$4.0
-$2.0
$0.0
$2.0
$4.0
$6.0
$8.0
$10.0
FYE 2018 FYE 2019 FYE 2020 FYE 2021 FYE 2022 FYE 2023 FYE 2024 FYE 2025 FYE 2026 FYE 2027
Mill
ions
Operating Financial Plan
General & Admin Collection Treatment SRF 1
SRF 2 Net Cashflow Current Revenue
Current Financial Outlook:SRF Loan #2 + Capacity Fee Offset
Provides time to build up revenues
4Wastewater Rates

Proposed Final Financial Plan:Recommended 5.5% Revenue Adjustments
Additional Revenue Adjsof 5.5% each year
5Wastewater Rates

$0.0
$0.5
$1.0
$1.5
$2.0
$2.5
FYE 2018 FYE 2019 FYE 2020 FYE 2021 FYE 2022 FYE 2023 FYE 2024 FYE 2025 FYE 2026 FYE 2027
Mill
ions
CIP Funding Sources
Debt Funded Rate/Reserve Funded Total CIP
Capital Improvement Plan
6
6Wastewater Rates

Wastewater Utility Reserves
Ending balance after funding CIP Rate Stabilization Reserve not included
7
$0.0
$1.0
$2.0
$3.0
$4.0
$5.0
$6.0
$7.0
$8.0
$9.0
$10.0
FYE 2018 FYE 2019 FYE 2020 FYE 2021 FYE 2022 FYE 2023 FYE 2024 FYE 2025 FYE 2026 FYE 2027
Mill
ions
Total Reserves
Operating Reserve SRF Loan 1 ReserveSRF Loan 2 Reserve System Impr. Capital ReserveEmergency Reserve Rate Stabilization Reserve
Wastewater Rates

Proposed Rates for WW Prop. 218 Notice
Monthly Fixed Charges
Variable Rates ($ / ccf)
Customer Class Existing Charge
Existing Charge
w/ SRF 2
FYE 2018 Proposed
Fixed Charge
FYE 2019 Proposed
Fixed Charge
FYE 2020 Proposed
Fixed Charge
FYE 2021 Proposed
Fixed Charge
FYE 2022 Proposed
Fixed Charge
ResidentialSFR $48.37 $63.66 $63.15 $66.63 $70.31 $74.19 $78.28 MFR $48.37 $63.66 $63.15 $66.63 $70.31 $74.19 $78.28
Non-ResidentialLow $9.47 $10.36 $11.30 $12.29 $13.33 Medium $1.83 $1.83 $9.47 $10.36 $11.30 $12.29 $13.33 High $1.83 $1.83 $9.47 $10.36 $11.30 $12.29 $13.33
Customer Class Existing Charge
Existing Charge
w/ SRF 2
FYE 2018 Proposed Variable Charge
FYE 2019 Proposed Variable Charge
FYE 2020 Proposed Variable Charge
FYE 2021 Proposed Variable Charge
FYE 2022 Proposed Variable Charge
Non-ResidentialLow
Range$2.44 - $3.49
Range$3.88 - $4.93
$5.57 $5.84 $6.13 $6.44 $6.76 Medium $6.59 $6.96 $7.35 $7.76 $8.19 High $7.91 $8.40 $8.92 $9.47 $10.05
SRF #2• $15.29 per Residential Unit
8Wastewater Rates

Staff Recommendations Adopt Fee Study Report Direct Staff to Proceed with Public Notice
& Rate Adoption Process
9Wastewater Rates

CAPACITY CHARGES & CONNECTION FEES
10Capacity Fee Overview
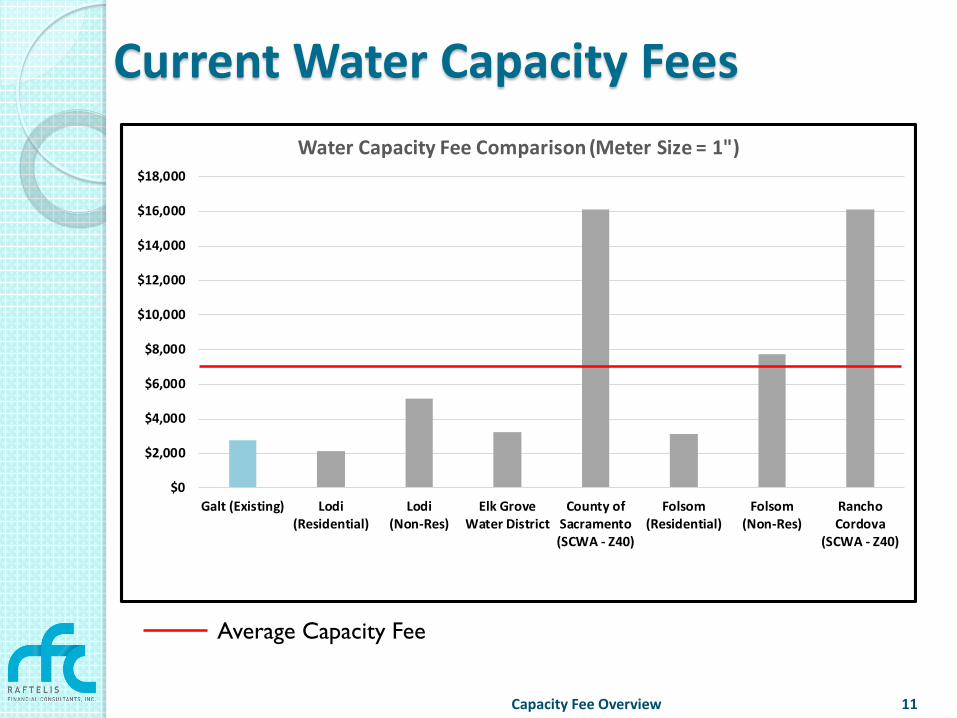
11
Current Water Capacity Fees
$0
$2,000
$4,000
$6,000
$8,000
$10,000
$12,000
$14,000
$16,000
$18,000
Galt (Existing) Lodi(Residential)
Lodi(Non-Res)
Elk GroveWater District
County ofSacramento(SCWA - Z40)
Folsom(Residential)
Folsom(Non-Res)
RanchoCordova
(SCWA - Z40)
Water Capacity Fee Comparison (Meter Size = 1")
Capacity Fee Overview
Average Capacity Fee

12
Current Wastewater Capacity Fees
$0
$5,000
$10,000
$15,000
$20,000
$25,000
Galt (Existing) Lodi(Residential)
Lodi(Non-Res)
Elk Grove(SASD+SCRSD)
County ofSacramento
(SASD+SCRSD)
Rancho Cordova(SASD+SCRSD)
Folsom(Residential)
Wastewater Capacity Fee Comparison (Meter Size = 1")
12Capacity Fee Overview
Average Capacity Fee
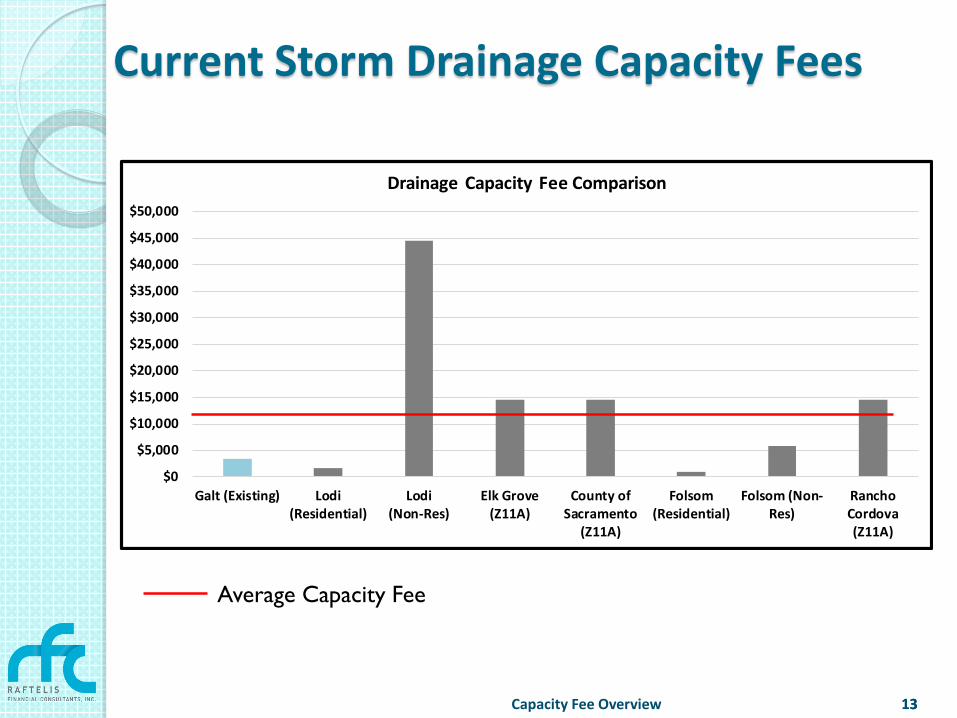
13
Current Storm Drainage Capacity Fees
$0
$5,000
$10,000
$15,000
$20,000
$25,000
$30,000
$35,000
$40,000
$45,000
$50,000
Galt (Existing) Lodi(Residential)
Lodi(Non-Res)
Elk Grove(Z11A)
County ofSacramento
(Z11A)
Folsom(Residential)
Folsom (Non-Res)
RanchoCordova(Z11A)
Drainage Capacity Fee Comparison
13Capacity Fee Overview
Average Capacity Fee

Current Revenue Fee Projections vs. Capital Improvements Total CostsCapacity Fee Revenue Water – $18M Wastewater – $56M Storm Drainage – $8M
Capital Improvements Water – $83M Wastewater – $81M Storm Drainage – $93M
14Capacity Fee Overview

PROPOSED CITY UTILITY CAPACITY FEES
15Capacity Fee Overview
Agenda
System Buy-in Method Incremental Cost Method Methodology Recommendations
Capacity Fee Overview 16

System Buy-in Method The “buy-in” approach rests on the premise that new
customers are entitled to service at the same price as existing customers. Commonly used in the following cases:◦ Existing customers have already developed the facilities that
will serve new customers. ◦ Growth projections through “Build-Out” is difficult to forecast
with precision. ◦ Buy-In rate is sufficient to cover future capital needs.◦ Strong nexus based on actual investment in system. ◦ Agency doesn’t have a comprehensive, long-term capital
improvement plan.
17Capacity Fee Overview

System Buy-In Method
Focuses on Total Value of Existing System
Recognizes level of service provided to existing users from current system investment
Typical Approaches for System Value: ◦ OC, OCLD, RC, RCLD
Value of Existing System
Asset Value
Replacement Cost
Depreciation andDebt Proceeds
Current
Demand
Buy-In Cost
($ / gal)
18Capacity Fee Overview

Incremental Cost Method
Under the incremental-cost approach, new customers pay for additional capacity requirements. ◦ Ties directly to Capital Master Plan ◦ Future costs are spread only over remaining
users/demand◦ Existing facilities with additional capacity are
also included to ensure new development pay their fair-share
19Capacity Fee Overview

Incremental Cost Method Focuses on the cost of additional facilities included
in the Capital Master Plan that are planned to provide the incremental capacity needed to accommodate remaining growth
Total Capital Improvements
Benefiting Growth
Incremental
Increase in
Capacity
Incremental Cost($ / gal)
20Capacity Fee Overview

Methodology Recommendations RFC recommends System Buy-In◦ Based on existing assets escalated to 2017 $$◦ Index each year based on CCI within ENR
Incremental cost method generated fees 2x – 3x higher than existing total fees◦ Difficult to absorb◦ May inadvertently halt development
21Capacity Fee Overview

Proposed Water Capacity Fee CalculationExisting – $2,780 for Meter size 1” (or less)
o Updated Fee CalcuationoAssets valued at RCLD - $53,514,104• Allocated over existing equivalent meters
(corresponds to the water rate study) – 8,110
Proposed – $6,598 for Meter size 1” (or less)
Capacity Fee Overview 22

Proposed Wastewater Capacity Fee Calculation Existing - $8,707 per equivalent unit
*1 Equivalent Unit = 250 gpd
o Updated Fee Calculation
Proposed – $7,946 per equivalent unit
Capacity Fee Overview 23
Collection ComponentWastewater Collection System Value $57,242,300÷ Current Capacity 3,000,000 gpd$ per gallon per day $19.08× Average Single-Family Demand 250 gpdWastewater Collection Buy-In Component $4,770
Treatment ComponentWastewater Treatment System Value $38,117,458÷ Current Capacity 3,000,000 gpd$ per gallon per day $12.71× Average Single-Family Demand 250 gpdWastewater Treatment Buy-In Component $3,176

Proposed Storm Drainage Capacity Fee CalculationExisting - $3,324 per Acreo Updated Fee Calculation
Proposed - $6,644 per Impervious Acre
Capacity Fee Overview 24
Storm Drainage System Value $30,313,219÷ Total Build-Out Imp. Acres 4,562 AcresStorm Drainage Buy-In Component $6,644
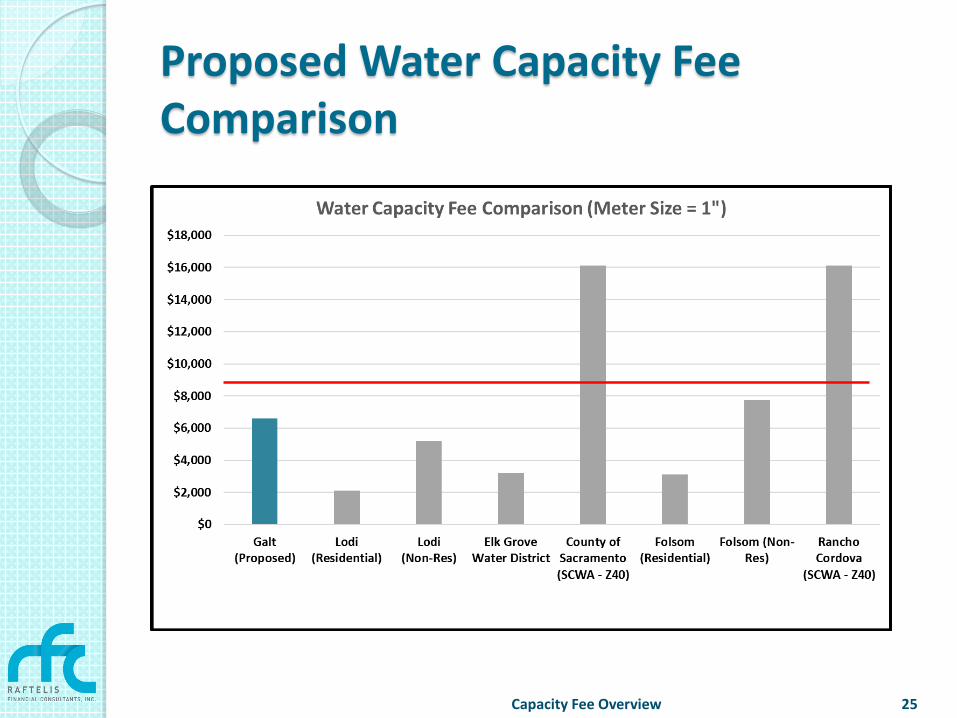
Proposed Water Capacity Fee Comparison
Capacity Fee Overview 25

Proposed Wastewater Capacity Fee Comparison
Capacity Fee Overview 26
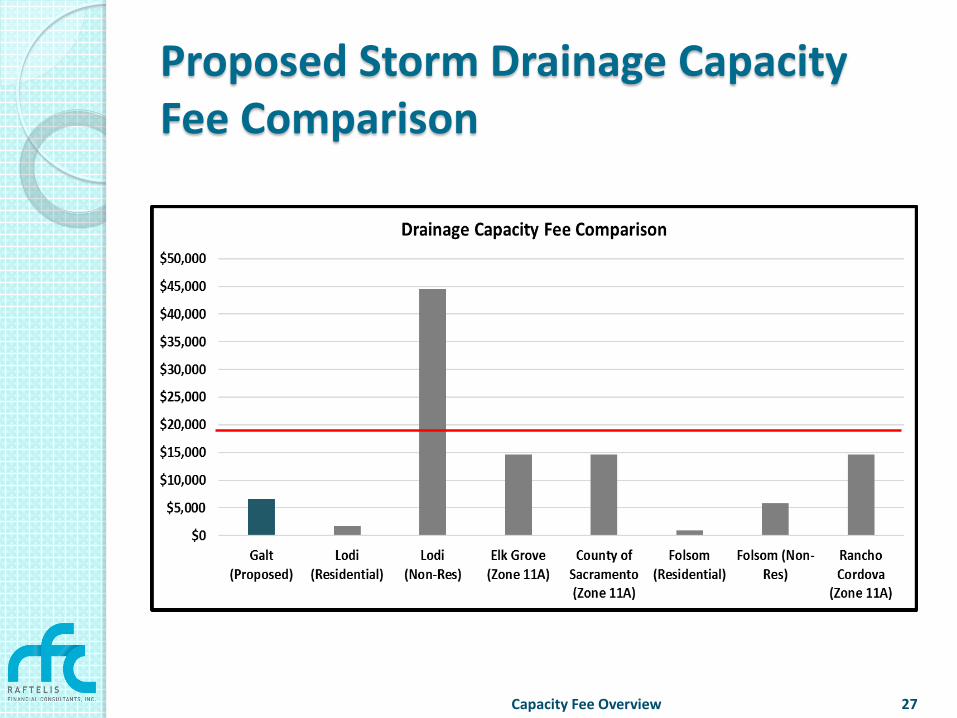
Proposed Storm Drainage Capacity Fee Comparison
Capacity Fee Overview 27

Total Capacity Fees
Capacity Fee Overview 28
Utility Current Proposed Difference
Water $2,780 $6,598 $3,818
Wastewater $8,707 $7,946 -$761
Storm Drainage
$3,324 per Imp Ac $6,644 per Imp Ac $3,320

Estimated Revenue Fee Projections based on Proposed FeesCapacity Fee Revenue Water – $43M Wastewater – $81M Storm Drainage – $16M
Capital Improvements Water – $83M Wastewater – $81M Storm Drainage – $93M
29Capacity Fee Overview

Staff Recommendations Provide feedback on Capacity Fee Report Return with Updated Capacity Fee Report
on September 19
30Capacity Fee Overview