1.11. gold resources and production - uts: missing...
TRANSCRIPT

Gold Peak Minerals Case Study October 2012 ‐ Mudd et al. 1
CLUSTER RESEARCH
REPORT No. 1.11
Gold resources and production: Australia in a global context
Prepared by:
Department of Civil Engineering, Monash University Institute for Sustainable Futures, University of Technology, Sydney
For CSIRO Minerals Down Under National Research Flagship
G. Mudd, D. Giurco, S. Mohr, L. Mason

Gold Peak Minerals Case Study October 2012 ‐ Mudd et al. 2
ABOUT THE AUTHORS
Department of Civil Engineering: Monash University The Department of Civil Engineering, within the Faculty of Engineering at Monash University aims to provide high quality Civil Engineering education, research and professional services globally for the mutual benefit of the students, the staff, the University, industry, the profession and the wider community
For further information visit www.eng.monash.edu.au/civil/
Research team:
Dr. Gavin M. Mudd, Senior Lecturer; Mr. Zehan Weng, Research Assistant.
Institute for Sustainable Futures: University of Technology, Sydney The Institute for Sustainable Futures (ISF) was established by the University of Technology, Sydney in 1996 to work with industry, government and the community to develop sustainable futures through applied research. Our mission is to create change toward sustainable futures that protect and enhance the environment, human well‐being and social equity. We seek to adopt an inter‐disciplinary approach to our work and engage our partner organisations in a collaborative process that emphasises strategic decision making.
For further information visit www.isf.uts.edu.au
Research team:
Dr. Steve Mohr, Senior Research Consultant; Ms. Leah Mason, Senior Research Consultant; Dr. Damien Giurco, Research Director.
CITATION Cite this report as:
Mudd, G., Giurco, D., Mohr, S., Mason, L. (2012). Gold resources and production: Australia in a global context. Prepared for CSIRO Minerals Down Under Flagship, by the Department of Civil Engineering (Monash University) and the Institute for Sustainable Futures (University of Technology, Sydney), October 2012. ISBN978-1-922173-47-8.
ACKNOWLEDGEMENT This research has been undertaken as part of the Minerals Futures Research Cluster, a collaborative program between the Australian CSIRO (Commonwealth Scientific Industrial Research Organisation); The University of Queensland; The University of Technology, Sydney; Curtin University; CQUniversity; and The Australian National University. The authors gratefully acknowledge the contribution each partner and the CSIRO Flagship Collaboration Fund. The Minerals Futures Cluster is a part of the Minerals Down Under National Research Flagship, http://www.csiro.au/Organisation‐
Structure/Flagships/Minerals‐Down‐Under‐Flagship/mineral‐futures‐collaboration‐cluster.aspx.
Cover image: Gold mine in Victoria, Australia (Fir0002/Flagstaffotos) and 1 tonne gold coin (Perth Mint)

Gold Peak Minerals Case Study October 2012 ‐ Mudd et al. 3
CONTENTS 1. BACKGROUND 5 1.1. Aim 5 1.2. Introduction 6
2. THE GOLD MINING SECTOR 8 2.1. Brief history of gold mining 8 2.2. Historical gold price 9 2.3. Historical gold demand 10 2.4. Gold ores 11 2.4.1. Types of gold ores 11 2.4.2. Defining gold ore reserves and resources 12
2.5. Overview of gold mining and processing technologies 14
3. GLOBAL GOLD MINING DATA 18 3.1. Historical gold production 18 3.2. Current mines and economic resources 19 3.2.1. Producing gold mines 20 3.2.2. Economic gold resources 23
3.3. Key industry trends 28 3.3.1. Declining ore grades 28 3.3.2. Variability of economic resources 28 3.3.3. Increasing open cut mining and waste rock 29 3.3.4. Increasing mine depth 30 3.3.5. Increasing environmental constraints 30
4. GOLD MINING IN AUSTRALIA 32 4.1. Historical Australian production 32 4.2. Current mines and economic resources 36 4.2.1. Producing gold mines 37 4.2.2. Economic gold resources 40
5. ISSUES AFFECTING COMPETITIVENESS 44 5.1. Data on key industry trends 44 5.1.1. Waste rock production and issues (Australian mines) 44 5.1.2. Water intensity and issues (global data set) 45 5.1.3. Energy intensity and issues (global data set) 46 5.1.4. Greenhouse gas emissions intensity and issues (global data set) 47
5.2. Future considerations 49 5.2.1. Open cut mining and waste rock 49 5.2.2. Water use 50 5.2.3. Energy use 50 5.2.4. Chemical use 50
5.3. Environmental reporting and responsible supply chains 51
6. SUMMARY AND CONCLUSIONS 52
7. REFERENCES 53
APPENDIX A 58

Gold Peak Minerals Case Study October 2012 ‐ Mudd et al. 4
FIGURES
Figure 1: Gold prices in nominal (prices of the day) and real prices (inflation‐adjusted to US$1998)
Figure 2: Gold demand by type (left) and country (right)
Figure 3: Differing categories and relationships between ore reserves and mineral resources
Figure 4: Schematic of a combined open cut and underground mining project
Figure 5: Overview of principal process configurations for gold ore processing and extraction
Figure 6: Historical gold production by country
Figure 7: Historical western world gold discovery and exploration expenditure
Figure 8: Gold ore reserves for Chambers of Mines of South Africa members
Figure 9: Gold mineral resources over time of four major South African gold companies
Figure 10: Gold ore grades over time
Figure 11: Economic gold resources for some countries (left) and years remaining (right) over time
Figure 12: Minimum annual waste rock (left) and waste rock‐to‐ore ratios (right) over time
Figure 13: Gold tailings dumps, acid and metalliferous drainage (AMD), dust and environmental and
social conditions in the West Rand, Johannesburg, October 2010
Figure 14: Historical Australian gold production by state (top) and by proportion (bottom)
Figure 15: Historical Australian gold production by ore type
Figure 16: Locations of historic and operating Australian gold mines and remaining economic
deposits
Figure 17: Long‐term trends in Australia’s economic and sub‐economic gold resources
Figure 18: Australia’s economic gold resources and the influence of the Olympic Dam and Cadia
Valley projects
Figure 19: Grade‐tonnage curve for Australian gold resources
Figure 20: Cumulative frequency curves for Australian gold resources: contained gold (left); ore
grades (right)
Figure 21: Long‐term trends in ore grade, ore milled and (minimum) waste rock for Australia
Figure 22: Water intensity of gold production – (i) unit water intensity versus ore processing scale
(top); (ii) unit water intensity versus ore grade (bottom).
Figure 23: Unit energy intensity of gold production versus ore grade
Figure 24: Unit greenhouse gas emissions intensity of gold production versus ore grade
Figure 25: Unit greenhouse gas emissions intensity of gold production versus unit energy intensity
TABLES Table 1: Approximate total gold production by country (1848‐2010) and 2010 production by country
Table 2: Major global gold mines producing >10 t Au/year
Table 3: USGS 2010 gold reserves by country (t Au)
Table 4: Attributable gold mineral resources >300 t Au by major companies
Table 5: Cumulative Australian gold production by state, 1851‐2010, and 2010 production (t Au)
Table 6: Australian gold mines
Table 7: Top 25 Australian gold resources
Table 8: Australian gold resources by primary metals
Table 9: Australian gold resources by state

Gold resources and production: Australia in a global context
Gold Peak Minerals Case Study October 2012 ‐ Mudd et al. 5
1. BACKGROUND This report forms part of the Commodity Futures component of the Mineral Futures
Collaboration Cluster as a case study on gold in Australia. The Commodity Futures project
focuses on the macro‐scale challenges, the dynamics, and drivers of change facing the
Australian minerals industry. The Commodity Futures project aims to:
Explore plausible and preferable future scenarios for the Australian minerals industry
that maximise national benefit in the coming 30 to 50 years
Identify strategies for improved resource governance for sustainability across scales,
from regional to national and international
Establish a detailed understanding of the dynamics of peak minerals in Australia, with
regional, national and international implications
Develop strategies to maximise value from mineral wealth over generations,
including an analysis of Australia’s long‐term competitiveness for specified minerals
post‐peak.
This report covers the case study on gold mining in Australia and assembles a valuable
‘bottom‐up’ data compendium on available resources and production. It also explores
changes in environmental and technological challenges facing gold‐related mining and
mineral industries in Australia in a global context.
1.1. Aim
The aim of this report is to provide a comprehensive data source on gold resources and
production. In addition, discussion of the link between resources, technology and changing
environmental impacts over time provides a basis for informing future research priorities in
technology and resource governance models.
Given that gold has shown boom‐bust cycles in the past, it is therefore important to assess in
detail the current state of Australia’s gold industry, especially in comparison to global trends
and issues, with a view to ensuring the maximum long‐term benefit from Australia’s gold
mining sector. This report aims to achieve such a detailed study – examining key trends in
gold mining, such as economic resources, production and environmental issues, and placing
these in context of the global gold industry. In this manner, it is possible to assess the
current state of Australia’s gold industry and facilitate informed debate and decision making
on the future of the sector.

Gold resources and production: Australia in a global context
Gold Peak Minerals Case Study October 2012 ‐ Mudd et al. 6
1.2. Introduction
Gold is a lustrous, yellow metal which is malleable and relatively chemically inert.
Throughout human history, gold has enjoyed a special place as a preferred metal for
jewellery and signifying wealth and power – with widespread gold use by the ancient
Egyptians and across Europe and Asia. After the discovery of gold in California in 1848 and
eastern Australia in 1851, massive gold rushes ensued which saw hundreds of thousands of
people flock to the areas to strike it rich. The biggest boom was to come from the discovery
of the Witwatersrand Basin in northern South Africa in 1886. Gold was a central factor in the
rapid economic development of these otherwise fledgling colonies.
By the mid‐20th century, however, the role and importance of gold had substantially declined
and its production was relatively minor throughout the world (except for South Africa, which
still dominated). In the 1970s, two key events propelled gold to a new and even bigger boom
– the deregulation of the gold price and the development of carbon‐in‐pulp (CIP) process
technology. These two outcomes led to a major global revival of the gold mining industry,
since lower grade ores could be readily processed using CIP technology and the sustained
higher prices ensured profitable operations.
At the start of the 21st century, gold mining was a major economic activity for Australia, USA,
South Africa (but declining), and many countries around the world. Global production over
the 2000s has been somewhat stagnant, averaging around 2,500 tonnes per year (or about
80.4 million ounces or ‘oz’1). The ongoing rise in demand (particularly from India. but also
China) as well as global financial uncertainty has been a major factor in the continuing rise in
the gold price, reaching record highs of some $48,000 per kilogram (i.e. ~$1,500/oz) in early
2011 – which is helping to reverse the trend of stagnant production.
Australia remains a major global gold producer, with production of ~261 tonnes in 2010
(ABARE, var.‐a), and is ranked second behind China with ~345 tonnes (USGS, var.‐a). The USA
held third place in 2010 with ~230 tonnes, while South Africa and Russia both produced ~190
tonnes. A perceived advantage of Australia’s gold industry is extensive gold mineral
resources and highly prospective regions for new discoveries or additions to existing
deposits or mines.
For some regions around the world, especially developing nations, small scale and artisanal
mining can be an important source of gold. Whilst it supports livelihoods and communities, it
is not without significant environmental impacts and health impacts for miners. Given that
this activity is extremely limited in Australia, this report will not cover this part of the global
gold industry – although small scale and artisanal gold mining remains a crucial nexus
between social, environmental and economic issues in these regions.
1Metric units are used throughout this report, but given the enduring popularity of the ounce in the gold industry, limited reference is still
made to this unit where reasonable.

Gold resources and production: Australia in a global context
Gold Peak Minerals Case Study October 2012 ‐ Mudd et al. 7
The dominant uses of gold continue to be jewellery and storage of financial value2, with both
uses lending themselves to long product life and easy recycling. A minor proportion of gold is
used in electronics, dentistry and other areas. This makes gold very unique in comparison to
almost all other mineral and metal commodities, which have utilitarian uses such as pipes,
cars, infrastructure, energy, chemicals, and so on.
2In 2011, jewellery and financial demand was 48.3% and 36.6%, respectively (WGC, var.); see later section.
Gold resources and production: Australia in a global context
Gold Peak Minerals Case Study October 2012 ‐ Mudd et al. 8
2. THE GOLD MINING SECTOR
2.1. Brief history of gold mining
Throughout recent human history, gold has enjoyed a special role as a preferred metal for
jewellery and signifying wealth and power – with widespread gold use by various ancient
societies, across Europe and Asia. The possession of gold was therefore tightly controlled to
ensure that the state had control of wealth and power (especially monarchies).
This monopoly was broken when gold was found in California in the United States of
America (USA) in 1848 – and, given it was ‘finders keepers’, this lead to a population surge in
1849 with immigrants hoping to strike it rich. In 1851, gold was discovered in eastern
Australia and the world saw another major gold rush – hundreds of thousands of people
flocked from Europe, including some from China, to strike it rich in Australia. In 1886, gold
was discovered in northern South Africa, an area to become known as the Witwatersrand
Basin, and this region dominated global gold production for the next century. Gold was a
central factor in the rapid economic development of these otherwise fledgling colonies, as
well as conflicts such as the second Boer War in South Africa (1899‐1902).
Following the Boer War, South Africa rose to global dominance of gold production and
remained the world’s leading annual producer until 2007 when China took over the mantle
of world’s largest producer. South African production grew rapidly after the Boer War, rising
to 289.2 t by 1916 and rising gradually to a peak of 448.1 t in 1941, averaging 370 t/year
throughout the 1930‐40s (Hartnady, 2009; Mudd, 2007a). After World War 2, however, gold
production staged remarkable growth and surged to a new peak of 1,000 t in 1970 – mainly
due to the development of deep new fields at Carletonville, Klerksdorp, Free State and
Evander (Hartnady, 2009). Since this high point the decline in South African gold production
has been terminal – and in 2010 was only 190 t (USGS, var.‐a). Over a period of about 125
years, South African production has totalled some 51,500 t – about three times its nearest
rival, the USA, with some 17,400 t (data updated from (Mudd, 2007a). Throughout the vast
majority of the twentieth century, South Africa dominated annual world gold production, led
by its rich endowment in the Witwatersrand Basin.
By the 1970s, the US Bureau of Mines had developed a new method of using cyanide to
leach gold. The process involved the use of carbon to adsorb cyanide‐gold complexes
suspended in a pulp, and became known as carbon‐in‐pulp or CIP. The advent of CIP was a
breakthrough for gold processing, as it was a very robust and reliable gold extraction
process, could obtain high recoveries and was generally insensitive to water quality –
allowing even highly saline brines to be used. The use of CIP allows low grade ores to be
processed as well as the emergence of heap leaching for gold (Close, 2002; Mudd, 2007a).
Around the same time as the development of CIP process technology (and its close variants),
the gold price began to rise. Historically, the gold price had been constant and maintained by
governments. However, in 1968, this financial system was failing and private gold prices

Gold resources and production: Australia in a global context
Gold Peak Minerals Case Study October 2012 ‐ Mudd et al. 9
were allowed to fluctuate while government accounts still used the fixed price. In 1975 the
gold price was left completely to the market – and it began a strong and permanent rise.
Combined, the emergence of CIP technology and the rising gold price led to an astounding
resurgence in gold exploration and mining worldwide – led by countries such as the USA,
Australia, Canada and increasingly less developed countries such as Ghana, Peru and most
recently China emerging as the world leader from 2007. A new global record for annual
production of 2,616 t was reached in 2001, with production since averaging ~2,500 t.
2.2. Historical gold price The price of gold was fixed at a constant value for centuries, largely to facilitate regulation
and control of gold ownership. Throughout the 1800s the price in the British Empire, and
colonies such as Australia, was set at £3.17s.10d/oz (or £3.89/oz) (Officer & Williamson,
2010) (~US$600/kg; (Kelly et al., 2010). The price was increased slightly during the 1930s
Great Depression, leading to a relatively minor boom in production terms though this was
primarily helpful in socio‐economic terms. The principal structural problem facing gold
miners was a constant price, declining ore grades and increasing production costs –
gradually leading to many mines becoming unprofitable and fields closing down.
In 1970, the gold price was $1,036 per kilogram (or $32 per ounce), or in US currency
US$1,156/kg (US$36/oz) – but due to partial deregulation of the private gold price in 1968, it
had reached $3,951/kg by 1975 (US$5,184/kg) (ABARE, var.‐b). In 1975, the gold price was
fully deregulated, and by 1980 had reached $17,280/kg (US$19,695/kg). Since this time, the
gold price fluctuated in this range, but began to rise consistently from 2004 and reached
record historical highs of $48,000/kg in early 2011. The long‐term trend in nominal prices of
the day and real prices relative to US$1998 is shown in Figure 1.
Figure 1: Gold prices in nominal (prices of the day) and real prices (inflation‐adjusted to US$1998) (data combined from (Kelly et al., 2010; Officer & Williamson, 2010)
0
200
400
600
800
1,000
1,200
0
5
10
15
20
25
30
35
40
1835 1860 1885 1910 1935 1960 1985 2010
Go
ld P
rice
(U
S$/
oz
Au
)
Go
ld P
rice
(U
S$1
000/
kg A
u)
Gold Price of the Day
Real Price $1998 (USGS)

Gold resources and production: Australia in a global context
Gold Peak Minerals Case Study October 2012 ‐ Mudd et al. 10
2.3. Historical gold demand
The major demands for gold have historically always been for jewellery and financial uses,
with jewellery now the principal demand. Of the total yearly supply of gold to the market,
90% goes to fabricated products, and 10% to private investors and monetary reserves.
Jewellery accounts for 85% of world gold fabricated each year (USGS 2005). The most
important countries for demand are India, China and, to a moderate extent, those in the
Middle East. Gold demand by source and country/region is shown in Figure 2.
Figure 2: Gold demand by type (left) and country (right) (data from (WGC, var.)
Note: differences are due to WGC data.
In many developing countries, there still remains a functional overlap between gold
jewellery and money. Most of the gold mined in the last millennia still exists in an above
ground, trillion‐dollar ‘potential stockpile’ adding a unique twist to the ‘sociotechnical
landscape’ for gold.
The technological uses for gold are primarily electronics, but (WGC, var.) statistics also
include dentistry in this category. The recent establishment of ETFs, or Exchange Traded
Funds, has provided a new demand for gold, and they allow people to invest in the price of
gold backed by physical gold bullion. The rise of ETFs has offset the general decline in
jewellery demand throughout the 2000s. The ongoing rise in demand in India and China is
generally making up for declines across the rest of the world, especially countries like Japan
which now effectively sells gold rather than demanding it (i.e. negative demand).
The variety of uses that global culture has for gold highlights significant differences in drivers
for different metals.
0
700
1,400
2,100
2,800
3,500
4,200
1999 2001 2003 2005 2007 2009 2011
Go
ld D
eman
d (
t A
u/y
ear)
Jewellery
Bars &Coins
ETFs
Technology
-500
0
500
1,000
1,500
2,000
2,500
3,000
3,500
4,000
1992 1994 1996 1998 2000 2002 2004 2006 2008 2010
Go
ld D
eman
d b
y C
ou
ntr
y (t
Au
/ye
ar)
Japan
India
China
TurkeyUSA
Europe
Rest ofthe World
Japan(negative)
Gold resources and production: Australia in a global context
Gold Peak Minerals Case Study October 2012 ‐ Mudd et al. 11
2.4. Gold ores
2.4.1. Types of gold ores
Gold can be found in a wide variety of economic ore types, in either stand‐alone ores or in
conjunction with a range of other metals such as copper, silver, zinc, and others. Gold can be
extracted from polymetallic ores as a co‐ or by‐product, depending on relative grades,
market prices and ore processing configuration. In general, the dominant source has been
gold‐only ores, but increasingly gold is being extracted from copper‐gold, silver‐gold or other
polymetallic deposits (e.g. Pb‐Zn‐Ag‐Cu‐Au).
The principal types of economic gold ores include (McKibben, 2005; USEPA, 1994):
Archaean Gold‐Quartz Conglomerates (‘Palaeoplacers’): lithified and metamorphosed coarse
sediments of Archaean age (about 2.5 billion years old), with both placer and hydrothermal
models proposed for gold emplacement. The biggest example is the Witwatersrand gold field
of South Africa, which has produced more than a third of the world’s gold.
Orogenic Lode: metamorphosed rocks formed during orogenic (mountain‐building) events,
occurring near major tectonic shear zones. The ages of orogenic gold deposits can range from
Archaean to Mesozoic or Tertiary (about 250 to 2.5 million years ago). The 1849 gold rush of
California was based on the Mother Lode orogenic gold district.
Epithermal: deposits formed during shallow volcanism, and associated hydrothermal fluid
movements, giving rise to high grade veins and/or disseminated low grade ores. Famous
examples include Cripple Creek in Colorado, USA and Lihir Island in Papua New Guinea.
Carlin‐Type: a hybrid somewhere between orogenic and epithermal deposits, and contains
finely disseminated low grade ores. The name is based on the dominant example of the Carlin
District in Nevada, USA.
By‐Product: gold is commonly found in association with porphyry and skarn copper deposits
(e.g. Bingham Canyon, USA; Grasberg, West Papua, Indonesia), volcanogenic massive sulfide
deposits (e.g. Mt Lyell, Tasmania; Golden Grove, Western Australia), or iron oxide copper‐
gold deposits (e.g. Olympic Dam, South Australia).
Placers: gold can often be found enriched in some alluvial sediments, due to weathering of
nearby primary ores. Placer operations can range from a single person panning for gold
through to large scale dredging works, though overall placer‐derived gold is relatively minor
in global terms. Some important areas for placer mining include Alaska and the Yukon in
North America or New Zealand.
In general, gold can be widely found in a metallic (or native) state, often associated with
silver, but it can also form sulfide or other specific minerals with elements such as telluride,
mercury, arsenic, antimony or others. The mineral form of gold plays a key role in a deposit’s
characteristics, such as high or low grades and refractory or readily extractable, and the
ability to efficiently extract it with different ore processing technologies.

Gold resources and production: Australia in a global context
Gold Peak Minerals Case Study October 2012 ‐ Mudd et al. 12
2.4.2. Defining gold ore reserves and resources
In the gold rush days, miners would simply prospect for new exposures of visible gold reefs,
or through alluvial panning of river sediments. When a new field was discovered, this was
mined until it appeared that the gold had been exhausted, or economics made further
efforts unattractive. Many fields during the gold rush times were thereby subject to rapid
boom/bust cycles of population immigration and emigration.
For the gold mines that did last the decades into the middle 20th century, however, a more
sophisticated approach was developed to mine planning and development. By the 1950s, it
was common for gold mines to estimate remaining reserves through advance drilling and
assaying and mine development, with blocks or stopes of ore outlined forming the basis for
ongoing mining and gold production. For example, the gold mines of Kalgoorlie in 1950 had
~10.5 Mt of ore reserves yielding3 ~7.8 g/t and containing ~82.4 t outlined in underground
mine development and processed about ~1.6 Mt ore/year yielding ~7.5 g/t for ~12.3 t/year
(Campbell, 1953). Thus, in 1950, the Kalgoorlie ‘Golden Mile’ only had 6.5 years remaining –
yet it is still operating in 2011, having been in continuous operation (including the massive
expansion as part of the ‘SuperPit’ in 1989).
From a geochemical perspective, the average concentration of gold in the upper continental
crust is 1.5 µg/kg (i.e. parts per billion or ppb, also mg/t) (Rudnick & Gao, 2003), making gold
a relatively rare element compared to most other metals mined. In general, an economic
gold ore needs a concentration of several parts per million – or grams per tonne (g/t). In the
earliest days of the gold rush, ore grades for hard rock gold mines would average nearly an
ounce per tonne or 20‐30 g/t (with the gold often visible at this grade), whereas a modern
gold mine can now process grades as low as 0.5 g/t profitably (typically using heap leach,
with the gold being invisible), and by‐product mines having grades as low as 0.1 g/t.
From the early 1970s, following a range of high profile cases of poor reporting of mineral
resources in the Australian mining industry (e.g. the Poseidon nickel affair, or Nabarlek
uranium reserves bungle; see Sykes, 1995), the industry developed a systematic code to
estimate mineral reserves and resources. The code was named after its committee, the Joint
Ore Reserves Committee Code – or ‘JORC’ Code, with its first edition released in 1974, and
many updates and revision have been issued since. The most recent version of the JORC
Code was released in 2004 (AusIMM et al., 2004), and is compulsory for all mining and
exploration companies listed on the Australian Stock Exchange – as well as now being
expected as a minimum standard by financiers and shareholders to ensure high quality
estimates and certainty for the large investments required in mining projects. There are also
equivalent codes in other major mining countries such as Canada (i.e. National Instrument
43‐101; see (OSC, 2011), United Kingdom/Western Europe (see PERRRC, 2008) and South
Africa (i.e. SAMREC; SAMRCWG, 2009).
3Yield is gold extracted only, and is not assay or true ore grade.
Gold resources and production: Australia in a global context
Gold Peak Minerals Case Study October 2012 ‐ Mudd et al. 13
The two primary aspects that the JORC code considers are geological and economic
probability in claiming a mineral resource as ‘economic’. However, there are a range of
important ‘modifying factors’ that are important – such as mining, metallurgical, economic,
marketing, legal, environmental, social and governmental factors. Furthermore, there are
two primary categories of mineral resources – ore reserves and mineral resources. The
typical distinction is that ore reserves have a very high economic and geologic probability of
profitable extraction, while mineral resources have a reasonable geological probability but
are less certain economically. Short definitions are:
Ore Reserves: assessments demonstrate at the time of reporting that economic
extraction could reasonably be justified. Ore Reserves are sub‐divided in order of
increasing confidence into Probable Ore Reserves and Proved Ore Reserves.
Mineral Resources: the location, quantity, grade, geological characteristics and
continuity of a Mineral Resource are known, such that there are reasonable
prospects for eventual economic extraction; not all modifying factors have been
assessed and hence some uncertainty remains. Mineral Resources are sub‐divided, in
order of increasing geological confidence, into Inferred, Indicated and Measured
categories, and can be reported as inclusive of ore reserves, or separate and in
addition to ore reserves.
To avoid possible confusion with the JORC code, all reference to ‘resources’ will be used in
the general sense as discussed in Appendix A. When the specific terms of ore reserves or
mineral resources are used, they are intended to be consistent with the JORC code. For
completeness, the full definitions of ore reserves, mineral resources and their sub‐categories
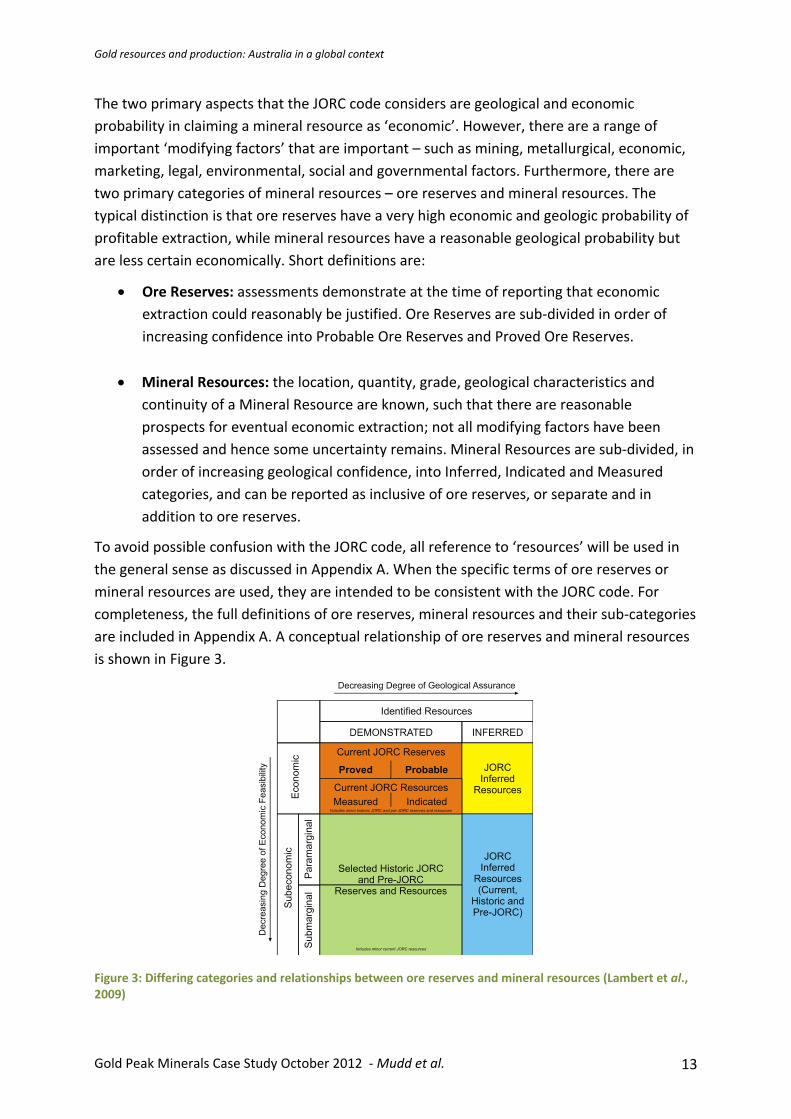
are included in Appendix A. A conceptual relationship of ore reserves and mineral resources
is shown in Figure 3.
Figure 3: Differing categories and relationships between ore reserves and mineral resources (Lambert et al., 2009)

Gold resources and production: Australia in a global context
Gold Peak Minerals Case Study October 2012 ‐ Mudd et al. 14
The United States Geological Survey (USGS) use ‘reserves’ and, until very recently the
category of ‘reserves base’ (see (USGS, var.‐a). These are broadly similar to JORC’s ore
reserves and mineral resources, respectively, although the USGS also allow for greater
inclusion of inferred mineral resources in the reserves base category (Appendix A). An
excellent analysis of JORC, and its comparison to other systems is given by (Lambert et al.,
2009). In 2010, the USGS stopped using reserves base, due to its higher uncertainty and
confusion it caused in comparison to formal codes such as JORC.
For an exploration or mining company, the reporting of an economic gold reserve or
resource therefore comes down to the tonnage of ore (e.g. 1 Mt), its assay grade (e.g. 1 g/t)
and the contained amount of gold (e.g. 1 t) – estimated based on extensive drilling and
metallurgical testing, relevant statutory approvals for development, mine planning, ore
processing design, economic and environmental assessments and so on.
Given the long time frames and large funding required, only the minimum effort is expended
to bring a project into full production profitably, and thus with ongoing exploration,
efficiencies, or changing economics (such as a rising gold price), a gold mining project may
often last considerably longer than its initial reserves may suggest.
2.5. Overview of gold mining and processing technologies
In the height of the gold rush era, most gold was won through manual labour, using methods
such as pans and sluicing. As the alluvial fields were exhausted, attention quickly moved to
the underlying source quartz reefs. For the vast majority of mines, gold was extracted using
underground mining techniques until the advent of the 1980s gold boom, during which time
moves were made to large scale, low‐grade open cut mines.
In recent decades, a wide variety of underground mining techniques have been developed,
ranging from narrow vein techniques for high‐grade ores and reefs (e.g. Witwatersrand
Basin), to moderate size stopes or even large scale block cave mines. Underground mines are
used where the deposit is deep or inaccessible via open cut, and are commonly based on
relatively high grades (i.e. >5 g/t). Lower grade ores are excluded during underground mines.
An open cut mine is typically dug using trucks and shovels. Given the cheap relative cost of
diesel (until recently), open cut mining is commonly cheaper and extracts most or all of the
gold ore, but produces considerable quantities of waste rock. The emergence of ammonia
nitrate fuel oil (ANFO) explosives from the 1960s was also a key factor in making open cuts
economically viable (Mudd, 2007b).
At some gold projects, they may have several open cut and underground mines in operation
simultaneously. Many mines may start as open cuts and as waste‐to‐ore ratios increase, an
underground extension may then be developed. A schematic of a typical gold mining layout
is given in Figure 4.

Gold resources and production: Australia in a global context
Gold Peak Minerals Case Study October 2012 ‐ Mudd et al. 15
Figure 4: Schematic of a combined open cut and underground mining project (Mudd, 2009a)
Gold can be an especially difficult metal to extract from rocks, depending on mineral form
and ore grades, and as such a variety of methods have evolved over time to facilitate
economic extraction. In general, very few chemicals dissolve gold, with the main methods
using mercury or cyanide. Mercury is direct but not very efficient, as well as being highly
toxic. Cyanide is highly selective in dissolving gold and is generally highly efficient, recovering
a high fraction of the gold. The discovery of dissolved gold’s strong affinity for carbon by the
US Bureau of Mines was a major breakthrough in the early 1970s, which rapidly evolved into
the carbon‐in‐pulp (CIP) technology for gold ore processing.
A schematic of the overall approach to gold ore processing is shown in Figure 5, including all
major variants of technologies currently in use. The primary technologies include:
Carbon‐in‐Pulp (CIP): gold is leached from crushed and slurried gold ore using cyanide, the solution is then treated in a separate vessel with activated carbon and the loaded carbon then eluted for gold.
Carbon‐in‐leach (CIL): gold is leached from crushed and slurried gold ore using cyanide with activated carbon in the same vessel, the loaded carbon is then separated and eluted for gold.
Another possible variation in gold ore processing is the use of thiosulfate , which can also
dissolve gold but is less efficient and not as robust as cyanide‐based technology (for further
details, see Muir & Aylmore, 2004; Heath et al., 2008). The use of thiosulfate would most
likely be combined with in situ leach mining methods, but the approach appears to remain
uneconomic at present.

Gold resources and production: Australia in a global context
Gold Peak Minerals Case Study October 2012 ‐ Mudd et al. 16
Figure 5: Overview of principal process configurations for gold ore processing and extraction (redrawn from (USEPA, 1994)
Merrill Crowe: gold is precipitated from solutions using zinc dust, which is then separated and further processed.
Flotation: passing air bubbles through an ore slurry containing reagents such as oils allows sulfide minerals to attach to bubble surfaces, preferentially concentrating the sulfides which can then be collected as an enriched concentrate.
Gravity: due to gold’s heavy molecular mass, when it is free form it can be readily extracted using simple methods which rely on gravity separation techniques, such as gold panning or sluicing or during crushing and grinding.
InLine Leach Reactor (ILR): specially designed cyanide leach reactor to treat concentrates (a proprietary technology from Gekko Systems), and can be operated in continuous or batch mode.
CyanidationBase MetalFlotation Placer
SizingCrushing &Grinding
Smelting
VatLeaching
HeapLeaching
Extraction(Open Pit or Underground)
RoastingAutoclaving &Biooxidation
Flotation
Agglomeration Carbon-In-Pulp Carbon-In-Leach
Crushing
Coarse GravityConcentration
Fine GravityConcentration
Base MetalSmelting
Base MetalRefining
Tank Leaching
HeapLeaching
Concurrent TankLeaching &
Gold Adsorptionon Activated
CarbonGold Adsorption onActivated Carbon
(Gold Slimes toPrecious Metals
Recovery)ZincPrecipitation
Electrowinning
Elution(strippinggold fromactivatedcarbon)
Refining
Elution (stripping goldfrom activated carbon)
Crushing
Electrowinning ZincPrecipitation

Gold resources and production: Australia in a global context
Gold Peak Minerals Case Study October 2012 ‐ Mudd et al. 17
Mercury amalgam: when mercury is added to gold ore, a gold‐mercury amalgam is formed, which can readily be recovered and the gold extracted, although at significant risks of environmental and worker exposure due to mercury’s high toxicity.
Bioxidation: bacteria are used in controlled reactors to oxidise the sulfide minerals and liberate the gold from within the sulfide minerals.
Roasting: for refractory sulfide gold ores, roasting (heating the ore) can be used to convert the sulfide to sulfur dioxide and liberate the gold from within the sulfide minerals.
Autoclaves and Oxidation Reactors: for some refractory gold ores, contained reactor vessels are used to process ores at high temperatures and/or pressures to facilitate rapid oxidation and release of gold for subsequent processing.
Heap Leach: for low grade gold ores, rather than processing, ores are placed in large engineered piles (or heaps) and cyanide solutions irrigated across the surface, with the resultant gold‐rich solution from the bottom of the heap processed for the gold.
Alluvial and Placer Operations: for alluvial sedimentary gold resources, gold can be extracted by excavation and gravity‐based processing methods to extract the gold. Alluvial and placer mines were dominant in the early days of the California and eastern Australia gold rushes, but today represent a minor proportion of gold produced (e.g. Canada, New Zealand).
Although it would be easy to expect that all gold projects simply mine, crush, grind and
process ore using CIP/CIL, the reality is that process flowsheets are becoming more complex
over time, using a combination of process steps and stages to achieve the most efficient
balance between capital and operating costs and maximum recovery is more the norm (as
shown later in current gold projects) (see Longley, 2004, and later sub‐sections).

Gold resources and production: Australia in a global context
Gold Peak Minerals Case Study October 2012 ‐ Mudd et al. 18
3. GLOBAL GOLD MINING DATA
3.1. Historical gold production The production of gold was relatively minor in scale and localised to small regions in Europe
and the Middle East until the gold rushes from 1849 onwards – when gold production began
a long inexorable rise through several boom/bust cycles as new fields were discovered or
economics or technology changed.
The long‐term history of gold production is shown in Figure 6, annotated by the major
historical events of the global gold industry. All data is sourced from (ABARE, var.‐b; Govett
& Harrowell, 1982; Kelly et al., 2010; Schmitz, 1979). From 1848 to 2010, approximately
140,350 tonnes of gold has been produced, with cumulative and annual production by major
countries shown in Table 1.
Figure 6: Historical gold production by country (data updated from (Mudd, 2007a)
From Figure 6, it is clear that there are several key phases of gold mining: (i) the 1850s
western American and eastern Australia gold rushes; (ii) the 1890s South African and
Western Australian gold rushes; (iii) the 1930s Depression‐era mini‐boom, helped
significantly by surges from Canada; (iv) the 1960s surge in South Africa due to the
development of the new Carletonville, Klerksdorp, Free State and Evander fields and
innovative technologies for increasingly deep mining; and finally (v) the 1980s gold boom
facilitated by deregulation of the gold price and the development of carbon‐in‐pulp cyanide
process technology. Each of these phases have a particular major theme, such as new
discoveries, changing economics, new technology, or a combination of any or all of these
0
250
500
750
1,000
1,250
1,500
1,750
2,000
2,250
2,500
2,750
1840
1850
1860
1870
1880
1890
1900
1910
1920
1930
1940
1950
1960
1970
1980
1990
2000
2010
Go
ld P
rod
uc
tio
n (
t A
u)
United States - California
Australia - Eastern States
South Africa(Witwatersrand)
Australia -Western Australia
Gold price rise,Carbon-in-pulp developed
major world expansion of gold mining
AustraliaCanada
USA
South Africa
Rest ofthe World
2nd Boer War,South Africa

Gold resources and production: Australia in a global context
Gold Peak Minerals Case Study October 2012 ‐ Mudd et al. 19
factors. The 1980s gold boom, which in reality is still ongoing, was made possible by all of
these features – allowing world gold production to reach an all‐time historic high of 2,616 t
in 2001, and remaining around 2,500 t/year since.
Table 1: Approximate total gold production by country (1848‐2010) and 2010 production by country (data from (ABARE, var.‐a; Mudd, 2007a; USBoM, var.; USGS, var.‐a, b)
Country Cumulative
Production (t Au)
Country Production
in 2010 (t Au)§
South Africa 51,500 China 345
United States 17,400 Australia 261
Australia 12,250 USA 230
Canada 10,350 South Africa 190
China# ~4,900# Russia 190
Peru 170 World 140,350
#China data is incomplete, covering 1930 to 2010 but with several years missing (mainly late 1930s, mid‐1940s and 1950s). Production rose from 2.5 t in 1976, to 7.0 t in 1980 and surged to 52.9 t in 1981 and rose steadily to 345 t in 2010.
§Preliminary data.
Indonesia 120
Ghana 100
Canada 90
Uzbekistan 90
World ~2,500
Given the difficulty in predicting the confluence of technology, markets and exploration
discoveries, it is difficult to predict with any certainty whether new records for world gold
production can be achieved, though there are certainly some optimists.
A seismic shift in world gold production occurred in 2007 when South Africa lost its century‐
old crown of the world’s biggest gold producer to China – in many ways a sign of shifting
sands in the global mining industry. Unfortunately, data on China’s gold industry is
considered very sensitive and is not publicly available, making it impossible to compare and
contrast China’s gold industry with other countries.
3.2. Current mines and economic resources
Gold mining has occurred or continues in most regions around the world, with the ebb and
flow of the boom‐bust cycle evident wherever gold mining ensues. This section briefly
documents the major gold mines and economic resources around the world. Unfortunately,
data on China is very limited, and despite its status as the world’s biggest producer, reliable
and regular data is mainly derived from the few western companies operating in China, or
other global sources such as the USGS.

Gold resources and production: Australia in a global context
Gold Peak Minerals Case Study October 2012 ‐ Mudd et al. 20
3.2.1. Producing gold mines
A detailed compilation of major gold mines was developed for this report, shown in Table 2,
including ore type (i.e. CuAu, Au, AuCu), mine type, processing statistics, waste rock and the
principal process configuration used. Only mines producing more than 10 t/year were
included. This data represents about a third of 2010 global production of ~2,500 t, and
shows the dominance of large mines. At some projects, data is yield only, while others do
not clearly report (either in annual reports or online through websites) their process
configuration. Waste rock data is mostly reported for open cut mines (with some
exceptions), but is never reported for underground mines.
The variation in ore grades is evident, ranging from 0.38 g/t at Bingham Canyon (a Cu‐Au‐Ag‐
Mo porphyry deposit) to 24.88 g/t at Gosowong (an epithermal deposit), with most between
0.8 to 5 g/t. The average ore grade is 1.4 g/t while the average waste rock‐to‐ore ratio is at
least 2.4 (given some mines do not report waste rock data).

Gold resources and production: Australia in a global context
Gold Peak Minerals Case Study October 2012 ‐ Mudd et al. 21
Table 2: Major global gold mines producing >10 t Au/year (2010 data)
Mine Country Metals Mt ore g/t Au kg Au %Eff. Mt WR Process %OC %UG Company (%interest)
Grasberg Indonesia CuAuAg 83.122 0.92 62,822 82.15 344.956 Flotation 63 37 Freeport McMoRan82%, Rio Tinto9%, Indonesia Gov’t9%,#
Nevada Group USA Au 25.401 2.54 53,959 83.48 143.051 various† 81‡ 19‡ Newmont
Yanacocha Peru Au 59.442 0.87 45,468 87.62 105.011 HL, MC, CIP/CIL 100 Newmont51.35%, Condesa43.65%, IFC5%
Goldstrike USA Au 7.251 6.41 38,533 82.89 104.952 Autoclave, Roast, CIL
85‡ 15‡ Barrick Gold
Cortez USA Au 4.409 8.64 35,485 93.16 106.190 HL, CIL 85‡ 15‡ Barrick Gold
Veladero Argentina Au 30.697 1.51 34,863 75.29 41.875 HL, CIP/CIL 100 Barrick Gold
Vaal River Group South Africa Au 14.1 2.17 30,198 98.91 CIP, CIL 100 AngloGold Ashanti
Olimpiada Russia Au 7.377 3.77 18,162 65.36 50.035 Bio‐oxidation 100 Polyus Gold
West Wits Group South Africa Au 2.9 8.40 25,284 103.8 CIP 100 AngloGold Ashanti
Lagunas Norte Peru Au 20.006 1.34 25,129 93.95 6.644 HL, CIP/CIL 100 Barrick Gold
Lihir PNG Au 5.687 5.22 25,094 84.55 38.690 Autoclave, CIL 100 Newcrest Mining
SuperPit Australia Au 12.155 2.30 24,507 87.78 57.221 Roast, CIL 96.8 3.2 Newmont50%, Barrick Gold50%
Kupol Russia AuAg 1.163 18.04@ 22,973@ 109.5@ Gravity, CIP/CIL, MC
~50‡ ~50‡ Kinross Gold75%, Chukotka Gov’t25%
Batu Hijau Indonesia CuAu 43.375 0.65 22,921 81.13 60.112 Flotation 100 Newmont45%, Sumitomo35%, PT Pukuafu Indah20%
Tarkwa Ghana Au 23.630 0.98 22,872 98.67 112.424 HL, CIL 100 Gold Fields71.1%, IAMGold18.9%, Ghana Gov’t10%
Boddington Australia AuCu 26.619 1.03 22,641 82.70 46.071 Flotation, CIP 100 Newmont
Driefontein South Africa Au 6.084 3.6 22,076 100.8 CIP 100 Gold Fields
Telfer Australia AuCu 22.944 1.06 21,165 87.27 24.721 Flotation, Gravity, CIP
74.5 25.5 Newcrest Mining
Kumtor Kyrgyz Rep. Au 5.594 4.02 17,659 78.53 110.872 Flotation, CIL 100 Centerra Gold
Kloof South Africa Au 4.299 4.1 17,624 99.99 CIP 100 Gold Fields
Porgera PNG Au 5.201 3.77 16,990 86.64 28.425 CIP 85‡ 15‡ Barrick Gold95%, PNG Gov’t5%
Newmont Africa Africa Au 7.595 2.64 16,950 84.54 35.194 CIL 100 Newmont
Ok Tedi PNG CuAu 22.191 0.97 15,129 70.28 16.6 Flotation 100 Ok Tedi Mining
Paracatu Brazil Au 42.658 0.45 15,003 78.15 Flotation, Gravity, CIL
100 Kinross Gold
St Ives Australia Au 6.649 2.19 14,553 99.80 34.145 HL, CIP 76.9 23.1 Gold Fields

Gold resources and production: Australia in a global context
Gold Peak Minerals Case Study October 2012 ‐ Mudd et al. 22
Mine Country Metals Mt ore g/t Au kg Au %Eff. Mt WR Process %OC %UG Company (%interest)
Bingham Canyon USA CuAuAgMo 53.551 0.38 14,493 71.22 Flotation 100 Rio Tinto
Gosowong Indonesia Au 0.579 24.88 13,763 95.54 CIL, MC 100 Newcrest Mining
Rosebel Suriname Au 12.832 1.1 12,938 91.66 39.455 Gravity, CIL 100 IAMGold95%
Alumbrera Argentina CuAu 37.428 0.46 12,603 73.20 60.123 Flotation 100 Xstrata50%, Goldcorp37.5%, Yamana Gold12.5%
Sunrise Dam Australia Au 3.617 3.40 12,313 100.0 15.309 Gravity, CIL 85.7 14.3 AngloGold Ashanti
Beatrix South Africa Au 3.051 4.0 12,188 99.87 Gravity, ILR, CIL 100 Gold Fields
Pogo§ USA Au 0.875 ~16§ 12,100 ~86§ Gravity, CIP 100 Sumitomo
Cadia Hill Australia Au 17.512 0.82 11,621 81.00 5.627 Flotation, Gravity 100 Newcrest Mining
Round Mountain USA Au 30.348 0.50 11,479 75.65 26.521 HL, Gravity, CIP/CIL
100 Barrick Gold50%, Kinross50%
Geita Tanzania Au 4.7 2.36 11,103 100.1 CIL 100 AngloGold Ashanti
Fort Knox USA Au 25.735 0.79 10,877 53.50 HL, Gravity, CIP 100 Kinross Gold
AGA Mineração Brazil Au 1.6 7.21 10,512 91.12 HL, Roast, CIP/CIL 100 AngloGold Ashanti
Jundee Australia Au 1.581 7.20 10,419 91.52 CIP/CIL 100 Newmont
Totals 684.4 1.40 824.5 t ~87.8 »1,625 #Grasberg is a joint venture between Freeport McMoRan Copper & Gold, Rio Tinto and the Indonesian Government, with the interests varying each year depending on where ore is sourced from and processed. †Newmont’s Nevada Group operates 14 mills, using a mix of roasters,
autoclaves, flotation and CIP‐CIL processing. ‡Open cut/underground split based on reported resources (actual mining data not reported). @Kinross only report in ‘gold equivalent’ ounces (gold plus ‘equivalent value’ in silver production), hence the approximate data and excessive
recovery – based on reserve‐resource data, gold and silver grades are about 10 and 135 g/t, respectively (a ratio of 1:13.5 gold:silver). §2010 data not yet reported, values approximated based on 2007‐2009 data. WR – waste rock; HL – heap leach; MC – Merrill Crowe; CIP/CIL – carbon‐in‐
pulp/leach; ILR – intensive leach reactor. Red‐bold text is yield only, blue‐bold text is assumed (data in both cases is not reported). This table is extensive but not exhaustive, as some countries and companies do not report (e.g. China). Further process configuration from (Adams, 2005;
Adams & Wills, 2005).

Gold resources and production: Australia in a global context
Gold Peak Minerals Case Study October 2012 ‐ Mudd et al. 23
A surprising outcome is the variability in process configurations adopted. That is, there are
many mines still using gravity steps, as well as some using flotation to produce a gold
concentrate that is then either leached or roasted. For large copper‐gold projects the
principal step remains flotation only with the gold later recovered during smelting. At some
projects, the use of more specialised process technology, such as autoclaves, roasters or bio‐
oxidation, is critical and often means the difference between a profitable project or no mine.
While carbon‐in‐pulp or carbon‐in‐leach remains the dominant process technology, it is
increasingly being used in conjunction with a more comprehensive approach to process
design and linked to ore characteristics.
3.2.2. Economic gold resources
The US Geological Survey publishes a compilation of world gold reserves through their
annual Mineral Commodities Summary report (USGS, var.‐a), and shown in Table 3. These
assessments, however, are very coarse, and, commonly, the data may not change for several
years or more. In addition, if one compares the national resource estimates from federal
agencies in Canada and Australia, there are invariably significant differences from the USGS
data. For example, in 2008 the USGS report Canadian reserves as 2,000 t compared to the
official estimate by Natural Resources Canada of 947 t (NRC, var.). Similarly, the USGS report
2008 Australian reserves as 5,000 t yet Geoscience Australia report economically
demonstrated gold resources (equivalent to the USGS reserves category) as 6,255 t (GA,
var.). An interesting contrast is China, where production in 2010 was estimated to be 345 t
yet reserves are only 1,900 – given the scale of China’s gold industry and their favourable
geological endowment, it is hard to believe the value of 1,900 t. For comparison, the 2002
edition of the USGS Mineral Commodities Summary states China’s gold reserves as 1,000 t
and a further reserves base of 4,300 t, values which remained similar up until 2009 (noting
that the USGS stopped using the reserves base category from 2010). Therefore, for this
report, all principal data will rely on national estimates or detailed compilation of company
reported mineral resources based on statutory codes (e.g. JORC, SAMREC, NI43‐101) as this
is more direct, and appears to be more reliable, than USGS reserves data.
Table 3: USGS 2010 gold reserves by country (t Au) (USGS, var.‐a)
Country Reserves Country Reserves
Australia 7,300 China 1,900
South Africa 6,000 Uzbekistan 1,700
Russia 5,000 Mexico 1,400
Chile 3,400 Ghana 1,400
Indonesia 3,000 Papua New Guinea 1,200
USA 3,000 Canada 990
Brazil 2,400 Rest of the World 10,000
Peru 2,000
World 51,000

Gold resources and production: Australia in a global context
Gold Peak Minerals Case Study October 2012 ‐ Mudd et al. 24
The majority of gold mining companies are publicly listed on their respective national stock
exchange, with some listed in dual jurisdictions, leading to the ready abundance of data on
economic gold resources in countries such as Australia, Canada, South Africa and the USA, or
countries where these companies operate. Unfortunately, countries such as China and
Russia and their respective companies, in general, do not publicly report mineral resource
data in the same manner (though Russia is rapidly catching up), and this remains a key gap in
any global analysis of gold mineral resources.
Recent economic geology research by (Schodde, 2010) has shown that, at least in the
western world, the amount of gold discovered each year is generally declining despite
surging exploration budgets, shown in Figure 7. This is also resulting in a major long‐term
rise in the discovery cost of gold, related to the maturity of major fields, the need to explore
deeper as well as declining ore grades (or resource quality)
Figure 7: Historical western world gold discovery and exploration expenditure (MinEx Consulting best estimates) (Schodde, 2010)
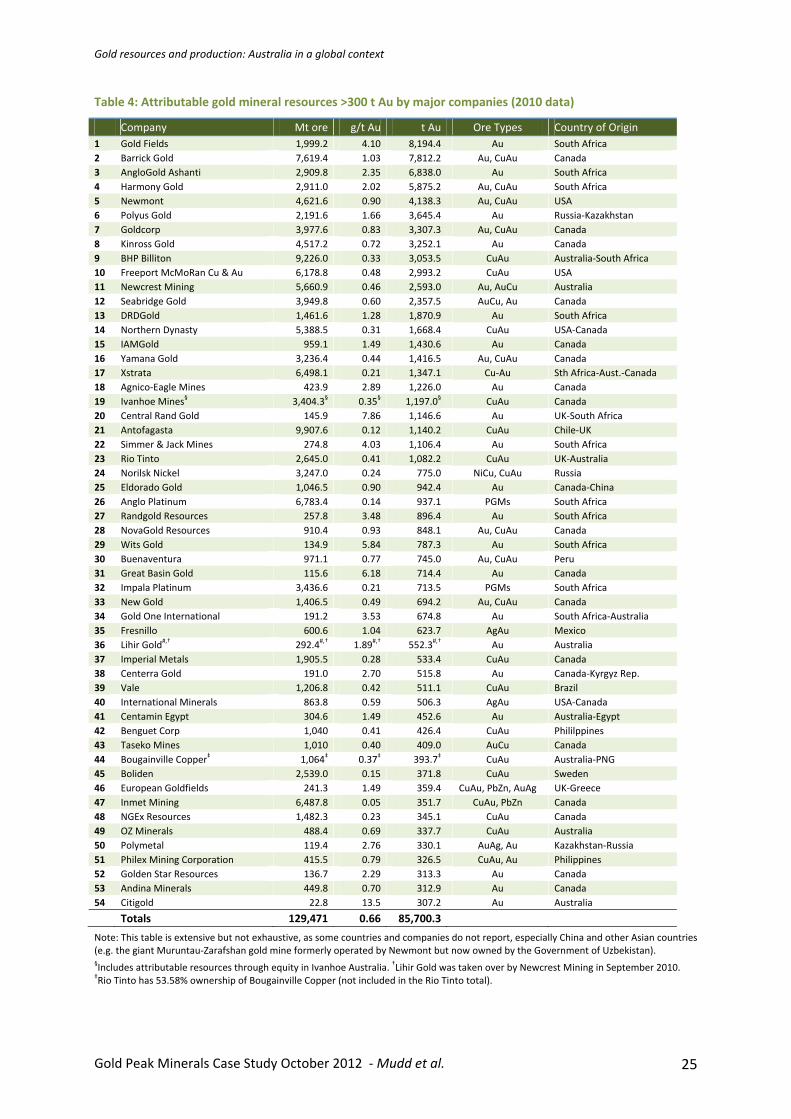
A detailed compilation of total gold mineral resources attributable to the largest gold
companies was compiled and is shown in Table 4, only showing those which report greater
than 300 t contained gold.
Gold resources and production: Australia in a global context
Gold Peak Minerals Case Study October 2012 ‐ Mudd et al. 25
Table 4: Attributable gold mineral resources >300 t Au by major companies (2010 data)
Company Mt ore g/t Au t Au Ore Types Country of Origin
1 Gold Fields 1,999.2 4.10 8,194.4 Au South Africa
2 Barrick Gold 7,619.4 1.03 7,812.2 Au, CuAu Canada
3 AngloGold Ashanti 2,909.8 2.35 6,838.0 Au South Africa
4 Harmony Gold 2,911.0 2.02 5,875.2 Au, CuAu South Africa
5 Newmont 4,621.6 0.90 4,138.3 Au, CuAu USA
6 Polyus Gold 2,191.6 1.66 3,645.4 Au Russia‐Kazakhstan
7 Goldcorp 3,977.6 0.83 3,307.3 Au, CuAu Canada
8 Kinross Gold 4,517.2 0.72 3,252.1 Au Canada
9 BHP Billiton 9,226.0 0.33 3,053.5 CuAu Australia‐South Africa
10 Freeport McMoRan Cu & Au 6,178.8 0.48 2,993.2 CuAu USA
11 Newcrest Mining 5,660.9 0.46 2,593.0 Au, AuCu Australia
12 Seabridge Gold 3,949.8 0.60 2,357.5 AuCu, Au Canada
13 DRDGold 1,461.6 1.28 1,870.9 Au South Africa
14 Northern Dynasty 5,388.5 0.31 1,668.4 CuAu USA‐Canada
15 IAMGold 959.1 1.49 1,430.6 Au Canada
16 Yamana Gold 3,236.4 0.44 1,416.5 Au, CuAu Canada
17 Xstrata 6,498.1 0.21 1,347.1 Cu‐Au Sth Africa‐Aust.‐Canada
18 Agnico‐Eagle Mines 423.9 2.89 1,226.0 Au Canada
19 Ivanhoe Mines§ 3,404.3
§ 0.35
§ 1,197.0
§ CuAu Canada
20 Central Rand Gold 145.9 7.86 1,146.6 Au UK‐South Africa
21 Antofagasta 9,907.6 0.12 1,140.2 CuAu Chile‐UK
22 Simmer & Jack Mines 274.8 4.03 1,106.4 Au South Africa
23 Rio Tinto 2,645.0 0.41 1,082.2 CuAu UK‐Australia
24 Norilsk Nickel 3,247.0 0.24 775.0 NiCu, CuAu Russia
25 Eldorado Gold 1,046.5 0.90 942.4 Au Canada‐China
26 Anglo Platinum 6,783.4 0.14 937.1 PGMs South Africa
27 Randgold Resources 257.8 3.48 896.4 Au South Africa
28 NovaGold Resources 910.4 0.93 848.1 Au, CuAu Canada
29 Wits Gold 134.9 5.84 787.3 Au South Africa
30 Buenaventura 971.1 0.77 745.0 Au, CuAu Peru
31 Great Basin Gold 115.6 6.18 714.4 Au Canada
32 Impala Platinum 3,436.6 0.21 713.5 PGMs South Africa
33 New Gold 1,406.5 0.49 694.2 Au, CuAu Canada
34 Gold One International 191.2 3.53 674.8 Au South Africa‐Australia
35 Fresnillo 600.6 1.04 623.7 AgAu Mexico
36 Lihir Gold#,† 292.4
#,† 1.89
#,† 552.3
#,† Au Australia
37 Imperial Metals 1,905.5 0.28 533.4 CuAu Canada
38 Centerra Gold 191.0 2.70 515.8 Au Canada‐Kyrgyz Rep.
39 Vale 1,206.8 0.42 511.1 CuAu Brazil
40 International Minerals 863.8 0.59 506.3 AgAu USA‐Canada
41 Centamin Egypt 304.6 1.49 452.6 Au Australia‐Egypt
42 Benguet Corp 1,040 0.41 426.4 CuAu Phililppines
43 Taseko Mines 1,010 0.40 409.0 AuCu Canada
44 Bougainville Copper‡ 1,064
‡ 0.37
‡ 393.7
‡ CuAu Australia‐PNG
45 Boliden 2,539.0 0.15 371.8 CuAu Sweden
46 European Goldfields 241.3 1.49 359.4 CuAu, PbZn, AuAg UK‐Greece
47 Inmet Mining 6,487.8 0.05 351.7 CuAu, PbZn Canada
48 NGEx Resources 1,482.3 0.23 345.1 CuAu Canada
49 OZ Minerals 488.4 0.69 337.7 CuAu Australia
50 Polymetal 119.4 2.76 330.1 AuAg, Au Kazakhstan‐Russia
51 Philex Mining Corporation 415.5 0.79 326.5 CuAu, Au Philippines
52 Golden Star Resources 136.7 2.29 313.3 Au Canada
53 Andina Minerals 449.8 0.70 312.9 Au Canada
54 Citigold 22.8 13.5 307.2 Au Australia
Totals 129,471 0.66 85,700.3
Note: This table is extensive but not exhaustive, as some countries and companies do not report, especially China and other Asian countries (e.g. the giant Muruntau‐Zarafshan gold mine formerly operated by Newmont but now owned by the Government of Uzbekistan). §Includes attributable resources through equity in Ivanhoe Australia.
†Lihir Gold was taken over by Newcrest Mining in September 2010.
‡Rio Tinto has 53.58% ownership of Bougainville Copper (not included in the Rio Tinto total).

Gold resources and production: Australia in a global context
Gold Peak Minerals Case Study October 2012 ‐ Mudd et al. 26
Table 4 (above) shows that South African gold companies remain dominant in controlling
world gold resources, even though the production is no longer centred in South Africa. Other
major gold companies are mainly from Australia and Canada, with only single companies
listed from Russia, Brazil, Sweden and Peru.
An important point to note about Table 4 is that the resources for some companies are
based almost entirely on one super‐giant deposit, such as Olympic Dam for BHP Billiton, Oyu
Tolgoi for Ivanhoe Mines or Grasberg for Freeport McMoRan – which are all copper‐gold
resources, a clearly dominant ore type in Table 4.
Although South Africa has lost the crown of world’s biggest gold producer, and appears to be
a clear case of a post‐peak gold producer (see (Hartnady, 2009), the reality is more subtle
and complex. Although there are certainly inherent geologic and mining limits for gold in
South Africa, it appears that in the post‐Apartheid era, the bigger factors are social and
environmental issues (e.g. (McCarthy, 2010) and currency exchange rates – since gold is
often sold in US$ but costs incurred in South African Rand.
To further illustrate the complexity, a brief analysis has been conducted of reported gold
resources for South Africa. Almost all gold producers in South Africa are members of the
Chamber of Mines of South Africa (CMSA), with CMSA reporting economic ore reserves
every quarter for almost the past decade (CMSA, var.). This data is shown in Figure 8
(below), and demonstrates the general decline in contained gold in ore reserves, albeit with
some major fluctuations (presumably due to changing economic conditions) – ore grade,
however, of fresh reserves has remained relatively constant at close to 6 g/t while ore grade
for tailings has gradually declined (again, presumably related to improving economics). In
general, ore reserves only represent those areas of a mine ready for extraction and do not
include additional mineral resources, which would substantially increase the amount of gold
from that shown.
Figure 8: Gold ore reserves for Chambers of Mines of South Africa members (CMSA, var.)
Note: the sudden increase in tailings grades 2005‐2007 are most likely due to poor economics leading to higher grades for reserves.
0
500
1,000
1,500
2,000
2,500
3,000
3,500
4,000
2003 2005 2007 2009 2011
Go
ld R
eser
ves
(t A
u)
Reserves - Ore (t Au)
Reserves - Tailings (t Au)
0
1
2
3
4
5
6
7
8
2003 2005 2007 2009 2011
Ore
Gra
de
(g/t
)
Ore Grade -Reserves (g/t)
Ore Grade - Tailings (g/t)

Gold resources and production: Australia in a global context
Gold Peak Minerals Case Study October 2012 ‐ Mudd et al. 27
In contrast, a compilation of the total gold mineral resources reported by four major South
African gold companies shows a different picture. For Gold Fields, Harmony Gold, AngloGold
Ashanti and DRDGold, all ore reserves and mineral resources for their operations in South
Africa were compiled, shown in Figure 9 (below).
Figure 9: Gold mineral resources over time of four major South African gold companies
Note: all data derived from respective company annual reports.
The data in Figure 9 (above) demonstrates that there are still substantial gold resources
remaining in South Africa at reasonable ore grades, with substantial amounts of low grade
tailings also becoming increasingly economic to reprocess. The total mass of tailings from
the Witwatersrand field is approximately 6.3 billion tonnes (Gt) (data updated from (Mudd,
2007a), and based on various tailings reprocessing projects, if one assumes a typical average
grade of 0.25 g/t, this gives some 1,575 t alone – or more than 6‐fold reported tailings
reserves from (CMSA, var.) but still substantially less than fresh ore reserves and resources.
The gold industry of South Africa, however, has left a heavy legacy of social dislocation from
the Apartheid era as well as major and growing environmental impacts from acid and
metalliferous drainage (AMD) (McCarthy, 2010), with examples shown later in Figure 13.
Furthermore, the Witwatersrand gold reefs invariably contain low concentrations of uranium
– making the ore radioactive and raising legitimate concerns over radiation exposure issues
as well as AMD impacts (see Winde & Sandham, 2004).
Given the apparently terminal decline of the Witwatersrand gold industry, it is becoming
increasingly difficult for government, community and industry to develop a viable strategy to
address the gravity and long‐term cumulative nature of the impacts. Thus the key challenges
for South Africa are not so much the remaining gold resource base, but the best way forward
to balance immediate and long‐term economic and social needs with environmental
remediation of past practices and legacies.
0
4,000
8,000
12,000
16,000
20,000
24,000
28,000
2000 2002 2004 2006 2008 2010
Go
ld R
eser
ves
or
Res
ou
rces
(t
Au
)
AngloGold Ashanti
Harmony Gold
Gold Fields
DRDGold
0
2
4
6
8
10
12
14
1999 2001 2003 2005 2007 2009 2011
Ore
Gra
de
(g/t
)
Gold Fields
Harmony Gold
AngloGold Ashanti
DRDGold
Gold resources and production: Australia in a global context
Gold Peak Minerals Case Study October 2012 ‐ Mudd et al. 28
3.3. Key industry trends There are a variety of key industry trends in the gold mining industry, and these are briefly
discussed below.
3.3.1. Declining ore grades
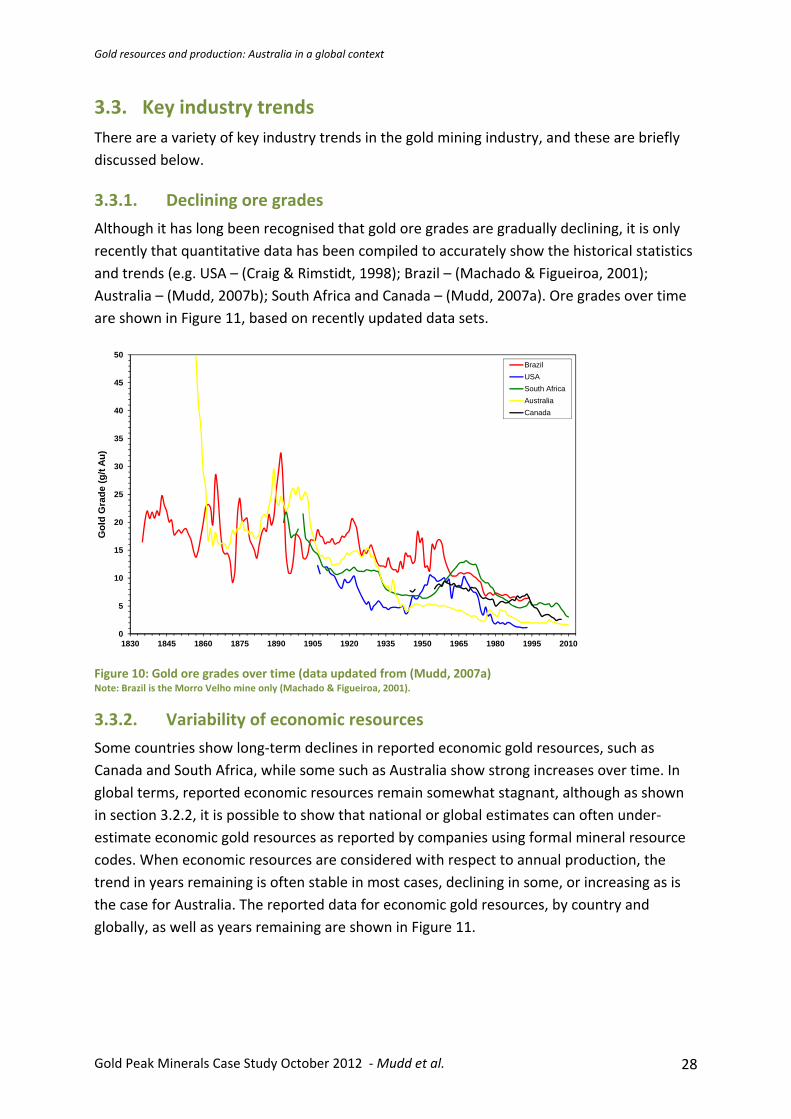
Although it has long been recognised that gold ore grades are gradually declining, it is only
recently that quantitative data has been compiled to accurately show the historical statistics
and trends (e.g. USA – (Craig & Rimstidt, 1998); Brazil – (Machado & Figueiroa, 2001);
Australia – (Mudd, 2007b); South Africa and Canada – (Mudd, 2007a). Ore grades over time
are shown in Figure 11, based on recently updated data sets.
Figure 10: Gold ore grades over time (data updated from (Mudd, 2007a) Note: Brazil is the Morro Velho mine only (Machado & Figueiroa, 2001).
3.3.2. Variability of economic resources
Some countries show long‐term declines in reported economic gold resources, such as
Canada and South Africa, while some such as Australia show strong increases over time. In
global terms, reported economic resources remain somewhat stagnant, although as shown
in section 3.2.2, it is possible to show that national or global estimates can often under‐
estimate economic gold resources as reported by companies using formal mineral resource
codes. When economic resources are considered with respect to annual production, the
trend in years remaining is often stable in most cases, declining in some, or increasing as is
the case for Australia. The reported data for economic gold resources, by country and
globally, as well as years remaining are shown in Figure 11.
0
5
10
15
20
25
30
35
40
45
50
1830 1845 1860 1875 1890 1905 1920 1935 1950 1965 1980 1995 2010
Go
ld G
rad
e (g
/t A
u)
Brazil
USA
South Africa
Australia
Canada

Gold resources and production: Australia in a global context
Gold Peak Minerals Case Study October 2012 ‐ Mudd et al. 29
Figure 11: Economic gold resources for some countries (left) and years remaining (right) over time (data updated from (Mudd, 2007a)
3.3.3. Increasing open cut mining and waste rock
For the mines in Table 2, ~87.4% of the ore is sourced from open cut mines, with a minimum
waste rock of 1.6 Gt (some mines do not report waste rock data). Open cut mining leads to
effectively permanent changes in land use (unless the open cut is completely backfilled), and
this represents a significant cumulative impact. In addition, the large mass of waste rock now
mined annually also requires pro‐active management and rehabilitation, and increases long‐
term environmental risks – especially if AMD risks are present. Unfortunately, there are no
long‐term data sets for the extent of open cut mining over time except for Australia
(discussed later). A moderate time period of data is reported for Canada by (NRC, var.) from
1977 to 2006, showing a steady rise from 6.4% to 75.6% of ore being sourced from open cut
mines. The available data for waste rock and waste rock‐to‐ore ratios are shown in Figure 12.
Figure 12: Minimum annual waste rock (left) and waste rock‐to‐ore ratios (right) over time (data updated from (Mudd, 2007a)
0
10
20
30
40
50
60
1940 1950 1960 1970 1980 1990 2000 2010
Eco
no
mic
Res
ou
rces
(kt
Au
)World
Australia
Canada
United States
South Africa
0
20
40
60
80
100
120
1940 1950 1960 1970 1980 1990 2000 2010
Res
ou
rces
-Pro
du
cti
on
Rat
io (
year
s)
World
Australia
Canada
United States
South Africa
0
50
100
150
200
250
300
350
400
1895 1910 1925 1940 1955 1970 1985 2000
Was
te R
oc
k (M
t)
Australia
Canada - Open Cut
Canada - Underground
United States
Papua New Guinea
0
2
4
6
8
10
12
1895 1910 1925 1940 1955 1970 1985 2000
Wa
ste
Ro
ck:O
re R
atio
Australia
Canada - Open Cut
Canada - Underground
Papua New Guinea

Gold resources and production: Australia in a global context
Gold Peak Minerals Case Study October 2012 ‐ Mudd et al. 30
3.3.4. Increasing mine depth
In some countries, near‐surface gold deposits have long been exhausted and mines have
progressively mined deeper to maintain production. This is epitomised by South Africa,
where mines now regularly operate between 2 to 4 km depth (e.g. TauTona). AngloGold
Ashanti is now looking to mine even deeper below 4 km to access an exploration target of
more than 2,000 t.
While increasing deposit depth commonly leads to underground mining, larger scale open
cut mines are being developed in some countries to facilitate profitable projects from large
deep deposits (e.g. Boddington in Australia and Yanacocha in Peru). These are often low‐
grade ores that would be uneconomic as underground mines.
3.3.5. Increasing environmental constraints
There are a number of major environmental constraints facing the gold industry globally,
and this sub‐section will only briefly examine the principal issues. Examined collectively, they
represent significant barriers to future expansion of the gold mining sector, and can
sometimes affect ongoing operations at existing mines.
Mine Waste Management: modern gold mining produces massive amounts of tailings
and waste rock that requires pro‐active planning and management. At some mines,
riverine tailings disposal is used at the Porgera and Tolukuma projects, Papua New
Guinea (PNG), and this has caused major environmental and social impacts. A small
number of mines also use marine tailings disposal, which also causes significant
ecosystem impacts – including the former Misima (PNG) and Minahasa (Indonesia) gold
mines, as well as operating mines at Lihir (PNG), Simberi (PNG) and Batu Hijau
(Indonesia). In developed countries (such as Australia, Canada, USA), environmental
regulators have significant influence over mining operations but there are often major
concerns raised by local communities over issues such as dust, noise, groundwater
impacts and the like. With declining ore grades globally, mine waste management will
continue to be a pivotal issue in the ongoing viability and scale of the gold mining sector.
Water Resources: gold mining consumes a significant quantity of water, and its
increasing scale also links to catchment impacts on water resources. In arid or semi‐arid
regions of the world, especially South Africa, Australia and the USA, the security of
water supplies can be a constraint or even barrier to project development.
Land Use: although most gold mining occurs in brownfields regions (where there is a
history of previous mining), increasingly new projects are being examined or developed
in areas of high conservation or cultural value. Many communities believe that there is
no compatibility between gold mining in such areas, and this often leads to major social
controversy. As such, land use policies can constrain or even prohibit gold mining.
Greenhouse Gas Emissions: gold mining is energy intensive, with the primary sources
being diesel for trucks and electricity for the process plant. This means that gold leads to
significant greenhouse gas emissions, principally carbon dioxide (CO2). For a mine with
Gold resources and production: Australia in a global context
Gold Peak Minerals Case Study October 2012 ‐ Mudd et al. 31
an ore grade of 3.5 g/t Au, Norgate and Haque (2012) estimated that the carbon
intensity would be about 18,000 t CO2/t Au. Given the global need to reduce emissions
to limit the long‐term impacts of climate change, many countries around the world have
enacted policies to either tax emissions or establish a cap‐and‐trade system for
emissions. There is a clear need for the gold sector to address fuel sources, such as the
switch from diesel to biodiesel, as well as low emissions renewable energy sources for
electricity.
Chemicals: the use of cyanide is extensive in large‐scale gold mining, while mercury is
widely used in artisanal or small‐scale mining. Due to major tailings dam failures, which
led to extensive cyanide contamination of rivers (e.g. Baia Mare, Romania; Omai,
Guyana), the gold sector has established the Cyanide Code to ensure that cyanide is
transported, used and managed safely. In contrast, some civil society and environmental
groups argue that cyanide should be completely banned due to its toxicity and inherent
environmental dangers.
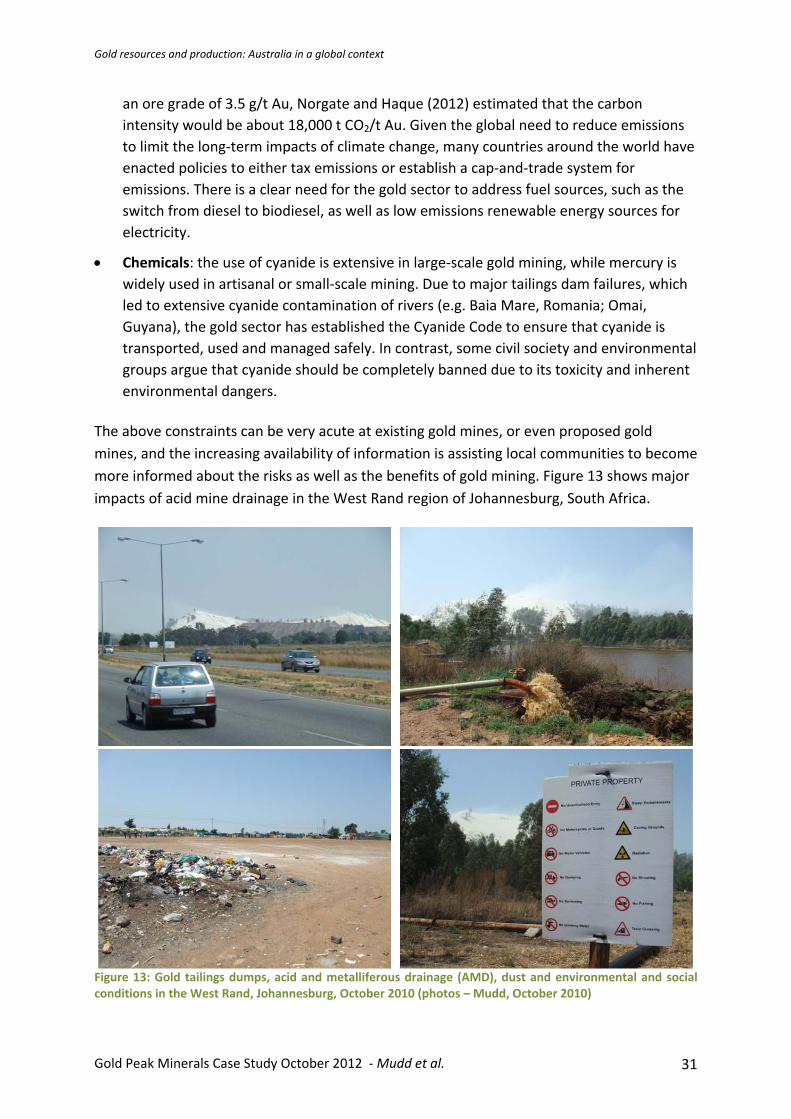
The above constraints can be very acute at existing gold mines, or even proposed gold
mines, and the increasing availability of information is assisting local communities to become
more informed about the risks as well as the benefits of gold mining. Figure 13 shows major
impacts of acid mine drainage in the West Rand region of Johannesburg, South Africa.
Figure 13: Gold tailings dumps, acid and metalliferous drainage (AMD), dust and environmental and social conditions in the West Rand, Johannesburg, October 2010 (photos – Mudd, October 2010)

Gold resources and production: Australia in a global context
Gold Peak Minerals Case Study October 2012 ‐ Mudd et al. 32
4. GOLD MINING IN AUSTRALIA
4.1. Historical Australian production
There is perhaps no other industrial endeavour that has had such a profound effect on the
Australian nation as gold – economically, socially, environmentally and politically. Although
there had been numerous observations of the presence of gold in many parts of eastern
Australia before 1850, they were not considered of any consequence by their discoverers.
The great Californian gold rush, which started in 1848, created a sudden and intense interest
in gold in Australia. In February 1851 near Bathurst, west of Sydney, gold was found in
payable quantities: Australia’s golden age had begun. Prospecting greatly accelerated and
gold was found in central Victoria by July 1851. By the end of 1851, the rush was in full swing
and gold was flowing freely throughout the Victorian and New South Wales colonies. For
many of the following decades, continuing cycles of boom and bust have characterised the
gold industry across Australia, involving wars, depressions and difficult markets. Numerous
books and monographs tell the story of the 1850’s gold rush and its progression throughout
Australia into the early 1900’s. Only a brief history is given herein for completeness in
reference to the production and resources data, thereby enabling key events to be
discerned.
The first Australian gold discovery that led to actual mining operations is believed to be the
Victoria mine (originally mined for copper), about 18 km northeast of Adelaide (Horn &
Fradd, 1986). It was discovered on 4 April 1846 but quickly proved disappointing, only
producing 0.75 kg (i.e. 24 oz). Although there were numerous other occurrences reported
around south‐east Australia by the end of 1850, like the Victoria mine, they had been of little
significance (or this was missed) and did not attract economic attention.
The principal sequence of economic gold fields being discovered and confirmed in various states is:
1851 – February – New South Wales (Ophir‐Bathurst) (Woodall, 1990);
1851 – July – Victoria (Clunes) (Annear, 1999);
1852 – August – South Australia (Echunga) (Horn & Fradd, 1986);
1852 – Tasmania (Mangana) (Nye & Blake, 1938);
1867 – Queensland (Gympie) (Parbo, 1992);
1870 – Northern Territory (Pine Creek) (Ahmad et al., 1999);
1885 – Western Australia (Kimberley) (Maitland, 1900).
The scale of the 1850’s gold rush across Australia was immense. For example, between 1851
to 1860, about 40% of world gold production came from Australia, with the majority from
Victoria and New South Wales (Campbell, 1965). Almost all of this production came from
alluvial and near surface prospecting. This led to the influx of immigrants from all over the
world to the Australian gold fields, causing a major and sustained rise in the total population.

Gold resources and production: Australia in a global context
Gold Peak Minerals Case Study October 2012 ‐ Mudd et al. 33
The fields were the centres of emerging prosperity and helped to forge many regional towns
and economic centres, many of which survived long after the fields lost their productivity.
Over the decade 1851 to 1860, Australian gold production for 1851 was 9.9 t (320,000 oz),
soared to 86.4 t in 1852 and 96.3 t in 1853 and remained stable around 80‐90 t/year until
1858. Peak production occurred in 1856 of 96.5 t.
The peak production from the easily won surface gold (alluvial) occurred in 1858 and fell
rapidly after this time, with the gold industry then shifting extraction to hard rock mines,
primarily quartz reefs (Bowen & Whiting, 1975; Raggatt, 1968). This led to the creation of
mining syndicates and companies to cope with the rapidly increasing scale and challenges of
individual mines (Fahey, 2001; Woodland, 2002).
This change allowed relatively steady gold production for a period, especially from the major
fields of central Victoria, though with increased labour and processing requirements (e.g.
batteries). At the turn of 1890, however, Queensland had caught up to Victoria, which by
then had begun a gradual decline – the Queensland surge was mainly due to the rich Mt
Morgan mine near Rockhampton (with the extensive profits later leading to the
establishment of British Petroleum or BP thanks to original Mt Morgan investor William Knox
Darcy). This early period of gold production, as well as the social benefits, also saw some
severe events such as the Eureka Stockade rebellion at the Ballarat gold field in December
1854 and anti‐Chinese riots in some places (e.g. Clunes in VIC as well as Lambing Flat and
Burrangong in NSW).
Australian gold production gradually declined towards the late 1800’s until the discovery of
the rich Coolgardie and Kalgoorlie fields in central Western Australia in 1892 and 1893,
respectively. At this time Australian production rose from around 40 t/year over 1889‐1892
to reach a new record high of 119.4 t by 1903, of which some 53.7% came from Western
Australia. By the turn of the century at 1900 all states had active gold mining and
prospecting of various scales. The then gold boom was being driven almost entirely by the
Coolgardie‐Kalgoorlie fields. In contrast to other states, the Western Australian gold rush
was characterised by a very minor amount of alluvial gold with most gold quickly being
dominated by hard rock mining and milling (e.g. see data in (WADM, var.). Over 1894 to
1896 a total of 960 new WA‐based mining and prospecting companies were floated on the
London stock exchange (Woodall & Travis, 1979).
The Western Australian rush rapidly increased Australia’s gold output to record levels by
1903, but overall Australian production began a steady decline from this time. The period of
World War 1 in Europe, from 1914 to 1918, made further progress for the gold industry
difficult. Problems facing many mines included declining ore grades, maintaining a skilled
labour supply, increased production costs and a static gold price (but declining in real terms).
This forced many mines to close by the early 1920’s (Travis & Marston, 1990).

Gold resources and production: Australia in a global context
Gold Peak Minerals Case Study October 2012 ‐ Mudd et al. 34
Australia reached a near‐historic low in production of 13.3 t in 1929 (throughout the 1920’s
production hovered around 20 t/year). A minor resurgence in gold mining began in 1932,
due to the doubling of the gold price, and reached 51.2 t in 1939, but this was not sustained
as World War 2 caused major challenges across the sector. In the 1950’s the Commonwealth
government introduced a gold mining subsidy scheme, without which several mines would
have faced premature closure (Travis & Marston, 1990). Production throughout the 1940’s
to 1970’s generally ranged between 15‐30 t/year, including another near‐historic low of 15.6
t in 1976.
The discovery of major new gold deposits (or fields) was relatively slow throughout most of
the 1900’s until the 1970’s. In 1971, geologists of BHP and Newmont discovered the large
and remote Telfer deposits in northern Western Australia (Royle, 1990). In 1980, following
up on earlier geological studies over 1976‐78 by the Western Australian Geological Survey
and Alwest Pty Ltd, Reynolds Australia Pty Ltd confirmed the surprise discovery of the large
Boddington gold deposits south‐east of Perth (El‐Ansary & Collings, 1990).
From this point forward the gold industry has sustained a remarkable turnaround. The
invention of carbon‐in‐pulp (CIP) cyanide milling technology in the USA (as well as its closely
related variant of carbon‐in‐leach or CIL) facilitated the development of large, low grade
deposits through open cut mining (or underground mining, or even both in some cases)
(Close, 2002; Huleatt & Jaques, 2005; La Brooy et al., 1994; O'Malley, 1988). This coincided
with a sustained increase in the real price of gold, which moved from some US$1,000/kg
(US$30/ounce) to reach as high as US$26,000/kg (US$800/ounce), stabilising around
US$10,000‐14,500/kg (US$300‐450/ounce) (e.g. (Kelly et al., 2010; Morgan, 1993).
These two factors combined to facilitate a major resurgence in exploration and production
across Australia, led by Western Australia but with Queensland, New South Wales and the
Northern Territory also making significant contributions. From the early 1980’s the pace of
exploration had climbed dramatically and many major new gold resources were outlined,
often simply by re‐visiting old mines and delineating the low‐grade ore around previously
mined higher grade lodes. Between 1979 and 1988 there were 16 major gold deposits
delineated which contained at least 10 t, including the Boddington‐Hedges field of south‐
west WA at 93.5 t and the Kambalda‐St Ives field at 117.9 t (Woodall, 1990).
Australian gold production in 1989 had surged to 204 t, stabilised at around 280‐310 t/year
over 1996‐2003, with a record of 313.6 t in 1997. Production throughout the 2000s has been
about 250 t/year. A significant degree of gold is now also produced as a co‐product or by‐
product, particularly with copper.
Based on known resources and projects (as reviewed in subsequent sections), the Australian
gold industry is likely to still have some decades of prosperity, though concern often surfaces
from within the gold mining sector about the longevity of resources and the relatively rapid
mining cycle for gold deposits. Table 5 shows Australian cumulative and 2010 production.

Gold resources and production: Australia in a global context
Gold Peak Minerals Case Study October 2012 ‐ Mudd et al. 35
Table 5: Cumulative Australian gold production by state, 1851‐2010, and 2010# production (t Au) (data updated from (Mudd, 2009a)
State Cumulative 2010#
Victoria 2,403.8 6
New South Wales 941.5 30
Queensland 1,408.2 16
Tasmania 214.6 4
South Australia 88.4 13
Northern Territory 566.3 11
Western Australia 6,644.7 181
Australia 12,267.5 261#Production data for 2010 is preliminary only.
Gold production over time is shown in Figure 13(a), including proportion by state (Figure 13(b)), and the proportion of gold production by ore type in Figure 14.
0
40
80
120
160
200
240
280
320
185
1
185
6
186
1
186
6
187
1
187
6
188
1
188
6
189
1
189
6
190
1
190
6
191
1
191
6
192
1
192
6
193
1
193
6
194
1
194
6
195
1
195
6
196
1
196
6
197
1
197
6
198
1
198
6
199
1
199
6
200
1
200
6
Go
ld P
rod
uct
ion
(t
Au
)
Queensland New South Wales
Victoria Tasmania
South Australia Northern Territory
Western Australia

Gold resources and production: Australia in a global context
Gold Peak Minerals Case Study October 2012 ‐ Mudd et al. 36
Figure 13: Historical Australian gold production by state (a) and by proportion (b (data updated from (Mudd, 2007b)
Figure 14: Historical Australian gold production by ore type (data updated from (Mudd, 2007b)
4.2. Current mines and economic resources
Australia has numerous operating gold mines as well as extensive resources, concentrated in
major fields in every state and the Northern Territory. Major gold mines, their configuration
and reported economic resources are analysed in detail below.
0
0.1
0.2
0.3
0.4
0.5
0.6
0.7
0.8
0.9
1
185
1
185
6
186
1
186
6
187
1
187
6
188
1
188
6
189
1
189
6
190
1
190
6
191
1
191
6
192
1
192
6
193
1
193
6
194
1
194
6
195
1
195
6
196
1
196
6
197
1
197
6
198
1
198
6
199
1
199
6
200
1
200
6
Go
ld P
rod
uct
ion
(fr
acti
on
)Western Australia Northern Territory South Australia Tasmania Victoria New South Wales Queensland
0
0.2
0.4
0.6
0.8
1
195
4
195
8
196
2
196
6
197
0
197
4
197
8
198
2
198
6
199
0
199
4
199
8
200
2
200
6
201
0
Fra
ctio
n
Miscellaneous Pb-Zn-Ag Ore Cu-Au Ore Au Ore
Gold Ore
Copper-Gold Ore

Gold resources and production: Australia in a global context
Gold Peak Minerals Case Study October 2012 ‐ Mudd et al. 37
4.2.1. Producing gold mines
A compilation of Australian gold production by mine was developed for this report and is
given in Table 6, showing a total of 61 mines. The total gold is 260.0 t, compared with
preliminary 2010 Australian production of 260 t (based on quarterly data from (ABARE, var.‐
a). Of these, only 6 mines produced more than 10 t, using mine and mill configurations
suited to extracting and processing different ore grades and types. Numerous projects do
not state their processing technology (either in annual reports or on websites), and in these
cases it has been assumed that the primary ore process stage is either CIP or CIL. It is
surprising, however, that most new gold projects are building more complex mixes of
technology in ore processing. For example, the recent re‐development of both the
Boddington and Telfer mines incorporate flotation as well as CIP/CIL technology and produce
both a gold‐copper concentrate as well as gold ore.
Figure 15: Locations of historic and operating Australian gold mines and remaining economic deposits (map generated on 7 February 2012) (GA et al., 2011)
Note: the main purpose is to show the extent of former, existing and possible future gold mines across Australia.
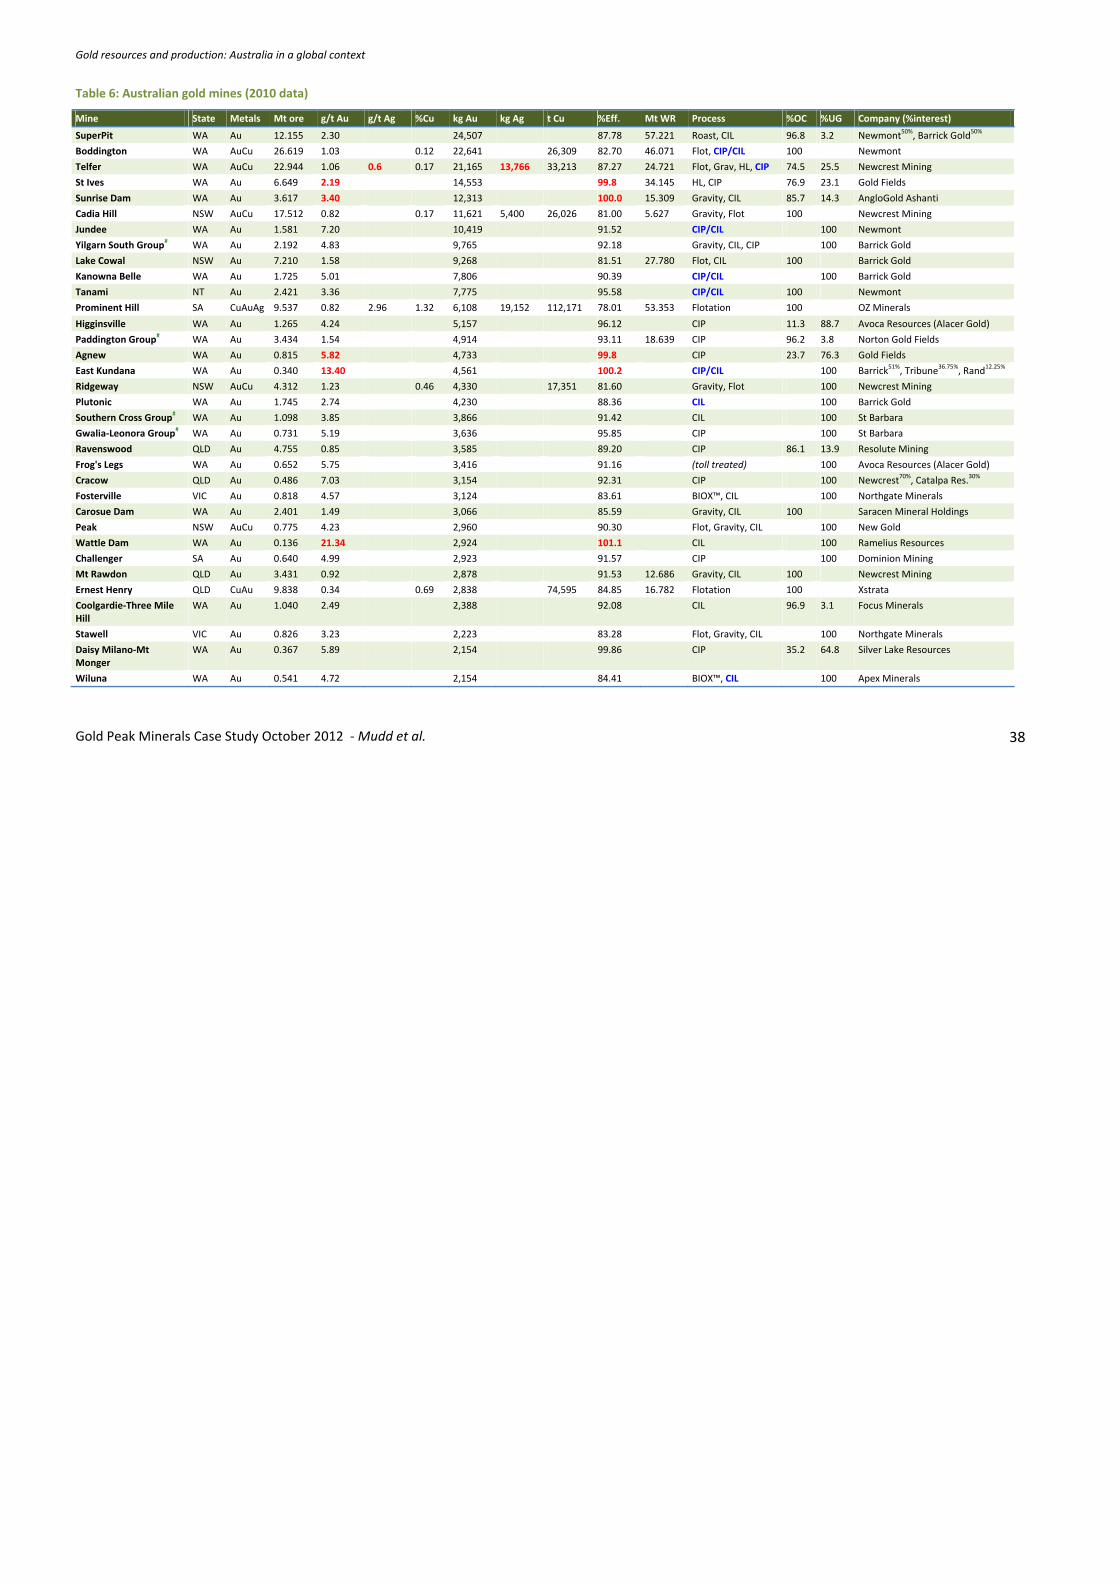
Gold resources and production: Australia in a global context
Gold Peak Minerals Case Study October 2012 ‐ Mudd et al. 38
Table 6: Australian gold mines (2010 data)
Mine State Metals Mt ore g/t Au g/t Ag %Cu kg Au kg Ag t Cu %Eff. Mt WR Process %OC %UG Company (%interest)
SuperPit WA Au 12.155 2.30 24,507 87.78 57.221 Roast, CIL 96.8 3.2 Newmont50%
, Barrick Gold50%
Boddington WA AuCu 26.619 1.03 0.12 22,641 26,309 82.70 46.071 Flot, CIP/CIL 100 Newmont
Telfer WA AuCu 22.944 1.06 0.6 0.17 21,165 13,766 33,213 87.27 24.721 Flot, Grav, HL, CIP 74.5 25.5 Newcrest Mining
St Ives WA Au 6.649 2.19 14,553 99.8 34.145 HL, CIP 76.9 23.1 Gold Fields
Sunrise Dam WA Au 3.617 3.40 12,313 100.0 15.309 Gravity, CIL 85.7 14.3 AngloGold Ashanti
Cadia Hill NSW AuCu 17.512 0.82 0.17 11,621 5,400 26,026 81.00 5.627 Gravity, Flot 100 Newcrest Mining
Jundee WA Au 1.581 7.20 10,419 91.52 CIP/CIL 100 Newmont
Yilgarn South Group# WA Au 2.192 4.83 9,765 92.18 Gravity, CIL, CIP 100 Barrick Gold
Lake Cowal NSW Au 7.210 1.58 9,268 81.51 27.780 Flot, CIL 100 Barrick Gold
Kanowna Belle WA Au 1.725 5.01 7,806 90.39 CIP/CIL 100 Barrick Gold
Tanami NT Au 2.421 3.36 7,775 95.58 CIP/CIL 100 Newmont
Prominent Hill SA CuAuAg 9.537 0.82 2.96 1.32 6,108 19,152 112,171 78.01 53.353 Flotation 100 OZ Minerals
Higginsville WA Au 1.265 4.24 5,157 96.12 CIP 11.3 88.7 Avoca Resources (Alacer Gold)
Paddington Group# WA Au 3.434 1.54 4,914 93.11 18.639 CIP 96.2 3.8 Norton Gold Fields
Agnew WA Au 0.815 5.82 4,733 99.8 CIP 23.7 76.3 Gold Fields
East Kundana WA Au 0.340 13.40 4,561 100.2 CIP/CIL 100 Barrick51%
, Tribune36.75%
, Rand12.25%
Ridgeway NSW AuCu 4.312 1.23 0.46 4,330 17,351 81.60 Gravity, Flot 100 Newcrest Mining
Plutonic WA Au 1.745 2.74 4,230 88.36 CIL 100 Barrick Gold
Southern Cross Group# WA Au 1.098 3.85 3,866 91.42 CIL 100 St Barbara
Gwalia‐Leonora Group# WA Au 0.731 5.19 3,636 95.85 CIP 100 St Barbara
Ravenswood QLD Au 4.755 0.85 3,585 89.20 CIP 86.1 13.9 Resolute Mining
Frog's Legs WA Au 0.652 5.75 3,416 91.16 (toll treated) 100 Avoca Resources (Alacer Gold)
Cracow QLD Au 0.486 7.03 3,154 92.31 CIP 100 Newcrest70%
, Catalpa Res.30%
Fosterville VIC Au 0.818 4.57 3,124 83.61 BIOX™, CIL 100 Northgate Minerals
Carosue Dam WA Au 2.401 1.49 3,066 85.59 Gravity, CIL 100 Saracen Mineral Holdings
Peak NSW AuCu 0.775 4.23 2,960 90.30 Flot, Gravity, CIL 100 New Gold
Wattle Dam WA Au 0.136 21.34 2,924 101.1 CIL 100 Ramelius Resources
Challenger SA Au 0.640 4.99 2,923 91.57 CIP 100 Dominion Mining
Mt Rawdon QLD Au 3.431 0.92 2,878 91.53 12.686 Gravity, CIL 100 Newcrest Mining
Ernest Henry QLD CuAu 9.838 0.34 0.69 2,838 74,595 84.85 16.782 Flotation 100 Xstrata
Coolgardie‐Three Mile Hill
WA Au 1.040 2.49 2,388 92.08 CIL 96.9 3.1 Focus Minerals
Stawell VIC Au 0.826 3.23 2,223 83.28 Flot, Gravity, CIL 100 Northgate Minerals
Daisy Milano‐Mt Monger
WA Au 0.367 5.89 2,154 99.86 CIP 35.2 64.8 Silver Lake Resources
Wiluna WA Au 0.541 4.72 2,154 84.41 BIOX™, CIL 100 Apex Minerals

Gold resources and production: Australia in a global context
Gold Peak Minerals Case Study October 2012 ‐ Mudd et al. 39
Mine State Metals Mt ore g/t Au g/t Ag %Cu kg Au kg Ag t Cu %Eff. Mt WR Process %OC %UG Company (%interest)
Olympic Dam SA CuAuAgU
7.046 0.54 5.01 1.88 2,128 17,634 131,800 56.00 0.564 Flot, Smelter leach 100 BHP Billiton
Northparkes NSW CuAu 5.248 0.51 0.82 2,031 39,000 75.88 Flotation 100 Rio Tinto80%
, Sumitomo20%
Paulsens WA Au 0.162 10.8 1,670 95.21 Gravity, CIL 100 Northern Star Resources
Bronzewing WA Au 1.566 1.18 1,639 88.44 12.179 Gravity, CIL 100 Navigator Resources
Central Norseman WA Au 0.383 4.37 1,616 96.45 Gravity, CIL 100 Norseman Gold
Beaconsfield TAS Au 0.296 6.16 1,487 81.49 CIL 100 Beaconsfield Gold
Pajingo QLD Au 0.262 5.69 1,401 1,698 94.15 CIL 100 Conquest Mining
Henty TAS Au 0.276 5.2 1,343 93.46 Gravity, CIL 100 Unity Mining
Western Tanami NT Au 0.220 6.26 1,322 96.03 CIP 36.5 63.5 Tanami Gold
South Kalgoorlie WA Au 0.804 1.92 1,308 84.68 CIL 100 Avoca Resources (Alacer Gold)
Edna May WA Au 1.543 0.89 1,255 91.13 CIL 100 Catalpa Resources
White Dam SA Au 2.156 0.96 1,243 59.88 3.425 HL, CIL 100 Exco Resources75%
, Polymetals25%
Bendigo‐Kangaroo Flat VIC Au 0.206 6.2 1,140 89.34 Flot., Gravity, CIL 100 Unity Mining
Golden Grove WA PbZnAgCuAu
1.597 0.71 37.0 2.37 1,129 59,169 34,291 100.0 Flotation 100 Minerals & Metals Group
Duketon‐Moolart Well WA Au 0.756 1.46 1,018 92.17 5.817 Gravity, CIP 100 Regis Resources
Rosebery TAS PbZnAgCuAu
0.725 1.72 125.0 0.38 981 78,709 2,087 78.84 Flotation 100 Minerals & Metals Group
Osborne QLD CuAu 1.026 0.89 2.33 840 22,676 91.82 Gravity, Flot. 100 Barrick Gold (#2)
Warrior‐Charters Towers
QLD Au 0.165 4.4 706 97.5 CIL 100 Citigold
Sandstone/Tuckabianna WA Au 0.317 1.90 564 93.88 0.745 Gravity, CIP 100 Troy Resources
Mt Morgans WA Au 0.134 4.33 558 96.21 Gravity Intense Leach
98.3 1.7 Range River Gold
Mt Lyell TAS CuAuAg 2.120 0.3 3 1.21 382 3,816 60.00 Flotation 100 Vedanta Resources
Laverton‐Brightstar WA Au 0.225 1.67 340 90.81 CIP/CIL 100 A1 Minerals
Comet Vale WA Au 0.021 12.91 265 96.20 MC (soon to be CIP) 100 Reed Resources
Leonora (Nav.) WA Au 0.114 2.17 225 90.79 Gravity, CIL 100 Navigator Resources
Mt Garnet Group QLD PbZnAgCuAu
0.957 0.29 22.9 2.03 106 14,800 17,773 38.77 3.025 Flotation 6.6 93.4 Kagara Zinc
Angas SA PbZnAgCuAu
0.392 0.35 28.2 0.23 95 7,699 145 70.00 Flotation 100 Terramin Australia
Cadia East NSW AuCu 0.079 0.79 0.36 51 240 81.87 Gravity, Flot. 100 Newcrest Mining
Totals 183.4 1.60 260.0 t 221.8 t 538 kt ~88.6 »338.1§ 72.3 27.7
#This is a group of mines and/or mills, with production data reported collectively as one unit.
§Not all waste rock is reported, hence the 338 Mt is a minimum. WR – waste rock; Flot – flotation; Grav – gravity; HL – heap
leach; MC – Merrill Crowe; CIP/CIL – carbon‐in‐pulp/leach. Red‐bold text is yield only, blue‐bold text is assumed (data in both cases is not reported).

Gold resources and production data: Australia in a global context
Gold Peak Minerals Case Study October 2012 ‐ Mudd et al. 40
4.2.2. Economic gold resources
An annual assessment of Australia’s economic and sub‐economic gold resources is published
by Geoscience Australia (GA, var.), with data from 1975 to 2009 and shown in Figure 16
(below). Date for 1955 is from BCGLO(1956), while data for 1960 comes from McLeod
(1998). In general, this data illustrates that there is a clear long‐term trend of increasing
resources, demonstrating success in exploration and mine development.
Figure 16: Long‐term trends in Australia’s economic and sub‐economic gold resources
A key feature of the trends in resources is the increasing dominance by a few major
resources, especially the super‐giants such as Olympic Dam and the Cadia Valley group
(Cadia Hill, Ridgeway, Cadia East). As shown by (Schodde, 2010), the growth in Australia’s
economic resources over the past decade has come entirely from Olympic Dam and the
Cadia Valley group. This suggests that a peak in exploration success may be occurring,
whereby most sites are only replacing gold mined. The reality is more complex, however,
since major new deposits are being discovered (the prime example being Tropicana) as well
as further work to shift sub‐economic to economic resources (e.g. Boddington, Telfer).
Figure 17: Australia’s economic gold resources and the influence of the Olympic Dam and Cadia Valley projects (Schodde, 2010)
0
2
4
6
8
10
12
14
1950 1960 1970 1980 1990 2000 2010
Go
ld R
eso
urc
es (
kt A
u)
Economic Resources
Sub-Economic andEconomic Resources

Gold resources and production data: Australia in a global context
Gold Peak Minerals Case Study October 2012 ‐ Mudd et al. 41
A detailed compilation of Australia’s individual economic gold resources reported by various
companies has been undertaken for 2010. A total of 320 deposits were compiled, with some
including numerous small deposits as one combined resource, while others include several
large deposits which are reported separately (and often mined separately also). Metals
extracted at the site (e.g. Au, Au‐Cu) have been used as a further classification. The 25
largest resources are shown in Table 7, combined resources by metals extracted in Table 8,
and number of deposits by state and resources in Table 9. The grade‐tonnage relationships
are shown in Figure 19 and cumulative frequency by tonnage and ore grade in Figure 20.
Table 7: Top 25 Australian gold resources (2010 data)
Mine State Status Metals Mt ore g/t Au t Au Company (%interest)
Olympic Dam SA Operating CuUAuAg 9,226 0.33 3,053.5 BHP Billiton
Cadia East NSW Operating AuCu 2,347 0.44 1,032.7 Newcrest
Boddington WA Operating AuCu 1,531.2 0.59 899.1 Newmont
Telfer Main Dome WA Operating AuCu 369 0.88 324.7 Newcrest
Superpit WA Operating Au 215.7 1.47 316.6 Barrick50%
, Newmont50%
Warrior‐Charters Towers QLD Operating Au 22.75 13.5 307.2 Citigold
Mt Todd‐Batman/Quigleys NT Care & Maint. Au 300.1 0.81 244.0 Vista Gold Corp.
Prominent Hill SA Operating CuAuAg 285.4 0.79 225.9 OZ Minerals
Sunrise Dam WA Operating Au 90.21 2.43 219.2 Anglo Gold Ashanti
St Ives Group WA Operating Au 81.3 2.6 211.4 Gold Fields
Paddington Group WA Operating Au 103.8 1.73 179.6 Norton Gold Fields
Cadia Hill NSW Operating AuCu 408 0.42 171.4 Newcrest
Telfer West Dome WA Operating AuCu 247 0.65 160.6 Newcrest
South Kalgoorlie WA Operating Au 68.72 2.0 137.4 Alacer Gold
Lake Cowal NSW Operating Au 118.9 1.15 136.7 Barrick
Mt Elliott QLD Deposit CuAu 570 0.24 135.0 Ivanhoe Australia
Agnew Group WA Operating Au 26.8 4.7 126.0 Gold Fields
Gwalia‐Leonora Group WA Operating Au 20.85 5.99 125.0 St Barbara
Tanami NT Operating Au 23.1 5.16 119.3 Newmont
Central Norseman WA Operating Au 21.51 5.40 116.1 Norseman Gold
Carrapateena SA Deposit CuUAuAg 203 0.56 113.7 OZ Minerals
Ridgeway NSW Operating AuCu 155 0.73 113.2 Newcrest
Carosue Dam Group WA Operating Au 62.75 1.6 100.4 Saracen Mineral Holdings
Northparkes NSW Operating CuAu 365 0.27 99.7 Rio Tinto80%
, Sumitomo20%
Lindsay's WA Deposit Au 32.90 2.90 95.4 Carrick Gold
Totals 16,896 0.52 8.763.7
Table 8: Australian gold resources by primary metals (320 deposits, 2010 data)
Ore Type Number Mt ore g/t Au t Au
Au 212 2,938.0 1.97 5,798.1
AuAg 3 18.9 0.59 11.1
AuCu 13 5,242.8 0.56 2,923.4
Au‐misc. 6 18.8 2.52 47.4
CuAu±Ag 40 3,001.4 0.34 1,014.2
CuAu±misc. 6 245.7 0.27 67.0
CuUAu±Ag 2 9,278.0 0.33 3,017.7
NiCuPGMsAu 3 44.2 0.25 11.1
PbZnAgCuAu 32 306.4 0.57 173.9
Sb‐Au 3 7.8 5.44 42.5
Totals 320 21,102 0.62 13,106.3
The critical role of giant deposits is clear, since 45% of the 13,106 t of gold resources are contained in the Olympic Dam, Cadia Valley, Boddington and Telfer mines.

Gold resources and production data: Australia in a global context
Gold Peak Minerals Case Study October 2012 ‐ Mudd et al. 42
Figure 18: Grade‐tonnage curve for Australian gold resources (320 deposits, 2010 data)
Figure 19: Cumulative frequency curves for Australian gold resources: contained gold (left); ore grades (right) (320 deposits, 2010 data)
In comparing Australia with the world, Australia is certainly in a strong position (see Table 3
earlier) with extensive economic and sub‐economic resources, although as shown for South
Africa (Figures 8 and 9) and the world (Table 4), it is possible to show greater gold resources
than the USGS or other national data. Our extensive resource base will ensure that Australia
continues to be a major global gold producer.
0.01
0.1
1
10
100
0.01 0.1 1 10 100 1000 10000
Ore
Gra
de
(g/t
)
Mt Ore
Au
Au-Ag
Au-Cu
Au-misc.
Cu-Au±Ag
Cu-Au±misc.
Cu-U-Au±Ag
Ni-Cu-PGMs-Au
Pb-Zn-Ag-Cu-Au
Sb-Au
0
25
50
75
100
0.01 0.1 1 10 100 1000 10000
Per
cen
t (c
um
ula
tive
)
t Au
0
25
50
75
100
0.01 0.1 1 10 100
Per
cen
t (c
um
ula
tive
)
g/t Au

Gold resources and production data: Australia in a global context
Gold Peak Minerals Case Study October 2012 ‐ Mudd et al. 43
Table 9: Australian gold resources by state (320 deposits, 2010 data)
Ore Type Number t Au
Queensland 53 1,408.2
New South Wales 47 941.5
Victoria 14 174.1
Tasmania 9 103.0
South Australia 18 3,552.3
Western Australia 159 5,509.9
Northern Territory 20 702.7
Totals 320 13,106.1

Gold resources and production data: Australia in a global context
Gold Peak Minerals Case Study October 2012 ‐ Mudd et al. 44
5. ISSUES AFFECTING COMPETITIVENESS
5.1. Data on key industry trends
The key industry trends affecting the gold industry in Australia are declining ore grades,
increasing mine waste (tailings and waste rock) and increasingly complex ore to process.
These trends are associated with additional environmental damage from increased
production of waste rock, and increased water and energy use when production grades and
throughputs are increased (See ABARE 2000 for further detail). Increasing greenhouse gas
emission intensity associated with these trends also presents a challenge to
competitiveness.
The following sections provide some preliminary analysis of the trends for waste rock
production in Australian mines, and water intensity, energy intensity and greenhouse gas
intensity for a global data set of gold mines, a large proportion of which are located in
Australia.
Based on previous research by (Mudd, 2007a, b), the key metrics adopted in this study will
be energy, greenhouse and water intensity. The specific metrics will be per tonne of ore
processed (i.e. MJ/t ore, kL/t ore, kg CO2/t ore) or per kilogram of gold (i.e. MJ/kg Au, kL/kg
Au, kg CO2/kg Au). The original data sets have been expanded and factors such as electricity
source and mine type included in the analysis where possible. The data set includes mines
from all over the world as well as a large fraction of Australian gold mines.
5.1.1. Waste rock production and issues (Australian mines)
An extensive historical data set was compiled by (Mudd, 2009a), which included ore grades
and mine waste (where available), but there is no reported data over time on whether the
ore processed is simple or more complex. Although annual tailings data are not normally
reported, given ore grades of grams per tonne, the ore milled is a clear indicator of annual
tailings generation. For waste rock, although numerous mines report data as part of normal
corporate reporting, there are some mines that do not report such data. As such, the waste
rock data is a minimum only, although it does cover most open cut mines (it is rare for
underground mines to report waste rock data). The long‐term Australian trends in ore
grades, ore milled and waste rock are shown in Figure 21.

Gold resources and production data: Australia in a global context
Gold Peak Minerals Case Study October 2012 ‐ Mudd et al. 45
Figure 21: Long‐term trends in ore grade, ore milled and (minimum) waste rock for Australia (data updated from (Mudd, 2009a) Note: many gold mines do not report waste rock data, and the data shown is therefore minimum only.
5.1.2. Water intensity and issues (global data set)
The relationship between water and gold mining is complex and highly variable, and is
further discussed in (Mudd, 2008, 2009b, 2010). To examine the relationships and possible
trends for gold mining, the data from (Mudd, 2007b) was re‐analysed, including some
additional years of data. The primary aspect added was mine type – underground, open cut
or combined (i.e. mixed), with the relationships between water intensity and ore
throughput and ore grade shown in Figure 22 (overleaf).
0
50
100
150
200
250
300
350
400
0
5
10
15
20
25
30
35
40
1850 1865 1880 1895 1910 1925 1940 1955 1970 1985 2000
Ore
Mil
led
& W
as
te R
oc
k (M
t)
Go
ld G
rad
e (g
/t)
Average Grade (g/t)
Ore Milled (Mt)
Waste Rock (Mt)
0
10
20
30
40
50
0 20 40 60 80 100 120 140
Un
it W
ate
r C
ost
(k
L/t
ore
)
Ore Throughput (Mt/year)
y = 102.69x-0.339
R² = 0.1131
0
1
2
3
4
5
6
7
0 8 16 24 32 40
Un
it W
ater
Co
st (
kL/t
ore
)
Ore Throughput (Mt/year)
Underground
Open Cut
Mixed

Gold resources and production data: Australia in a global context
Gold Peak Minerals Case Study October 2012 ‐ Mudd et al. 46
Figure 22: Water intensity of gold production – (i) unit water intensity versus ore processing scale (top); (ii) unit water intensity versus ore grade (bottom).
What this figure illustrates is that as ore grades or ore throughput decline, there is a higher
chance of having a high water‐intensity (either as kL/t ore or kL/kg Au). However, it is also
clear that there are mines that have a low water‐intensity at low grades or throughputs–
suggesting that it may be possible to achieve significant water savings.
The extent of site‐specific factors which underpin water intensity require further research,
but given declining ore grades, competing uses for water in some regions and possible risks
due to climate change, water intensity will be a growing and real issue for the gold industry.
5.1.3. Energy intensity and issues (global data set)
The relationship between energy and gold mining is complex and highly variable, and is
further discussed in (Mudd, 2009b, 2010). To examine the relationships and possible trends
for gold mining, the data from (Mudd, 2007b) was re‐analysed, including some additional
years of data. The primary aspect added was mine type – underground, open cut or
combined (i.e. mixed), with the relationships between energy intensity and ore grade shown
in Figure 23.
0
1,000
2,000
3,000
4,000
5,000
6,000
7,000
8,000
9,000
0 10 20 30 40 50
Wat
er In
ten
sity
(kL
/kg
Au
)
Ore Grade (g/t)
Missing Points:(51.4, 12.5), (53.1, 11.5), (82.4, 51.6)
0
1,000
2,000
0 10 20
Wat
er In
ten
sity
(kL
/kg
Au
)
Ore Grade (g/t)
Underground
Open Cut
Mixed

Gold resources and production data: Australia in a global context
Gold Peak Minerals Case Study October 2012 ‐ Mudd et al. 47
Figure 23: Unit energy intensity of gold production versus ore grade
Similarly to water, there is substantial scatter for all mines, although higher‐grade mines
typically have lower energy intensity. There are a range of issues with the data reported by
various companies, including total energy consumption only and not by direct and indirect
energy, and the lack of energy sources being described fully (especially by inputs such as
diesel or electricity by fuel type). Furthermore, energy intensities would be closely linked to
mine configurations, such as processing configuration, grind size, project age, mine depth
and scales, and so on.
The extent of site‐specific factors which underpin energy intensity require further research,
but given declining ore grades, and especially the intimate links between energy sources,
greenhouse gas emissions and climate change, energy intensity will be a growing and
substantial issue for the gold industry.
5.1.4. Greenhouse gas emissions intensity and issues (global data set)
The relationship between greenhouse gas emissions (GGEs) and gold mining is complex and
highly variable, and is further discussed in (Mudd, 2009b, 2010). To examine the
relationships and possible trends for gold mining, the data from (Mudd, 2007b) was re‐
analysed, including some additional years of data. The primary aspects added were mine
type and dominant electricity source (coal, gas, hydro, etc.), with the relationships between
GGEs intensity and ore grade shown in Figure 24. The relationship between energy and
GGEs intensity is shown in Figure 25.
y = 167487x-0.285
R² = 0.1962
0
100
200
300
400
500
600
700
0 10 20 30 40 50 60 70 80
Un
it E
ne
rgy
Co
ns
um
pti
on
(G
J/k
g A
u)
Ore Grade (g/t Au)
Open cut - (0.72, 1,081.2)
0
50
100
150
200
250
0 5 10 15 20
Un
it E
ne
rgy
Co
ns
um
pti
on
(G
J/k
g A
u)
Ore Grade (g/t Au)
Underground
Open Cut
Mixed
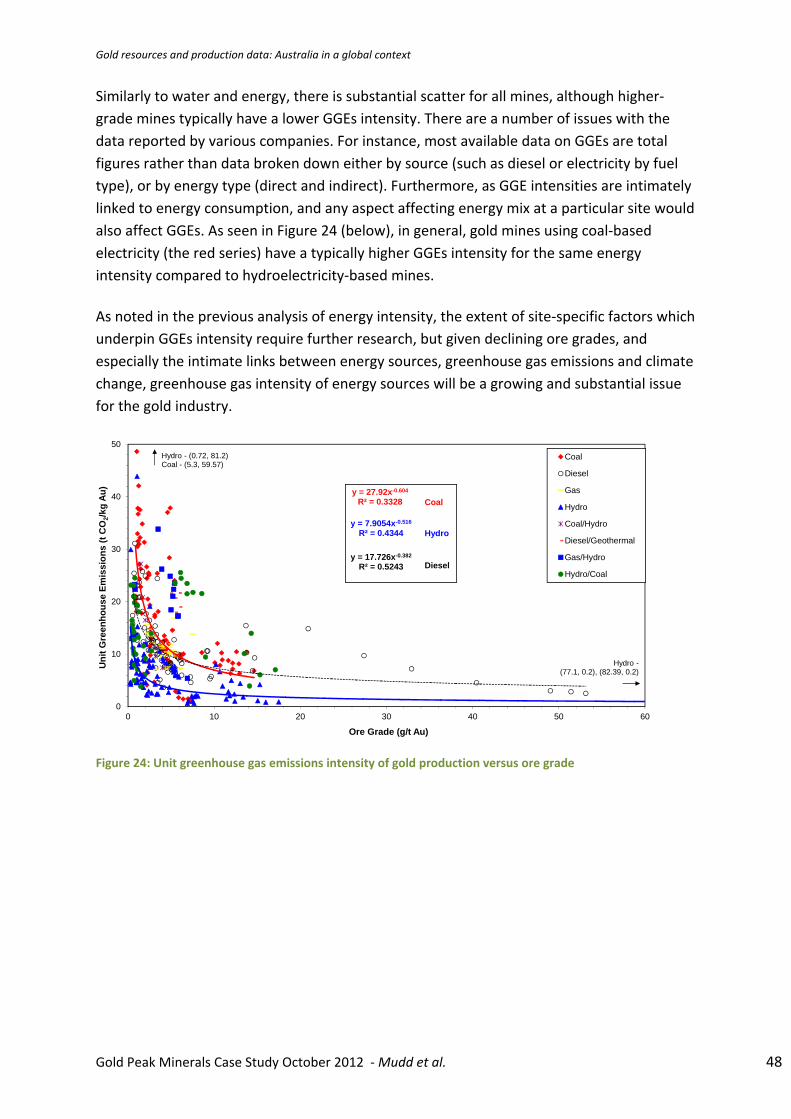
Gold resources and production data: Australia in a global context
Gold Peak Minerals Case Study October 2012 ‐ Mudd et al. 48
Similarly to water and energy, there is substantial scatter for all mines, although higher‐
grade mines typically have a lower GGEs intensity. There are a number of issues with the
data reported by various companies. For instance, most available data on GGEs are total
figures rather than data broken down either by source (such as diesel or electricity by fuel
type), or by energy type (direct and indirect). Furthermore, as GGE intensities are intimately
linked to energy consumption, and any aspect affecting energy mix at a particular site would
also affect GGEs. As seen in Figure 24 (below), in general, gold mines using coal‐based
electricity (the red series) have a typically higher GGEs intensity for the same energy
intensity compared to hydroelectricity‐based mines.
As noted in the previous analysis of energy intensity, the extent of site‐specific factors which
underpin GGEs intensity require further research, but given declining ore grades, and
especially the intimate links between energy sources, greenhouse gas emissions and climate
change, greenhouse gas intensity of energy sources will be a growing and substantial issue
for the gold industry.
Figure 24: Unit greenhouse gas emissions intensity of gold production versus ore grade
y = 27.92x-0.604
R² = 0.3328
y = 17.726x-0.382
R² = 0.5243
y = 7.9054x-0.516
R² = 0.4344
0
10
20
30
40
50
0 10 20 30 40 50 60
Un
it G
ree
nh
ou
se
Em
iss
ion
s (
t C
O2/
kg
Au
)
Ore Grade (g/t Au)
Coal
Diesel
Gas
Hydro
Coal/Hydro
Diesel/Geothermal
Gas/Hydro
Hydro/Coal
Hydro - (0.72, 81.2)Coal - (5.3, 59.57)
Hydro -(77.1, 0.2), (82.39, 0.2)
Coal
Hydro
Diesel

Gold resources and production data: Australia in a global context
Gold Peak Minerals Case Study October 2012 ‐ Mudd et al. 49
Figure 25: Unit greenhouse gas emissions intensity of gold production versus unit energy intensity
In summary, these analyses indicate that increased production will create significant
environmental and social impacts that will need to be mitigated by techniques, processes
and technologies that will make substantial rather than incremental changes to the
performance of gold mining operations. A high gold price appears to play a very important
role in justifying continued operation, under existing terms for Australian gold mining.
Additional costs for key inputs such as water and energy may increase the marginality of
these operations. In Australia, where water is the subject of conflict between state
jurisdictions as well as between different industry sectors, and communities, the need for
significantly improved performance may prove critical to the continuing viability of
operations. Similarly, the reliance of the mineral industry in Australia on fossil fuels for
stationary and transport energy creates a need for new approaches to energy use and
generation if carbon costs and energy supply issues are to be overcome.
5.2. Future considerations
5.2.1. Open cut mining and waste rock
In relation to energy issues – liquid fuels used particularly in open cut mining are a key
consideration. The volume of waste rock being moved to allow a much smaller volume of
useful ore to be extracted and processed are likely to become more problematic as the cost
of liquid fuels increases. As grades decrease, the ratio of waste to valuable rock becomes
larger; making fuel use even less productive than it might be in another application.
Additionally, the cost of the greenhouse gas emissions associated with the burning of fossil
fuels for transport applications at mining operations will be one of the first impacts of
putting a price on carbon for the majority of mining operations in Australia. Electric vehicles
are one answer to this question, however without significant changes to electricity
0
10
20
30
40
50
60
70
0 110 220 330 440 550 660
Un
it G
ree
nh
ou
se
Em
iss
ion
s (
t C
O2/
kg
Au
)
Unit Energy Consumption (GJ/kg Au)
Coal Diesel
Gas Hydro
Coal/Hydro Diesel/Geothermal
Gas/Hydro Hydro/Coal
Points excluded:(301.1, 95.01) and(288.9, 117.47)

Gold resources and production data: Australia in a global context
Gold Peak Minerals Case Study October 2012 ‐ Mudd et al. 50
generation, greenhouse gas emissions will still be a consideration. Greater use of renewable
energy at mining operations may be one way to improve performance in this area.
5.2.2. Water use
Water use is increasing but water efficient processes to reduce this are not currently well
developed. For the Western Australian mining industry, it was estimated that the mining
industry “develops 95% of its own water supplies” from groundwater and surface water
sources (75% and 25% respectively). The report uses data from a small survey4 carried out
for this study to support a figure of $700 million as the cost of water discovery and
development, and ongoing costs of approximately $100 million per annum (ECS 2004).
Overuse of water (drawing on groundwater sources faster than they can be recharged) is
described in this report, is justified on the basis that other users could not use it in existing
forms (ECS 2004), however this view does not consider non‐human users, or the indirect
ecological services provided by these low‐quality ground and surface water sources.
5.2.3. Energy use
A review of gold ore processing by (Longley, 2004) argued that combining process steps
such as gravity and/or flotation followed by cyanide leaching would lead to reduced energy
consumption, improved safety due to lower cyanide requirements and considerably less
tailings contaminated by cyanide.
For example, Newmont’s Nevada Group operations, which are based on 8 open cut and 6
underground mines and a complex of 14 mills, the proportion of refractory gold processed
has increased from 65% in 2001 to 79% in 2010 (Newmont, var.). Refractory ores, commonly
consisting of gold‐enriched sulfides, require more complex and higher cost processing
methods, thereby embedding higher unit gold production costs. This trend is closely related
to the depletion o near surface oxide ores, which are easier to process, and the increasing
proportion of deeper but more refractory sulfide ores. As such, Newmont has had to adapt
and configure their ore processing to suit these characteristics – leading to the complex
system now in place.
5.2.4. Chemical use
Hilson’s study (2006) of alternatives to cyanide use as a “reagent of choice” indicated that
these had not gained significant uptake. Candidates included Thiourea leaching of gold,
Thiocyanate, Thiosulfate leaching, Coal‐oil agglomeration and halides, which were assessed
in terms of economic and environmental criteria such as Capital outlay, Extraction costs,
Availability, Detoxification/recycling costs,Toxicity from emissions, handling and
4 24 sites, two of which were excluded due to the fact that they “obtain most water from the Water Corporation with minimal self
supply”. Projects included 7 gold mines, 6 iron ore operations, 2 nickel, 2 heavy mineral sands, one base metals and one tantalite project. The total water licences held were 185 GL/a of water of which 101 GL was used in 2003. Total use represented 51% of the allocation (Table 4). Surface water sources, including dewatering or recovery from open pits or underground operations accounted for 25% of water with 75% from bores.

Gold resources and production data: Australia in a global context
Gold Peak Minerals Case Study October 2012 ‐ Mudd et al. 51
environmental toxicity as well as “process applicability”. More recent research to develop a
thiosulfate or cyanide free process at CSIRO for in situ leach techniques in Australia are not
yet proved commercially.
5.3. Environmental reporting and responsible supply chains
The global gold industry has been at the forefront of sustainability reporting, which has
emerged in particular since the 2002 Earth Summit in Johannesburg (Mudd, 2007a, 2009b).
Sustainability reporting involves reporting against key areas of performance with respect to
social, economic and environmental aspects, and reports are often published in parallel with
traditional corporate annual reporting. The most popular protocol now used is the Global
Reporting Initiative (GRI), now in its third edition (GRI, 2006), which is combined with a
specific mining sector supplement (GRI, 2010). Notwithstanding, there are still very
significant impacts from mining as shown via the No Dirty Gold campaign (NDG, 2012).
The GRI includes a range of quantitative and qualitative indicators that enable assessments
of annual sustainability performance. For environmental aspects, the indicators include
direct and indirect energy consumption, direct and indirect greenhouse gas emissions,
water consumption, materials inputs, impacts on water resources, environmental
expenditure, spills.
Current ethical supply chain initiatives are seeking to further increase transparency in the
sector through initiatives such as Fair Trade and Fair Mined Gold (see FFG, 2012) and the
Responsible Jewellery Council (see RJC, 2012).

Gold resources and production data: Australia in a global context
Gold Peak Minerals Case Study October 2012 ‐ Mudd et al. 52
6. SUMMARY AND CONCLUSIONS Australia is currently the second largest gold producer in the world. While there are
indications that there are large amounts of gold still potentially available, the operations
that are producing the most gold are very large deposits such as Olympic Dam and Cadia
Valley. As noted earlier, growth in Australia’s economic resources over the past decade has
come entirely from these operations, however, major new deposits are still being
discovered (the prime example being Tropicana), and work to shift sub‐economic to
economic resources (e.g. Boddington, Telfer) is also being undertaken. While there has been
a decline in demand for jewellery during the 2000s, other changes to gold use, such as the
establishment of ETFs or Exchange Traded Funds, have provided a new demand for gold and
offset this decline.
This study has identified that gold production throughout the 2000s has been about 250
t/year, with a significant amount now produced as a co‐product or by‐product. Known
resources and projects (as reviewed in previous sections) indicate that the Australian gold
industry is likely to still have some decades of activity, however key industry trends affecting
the competitiveness of the Australian gold industry are declining ore grades, increasing mine
waste (tailings and waste rock) and increasingly complex ore to process.
Additional pressure on production is likely to come from increasing costs and/or reduced
access to water and energy, as well as the phasing in of a cost for greenhouse gas emissions
(although these may be felt only in terms of reduced fuel rebates). Energy costs are
increasing at the same time as energy use in total is growing. Water use is also climbing, and
this appears to be the case regardless of whether prices are high (due to increasing
throughput) or falling (due to the increased intensity of water use in improving grades).
The extent of site‐specific factors which underpin water usage, energy usage and the
emission of GGEs requires further research, and greater emphasis on reporting consistent
data. Nonethless, given declining ore grades, and especially the close links between energy
sources, water use, greenhouse gas emissions and climate change, energy intensity will be a
growing and substantial issue for the gold industry.
Finally, although it is recognised here and elsewhere, that chemical use does not necessarily
lead to environmental damage, incidents involving toxins such as mercury and cyanide do
occur. At present, technology is not making a adequate progress in addressing
environmental and economic competitiveness issues despite increasing conflict and public
discussion of environmental and social impacts of mining.
For these reasons, this study concludes that while gold prices will continue to have a
significant impact on whether gold will be mined in Australia, additional social and financial
pressure is likely to arise from environmental damage associated with maintaining existing
levels of production and attempts to significantly increase production.

Gold resources and production data: Australia in a global context
Gold Peak Minerals Case Study October 2012 ‐ Mudd et al. 53
7. REFERENCES ABARE, var.‐a, Australian Mineral Statistics, Australian Bureau of Agricultural and Resource
Economics (ABARE), Canberra, ACT, Years 1988 to 2011.
ABARE, var.‐b, Australian Commodity Statistics. Australian Bureau of Agricultural and Resource Economics (ABARE), Canberra, ACT, Years 1995 to 2010 (formerly Commodity Statistical Bulletin, 1986‐1994).
Adams, M, 2005, Summary of Gold Plants and Processes. Developments in Mineral Processing, 15 (Advances in Gold Ore Processing): pp 994‐1013.
Adams, M & Wills, B A, 2005, Special Issue ‐ Advances in Gold Ore Processing. Developments in Mineral Processing, 15 (Advances in Gold Ore Processing).
Ahmad, M, Wygralak, A S & Ferenczi, P A, 1999, Gold Deposits of the Northern Territory. NT Geological Survey, NT Department of Mines & Energy, Report 11, Darwin, NT, 101 p.
Annear, R, 1999, Nothing but Gold: The Diggers of 1852. Text Publishing, Melbourne, VIC, 329 p.
AusIMM, MCA & AIG, 2004, Australasian Code for Reporting of Exploration Results, Mineral Resources and Ore Reserves : The JORC Code. Joint Ore Reserves Committee (JORC) of The Australasian Institute of Mining and Metallurgy (AusIMM), Minerals Council of Australia (MCA) and Australian Institute of Geoscientists (AIG), Parkville, VIC, December 2004, 20 p.
BCGLO, 1956, Gold Resources of the British Commonwealth. British Commonwealth Geological Liaison Office (BCGLO), British Commonwealth of Nations Scientific Liaison Offices, London, UK, 57 p.
Bowen, K G & Whiting, R G, 1975, Gold in the Tasman Geosyncline, Victoria. In “Economic Geology of Australia and Papua New Guinea ‐ 1 : Metals”, C L Knight (Ed.), Australasian Institute of Mining & Metallurgy, Parkville, VIC, pp 647‐659.
Campbell, J D, 1953, The Structure of the Kalgoorlie Goldfield. In “Fifth Empire Mining & Metallurgical Congress : Geology of Australian Ore Deposits”, A B Edwards (Ed.), Australasian Institute of Mining & Metallurgy, Parkville, VIC, Vol. 1, pp 79‐93.
Campbell, J D, 1965, Gold Ore Deposits of Australia. In “Eighth Commonwealth Mining and Metallurgical Congress”, J McAndrew (Ed.), Australasian Institute of Mining & Metallurgy, Parkville, VIC, Vol. 1 ‐ Geology of Australian Ore Deposits, pp 31‐38.
Close, S E, 2002, The Great Gold Renaissance: The Untold Story of the Modern Australian Gold Boom 1982‐2002. Surbiton Associates Pty Ltd, Melbourne, VIC, 295 p.
CMSA, var., Quarterly Ore Reserves. Chamber of Mines of South Africa (CMSA), Johannesburg, South Africa, Quarters March 2003 to December 2010, Accessed 25 April 2011, www.bullion.org.za/content/?pid=54&pagename=Quarterly+Analysis.
Craig, J R & Rimstidt, J D, 1998, Gold Production History of the United States. Ore Geology Reviews, 13: pp 407‐464.
ECS, 2004, Water and the Western Australian Minerals and Energy Industry: Certainty of Supply for Future Growth, report prepared for the Chamber of Minerals and Energy of Western Australia by ECS, July 2004
El‐Ansary, M & Collings, P, 1990, Boddington Gold Mine. In “Geological Aspects of the Discovery of Some Important Mineral Deposits in Australia”, K R Glasson & J H Rattigan (Ed’s), Australasian Institute of Mining & Metallurgy, Parkville, VIC, Monograph 17, pp 91‐94.

Gold resources and production data: Australia in a global context
Gold Peak Minerals Case Study October 2012 ‐ Mudd et al. 54
Fahey, C, 2001, Labour and Trade Unionism in Victorian Goldmining : Bendigo, 1861‐1915. In “Gold: Forgotten Histories and Lost Objects of Australia”, I McCalman, A Cook & A Reeves (Ed’s), Cambridge University Press, Oakleigh, VIC, pp 67‐84.
FFG, 2012, Fairtrade & Fairmined Gold. www.fairgold.org.
GA, var., Australia’s Identified Mineral Resources. Geoscience Australia (GA), Canberra, ACT, Years 1992 to 2010, www.ga.gov.au.
GA, DITR & MCA, 2011, Australian Mines Atlas Online. Geoscience Australia (GA), Commonwealth Department of Industry, Tourism and Resources (DITR) and Minerals Council of Australia (MCA), Canberra, ACT, Accessed 9 August 2011, www.australianminesatlas.gov.au.
Govett, M H & Harrowell, M R, 1982, Gold : World Supply and Demand. Australian Mineral Economics Pty Ltd (AME), Sydney, NSW, December 1982.
GRI, 2006, Sustainability Reporting Guidelines. Global Reporting Initiative (GRI), Amsterdam, The Netherlands, September 2006, 44 p, www.globalreporting.org.
GRI, 2010, Sustainability Reporting Guidelines & Mining and Metals Sector Supplement. Global Reporting Initiative (GRI), Amsterdam, 55 p, www.globalreporting.org.
Hartnady, C J H, 2009, South Africa’s Gold Production and Reserves. South African Journal of Science, 105(9/10): pp 328‐329.
Heath, J A, Jeffrey, M I, Zhang, H G & Rumball, J A, 2008, Anaerobic Thiosulfate Leaching: Development of In Situ Gold Leaching Systems. Minerals Engineering, 21(6): pp 424‐433.
Hilson, G. & Monhemius, AJ, 2006, “Alternatives to cyanide in the gold mining industry: what prospects for the future?” in Journal of Cleaner Production 14 (2006): pp 1158‐1167.
Horn, C M & Fradd, W P, 1986, Gold Mining in South Australia ‐ The First Fifty Years. Geological Survey of South Australia, SA Department of Mines, Adelaide, SA, August 1986, 81 p.
Huleatt, M B & Jaques, A L, 2005, Australian Gold Exploration 1976–2003. Resources Policy, 30: pp 29‐37.
Kelly, T D, Matos, G R, Buckingham, D A, DiFrancesco, C A, Porter, K E, Berry, C, Crane, M, Goonan, T & Sznopek, J, 2010, Historical Statistics for Mineral and Material Commodities in the United States. US Geological Survey (USGS), Data Series 140 (Supersedes Open‐File Report 01‐006), Version 2010 (Online Only), Reston, Virginia, USA, Accessed 16 April 2011, minerals.usgs.gov/ds/2005/140/ (Last updated 28 Oct. 2011).
La Brooy, S R, Linge, H G & Walker, G S, 1994, Review of Gold Extraction From Ores. Minerals Engineering, 7(10): pp 1213‐1241.
Lambert, I, Meizitis, Y & McKay, A D, 2009, Australia’s National Classification System for Identified Mineral Resources and Its Relationship With Other Systems. The AusIMM Bulletin: Journal of the Australasian Institute of Mining and Metallurgy, December(No. 6): pp 52‐56.
Longley, R, 2004, Beyond CIP/CIL ‐ A Combination of Existing Technologies Utilising Gravity, Flotation and Intensive Leach May Herald the Future for Gold Ore Processing. Proc. “AusIMM Metallurgical Plant Design and Operating Strategies”, Australasian Institute of Mining & Metallurgy, Perth, WA, September 2004, 12 p.
Machado, I F & Figueiroa, S F d M, 2001, 500 Years of Mining in Brazil : A Brief Review. Resources Policy, 27: pp 9–24.
Gold resources and production data: Australia in a global context
Gold Peak Minerals Case Study October 2012 ‐ Mudd et al. 55
Maitland, A G, 1900, The Mineral Wealth of Western Australia. Western Australian Geological Survey, Bulletin No 4, Perth, WA, 150 p.
McCarthy, T S, 2010, The Impact of Acid Mine Drainage in South Africa. South African Journal of Science, 107(5/6): 7 p.
McKibben, M A, 2005, Gold. In “Encyclopedia of Geology”, R C Selley, L R M Cocks & I R Plimer (Ed’s), Elsevier, Amsterdam, Netherlands, pp 118‐127.
McLeod, I R, 1998, Historical Development of the Australian Mineral Industry. In “Year Book Australia 1998”, Australian Bureau of Statistics (ABS), Canberra, ACT, ABS Catalogue No. 1301.0.
Morgan, H M, 1993, Overview of the Australasian Gold Industry. In “Australasian Mining and Metallurgy : The Sir Maurice Mawby Memorial Volume Second Edition”, J T Woodcock & J K Hamilton (Ed’s), Australasian Institute of Mining & Metallurgy, Parkville, VIC, Monograph 19, Vol. 2, pp 801‐804.
Mudd, G M, 2007a, Global Trends in Gold Mining: Towards Quantifying Environmental and Resource Sustainability ? Resources Policy, 32(1‐2): pp 42‐56.
Mudd, G M, 2007b, Gold Mining in Australia : Linking Historical Trends to Environmental and Resource Sustainability. Environmental Science and Policy, 10(7‐8): pp 629‐644.
Mudd, G M, 2008, Sustainability Reporting and Water Resources: a Preliminary Assessment of Embodied Water and Sustainable Mining. Mine Water and the Environment, 27(3): pp 136‐144.
Mudd, G M, 2009a, The Sustainability of Mining in Australia : Key Production Trends and Their Environmental Implications for the Future. Department of Civil Engineering, Monash University and Mineral Policy Institute, Melbourne, VIC, October 2007; Revised April 2009, 277 p, users.monash.edu.au/~gmudd/sustymining.html.
Mudd, G M, 2009b, Sustainability Reporting and Mining ‐ An Assessment of the State of Play for Environmental Indicators. Proc. “SDIMI 2009 ‐ Sustainable Development Indicators in the Minerals Industry Conference”, Australasian Institute of Mining and Metallurgy, Gold Coast, Queensland, 6‐8 July 2009, pp 377‐391.
Mudd, G M, 2010, The Environmental Sustainability of Mining in Australia: Key Mega‐Trends and Looming Constraints. Resources Policy, 35(2): pp 98‐115.
Muir, D M & Aylmore, M G, 2004, Thiosulphate as an Alternative to Cyanide for Gold Processing ‐ Issues and Impediments. IMM Transactions C – Mineral Processing and Extractive Metallurgy, 113(1): pp C2‐C12.
NDG, 2012, No Dirty Gold Campaign. www.nodirtygold.org.
Newmont, var., Annual Report and Information Handbook. Newmont Mining Corporation, Denver, Colorado, USA, Years 1999 to 2010.
Norgate, T & Haque, N, 2012, Using Life Cycle Assessment to Evaluate Some Environmental Impacts of Gold Production. Journal of Cleaner Production, 29‐30: pp 53‐63
NRC, var., Canadian Minerals Yearbook. Mining Sector, Natural Resources Canada (NRC), Ottawa, Ontario, Canada, Years 1944 to 2009, www.nrcan‐rncan.gc.ca/mms‐smm/busi‐indu/cmy‐amc‐eng.htm.
Nye, P B & Blake, J B, 1938, The Geology and Mineral Deposits of Tasmania. TAS Geological Survey, TAS Department of Mines, Bulletin No 44, Hobart, TAS, 119 p.
O’Malley, G B, 1988, The Mineral Industries. In “Technology in Australia 1788‐1988 : A Condensed History of Australian Technological Innovation and Adaptation During the

Gold resources and production data: Australia in a global context
Gold Peak Minerals Case Study October 2012 ‐ Mudd et al. 56
First Two Hundred Years”, Australian Academy of Technological Sciences and Engineering, Melbourne, VIC, pp 733‐777.
Officer, L & Williamson, S H, 2010, The Price of Gold (British and USA Official Prices, London and New York Market Prices). Measuring Worth, Accessed 23 April 2011, www.measuringworth.com/gold/.
OSC, 2011, National Instrument 43‐101 ‐ Standards of Disclosure for Mineral Projects, Form 43‐101F1 and Companion Policy 43‐101CP. Ontario Securities Commission (OSC), Toronto, Canada, June 2011, 44 p.
Parbo, A, 1992, Down Under ‐ Mineral Heritage in Australasia : An Illustrated History of Mining and Metallurgy in Australia, New Zealand, Fiji and Papua New Guinea. Monograph 18, Australasian Institute of Mining & Metallurgy, Melbourne, VIC, 319 p.
PERRRC, 2008, Pan European Code for Reporting of Exploration Results, Mineral Resources and Reserves. Pan‐European Reserves‐Resources Reporting Committee (PERRRC), December 2008, 53 p.
Raggatt, H G, 1968, Mountains of Ore : Mining and Minerals in Australia. Lansdowne Press, Melbourne, VIC, 416 p.
RJC, 2012, Responsible Jewellery Council. www.responsiblejewellery.com.
Royle, D Z, 1990, An Exploration Case History in the Telfer Mine Corridor. In “Geological Aspects of the Discovery of Some Important Mineral Deposits in Australia”, K R Glasson & J H Rattigan (Ed’s), Australasian Institute of Mining & Metallurgy, Parkville, VIC, Monograph 17, pp 49‐56.
Rudnick, R L & Gao, S, 2003, Composition of the Continental Crust. In “Treatise on Geochemistry”, H D Holland & K K Turekian (Ed’s), Elsevier Pergamon, Vol. 3 of 9, Chap. 3.01, 64 p.
SAMRCWG, 2009, South African Code for the Reporting of Exploration Results, Mineral Resources and Mineral Reserves (The SAMREC Code). South African Mineral Resource Committee Working Group (SAMRCWG), The Southern African Institute of Mining and Metallurgy (SAIMM) and Geological Society of South Africa (GSSA), Johannesburg, South Africa, www.samcode.co.za, 61 p.
Schmitz, C J, 1979, World Non‐Ferrous Metal Production and Prices, 1700‐1976. Frank Cass & Co, London, UK, 432 p.
Schodde, R, 2010, The Declining Discovery Rate – What is the Real Story? Proc. “AMIRA International’s 8th Exploration Managers Conference”, AMIRA, Yarra Valley, Victoria, 22‐23 March 2010, 31 p.
Sykes, T, 1995, The Money Miners : The Great Australian Mining Boom. Reprint Edition, Allen & Unwin, Sydney, NSW, 396 p.
Travis, G A & Marston, R J, 1990, Discovery and Development of the Archaean Gold Deposits of Western Australia. In “Geological Aspects of the Discovery of Some Important Mineral Deposits in Australia”, K R Glasson & J H Rattigan (Ed’s), Australasian Institute of Mining & Metallurgy, Melbourne, VIC, Monograph 17, pp 29‐41.
USBoM, var., Minerals Yearbook. US Bureau of Mines (USBoM), USA, Years 1933 to 1993.
USEPA, 1994, Technical Resource Document ‐ Extraction and Beneficiation of Ores and Minerals : Volume 2 Gold. Special Waste Branch, Office of Solid Waste, US Environmental Protection Agency (USEPA), EPA 530‐R‐94‐013, Washington DC, USA, August 1994, 392 p.

Gold resources and production data: Australia in a global context
Gold Peak Minerals Case Study October 2012 ‐ Mudd et al. 57
USGS, var.‐a, Minerals Commodity Summaries. US Geological Survey (USGS), Reston, Virginia, USA, Years 1996 to 2011, minerals.usgs.gov/minerals/pubs/mcs/.
USGS, var.‐b, Minerals Yearbook. US Geological Survey (USGS), Reston, Virginia, USA, Years 1994 to 2009, minerals.usgs.gov/minerals/pubs/myb.html.
WADM, var., Annual Report. WA Department of Mines (WADM) (now part of the WA Department of Industry and Resources), Perth, WA, Years 1896 to 2007.
WGC, var., Gold Demand Trends Quarterly (online). World Gold Council (WGC), Years 1996 to 2011, Accessed 24 April 2012, www.gold.org/investment/statistics/demand_and_supply_statistics/.
Winde, F & Sandham, L A, 2004, Uranium Pollution of South African Streams ‐ An Overview of the Situation in Gold Areas of the Witwatersrand. GeoJournal, 61: pp 131‐149.
Woodall, R, 1990, Gold in Australia. In “Geology of the Mineral Deposits of Australia and Papua New Guinea ‐ Vol 1”, F E Hughes (Ed.), Australasian Institute of Mining & Metallurgy, Melbourne, VIC, Monograph 14, pp 45‐67.
Woodall, R & Travis, G A, 1979, Mineral Deposits of Western Australia : Gold. In “Mining in Western Australia”, R T Prider (Ed.), University of Western Australia Press, Perth, WA, pp 57‐74.
Woodland, J G, 2002, R H Bland and the Port Phillip and Colonial Gold Mining Company. M Arts Thesis, School of Historical and European Studies, La Trobe University, Bundoora, VIC, 179 p.

Gold resources and production data: Australia in a global context
Gold Peak Minerals Case Study October 2012 ‐ Mudd et al. 58
APPENDIX A
To be consistent with the Australian mining industry, this report adopts the specific Joint Ore Reserves Committee (or ‘JORC’) Code definitions (AusIMM et al., 2004). Based on the JORC Code, the analysis and reporting of ore reserves and mineral resources for the mining industry have very specific and statutory meanings:
Mineral Resources
A ‘Mineral Resource’ is a concentration or occurrence of material of intrinsic economic interest in or on the Earth’s crust in such form, quality and quantity that there are reasonable prospects for eventual economic extraction. The location, quantity, grade, geological characteristics and continuity of a Mineral Resource are known, estimated or interpreted from specific geological evidence and knowledge. Mineral Resources are subdivided, in order of increasing geological confidence, into ‘Inferred’, ‘Indicated’ and ‘Measured’ categories.
Inferred Resource: that part of a Mineral Resource for which tonnage, grade and mineral content can be estimated with a low level of confidence. It is inferred from geological evidence and assumed but not verified geological and/or grade continuity. It is based on information gathered through appropriate techniques from locations such as outcrops, trenches, pits, workings and drill holes which may be limited or of uncertain quality and reliability.
Indicated Resource: that part of a Mineral Resource for which tonnage, densities, shape, physical characteristics, grade and mineral content can be estimated with a reasonable level of confidence. It is based on exploration, sampling and testing information gathered through appropriate techniques from locations such as outcrops, trenches, pits, workings and drill holes. The locations are too widely or inappropriately spaced to confirm geological and/or grade continuity but are spaced closely enough for continuity to be assumed.
Measured Resource: that part of a Mineral Resource for which tonnage, densities, shape, physical characteristics, grade and mineral content can be estimated with a high level of confidence. It is based on detailed and reliable exploration, sampling and testing information gathered through appropriate techniques from locations such as outcrops, trenches, pits, workings and drill holes. The locations are spaced closely enough to confirm geological and grade continuity.
Ore Reserves
An ‘Ore Reserve’ is the economically mineable part of a Measured and/or Indicated Mineral Resource. It includes diluting materials and allowances for losses, which may occur when the material is mined. Appropriate assessments and studies have been carried out, and include consideration of, and modification by, realistically assumed mining, metallurgical, economic, marketing, legal, environmental, social and governmental factors. These assessments demonstrate at the time of reporting, extraction could reasonably be justified. Ore Reserves are subdivided in order of increasing confidence into ‘Probable Ore Reserves’ and ‘Proved Ore Reserves’.
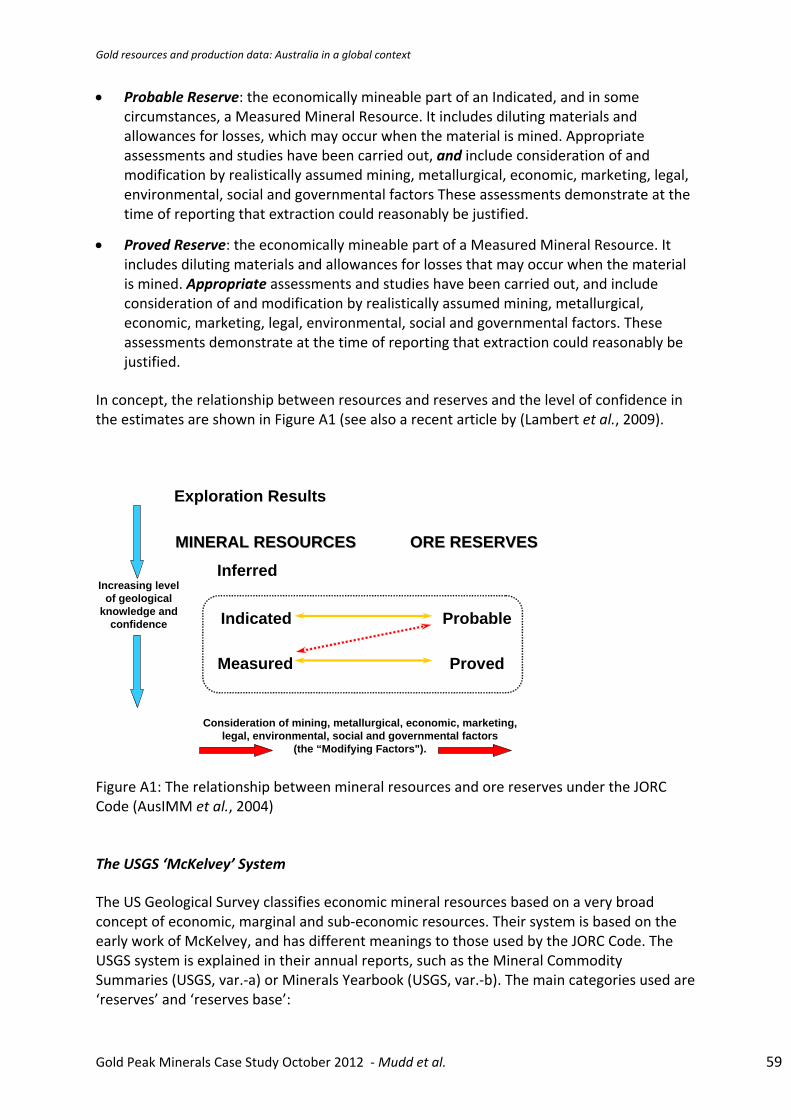
Gold resources and production data: Australia in a global context
Gold Peak Minerals Case Study October 2012 ‐ Mudd et al. 59
Probable Reserve: the economically mineable part of an Indicated, and in some circumstances, a Measured Mineral Resource. It includes diluting materials and allowances for losses, which may occur when the material is mined. Appropriate assessments and studies have been carried out, and include consideration of and modification by realistically assumed mining, metallurgical, economic, marketing, legal, environmental, social and governmental factors These assessments demonstrate at the time of reporting that extraction could reasonably be justified.
Proved Reserve: the economically mineable part of a Measured Mineral Resource. It includes diluting materials and allowances for losses that may occur when the material is mined. Appropriate assessments and studies have been carried out, and include consideration of and modification by realistically assumed mining, metallurgical, economic, marketing, legal, environmental, social and governmental factors. These assessments demonstrate at the time of reporting that extraction could reasonably be justified.
In concept, the relationship between resources and reserves and the level of confidence in the estimates are shown in Figure A1 (see also a recent article by (Lambert et al., 2009).
Figure A1: The relationship between mineral resources and ore reserves under the JORC Code (AusIMM et al., 2004)
The USGS ‘McKelvey’ System
The US Geological Survey classifies economic mineral resources based on a very broad concept of economic, marginal and sub‐economic resources. Their system is based on the early work of McKelvey, and has different meanings to those used by the JORC Code. The USGS system is explained in their annual reports, such as the Mineral Commodity Summaries (USGS, var.‐a) or Minerals Yearbook (USGS, var.‐b). The main categories used are ‘reserves’ and ‘reserves base’:
ORE RESERVESORE RESERVESMINERAL RESOURCESMINERAL RESOURCES
Probable
Proved
Exploration Results
Inferred
Indicated
Measured
Increasing levelof geological
knowledge and confidence
Consideration of mining, metallurgical, economic, marketing,legal, environmental, social and governmental factors
(the “Modifying Factors").
Gold resources and production data: Australia in a global context
Gold Peak Minerals Case Study October 2012 ‐ Mudd et al. 60
Reserves: that part of the reserve base that could be economically extracted or produced at the time of determination. The term reserves need not signify that extraction facilities are in place and operative. Reserves include only recoverable materials; thus, terms such as “extractable reserves” and “recoverable reserves” are redundant and are not a part of this classification system.
Reserves Base: that part of an identified resource that meets specified minimum physical and chemical criteria related to current mining and production practices, including those for grade, quality, thickness, and depth. The reserve base is the in‐place demonstrated (measured plus indicated) resource from which reserves are estimated. It may encompass those parts of the resources that have a reasonable potential for becoming economically available within planning horizons beyond those that assume proven technology and current economics. The reserve base includes those resources that are currently economic (reserves), marginally economic (marginal reserves), and some of those that are currently sub‐economic (sub‐economic resources). The term ‘geologic reserve’ has been applied generally to the reserve‐base category, but it also may include the inferred‐reserve‐base category; it is not a part of this classification system..
It should be noted that from 2010 the USGS stopped using the reserves base category, since this often created confusion in comparison to formal codes such as Australia’s JORC, South Africa’s SAMREC or Canada’s NI 43‐101. Furthermore, the reserves base estimates were often not updated regularly, leading to the false notion that they were static – despite exploration success, economics or technology (or other factors) leading to constant change and evolution in code‐based mineral resource estimates. This report does not make use of any reserves base data.
Use of the Terms ‘Reserves’ or ‘Resources’
To be consistent with the JORC Code (and its international siblings), this report will only use the term ‘reserves’ in the formal sense of the JORC Code – while the term resources may be used in a broader sense than the strict JORC meaning.